1. Introduction
During recent decades, the energy demand grew exponentially. The energy consumption in the building sector accounts for 40% of the whole energy demand in Europe, and this value is expected to increase due to the higher comfort levels required, if mitigation strategies are not implemented. In this context, the concept of ’nearly zero energy buildings’ (nZEBs) has been introduced and clearly defined [
1].
NZEBs should combine the use of renewable energy systems with the best available energy efficiency strategies to minimize the building energy consumption [
2]. Moreover, envelope energy requirements are minimized by employing different solutions, such as green roofs [
3], Trombe walls [
4] or direct gain systems [
5]. Glazed surfaces and shading systems, in fact, play a crucial role in minimizing the building energy requirements. Highly glazed surfaces are common in modern building design. Solar radiation, which penetrates the indoor environment through transparent surfaces, represents an energy gain during the cold months and positively contributes to the building’s energy performance growth by limiting both heating loads and the electricity consumptions for artificial lighting. Nevertheless, during the cooling season, solar radiation causes overheating by contributing to increase cooling loads and energy consumptions [
6]. In order to find a good compromise between the heating and cooling seasons, shading systems play a fundamental role in the management of solar radiation and the selection of suitable screens should take place at an early stage of the design process, since it significantly affects the energy balance of the building. An analysis carried out by Friess et al. [
7] in hot climatic conditions confirms the importance of an ’energy-optimized structure’, showing the possibility of 20% energy savings through a proper building orientation and thermal insulation while up to 55% energy savings can be obtained thanks to an appropriate glazing type and orientation. An overview of different options to decrease insolation and increase energy savings has been provided by Valladares-Rendón et al. [
8]. The authors analyzed the use of different shading devices, window-to-wall-ratios and building orientations obtaining potential energy savings ranging from 4.6% to 76.6%. An optimal window-to-wall ratio (WWR) allows to achieve 54.2% of energy savings while complex design of shading devices (SDs) can provide 66% of energy savings.
Zhang et al. [
9] investigated the building envelope optimization for low-energy buildings in low latitudes of China. The energy-saving effects of different building characteristics such as the building shape, building area, aspect ratio and WWR have been evaluated by numerical simulation, and the cooling load reduction indexes have been calculated by considering different thermal performances of the envelope and local climatic conditions. Based on the results of the analysis, horizontal shadings of 500–600 mm allow to reduce cooling energy demand by 95% if used on the southern exposure and by 15% if applied on the north facing windows.
Palmero-Marrero and Oliveira [
10] investigated the effect on the building energy demand of louver shading devices applied to the South, West and East facing windows, for different latitudes. An overview of different shading systems has been provided by Bellia et al. [
11] whereas Mandalaki et al. [
12] evaluated the energy performance of thirteen different types of fixed shading devices with integrated photovoltaic (PV) for a South oriented surface. Regarding the control aspects, Manzan [
13] used genetic optimization to analyze an external shading system for a South facing window. The author considered a flat panel, parallel to the window, and performed an optimization analysis by varying four parameters: height, width, angle and distance from the wall. The simulations show that significant energy savings could be achieved in hot climatic areas up to 30%.
Jayathissa et al. [
14] investigated the use of a dynamic integrated photovoltaic shading system to simultaneously optimize the building energy demand and the PV generation. Bellia et al. [
15] analyzed the effect of an external shading system on the energy consumption, considering both space heating, cooling and lighting.
Tsangrassoulis et al. [
16] proposed the use of a genetic algorithm to design a slat-type shading system. Rapone and Saro [
17] used a Particle Swarm Optimisation (PSO) algorithm addressed to carbon emissions minimization. Khoroshiltseva et al. [
18] carried out a multi-objective optimization analysis for a building located in Madrid to design an energy-efficient shading system. The authors considered the trade-off between the increase of the energy demand due to heating and lighting in winter and the reduction of the overheating in summer as a consequence of the shading devices.
Several studies have been performed to determine the energy savings that could be achieved thanks to an appropriate design of the shading systems. Nevertheless, only few research papers consider the visual comfort of the occupants.
Mandalaki et al. [
19] analyzed different integrated PV shading systems for Mediterranean countries, considering both energy efficiency and visual comfort.
The study developed by Xue et al. [
20] introduces a workflow for the optimization of WWR with sunshades by considering both daylighting performance and energy consumption. Weather conditions of three Chinese coastal cities are selected for testing a case building. A reference WWR is first defined based on the luminous requirements and the optimal solution is later identified according to thermal requirements, focusing particularly on the reduction of cooling loads. The results of the analysis indicate that ‘comprehensive’ sunshades offer the best energy performance, benefiting from the combined effect of horizontal and vertical overhangs.
Shan [
21] proposed a methodology based on genetic algorithms to determine the optimal shading solution to minimize the energy required for heating, cooling and lighting. Even though daylight has been considered by the author, it is used to estimate the artificial light required to reach an illuminance threshold value of 500 lux and is not considered as an objective function. Vera et al. [
22] used GenOpt to optimize a fixed exterior fenestration system considering both energy savings and visual comfort. The authors considered a fully glazed surface facing South in the locations of Montreal, Boulder and Miami and facing North in Santiago. The opaque walls, including ceiling and roof were considered adiabatic and to perform the optimization study, perforations, louver spacing and tilt angle have been varied. Nicoletti et al. [
23] proposed a control algorithm for venetian blinds to minimize the annual energy consumption, maximizing solar gains in winter and minimizing the solar radiation in summer, while ensuring a suitable level of natural lighting to guarantee the visual comfort of the occupants.
This study focuses on external fixed shading systems. External shading devices (SDs) have higher performance than internal systems [
24] while fixed SDs represent a more economical solution than dynamic systems and no manual adjustments are required.
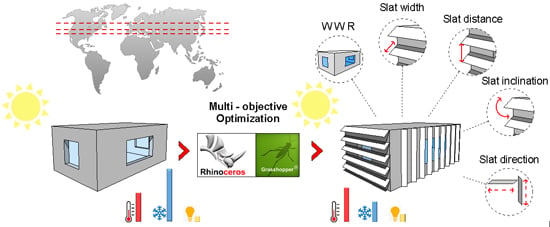
Unlike existing studies that considered an office-room bordering other air-conditioned environment and with glazed surfaces exclusively facing South, the present study faced a more complex case characterized by a larger space, with glazed surfaces on all the exposures and with all dispersing envelope components. Moreover, a parametric analysis was performed in order to investigate the variability of the shading configuration according to the climatic context. Therefore, the main goal of this study is to evaluate how the optimization of fixed solar shading systems is influenced by the climatic characteristics of the site.
Beside the energy savings, the visual comfort of the occupants is considered as objective function in the multi-objective optimization analysis. The optimization is performed not only for South facing windows but the optimal design of glazed surfaces and shading device for all façades is determined.
The shape and size of the shading system are optimized through an evolutionary algorithm developed with the Grasshopper plug-in of Rhinoceros [
25]. The aim of the optimization analysis carried out in this study is to minimize the overall energy required for air-conditioning and artificial lighting, while simultaneously maximizing the daylight. Dynamic simulations of the solar radiation and dynamic lighting simulations have been performed using the Lady-bug plug-in [
26] and the Honey-Bee plug-in [
27] of Rhinoceros. Moreover, the optimization software has been coupled with Energy Plus [
28] to evaluate the building performance and determine the thermal energy demands with real weather data.
A test-case building located in three different European cities has been considered to analyze the effect of different latitude and climatic conditions on the optimal configuration of the shading system. The selected locations are: Crotone (South Italy, latitude 39°5′), Milan (North Italy, latitude 45°28′) and Copenhagen (Denmark, latitude 55°40′).
According to the Köppen–Geiger climate classification [
29], the first site is characterized by hot and dry climate (Csa), the second is representative of hot and humid conditions (Cfa) while the third selected city is included in the temperate-humid zone (Cfb).
In
Section 2, the methodology used to carry out the multi-objective analysis for the different scenarios is described, in
Section 3 the model assumptions are discussed. The main results are highlighted in
Section 4 and discussed in
Section 5. In
Section 6, the main outcomes are summarized.
2. Methodology
The genetic optimization analysis has been performed using the Grasshopper, a Rhinoceros plug-in. By imitating natural selection and evolution, multi-objective optimization uses parameters and optimization functions to quickly explore thousands of design variations and identify the best solution. It mimics natural selection, crossover and mutation of genes. At each iteration, the best candidates from the current population are selected, by applying a selection criterion (fitness function), to populate the next generation and new candidate solutions are generated randomly by crossover and mutation rules. Iterated over many generations, the average quality of the solutions in the pool of candidates gradually increases and the population evolves toward an optimized solution that meets the design objectives within the constrained parameters.
To perform the analysis, the optimization software needs to be coupled with software tools that allow simulations of the building’s performance and that determine the thermal energy required for both heating and cooling. In this study, the dynamic simulation software Energy Plus has been selected.
This calculation engine consists of different models working together to determine building energy requirements for heating and cooling with a variety of systems and energy sources. Heat diffusion through the building components is simulated considering one-dimensional heat transfer. Construction materials properties and indoor air temperature are assumed to be constant. The heat diffusion equation is solved using the conduction transfer functions (CTF), a transient calculation method based on instantaneous energy balance usually performed on an hourly basis for each thermal zone defined in the simulation model. Further details are provided in
Section 2.1.
Moreover, to consider the visual comfort of the occupants, dynamic simulations of the solar radiation and lighting have been performed using the Lady-bug plug-in and the Honey-Bee plug-in.
The Lady-bug plug-in allows importing in Grasshopper the weather files of Energy Plus, providing the possibility to analyze the sun path, the distribution of wind speed and direction (wind rose), the solar radiation and shadows. The Honey-Bee plug-in allows the Grasshopper to interface with Open Studio [
30]. This is a platform that provides the possibility to simulate the building energy demand using Energy Plus and perform daylight analysis using DaySim [
31]. The multi-objective analysis is performed using Octopus [
32], a Grasshopper plug-in that extends the functionalities of the Galapagos for genetic algorithm optimization. A schematic diagram of the tools used to carry out the multi-objective optimization is provided in
Figure 1.
2.1. Building Air Conditioning Load
The building air conditioning load
is determined by a thermal balance on an internal air node considering the heat transfer through the envelope
and the glazed surfaces
, the infiltration
and the internal energy sources
, as clearly described by Zhang et al [
9].
and
strongly depend on the external climatic conditions.
is the area of the envelope surface j, is the convective heat transfer coefficient on the j wall internal surface, is its temperature and the indoor temperature. The surface temperature is determined by a thermal balance carried out on the structure by involving the infrared radiant exchange on the external and internal sides and the thermal flux delivered through the wall. The latter is evaluated by adopting the function transfer method exclusively for opaque surfaces with thermal mass.
The internal surface temperatures are affected also by the internal radiant field, in particular by the heat transfer through the glazed surfaces that can be determined through the following equation:
where
is the incident solar radiation,
is the glazed surface area,
is the transmission coefficient and
the absorption coefficient of the glazed surface.
is the fraction of the incident solar radiation that is absorbed and subsequently released in the indoor environment. It is worth noticing that the software considers short-wave and infrared radiative exchange separately: for the first, the definition of the internal view factors inside the conditioned cavity allows to evaluate the fraction of solar radiation that is reflected outwards through the same windowed surfaces. This fraction does not become a thermal load for the internal environment and, consequently, it is not considered for the evaluation of the building energy demand.
Usually, the solar heat gain coefficient (
) is defined, considering both the radiation directly transmitted inward and the fraction absorbed and then released.
The second term on the right-hand side of the equation considers the energy losses due to the transmittance of the glazed surface and the air temperature difference between indoor and outdoor environment at temperature Te.
can be determined based on the air flow rate
and the temperature difference between the internal and external air.
The internal energy source term, , depends on the devices used, lighting system and on activities carried out in the building space.
Energy Plus allows to consider all the described terms and accurately estimate the building thermal energy required. It has been selected for its acknowledged potential to reliably simulate buildings’ thermal behavior and accurately estimate energy performance, along with its capability of effectively integrating shading systems [
33].
Its development is funded by the U.S. Department of Energy’s (DOE) Building Technologies Office (BTO) [
34] and it is considered a well validated energy simulation engine [
20].
2.2. Optimization Algorithm
The optimization analysis performed has two objective functions:
Minimize the electrical energy requirements for heating, cooling and artificial lighting
Maximize natural lighting to fulfill the requirements for visual comfort. To this purpose, the percentage of hours, during which illuminance values of 300 lux are ensured on a working surface located at 1 m from the floor, has been determined.
Every multi-objective optimization problem can be described as a minimization problem, Equation (7).
The subscript ob represents the number of objective functions to be minimized.
Subject to the following constraints:
with
= 1, 2, …, m, where m represents the number of inequality constraints
with
= 1, 2, …, n, where n represents the number of equality constraints
Equation (11) represents the boundaries of the th variable.
One of the main difficulties in a multi-objective optimization is that often there is a trade-off between the different objectives. Hence, it is not possible to identify a single optimal solution but a pareto front, that is a set of non-dominated solutions which provides a better result for one objective but worse for the others.
The parameters used in the optimization analysis and the set of boundary conditions are described in
Section 3.
3. Model
A simplified geometry has been selected for the single zone building. The shape is rectangular, 10 × 6 m with a height of 4 m, as schematically represented in
Figure 2a. The building was located in the areas shown in
Figure 2b. In order to compare the results obtained for the different sites, the same building orientation has been considered: North–South for the largest surfaces and East–West for the smallest surfaces.
The main characteristics of the building envelope are summarized in
Table 1.
In this study, it is assumed that the building is used as an office and mainly computer-based works are carried out. The CEN EN 12464-1 [
35] ‘Light and lighting-Lighting of work places-Part 1: Indoor work places’ recommends a range of 100–300 lux for computer-based tasks. For these reasons a value of 300 lux has been considered in the present study.
The office is considered occupied from Monday to Friday and from 9 am to 18 pm. Since the heating and cooling periods depend on the climatic conditions, in order to compare the results detected across the considered locations, the same duration for the provision of heating and cooling was considered. Therefore, the analysis has been performed considering the cooling season from the 1st of June to the 30th of September and the heating period from the 15th of November to 15th of March.
Weather files from the EnergyPlus data set were used for the simulation. Source weather data formats include IWEC and IGDG data [
36,
37] representing a typical year obtained by assembling measured or modeled data, to match the long-term data from a certain location using a particular-statistical measure.
Climatic data for the city of Crotone report an external air dry bulb temperature varying between a minimum of Tmin = −2.2 °C and a maximum of Tmax = 36.4 °C; for Milan Tmin = −9.4 °C and Tmax = 33.6 °C while for Copenhagen Tmin = −9.6 °C and Tmax = 26.8 °C. The global horizontal radiation is equal to 1354.4 kWh/m2 year for Crotone, 1070.6 kWh/m2 year for Milan and 980.3 kWh/m2 year for Copenhagen.
The design temperatures for the cooling and heating seasons have been set equal to 26 and 20 °C respectively. For the artificial lighting system, two LED plafonieras with a nominal electric power of 5 W were assumed installed on the ceiling.
A parametric approach has been used, based on following assumptions:
The other geometrical properties of the slats are parametrically defined in the Grasshopper to determine the optimal design.
A schematic representation of the main geometrical properties is reported in
Figure 3.
To optimize the office building design and the shading device features, the following variables have been considered:
The window-to-wall ratio for each building façade can vary between 10% to 80%;
The slats can be arranged either in horizontal or vertical direction;
Number of slats;
Distance between two consecutive slats (pitch ‘d’) can be varied from a minimum of 400 mm to a maximum of 1200 mm;
Inclination of the slats with respect to their longitudinal axis (t) varies from −45° to +45°, with a step of 5.
The analysis is performed considering different depth (w) of the slats: 200, 400 and 600 mm.
4. Results
Preliminary simulations have been performed considering the minimum and maximum window-to-wall ratio (WWR) of 10% and 80% for all façades. These scenarios will be considered as reference cases. The energy demands have been determined, as well as the percentage of hours in which the minimum natural lighting of 300 lux on the working surface could be guaranteed.
The results obtained for Crotone are summarized in
Table 2.
It is clear that, due to the Mediterranean climatic conditions, Crotone is a cooling dominated location with negligible heating requirements. However, with the augment of the WWR, the heating demand slightly increases due to the predominance of thermal losses on solar gains.
Afterwards, the optimization analysis has been performed allowing the WWR to vary between 10% to 80% to obtain a window-to-wall ratio for each façade that guarantees the visual comfort of the occupants, maximizing the daylight, while simultaneously decreasing the annual energy demand (required for summer cooling, winter heating and artificial lighting).
Due to the trade-off between these two objectives, a unique solution is difficult to find.
Table 3 shows the best results obtained for different WWR.
It is evident that increasing the WWR, the number of hours in which the minimum lighting requirements are fulfilled also increases, at the expenses of higher cooling requirements. The results reported in
Table 3 show that solutions with the WWR above 50% on the South surface, 10% for the East surface, 30% for the West direction and 70% for the North are not recommended. Conversely, the role of the South WWR is decisive to drastically reduce cooling demands; lower WWR percentages allow to reduce the energy required for space cooling, keeping almost unvaried the daylight performance.
Considering the case with a maximum WWR of 80% for all façades, reported in
Table 2, not only the percentage of hours with more than 300 lux does not increase (86%), but also the cooling demand is considerably higher, 8277.3 instead of 6333.3 kWh. A good trade-off can be represented by a WWR of 10% for the South, East and West surface and 20% for the North direction. This solution allows the achievement of a significant reduction of the annual energy requirements of 56%, with only a 3% decrease in the number of hours with more than 300 lux.
As described in
Section 3, the fixed solar shading system has been described parametrically to allow the variation of the geometric parameters.
Table 4,
Table 5 and
Table 6 summarize the results of the optimization analysis for the considered slat depths.
The results show that the configuration with a slats depth of 600 mm is the one that allows to achieve the highest energy savings. The total thermal requirement is 2119.7 kWh, i.e., 41.6% lower compared to the value of 3634 kWh obtained for the same configuration and glazed areas without shading devices. Moreover, a minimum natural lighting of 300 lux on the work surface is ensured in 68% of the hours with a correspondent slight increase of the electrical consumption. This result is due to the shading effect provided by the larger slats that allows to reduce the cooling demand without affecting negatively the heating demand. The overall energy saving which can be obtained with an optimized building structure is 38.3% compared to the configuration with the minimum WWR and without shading devices.
Table 6 shows an increase in electricity consumption by the artificial lighting system of 10%, but it is small when compared to the achievable energy savings for the summer conditioning (with an appropriate conversion factor). It is worth mentioning the importance to install vertical slats on the North exposure to exploit daylight rationally by favoring the attainment of the required lux on the working surface, but the inclination varies significantly with the slat’s width. Furthermore, the importance of producing shadows on the glazing is demonstrated by the tilt angle ranging between 40° and 45° for the surfaces exposed to the solar radiation.
Once the optimal configuration has been determined, it was considered the possibility of integrating the shading system with photovoltaic cells in accordance with the schematic representation showed in
Figure 4. The main characteristics of the photovoltaic panels are summarized in
Table 7.
The available surface to install PV cells is 90 m2, so an annual electricity production by the renewable source of 6526 kWh is achievable, sufficient to provide the electricity required for heating, cooling and lighting (about 700 kWhe assuming an air to air electric heat pump with a mean performance index of 3).
Similar analyses have been performed for Milan and Copenhagen. The results obtained for Milan are summarized in
Table 8,
Table 9,
Table 10,
Table 11 and
Table 12.
Table 8 highlights the building performance parameters for both the minimum and maximum value of the WWR.
In this case, an evident increase in the heating demand, with a correspondent decrease of the cooling requirements, can be observed due to the continental climatic conditions. Again, for the highest WWR, the thermal losses through the transparent surfaces prevail on the increase in solar gains. The results of the multi-objective optimization analysis are reported in
Table 9 showing the best individuals of the population obtained using genetic algorithms.
To minimize the thermal energy demand, a WWR of 20% for the South, 40% for the North and 10% for the East and West surfaces are required. It is worth noting that South and North exposures affect thermal demands considerably, while the electrical consumptions for artificial lighting are only slightly affected by the window-to-wall ratio.
The results of the optimization analysis performed for the shading system are summarized in
Table 10,
Table 11 and
Table 12 considering different slats depth.
The analysis performed for Milan shows that the configuration with a slat depth of 600 mm is the one that guarantees the highest energy savings with a tilt angle of 45° for the South exposure. Conversely, by limiting the slats depth, the tilt angle decreases. This ensures a more profitable use of the solar radiation during winter but also determines an increase of the cooling demand. Additionally, in this case, a tilt angle of 40–45° for East and West exposures is recommended as well as vertical slats with negative tilt angle for the North orientation. The annual energy requirement is 2111.5 kWh, thus 40.2% lower compared to the 3531.5 kWh required for the same configuration without shading systems. Natural lighting is sufficient to maintain adequate illumination levels in 69% of the hours.
It is worth noticing that, despite the slight increase in electricity for artificial lighting, the optimized configuration with shading devices provides a more evident reduction in the annual energy requirements, highlighting the prevalent role of air-conditioning for the reduction of the overall energy consumption.
Assuming that the shading surface is covered by PV panels, the annual electricity production can be obtained. It is equal to 4851.7 kWh and it is enough to cover the energy needs for heating, cooling and the artificial lighting consumption considering the use of an electric heat pump with a mean performance index of 3 (about 700 kWhe).
Simulations and optimization analysis have been also performed for Copenhagen. In this case the energy required for heating is higher than the cooling demand, as shown in
Table 13. Nevertheless, increasing the WWR, not only the heating demand is higher due to the higher thermal losses but also the cooling demand increases. Energy demands for heating, cooling and electricity for artificial lighting are provided in
Table 13, considering a WWR of 10% and 80%.
The results of the optimization analysis are reported in
Table 14. The best individuals of the population obtained using genetic algorithms are highlighted.
To minimize the thermal energy demand, a WWR of 20% for the South and 10% for the East, North and West surfaces is required. This is due to the need of limiting the thermal losses as much as possible due to the limited availability of solar radiation that could be exploited to reduce the heating demand.
The results of the optimization analysis for the shading device carried out for Copenhagen are summarized in
Table 15,
Table 16 and
Table 17.
The analysis performed shows that even in this case the use of a slat depth of 600 mm represents the optimal configuration. It is worth noticing that the optimal angle is −10° with horizontal direction for the slats exposed toward South, in order to exploit the scarce solar radiation as much as possible. Compared to the previous cases, the analyzed location is characterized by a higher latitude and a lower solar altitude. Therefore, the described configuration allows a better exploitation of the beam solar radiation. Tilt angles of 40–45° are preferred for East and West, and vertical slats for the North exposure. In the optimal situation, the annual energy demand for air conditioning is 804.2 kWh with an energy saving of 17% compared to the 969.2 kWh required for the same configuration without shading elements. Natural daylight is worse than the prior scenarios due to the lower WWR values, however the level is sufficient to maintain an adequate illumination level in 60% of the hours.
The optimized configuration with shading devices provides a reduction in the overall energy consumption by 14.8% compared to the solution with the minimum glazed areas and no shading systems. As for all the other examined cases, the electrical consumption for artificial lighting increases by 13% but it is negligible compared to reduction in terms of thermal requirements for space cooling and heating.
Once again, assuming that the shading surface is covered by PV panels, the annual electricity production was determined. It is equal to 3741.8 kWh, i.e., enough to cover the energy needs for heating, cooling and the artificial lighting consumption assuming the use of electric heat pumps with a mean performance index of 3 (about 300 kWhe).
5. Discussion
Simulations have been performed to determine the optimal window-to-wall ratio and the optimal design of external fixed shading systems. The highest energy savings have been obtained for the locations of Crotone and Milan, characterized by a higher solar radiation and, consequently, by higher cooling requirements. Solar gains in winter, instead, are counterbalanced by a major increase of the thermal losses detected with the WWR growth. For this reason, in Copenhagen lower WWR are recommended. The main contribution of external shading devices to energy saving is due to the reduction of energy requirements for cooling. Obviously, an increase of the energy consumption for space heating is registered but the overall energy needs for both the heating and cooling seasons are significantly decreased by a percentage of 41.6% for Crotone and 40.2% for Milan. Different results have been obtained for Copenhagen, due to the different climatic conditions. While in Crotone and Milan the energy required for cooling in summer is substantial, for Copenhagen space heating represents the most critical aspect and, consequently, the optimization was carried out mainly to limit the energy consumptions during winter. Despite such a difference, a solution has been identified, that guarantees 10% energy saving.
Even though a point by point comparison with similar studies is not possible since different building layouts, construction materials, glazed surface properties, methodology, locations and climatic conditions are considered, it is anyway evident a similar trend. As highlighted by Manzan [
13], the energy savings increase in climatic areas characterized by higher levels of solar radiation and, consequently, higher energy cooling demand. As underlined by Zhang et al. [
9], the use of horizontal shadings of 500–600 mm on the southern exposure allows to significantly reduce cooling energy demand.
As far as concerning the visual comfort, satisfactory results have been obtained. As pointed out by Vera at al. [
22], different results are obtained whether the optimization analysis is performed considering both energy requirements and visual comfort or only the energy consumption criteria. In the multi-objective analysis this aspect has been considered and the solutions that would decrease as little as possible the percentage of daily hours covered by natural lighting have been selected. Even if in some cases a reduction of 15% of sunlight hours was reached, due to the presence of shading devices, the increase in electrical consumption due to artificial lighting is limited while considerable energy savings for air conditioning could be achieved.
It is worth noticing that the simulations, aimed at optimizing the glazed surfaces, have highlighted that a minimum glazed surface is preferable for the South, East and West façades, for both Crotone and Milan where the summer solar radiation is considerable. On the other hand, higher percentages of glazed surfaces are obtained for the North direction to capture only diffuse radiation. The opposite situation occurs in Copenhagen, where the WWR is higher for the South oriented surface by exploiting slats with negative tilt angle due to the lower solar elevation angle, and lower for the North to contrast thermal losses. A synoptic representation concerning the energy demand for air-conditioning and artificial lighting is provided in
Figure 5 and
Figure 6 respectively, for the considered localities, with and without the installation of the optimized shading devices. It is clear that a comparison cannot be carried out among the localities, because different envelope configurations have been obtained. Nevertheless, in Crotone the 42% of energy savings was attained by limiting exclusively the cooling demands, this is the reason why the lowest WWR is employed on the surfaces mainly exposed to the solar radiation. Moreover, the widest slats are preferred, but with a higher distance and a tilt angle of 45° for a better shading, with no significant negative impact on the daylight. Regarding the location of Milan, being higher the heating requirements, a greater WWR on the South exposure and a minimum value of WWR on East and West facades, allow a better use of winter solar gains. This effect prevails on the worsening of the cooling demand, achieving a winter energy saving of 56% that overcomes the worsening of the cooling demand (−30%). The slats’ configurations are similar to those obtained for Crotone but the energy consumptions are slightly worsened, due to the 40% WWR resulting for North facade. Finally, in Copenhagen, characterized by the most severe winter climatic conditions, it is essential to limit the WWR on the North exposure in order to reduce the thermal losses, sacrificing the daylight and obtaining double electrical consumption compared to the prior localities. A WWR of 20% with negative slats tilt angle allows to exploit solar radiation rationally, and WWR of 10% for East and West orientations allows to obtain a summer energy saving of 70% that prevails on the worsening of the winter demand (−15%).
6. Conclusions
The analysis performed in this study shows that the shading device needs to be optimized for the climatic conditions in order to find the best compromise between the heating and cooling demands, which are much higher than the energy required by the artificial lighting system. In particular, the following main findings emerged from the analysis:
The use of a 60 cm slat represents the best performing solution in all locations. This slat width allows appreciable shading effects by adjustment of the slats’ tilt angle, which limits the degree of required elements;
For surfaces oriented towards the North direction, vertical slats represent the optimal solution with different tilt angles;
For surfaces oriented towards the South, East and West direction, horizontal slats are recommended;
South oriented surfaces are very sensitive to the variations of the building location, for Crotone the optimal tilt angle is 45° while for Copenhagen it is −10°;
The glazed areas facing South increase with latitude, while on the contrary those facing North decrease in order to find the best compromise between thermal losses and solar gains;
The energy savings for air-conditioning are substantial and overcome the increase in electricity consumption for artificial lighting;
PV energy production can supply the energy demand for air conditioning and artificial lighting in all analyzed scenarios.
The study highlighted the dependence of the shielding systems on the latitude of the site, which directly affects the inclination of the slats. The relation emerged particularly for the South exposure. At high latitudes, in fact, the sun is lower on the horizon and a greater tilt angle of the slats is needed to protect from solar radiation. On the contrary, at lower latitudes, the sun is higher in the sky and the slats must be tilted slightly to obtain the shading effect. In regards to the East and West exposures, instead, no significant differences arose among the analyzed sites because for these exposures the sun is always in a low position for any latitude.
Regarding the trade-off between sun-shades and illuminance, the optimal solution is the one that allows the minimization of energy requirements of the air-conditioning and to maximize the illuminance level on the working surface. In particular, it is worth noting that in winter, screens and daylight can operate synchronously. In fact, during the heating season, it is possible to increase the transmitted solar radiation to better exploit solar gains and improve daylight, at the same time. In summer, however, the two objective functions show conflicting effects, because shielding should be used as much as possible to reduce the energy for air-conditioning and this negatively affects daylight. Conversely, to favor daylight, the sunshades should be kept as open as possible, but this increases the transmitted solar radiation, causing the overheating of the indoor ambient and worsening the air-conditioning demand.
Optimization is, therefore, essentially required due to the opposing effect between the two factors. The test case used in the analysis with glass surfaces on all exposures is aimed at stressing the impact of the cooling requirement, which has become a serious issue in the energy consumption of buildings due to exponential increases in recent years [
38].
This study reported a preliminary investigation. Future research will be aimed at obtaining correlations considering the optimal design of fixed solar shading systems according to latitude and parameters that qualify the solar radiation, as well as climatic conditions of the site.


