Abstract
The use of solar energy is an obvious choice; the energy of the sun is not only indispensable for most processes in nature but it is also a clean, abundant, sustainable, and—most importantly—universally available resource. Although the further spread of photovoltaic systems, which make use of this source of energy, is expected in the future all around the world, no comprehensive investigation has been conducted into the current situation of the small-scale photovoltaic power plants in Hungary, where this type of photovoltaic system is the most popular. By means of a case study, whose novelty lies in its focus on small-scale power plants and their complex examination, including economic and geographic indicators, this paper analyzes their status in Hungary. The study endeavors to establish the reasons for the popularity of this type of power plant and to identify some typical geographical locations with well-illustrated photovoltaic density. Residential, as well as business prosumers, were examined with the aim of learning more about the density of the small-scale photovoltaic systems and their geographical locations. Another goal was to calculate the average size of small-scale photovoltaic power plants and to gain more understanding of their economic aspects. The outcomes of this research include maps displaying the density of the small-scale photovoltaic power plants in Hungary and the results of the economic calculations for such investments.
1. Introduction
1.1. Changes in the Spreading of Photovoltaic Technology
With an increasing number of countries gaining insight into the negative impacts of climate change, the mitigation of the detrimental developments has become a global goal. One of the most crucial objectives for mankind today is to limit the increase in global temperatures to less than 2 °C measured against preindustrial ones. To achieve this, we must aim for a rise of 1.5 °C, at most [1]. Among a number of various solutions for the transformation of energy systems aiming to reach the above goals and to lessen the greenhouse effect, the utilization of variable renewable energy (VRE) has also come to the fore. Thanks to rapidly developing technology, more and more sustainable options become available, including solar energy, which has been gaining much significance recently. As an ever-increasing proportion of the Earth’s population lives in cities, it is an important development that many cities worldwide have launched their solar energy programs with a view to protecting the environment and supporting sustainable development. The use of solar energy is an obvious choice since the energy of the sun is not only indispensable for most processes in nature but it is also a resource that is clean, abundant, sustainable, and—most importantly—universally available [2,3,4,5,6,7,8,9,10]. It is a reassuring thought that the potential of solar energy reaching the surface of our planet each year is several thousand times greater than mankind’s energy demand at present. A widespread method for utilizing this energy is photovoltaic (PV) technology, which uses PV cells to transform solar radiation into electricity [11,12,13].
Several factors determine the quantity of produced PV energy, including, first of all, solar radiation, the applied technology, the temperature, the prevailing natural conditions, the composition of the specific module, and the collective effect of the installation itself and the rates of efficiency. In the map of PV power potentials in Europe, one can see that the annual amount of PV energy that can be generated averages between 700–1900 kWh/kWp according to geographical location (Figure 1). The same values for Hungary range between 1050–1250 kWh/kWp (Figure 1). Another important piece of information is that in the case of small-scale (>50 kWp) PV systems in Hungary, fixed mounting systems are mainly used instead of more advanced solutions due to financial reasons [14,15,16,17,18,19].
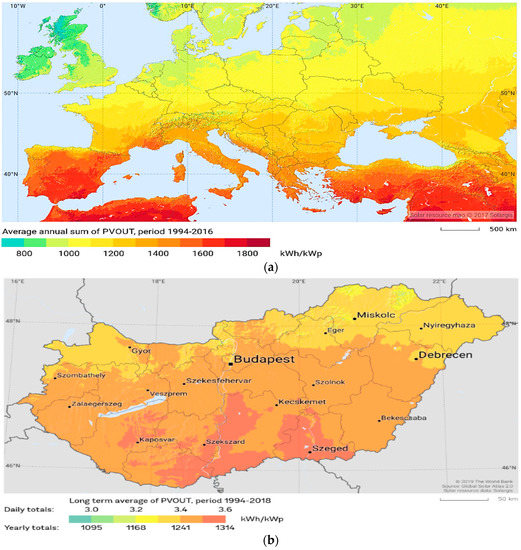
Figure 1.
The photovoltaic power potential, Europe (a) and Hungary (b) [18].
Currently, monocrystalline (m-Si), polycrystalline (p-Si), and amorphous silicon (a-Si) technologies are the most common PV technologies. With a market share of approximately 90%, crystalline solar modules are the most popular ones thanks to their high reliability. Concerning their efficiency, with p-Si and m-Si PV modules, an efficiency of up to 26.7% and 22.3% can be reached, respectively [15,20,21,22,23,24,25,26], while the efficiency of the m-Si and p-Si modules, most frequently in use, normally ranges between 10–18% in the territory of the European Union (EU) [27]. The greatest efficiency that can be achieved with a-Si photovoltaic technology, a thin-film PV technology, is 10.5% at present. However, the efficiency of the most widely used a-Si modules normally ranges from 4% to 6%. Although there is no available information on the market share of a-Si technology, the share of all thin-film solar modules amounts to circa 10%. With a price as low as 0.03–0.2 €/Wp (m-Si, p-Si: 0.2–0.3 €/Wp), a-Si technology may play a great role in the promotion of spreading PV technology in the countries of the EU [15,20,23,24,27,28,29].
The PV sector has seen a remarkable increase in the past decade thanks to a variety of measures and developments, including not only rapid advancements in technology but also new financial support schemes by governments, the feed-in-tariff, and the falling costs of investment [20,30,31]. In 2017, 26.5% of the electricity generated in the world came from renewable sources of energy, with 1.9% from PV technologies produced by a global built-in photovoltaic capacity of 402 GW. The world’s highest-ranking producers in a descending order were China (131.1 GW), the European Union (108 GW), and the United States of America (51 GW), followed by Japan (49 GW). It is a remarkable development that, with the shift in technologies, PV technology has become the most important new power capacity in China [30,32].
As for Hungary, according to the figures of the past three consecutive years, the total installed PV capacity in 2017 was approximately 0.31 GW, in 2018 0.7 GW, while at the end of December 2019, 1.3 GW, showing an increase, which was mainly due to amendments in PV regulation [33,34]. In the long run, PV systems are expected to experience a considerable increase in their spread. By 2030 the Hungarian transmission system operator predicts the integration of 2.5–6.7 GW, while by 2040, that of 4.3–12 GW from PV into the system according to three distinct scenarios [35,36,37].
1.2. Hungary’s Feed-In-Tariff System—Overview
The schemes designed to support green energy utilization show a great diversity across the various countries, which also tend to change them yearly, making it a challenging task to keep up with the latest developments [38]. The situation is further exacerbated by the fact that the available information is often untrustworthy because it is not up-to-date. This is also true for Hungary, from which a summary of dependable data is not obtainable at present. However, the feed-in-tariff (FiT), the net metering system (NS), and the various forms of investment support (IS) seem to be the most frequent schemes [39,40,41,42,43].
According to Hungarian regulations, in the case of plants with capacities ranging from 50 kW to 0.5 MW or in the case of demonstration projects, electricity production from renewable sources of energy and waste is supported by FiT. In the case of every entitled electricity producer, the Hungarian Energy and Public Utility Regulatory Authority (HEA) determines the maximum quantity of eligible electricity as well as the period of eligibility. The provisions of Decree No. 389/2007, regulating FiT, are to be applied to renewable energy installations approved eligible for the FiT before 31 December 2016 (§1 (6). The standard feed-in periods for various installations (landfill gas and PV below 2 MW, biogas below 5 MW, and biomass below 20 MW), which may be reduced if further investment schemes are also utilized for the same particular project, are also set out in the same decree. Annex No. 5 of Decree No. 389/2007 stipulates that the FiTs are fixed, and they are annually adjusted according to the consumer price index or the inflation minus one percentage point. The differentiation of the tariffs is based on several criteria: the sizes of the plants, time of licensing, time zones (three daily), and technology, to a certain extent. Plants that applied for the FiT later than 31 December 2016 are governed by a new decree, Decree No. 299/2017. (X. 17.), which provides different regulations for renewable energy plants ranging from 50 kW to 0.5 MW and for installations between 0.5 and 1 MW. Up to 0.5 MW, plants can apply for the FiT or the green premium (market premium), but for plants with capacities of 0.5–1 MW, the green premium is compulsory [44].
Concerning the eligible technologies in the case of plants that were approved after 01 January 2017, with the exception of wind power, every technology for renewable energy generation is eligible for the FiT up to a capacity of 0.5 MW if the eligibility has been confirmed by the competent authority and if it is a new plant conforming to the other stipulations of §20 (1) (§10 a–d) of Decree No. 299/2017 [45]. These include a number of requirements. First of all, no one is allowed to apply if they have outstanding debts to the state or the local government or the recipient (Transmission System Operator). If the applicant has been the beneficiary of financial support in the last three years before their application, they are obligated to provide proof that they have satisfied all the requirements associated with the grant they have received. Applicants are excluded from participation in the support scheme if a grant repayment decision from the European Commission is in force against them, if they have violated the competition law within three years of their application, or if they have used false information during the process of establishing eligibility, or they have been found guilty of a criminal offense by a court of law within three years before the application. In the case of combined heat and power plants (CHP) or ones using renewable biomass fuel, the applicants are obligated to provide certificates of origin. The installations also have to satisfy the technology-specific technical requirements prescribed in Decree 55/2016. According to the law (§9/A. j Decree No. 389/2007 and §7 (1) Decree No. 299/2017), to be allowed to use FiTs for electricity from renewable energy sources and CHP, the electricity produced must have a valid qualification concerning the certificate of origin under Government Decree No. 309/2013. Plants with installed capacities of less than 50 kW are not eligible for FiTs; they are subject to net metering. Furthermore, power plants with capacities exceeding 50 kWp are obligated to provide 15-min electricity production forecasts daily. Should any discrepancy of more than 0% occur, the owner of the installation has to pay a surcharge from 1 July 2018 [42,45,46,47].
Another scheme called HMKE (Hungarian abbreviation for household-size small power plant) was designed to suit local governments, corporate clients, and even residential customers with PV systems with capacities below 50 kW who feed the generated energy into the grid besides purchasing energy. In this arrangement, the PV system operator or owner has to pay only for the difference between the amount of electricity used from the grid and that of the energy fed into it. The balance is calculated yearly. This scheme does not necessitate the provision of 15-min electricity generation forecasts either. The operator/owner of the PV installation has to pay only if their consumption exceeds the amount of energy generation. However, if the electricity produced by them is more than the consumption, the service provider will have to pay the client. As for the storage of the energy, in this system, it is the national grid that is responsible for it. Thus, consumers who own comparatively small PV systems can be self-sufficient without having to worry about any costs and losses resulting from storage. From the government’s perspective, the prospective economic benefits connected to the generation of green energy can also be important to consider in the context of this regulation [19,48].
The installation of a small-scale PV system (>50 kWp) for the sole purpose of decreasing energy consumption in big buildings is also an existing alternative. This is achievable in two different ways. The first option only allows the PV installation to generate enough electricity to cover the user’s actual needs at any time. This arrangement excludes the possibility of feeding PV energy into the grid, which is ensured by a special regulatory device. The whole electricity production by the PV system can even be terminated if it exceeds the self-consumption. Conversely, in the second alternative, the surplus PV energy may be fed into the grid. However, in such a case, the process of licensing is not only far more complicated, and there is an obligation to sign a contract with the service provider regarding the extra PV energy, but the FiT is also much lower (approx. 0.015 €/kWh/2020) than in the other schemes [49].
As shown in Figure 2, power from HMKEs is definitely increasing in Hungary. In 2030 more than 1 GW HMKE power is expected. This power is less than 0.5 GW now, in 2020. Regarding the sales of CO2 savings in the global market, the present regulations do not allow PV system owners to sell them, and they are not given compensation by the state either. This is why this paper does not cover issues related to carbon emissions trading [46,50].
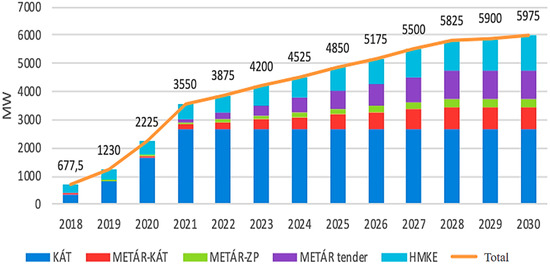
Figure 2.
Expected photovoltaic (PV) power in Hungary [51] * (* Hungarian abbreviations of Hungarian PV power plant sizes and support schemes: KÁT—Hungarian system of supporting green energy from renewable energy sources, METÁR—Renewable Energy Support Scheme, ZP—Green Premium, HMKE—household-size small PV power).
Although there are more and more small-scale power plants (HMKE) in Hungary, and in Europe in general, so far, no comprehensive examination has been carried concerning them. The novelty of this paper, on the one hand, is its focus on the HMKE systems and, on the other hand, their complex study, including economic and geographic indicators. The authors also undertook to provide reasons for their great popularity and to identify some typical geographical locations characterized by high HMKE density.
1.3. The Economic Indicators of the NUTS2 Regions Hungary
Hungary has eight Nomenclature of Territorial Units for Statistics (NUTS2) regions. On 1 January 2018, the NUTS2 classification was changed in Hungary: The formal region of Central Hungary was split into two regions: that of the capital city of Budapest and that of Pest County. The following Table 1 displays some of the key economic indicators of the Hungarian regions. The Southern Great Plain region, including the counties Bács–Kiskun, Békés, and Csongrád, was not examined in this publication because no useful data was available from the regional Distribution System Operator (DSO).

Table 1.
Indicators of the seven examined regions of Hungary based on [52]. (* Hungarian forint, HUF).
2. Methods and Details of the Study
2.1. The Geographical Scope of the Examination
Seven of the eight Hungarian regions were examined:
- Northern Hungary, including the counties Borsod–Abaúj–Zemplén, Heves, and Nógrád;
- The Northern Great Plain, including the counties Hajdú–Bihar, Jász–Nagykun–Szolnok, and Szabolcs–Szatmár–Bereg;
- Pest, including, the county of Pest;
- Budapest, including the capital city of Budapest;
- Central Transdanubia, including the counties Komárom–Esztergom, Fejér, and Veszprém;
- Western Transdanubia, including the counties Győr–Moson–Sopron, Vas, and Zala;
- Southern Transdanubia, including the counties Baranya, Somogy, and Tolna.
The Southern Great Plain region, including the counties Bács–Kiskun, Békés, and Csongrád, was not examined in this publication because no useful data were available from the regional DSO.
The study was carried out not only at a regional level but also at the level of the settlements, and cartograms were created to demonstrate the differences better.
The HMKE data for the paper were provided by the local DSOs of Hungary concerning business and residential customers. Both sets of data were given in terms of power [kW] and quantity [pieces]. Residential customer here means a private person, and a business customer is a business with a tax and a registration number.
All the data used herein refer to the status on 31 December 2019.
In the maps, quantile scaling was used (instead of interval scales).
All the maps of this article were created by the QGIS 3.10.5 software.
2.2. Statistical Analyses of the HMKE Densities in Hungary
In trying to establish statistical relationships between the power/number of HMKEs and the economic indicators, as well as in the attempts to discover the reasons for the different densities of HMKEs, analyses based on the multivariate distribution (correlation and regression) were carried out.
Correlation analysis shows what affects one or more independent variables have on the dependent variable and the strength of their relationship. In the case of metric variables, the Pearson correlation (parametric), while in the case of ordinal ones, the Spearman correlation (nonparametric) can be applied. When examining the relationships between quantitative indices, before the determination of the correlation index, it is worth creating a so-called scatter plot. Based on the empirical data, from the pattern of the dots, one can make deductions concerning the strength and direction of the relationship. More exact results can be achieved by determining the value of the correlation coefficient (r) in the case of a linear relationship or the correlation index (I) in the case of nonlinear ones. The value of the correlation coefficient ranges from −1 to +1, and the closer the absolute value of r to 1 is, the stronger the relationship is. If the value of r is a positive number, it indicates a direct relationship, while a negative number signals an inverse one. A strong correlation can only exist in the case of a significant result (p < 0.5) [53].
2.3. Materials and Methods of the Economic Calculations
With the help of economic indicators, this study investigated one of the PV techno-economic and FiT solutions available in Hungary with the most frequently used crystalline PV facility. The Hungarian average generated power used for the calculations was of 5 kWp per residential HMKE prosumer and 15 kWp per business prosumer. The goal of the economic calculations was to identify the reasons for the extremely high increase in HMKE power generation. The calculations only involved net values for business and gross values for residential prosumers. By prosumers consumers, we mean consumers who not only consume but also produce electricity.
By performing these economic calculations, answers were delivered to the questions regarding the amounts of the investments necessary for PV systems, as well as the financial expenditure and the extra annual yields, taking the regulatory environment currently prevailing in Hungary into account. Regarding potential future changes in FiT, which may greatly affect the investment indicators, a sensitivity analysis was also done. It is important to note at this point that the HMKE option, which is the most straightforward solution for PV installations, is available on an annual basis for both business and residential customers [19,48,54,55].
Another important factor that had to be considered was the annual performance degradation, which is a characteristic of crystalline PV modules. Its value was determined based on the commonly accepted rate of 0.5% for the purposes of this study [20,56]. As for the operation time, a 15-year period, based on the present-day general European investment practice, was selected. Normally, the devices (PV modules and inverters) are still in good condition after 15 years, and can even be sold at a relatively good price. The two main benefits of this are the following:
- Investors can upgrade to the latest and more efficient PV technologies every 15 years;
- More affordable PV technologies are available to people with fewer funds [27,57].
The calculations, of course, also involved taking into account a number of other factors. Although for the 15-year time frame, the replacement of the inverter was not envisaged, we calculated maintenance costs based on experience (e.g., lawn mowing, washing of PV panels, unforeseen technical issues, etc.), and a 10% PV system loss was also taken into account. Our model had a tilt angle of 35°. Other values, namely the net present values (NPV), the profitability indices (PI), and the discounted payback periods (DPP) related to the PV systems and the economic calculations, were determined according to established methodology found in the international literature (Table 2) [41,58]. The 2.775% interest rate applied for calculating the time values of the dynamic economic indicators was based on the long-term Hungarian bond yield data of 22 April 2020. Furthermore, the annual HMKE and small-scale PV electricity FiT changes were based on the inflation rate between 2005 and 2019 at a value of 3.37%.
Table 2.
The initial economic–technical data for the calculations [20,44,56,59,60,61,62,63,64,65,66,67,68,69,70,71].
For simulating a grid-tied PV system, the online software JRC Photovoltaic Geographical Information System (PVGIS) proved to be a great tool, providing data, which also contained real climatic data series from several decades. This allowed us to make estimates for the average energy production of typical grid-tied and off-grid PV systems on both a monthly and a yearly level. The software calculates a number of variables regarding the PV system, as well as the weather conditions: the type of the PV module, the installed peak PV power, the mounting position, the tilt angle, the azimuth, the system loss and, on the other hand, the solar radiation, the temperature, and the wind speed. In the course of generating estimates for PV energy production, all the values can be conveniently set by the user. For the purposes of our model, we chose widely available, average crystalline PV modules [59]. For the validation of the data applied for the average electric energy generation of 1 kWp PV systems, data from real PV systems were used (Table 2) [60,61,62]. According to our model, at the end of the investment period, the inverters and the PV modules were sold, and a demolition fee had to be paid.
3. Results
3.1. Gross HMKE Density in Hungary
According to the results (see Table 3) of the examination of the average power of the HMKEs in Hungary (split into total, business, and residential prosumers), an average business prosumer has 15–16 kW HMKE power (P) except for the regions of Northern Hungary and Pest, where these amounts are 11 and 13 kW. An average residential prosumer has 5–6 kW in Hungary.
Table 3.
Average household-size small photovoltaic power plants’ power in the seven examined regions of Hungary.
Investigating the aggregate HMKE data (Table 4) for seven of the eight Hungarian NUTS2 regions delivered the following results.
Table 4.
HMKEs in the seven examined regions of Hungary. (* Quantity, Q)
The Northern Great Plain had the highest HMKE figures (in terms of power as well as numbers). All three Transdanubian regions were a bit above the average, but Northern Hungary was far below that.
After examining the HMKE figures in the NUTS2 regions of Hungary, the investigation focused on the HMKE prosumers at the level of the settlements of the country.
The following six maps show the gross HMKE power and the number of HMKEs in the Hungarian settlements. The first two maps present the totals, while the second two display the figures of only the residential and the third two those of the business prosumers.
3.1.1. Total Gross HMKE Power
The Northern Great Plain, the area along the border in Northwest Hungary, Budapest, the Lake Balaton region, and the big cities had the most HMKEs. These areas had higher populations than the Hungarian average, except for the Lake Balaton region. (Figure 3).
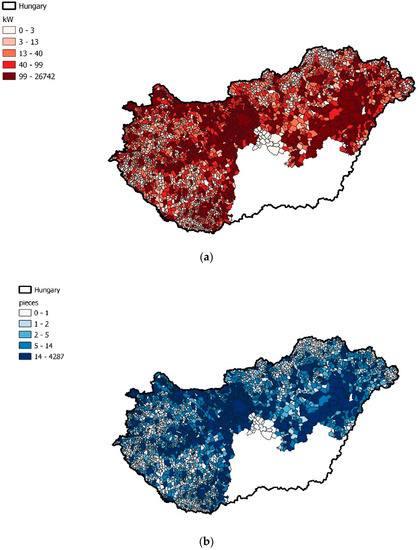
Figure 3.
Total household-size small PV power plants’ (HMKE) power (a) and the number (b) of HMKEs in the settlements of Hungary.
3.1.2. Residential Gross HMKE
Looking at the residential customers, one sees two maps, which are very similar to those presenting the total HMKE figures, as the residential customers greatly outnumbered the business ones (Figure 4).
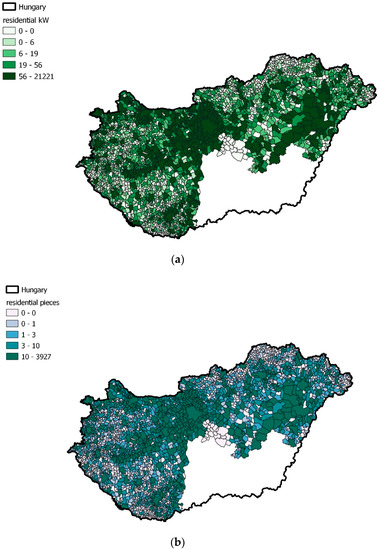
Figure 4.
Total residential HMKE power (a) and the number (b) of residential HMKEs in the settlements of Hungary.
3.1.3. Business Gross HMKE
If only the business HMKEs are shown in the maps, a rather different pattern appears than before: The region of Lake Balaton almost disappeared, but the line of the river Danube could be seen very distinctly, just like the industrial areas of Debrecen–Níregyháza in the Great Plain in the east and those of Győr–Sopron next to the Austrian–Slovakian–Hungarian border (Figure 5).
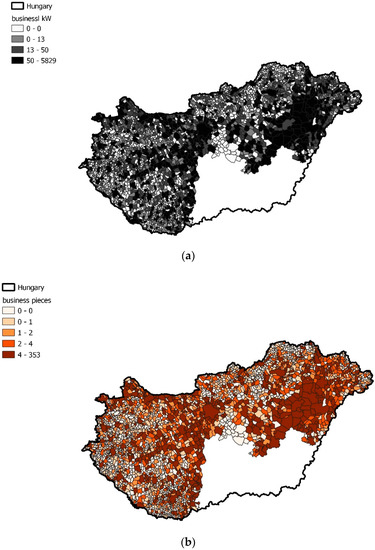
Figure 5.
Total business HMKE power (a) and the number (b) of business HMKEs in the settlements of Hungary.
3.2. HMKE Density in Hungary Relative to Population Size
Due to the varying population densities of the regions and settlements of Hungary, it was important to examine the HMKE figures relative to population size. The HMKE power and the number of HMKEs per 10,000 inhabitants are shown in Figure 6, Figure 7 and Figure 8. The first two of the following six maps show the settlements, the second two, the districts (subcounty administrative units), and the third two, the counties. The difference between the gross values and the figures relative to population size caused characteristic changes to the maps. The line along the Danube River disappeared, but Lake Balaton became very visible. If one looks at only the districts, the industrial regions of the country, situated in the northwest (Győr–Sopron), the east (Debrecen), and the south (Pécs) as well as just west of the capital (Székesfehérvár), become very conspicuous, while in the middle of the northeast the maps seem almost empty. The HMKE density was much lower here than in the other parts of Hungary.
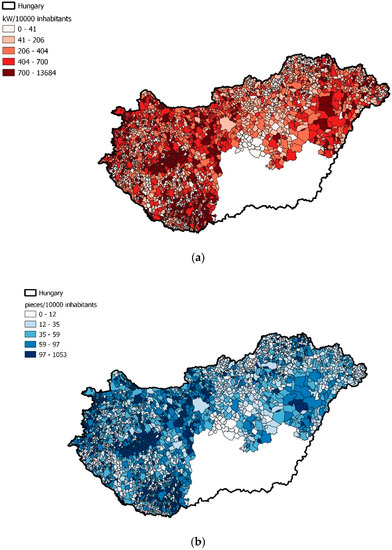
Figure 6.
Total HMKE power (a) and the number (b) of HMKEs per 10,000 inhabitants in the settlements of Hungary.
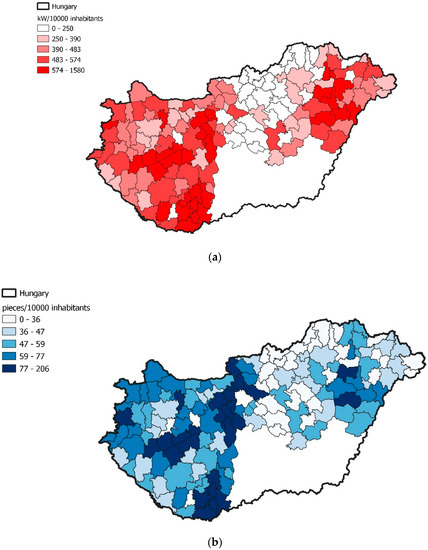
Figure 7.
Total HMKE power (a) and the number (b) of HMKEs per 10,000 inhabitants in the districts of Hungary.
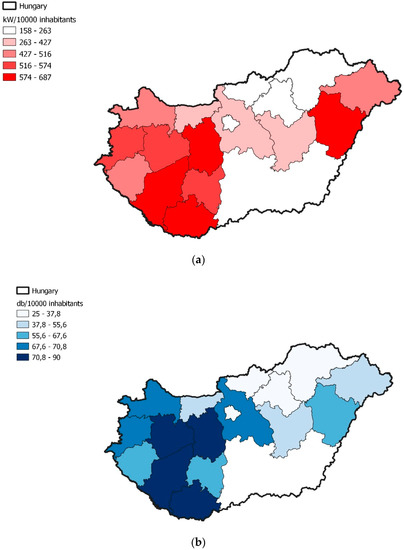
Figure 8.
Total HMKE power (a) and the number (b) of HMKEs per 10,000 inhabitants in the counties of Hungary.
Using the data of the regions, the following specific values (Table 5, Table 6 and Table 7) were obtained, where the red cells indicate the above-average figures, while the color green signals values below the average.
Table 5.
HMKE figures relative to population size in the seven examined regions of Hungary (red: above the average, green: under the average, blue: average).
Table 6.
Economic and demographic indicators in the seven examined regions of Hungary (red: above the average, green: under the average, blue: average).
Table 7.
Business HMKE figures relative to population size in the seven examined regions of Hungary (red: above the average, green: under the average, blue: average).
Table 5 and Table 6 show that the region of Northern Hungary and the capital city of Budapest had the least HMKE power and HMKEs per capita. However, these two NUTS regions of Hungary were totally different. Their differences are well illustrated in Table 6. All the displayed economic figures of Budapest were in great contrast to those of the region of Northern Hungary. Concerning the question of why Budapest had such low HMKE figures, the following answers can be provided within the framework of the present study. The capital city of Budapest had many more inhabitants than the other NUTS2 regions of Hungary, and that is one of the reasons for the low HMKE/10,000 inhabitants figure. The other reason was the high population density, which meant more blocks of flats and fewer detached houses. Consequently, the conditions for HMKE investments may be less than ideal. The Northern Hungary NUTS2 region had the lowest residential HMKE figures among the examined seven regions, shown in Table 5, where it was also seen that this region had only less than half of the HMKE power values of the other regions, except for Budapest.
Despite calculations carried out to establish some correlation between the economic factors of Table 6 and the HMKE status in Hungary, no relationship was found.
Table 7 shows the business HMKE status in the examined seven regions of Hungary. This is similar to that of the residential HMKEs. The NUTS2 regions of Northern Hungary, Pest, and the capital city of Budapest have the fewest business HMKEs per 10,000 businesses. The reason is also similar to the above: Budapest has many more businesses and less space than the other regions. Northern Hungary is the economically least developed among the seven examined regions.
The authors analyzed the relationships between the economic indicators (Table 6) and the HMKE values (Table 5 and Table 7) and obtained the results below. The relationships between any two variables (the indicators in Table 8) were displayed by scatter plots in every case so that the nature of the relationship could be established. It was shown that, either the distributions of the points did not indicate any relationship, or if they did, they suggested the existence of a linear correlation. Consequently, for the quantification of the strengths and directions of the relationships, the Pearson correlation coefficient was applied. The table illustrates at a regional level the strengths of the relationships between the GDP/capita, industrial production/capita, the number of registered enterprises, and the population density, on the one hand, and the power and quantity of the residential and business HMKEs, on the other hand. It was found that regarding the regions, there were no relationships between the indicators; the p-value exceeded 0.05 in every case.
Table 8.
The strengths of the relationships regarding the regions * (* Pearson correlation coefficient/p-value): There exists a significant, verified relationship between two variables if p < 0.05.
3.3. Economic Calculation
According to the calculations, the HMKE was a good investment alternative for both business and residential prosumers. The easy and quick licensing and realization and the annual financial settlement are the important factors of the current rather positive market environment. The amount of energy consumed and the amount fed into the system are calculated only once a year, and only the balance has to be financially settled under this type of regulation. It is a very important argument for this type of investment that it is not necessary to create 15-min energy production forecasts. It was clearly visible (Table 9) that the HMKE PV investment payback period for residential customers was 12 years without any financial support, and for the business prosumers, it was much less: only 4 years. The internal rate of return for business prosumers was relatively high: 31.3% and for residential prosumers: 7.7%. (Table 9).
Table 9.
The overall investment-efficiency indices for the HMKE regulations in 2020.
Installing an HMKE system for a business prosumer is a really good investment if the business is calculating in net amounts since the value-added tax is reclaimable. In the past, there was a financial support scheme to install HMKE systems, but in the future, the termination of this scheme is expected.
4. Conclusions
To gain more insight into small-scale power plant investments, the status of the HMKEs in Hungary was investigated within the framework of a case study with a special focus on the geographical and economic aspects.
Based on the results, the density of the small-scale power plants showed no proven relationship with any of the studied economic factors (GDP/capita, average monthly gross earnings). Nevertheless, small-scale power plants constitute a great investment alternative for business customers because the calculated discounted payback period is only four years. In contrast, such an investment is not particularly positive for residential prosumers because their discounted payback period is twelve years.
As shown by this research, in the examined regions of Hungary, an average business prosumer had 15 kW power, while an average residential one, only 5 kW. Regarding the average HMKE power relative to population, it was found that it was 437 kW/10,000 inhabitants. This means 259 kW/10,000 inhabitants residential HMKE power and 178 kW/10,000 inhabitants business power. The average HMKE density was 59 pieces/10,000 inhabitants, which means 47 residential and 12 business HMKEs/10,000 inhabitants.
In the past, there were financial support schemes (mostly interest-free loans) to install HMKEs, and these made the investments much more acceptable to the population. This may be the reason for the rapidly increasing HMKE numbers in the last few years.
The maps of the HMKE density show a big variation among the studied settlements of Hungary. The reason for these discrepancies lies mostly in the differences in social innovation and not the economic factors. For example, if in a region there is a company with a good business proposal for potential HMKE customers, the density of the HMKEs becomes bigger. In Hungary, the tourist region of Lake Balaton was one of the regions characterized by a high HMKE density. This means that the region of Lake Balaton constitutes a unique unit on its own, suggesting that natural tourist regions have a different HMKE status than other places, probably not only in Hungary but also in the whole of Europe.
The capital city, Budapest, did not have as many small-scale power plants as could be expected based on its economic status, possibly because of the lack of space (which means roof area in this context). The city has a high ratio of blocks of flats relative to detached houses. The installation of an HMKE for a block of flats requires a significant amount of cooperation and paperwork from the property owners. The highly industrialized regions, such as the northwestern border region of Hungary (Győr–Sopron), the southern area around Pécs, and the area around the cities of Debrecen and Nyíregyháza, in the east of the Great Plain, also had high HMKE densities, while the northeastern part of Hungary had almost no HMKEs compared to the other regions of the country.
According to this study, the regions with the highest small-scale power plant penetration were the tourist regions and the well-developed industrial regions, where the population density was lower than in big cities but higher than in the countryside.
Author Contributions
G.P. conceived, designed, and performed the main experiments. G.P., H.Z., N.H.B., A.V. and Z.B. contributed equally in the analysis of the data and the writing and revision of the manuscript. All authors have read and agreed to the published version of the manuscript.
Funding
This research received no external funding.
Acknowledgments
The publication is supported by the EFOP-3.6.3-VEKOP-16-2017-00008 project. The project is co-financed by the European Union and the European Social Fund. The authors have worked together with the KRAFT Social Innovation Lab of the Institute of Advanced Studies Kőszeg (IASK).
Conflicts of Interest
The authors declare no conflict of interest.
Abbreviations
The following abbreviations are used in this manuscript:
| a-Si | Amorphous silicon (-) |
| CHP | Combined heat and power plants (-) |
| DPP | Discounted payback period (years) |
| DSO | Distribution System Operator |
| EU | European Union (-) |
| FiT | Feed-in-tariff (€/kWh) |
| HMKE | Household-sized power plants (-) |
| HEA | Hungarian Energy and Public Utility Regulatory Authority (-) |
| IRR | Internal Rate of Return (%) |
| IS | Investment supports (-) |
| KÁT | Renewable Energy Support Scheme until 31 December 2016 (-) |
| m-Si | Monocrystalline silicon (-) |
| METÁR | Renewable Energy Support Scheme from 1 January 2017 (-) |
| NPV | Net present value (€) |
| NS | Net metering system (-) |
| NUTS | Nomenclature of Territorial Units for Statistics Regions (-) |
| P | Power |
| Q | Quantity |
| PV | Photovoltaic (-) |
| p-Si | Polycrystalline silicon (-) |
| PVGIS | JRC Photovoltaic Geographical Information System (-) |
| VRE | Variable renewable energy (-) |
| ZP | Green Premium (-) |
References
- Dominković, D.F.; Bačeković, I.; Sveinbjörnsson, D.; Pedersen, A.S.; Krajačić, G. On the way towards smart energy supply in cities: The impact of interconnecting geographically distributed district heating grids on the energy system. Energy 2017, 137, 941–960. [Google Scholar] [CrossRef]
- Kordmahaleh, A.A.; Naghashzadegan, M.; Javaherdeh, K.; Khoshgoftar, M. Design of a 25 MWe Solar Thermal Power Plant in Iran with Using Parabolic Trough Collectors and a Two-Tank Molten Salt Storage System. Int. J. Photoenergy 2017, 2017, 1–11. [Google Scholar] [CrossRef]
- Noman, A.M.; Addoweesh, K.E.; Alolah, A.I. Simulation and Practical Implementation of ANFIS-Based MPPT Method for PV Applications Using Isolated Ćuk Converter. Int. J. Photoenergy 2017, 2017, 1–15. [Google Scholar] [CrossRef]
- Daliento, S.; Chouder, A.; Guerriero, P.; Pavan, A.M.; Mellit, A.; Moeini, R.; Tricoli, P. Monitoring, Diagnosis, and Power Forecasting for Photovoltaic Fields: A Review. Int. J. Photoenergy 2017, 2017, 1–13. [Google Scholar] [CrossRef]
- Sefa, İ.; Demirtas, M.; Çolak, İ. Application of one-axis sun tracking system. Energy Convers. Manag. 2009, 50, 2709–2718. [Google Scholar] [CrossRef]
- Nengroo, S.; Kamran, M.; Ali, M.; Kim, D.-H.; Kim, M.-S.; Hussain, A.; Kim, H.; Nengroo, S.H.; Kamran, M.A.; Ali, M.U.; et al. Dual Battery Storage System: An Optimized Strategy for the Utilization of Renewable Photovoltaic Energy in the United Kingdom. Electronics 2018, 7, 177. [Google Scholar] [CrossRef]
- Turner, J.A. A realizable renewable energy future. Science 1999, 285, 687–689. [Google Scholar] [CrossRef]
- Lin, A.; Lu, M.; Sun, P.; Lin, A.; Lu, M.; Sun, P. The Influence of Local Environmental, Economic and Social Variables on the Spatial Distribution of Photovoltaic Applications across China’s Urban Areas. Energies 2018, 11, 1986. [Google Scholar] [CrossRef]
- Liu, Z.; Wu, D.; Yu, H.; Ma, W.; Jin, G. Field measurement and numerical simulation of combined solar heating operation modes for domestic buildings based on the Qinghai–Tibetan plateau case. Energy Build. 2018, 167, 312–321. [Google Scholar] [CrossRef]
- Alsafasfeh, M.; Abdel-Qader, I.; Bazuin, B.; Alsafasfeh, Q.; Su, W.; Alsafasfeh, M.; Abdel-Qader, I.; Bazuin, B.; Alsafasfeh, Q.; Su, W. Unsupervised Fault Detection and Analysis for Large Photovoltaic Systems Using Drones and Machine Vision. Energies 2018, 11, 2252. [Google Scholar] [CrossRef]
- Hosenuzzaman, M.; Rahim, N.A.; Selvaraj, J.; Hasanuzzaman, M.; Malek, A.B.M.A.; Nahar, A. Global prospects, progress, policies, and environmental impact of solar photovoltaic power generation. Renew. Sustain. Energy Rev. 2015, 41, 284–297. [Google Scholar] [CrossRef]
- Roth, W. General Concepts of Photovoltaic Power Supply Systems; Fraunhofer Institute for Solar Energy Systems ISE: Freiburg, Germany, 2005; pp. 1–23. [Google Scholar]
- Kumar Sahu, B. A study on global solar PV energy developments and policies with special focus on the top ten solar PV power producing countries. Renew. Sustain. Energy Rev. 2015, 43, 621–634. [Google Scholar] [CrossRef]
- Vokas, G.A.; Zoridis, G.C.; Lagogiannis, K.V. Single and Dual Axis PV Energy Production Over Greece: Comparison Between Measured and Predicted Data. Energy Procedia 2015, 74, 1490–1498. [Google Scholar] [CrossRef]
- Green, M.A.; Dunlop, E.D.; Levi, D.H.; Hohl-Ebinger, J.; Yoshita, M.; Ho-Baillie, A.W.Y. Solar cell efficiency tables (version 54). Prog. Photovolt. 2019, 27, 565–575. [Google Scholar] [CrossRef]
- Eke, R.; Senturk, A. Performance comparison of a double-axis sun tracking versus fixed PV system. Sol. Energy 2012, 86, 2665–2672. [Google Scholar] [CrossRef]
- Rena Projekt Kft. 500 kW Small-Scale or KÁT PV System System Technical Information’s and Prices in Hungary. Available online: https://renasolar.hu/arak.html (accessed on 7 January 2020).
- Solargis.com. Solar Resource Maps and GIS Data for 200+ Countries. Available online: https://solargis.com/products/maps-and-gis-data/download/ (accessed on 4 February 2020).
- Bai, A.; Popp, J.; Balogh, P.; Gabnai, Z.; Pályi, B.; Farkas, I.; Pintér, G.; Zsiborács, H. Technical and economic effects of cooling of monocrystalline photovoltaic modules under Hungarian conditions. Renew. Sustain. Energy Rev. 2016, 60, 1086–1099. [Google Scholar] [CrossRef]
- Zsiborács, H.; Pályi, B.; Pintér, G.; Popp, J.; Balogh, P.; Gabnai, Z.; Pető, K.; Farkas, I.; Baranyai, N.H.; Bai, A. Technical-economic study of cooled crystalline solar modules. Sol. Energy 2016, 140, 227–235. [Google Scholar] [CrossRef]
- Benick, J.; Richter, A.; Muller, R.; Hauser, H.; Feldmann, F.; Krenckel, P.; Riepe, S.; Schindler, F.; Schubert, M.C.; Hermle, M.; et al. High-Efficiency n-Type HP mc Silicon Solar Cells. IEEE J. Photovolt. 2017, 7, 1171–1175. [Google Scholar] [CrossRef]
- Cosme, I.; Cariou, R.; Chen, W.; Foldyna, M.; Boukhicha, R.; Roca i Cabarrocas, P.; Lee, K.D.; Trompoukis, C.; Depauw, V. Lifetime assessment in crystalline silicon: From nanopatterned wafer to ultra-thin crystalline films for solar cells. Sol. Energy Mater. Sol. Cells 2015, 135, 93–98. [Google Scholar] [CrossRef]
- Green, M.A.; Emery, K.; Hishikawa, Y.; Warta, W.; Dunlop, E.D. Solar cell efficiency tables (version 48). Prog. Photovolt. Res. Appl. 2016, 24, 905–913. [Google Scholar] [CrossRef]
- International Energy Agency. Technology Roadmap Solar Photovoltaic Energy—2014 Edition; International Energy Agency: Paris, France, 2014; pp. 1–60. [Google Scholar]
- Krempasky, J. Semiconductors, Questions & Answers; Technical Publishing House: Budapest, Hungary, 1977. [Google Scholar]
- Verlinden, P.; Deng, W.; Zhang, X.; Yang, Y.; Xu, J.; Shu, Y.; Quan, P.; Sheng, J.; Zhang, S.; Bao, J. Strategy, development and mass production of high-efficiency crystalline Si PV modules. In Proceedings of the 6th World Conference on Photovoltaic Energy Conversion, Kyoto, Japan, 23–27 November 2014. [Google Scholar]
- SecondSol Inc. New and Used PV Module Prices. Available online: https://www.secondsol.com/en/categories/Photovoltaic-Modules_40939 (accessed on 7 April 2020).
- Kondo, M.; Yoshida, I.; Saito, K.; Matsumoto, M.; Suezaki, T.; Sai, H.; Matsui, T. Development of Highly Stable and Efficient Amorphous Silicon Based Solar Cells. In Proceedings of the 28th European Photovoltaic Solar Energy Conference and Exhibition, WIP, Villepinte, France, 30 September–4 October 2013; pp. 2213–2217. [Google Scholar]
- ÖKO-HAUS GmbH. Information on the Prices of a-Si Solar Modules, Price Quotation. Available online: https://www.oeko-haus.com/ (accessed on 19 February 2018).
- REN21. Renewables 2018 Global Status Report—REN21; REN21: Paris, France, 2018. [Google Scholar]
- Enjavi-Arsanjani, M.; Hirbodi, K.; Yaghoubi, M. Solar Energy Potential and Performance Assessment of CSP Plants in Different Areas of Iran. Energy Procedia 2015, 69, 2039–2048. [Google Scholar] [CrossRef]
- Statista, I. Cumulative Solar Photovoltaic Capacity Globally as of 2017, by Select Country (in gigawatts). Available online: https://www.statista.com/statistics/264629/existing-solar-pv-capacity-worldwide/ (accessed on 12 January 2020).
- PV magazine. Hungary to see Record PV Growth in 2018. Available online: https://www.pv-magazine.com/2018/09/12/hungary-to-see-record-pv-growth-in-2018/ (accessed on 11 November 2019).
- Hungarian Transmission System Operator—MAVIR ZRt. Renewable Support Department Customer Service. Available online: https://www.mavir.hu/web/mavir/ugyfelszolgalat (accessed on 18 October 2019).
- Fülöp Miklós. Működik Az Első Hazai Közcélú Energiatároló Egység. Available online: https://www.villanylap.hu/hirek/4904-mukodik-az-elso-hazai-kozcelu-energiatarolo-egyseg (accessed on 20 February 2019).
- Igazságügyi Minisztérium. Magyar Közlöny, 2019. Évi 222. Szám; Gazságügyi Minisztérium: Budapest, Hungary, 2019. [Google Scholar]
- Magyar Villamosenergia-ipari Átviteli Rendszerirányító Zártkörűen Működő Részvénytársaság (MAVIR ZRt.). A Magyar VER Fogyasztói és forrásoldali Jövőképe 2020–2040—Input Adatok; Magyar Villamosenergia-ipari Átviteli Rendszerirányító Zártkörűen Működő Részvénytársaság (MAVIR ZRt.): Budapest, Hungary, 2020. [Google Scholar]
- Fraunhofer Institute for Solar Energy Systems. Photovoltaics Report; Fraunhofer Institute for Solar Energy Systems: Freiburg, Germany, 2019. [Google Scholar]
- La Monaca, S.; Ryan, L. Solar PV where the sun doesn’t shine: Estimating the economic impacts of support schemes for residential PV with detailed net demand profiling. Energy Policy 2017, 108, 731–741. [Google Scholar] [CrossRef]
- European Commission. RES LEGAL Europe. Available online: http://www.res-legal.eu/ (accessed on 13 November 2019).
- Coria, G.; Penizzotto, F.; Pringles, R. Economic analysis of photovoltaic projects: The Argentinian renewable generation policy for residential sectors. Renew. Energy 2018, 133, 1167–1177. [Google Scholar] [CrossRef]
- European Commission. Legal Sources on Renewable Energy—Hungary. Available online: http://www.res-legal.eu/en/search-by-country/hungary/ (accessed on 2 February 2020).
- Sorknæs, P.; Djørup, S.R.; Lund, H.; Thellufsen, J.Z. Quantifying the influence of wind power and photovoltaic on future electricity market prices. Energy Convers. Manag. 2019, 180, 312–324. [Google Scholar] [CrossRef]
- Zsiborács, H.; Hegedűsné Baranyai, N.; Csányi, S.; Vincze, A.; Pintér, G. Economic Analysis of Grid-Connected PV System Regulations: A Hungarian Case Study. Electronics 2019, 8, 149. [Google Scholar] [CrossRef]
- European Commission. RES REGAL. Legal Sources on Renewable Energy, Feed-In Tariff (EEG Feed-In Tariff), Germany. Available online: http://www.res-legal.eu/search-by-country/germany/single/s/res-e/t/promotion/aid/feed-in-tariff-eeg-feed-in-tariff/lastp/135/ (accessed on 4 February 2020).
- Pintér, G.; Baranyai, N.H.; Wiliams, A.; Zsiborács, H. Study of photovoltaics and LED energy efficiency: Case study in Hungary. Energies 2018, 11, 790. [Google Scholar]
- Hungarian Transmission System Operator—MAVIR ZRt. Useful Documents to KÁT System. Available online: https://www.mavir.hu/web/mavir/ugyfelszolgalat (accessed on 2 February 2020).
- E.ON Hungária Zrt. House-Hold-Sized Power Plants (HMKE). Available online: http://energia.eon.hu/hmke/# (accessed on 2 February 2020).
- Tiszta Energiák Kft. Information About the Small-Scale PV System Tiszta Energiák Kft. Available online: https://www.tisztaenergiak.hu/ (accessed on 11 October 2019).
- D’Adamo, I. The Profitability of Residential Photovoltaic Systems. A New Scheme of Subsidies Based on the Price of CO2 in a Developed PV Market. Soc. Sci. 2018, 7, 148. [Google Scholar]
- Pintér, G.; Birkner, Z.; Hegedűsné Baranyai, N.; Zsiborács, H. A hazai energiatárolás lehetőségei 2030-ig—Possibilities of energy storage systems in Hungary until 2030. Energiagazdálkodás 2019, 2019, 1–44. [Google Scholar]
- Hungarian Central Statistical Office STADAT. Available online: http://www.ksh.hu/stadat (accessed on 1 May 2020).
- Freedman, D.; Pisani, R.; Purves, R. Statistics; Typotex: Budapest, Hungary, 2005; ISBN 10 963-9548-63-4; 13 978-963-9548-63-3. [Google Scholar]
- Zsiborács, H.; Pályi, B.; Pintér, G.; Baranyai, N.H.; Szabó, P.; Farkas, I. Economic questions and energy performance of the cooled polycrystalline solar photovoltaic (PV) technology. Rev. Agric. Rural Dev. 2016, 5, 162–170. [Google Scholar]
- Kocsis, K.; Schweitzer, F. Hungary in Maps; Geographical Institute, Research Centre for Astronomy and Earth Sciences of the Hungarian Academy of Sciences: Budapest, Hungary, 2011. [Google Scholar]
- Jordan, D.C.; Kurtz, S.R. Photovoltaic Degradation Rates-an Analytical Review. Prog. Photovolt. Res. Appl. 2013, 21, 12–29. [Google Scholar] [CrossRef]
- SecondSol Inc. New and Used Inverter Prices. Available online: https://www.secondsol.com/en/categories/Inverters_40948 (accessed on 7 March 2020).
- Brealey, R.A.; Myers, S.C.; Allen, F.; Mohanty, P. Principles of Corporate Finance; McGraw-Hill/Irwin: New York, NY, USA, 2003. [Google Scholar]
- European Commission. JRC Photovoltaic Geographical Information System (PVGIS). Available online: http://re.jrc.ec.europa.eu/pvg_tools/en/tools.html#PVP (accessed on 1 May 2020).
- SMA Solar Technology AG. ZMET PV System Profile. Available online: https://www.sunnyportal.com/Templates/PublicPageOverview.aspx?page=96e1e167-9121-42c5-8f5c-bae1923c6a85&plant=a2fa17c6-7f5c-4b13-8a61-3a83f77e5d84&splang=en-US (accessed on 29 March 2020).
- SMA Solar Technology AG. Pitvaros 1 PV System Profile. Available online: https://www.sunnyportal.com/Templates/PublicPageOverview.aspx?page=07f487db-8b6a-4e9c-aa43-7992c5957656&plant=88dd56e3-63c5-4aa6-9926-2a1948b65854&splang=en-US (accessed on 29 May 2020).
- SMA Solar Technology AG. CZK-001 PV System Profile. Available online: https://www.sunnyportal.com/Templates/PublicPageOverview.aspx?page=afeb0fab-f6db-4b82-8782-49ac359e5f13&plant=934c0200-15f1-4e6c-8100-b9f5a02912c0&splang=en-US (accessed on 29 May 2020).
- Investing.com. European Government Bonds Yields. Available online: https://www.investing.com/rates-bonds/european-government-bonds?maturity_from=10&maturity_to=310 (accessed on 1 May 2020).
- Inflation.eu. Historic Inflation Hungary—Historic CPI Inflation Hungary. Available online: http://www.inflation.eu/inflation-rates/hungary/historic-inflation/cpi-inflation-hungary.aspx (accessed on 1 May 2020).
- E.ON Hungária Zrt. Average Delivery Price for Electric Energy for Business Customer in the HMKE System and in the Small-Scale PV System. Available online: https://www.eon.hu/hu/uzleti/aram/arak-tarifadijak.html (accessed on 1 May 2020).
- E.ON Hungária Zrt. Household-Size Power Plants (HMKE) Documentation; E.ON Hungária Zrt.: Budapest, Hungary, 2018. [Google Scholar]
- Kacira, M.; Simsek, M.; Babur, Y.; Demirkol, S. Determining optimum tilt angles and orientations of photovoltaic panels in Sanliurfa, Turkey. Renew. Energy 2004, 29, 1265–1275. [Google Scholar] [CrossRef]
- Breyer, C.; Schmid, J. Global Distribution of Optimal Tilt Angles for Fixed Tilted PV Systems. In Proceedings of the 25th European Photovoltaic Solar Energy Conference and Exhibition 5th World Conference on Photovoltaic Energy Conversion, Valencia, Spain, 6–10 September 2010; pp. 4715–4721. [Google Scholar]
- SMA Solar Technology AG. PV System in Hungary, 1945.01 kWp, Berettyóújfalu_13. Available online: https://www.sunnyportal.com/Templates/PublicPageOverview.aspx?page=3bb31f01-cf47-49f8-852f-11ea28e0bd1c&plant=3a1a11db-35f9-41d5-9837-56c4ac252d90&splang=en-US (accessed on 29 May 2020).
- Stabil Invest Kft. The Price of a 5 kWp Complete PV System in Hungary. Available online: http://www.stabil-invest.hu/termek/growatt-inverteres-rendszer-napelemhez/5kw-napelem-rendszer-egy-fazisra-kulcsrakesz/ (accessed on 2 February 2020).
- Stabil Invest Kft. The Price of a 15 kWp Complete PV System in Hungary. Available online: http://www.stabil-invest.hu/termek/growatt-inverteres-rendszer-napelemhez/15kw-napelem-rendszer-kulcsrakesz/ (accessed on 30 May 2020).


© 2020 by the authors. Licensee MDPI, Basel, Switzerland. This article is an open access article distributed under the terms and conditions of the Creative Commons Attribution (CC BY) license (http://creativecommons.org/licenses/by/4.0/).