Abstract
Power transformers are one of the most important devices in electrical networks. The safety operation of the transformers directly affects the reliability of the power system. To diagnose the internal deformation of the transformer as soon as possible is of great significance. As a new technique, sweep frequency impedance (SFI) method has been used to detect the short-circuit fault of the transformer winding. However, the SFI method is still in the early stage and more experimental tests are needed to further demonstrate its accuracy in the detection of other types of winding faults. Therefore, in this paper, the SFI method is investigated to diagnose an open-circuit fault of an onsite transformer. By deeply analyzing the SFI curves and SFI values at power frequency obtained by the SFI test, the open-circuit fault of this transformer winding is determined. Meanwhile, the accuracy of the diagnostic results based on the SFI method is validated by introducing the results of the short-circuit impedance (SCI) and winding resistance measurements. The application of the SFI method on the detection of the open-circuit fault within the transformer winding not only enrich the SFI method research but also provide valuable practical guidance significance for the fault detection.
1. Introduction
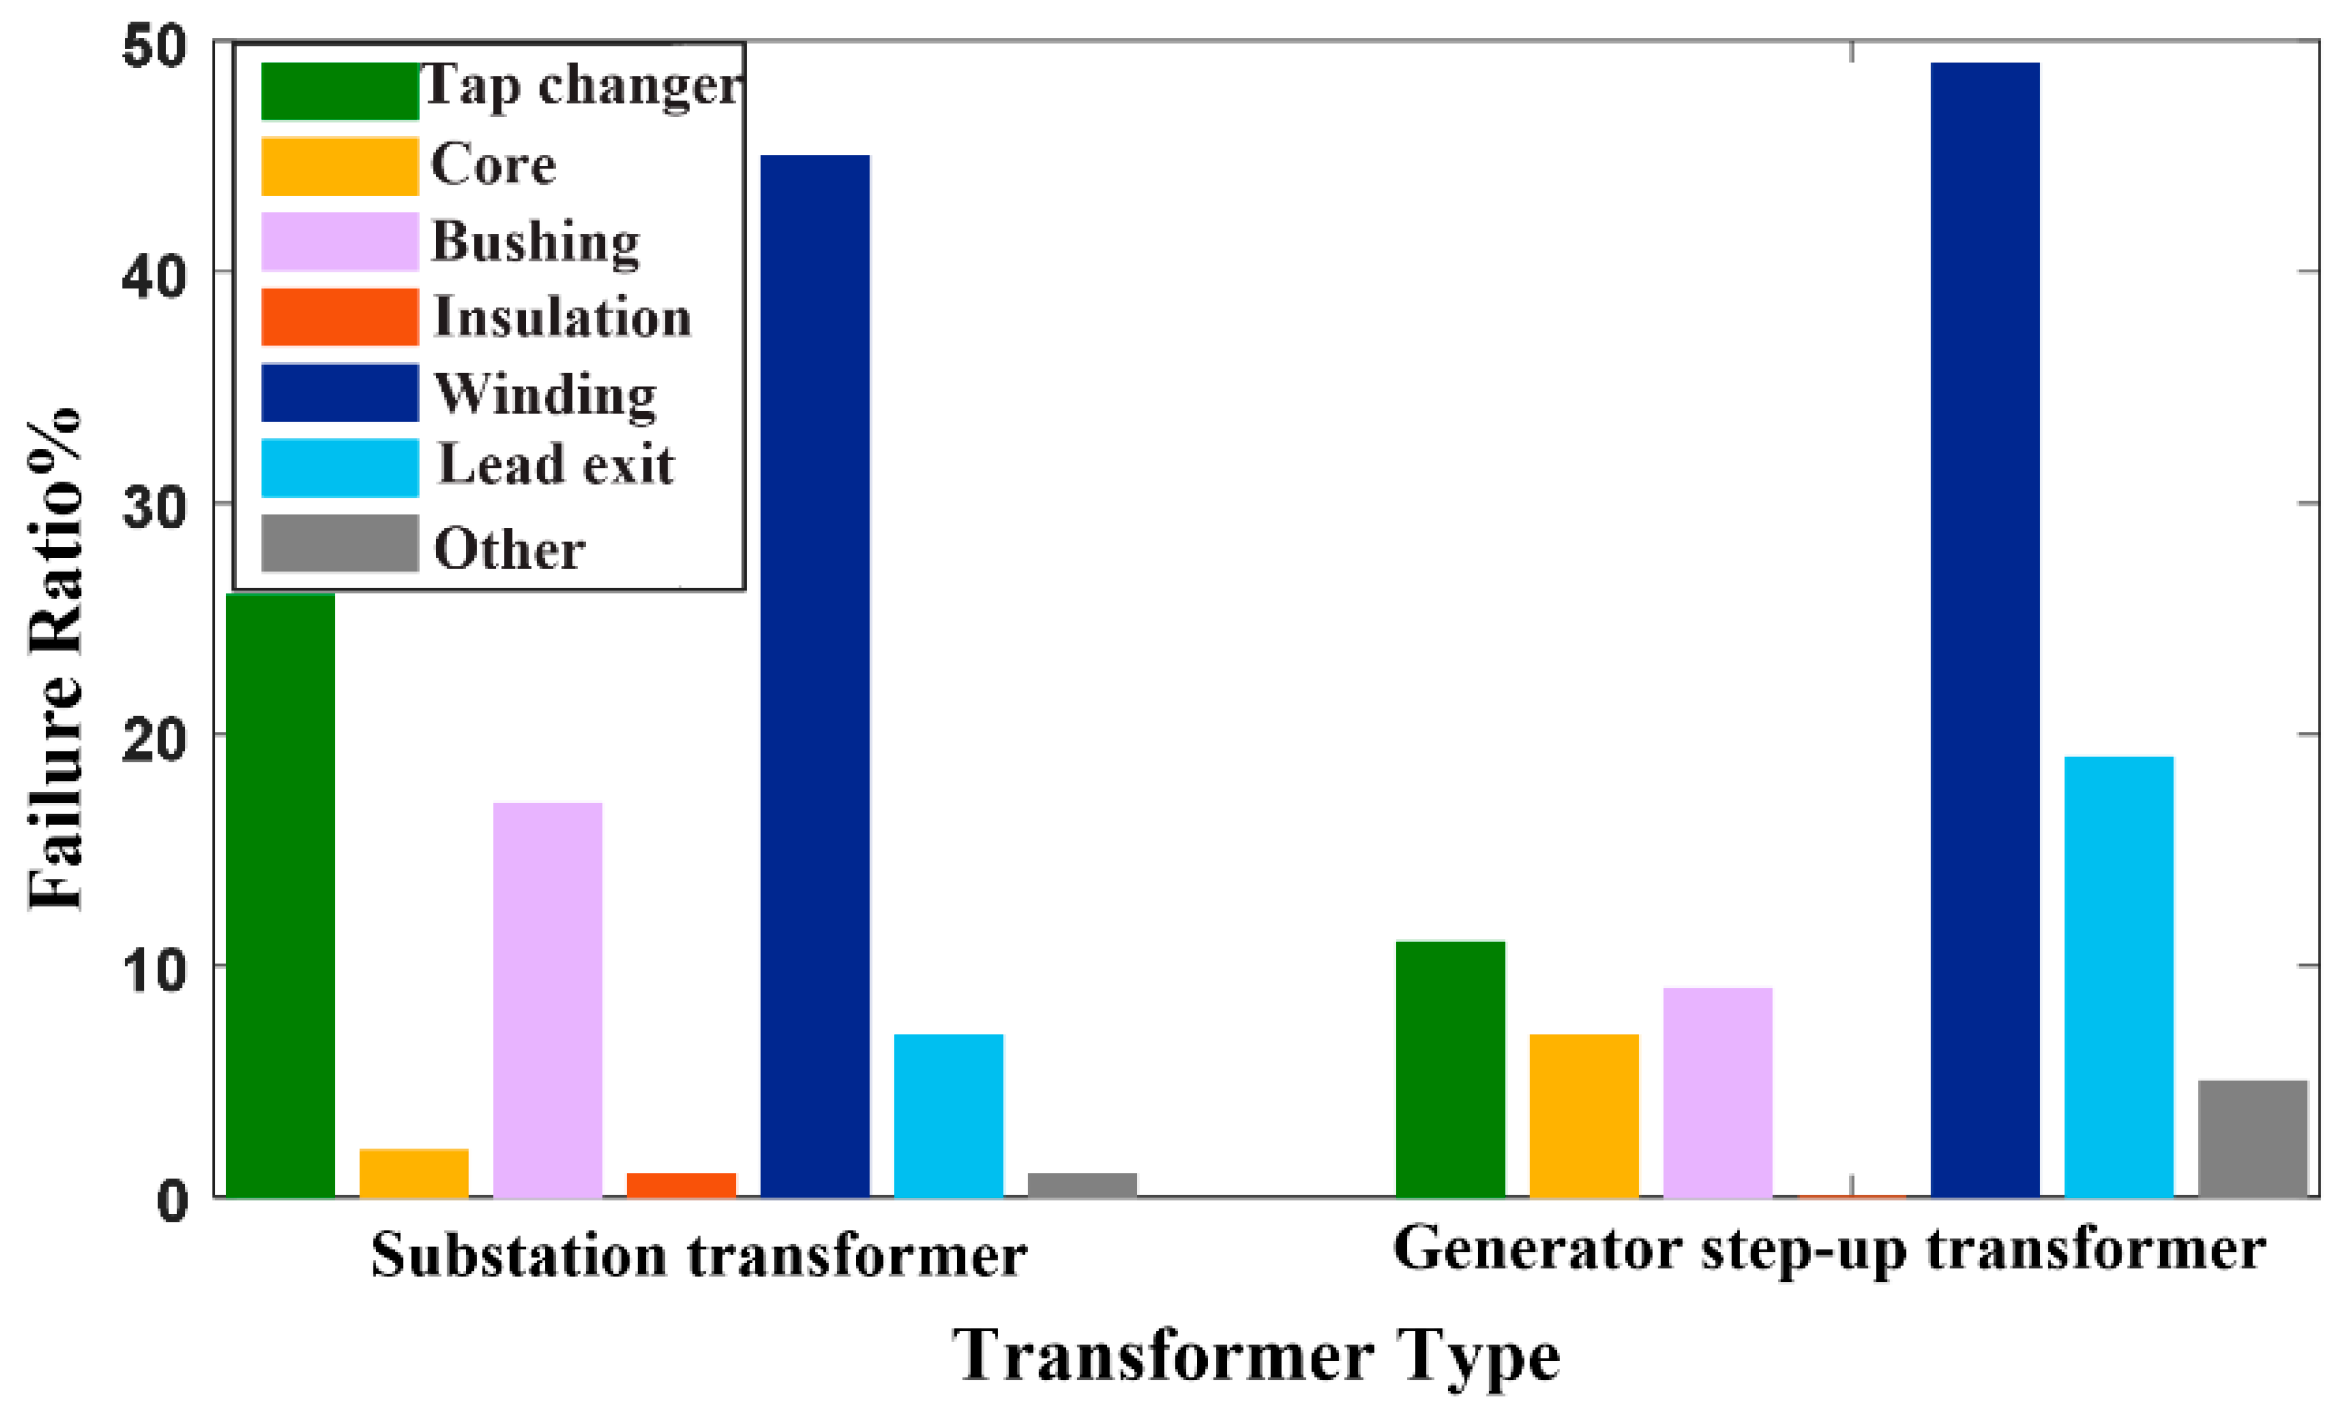
Transformers are indispensable equipment in power systems. The safety operation of the transformers is to provide uninterrupted services for the transmission and distribution of electrical power. However, transformers in the power networks will inevitably suffer from the short-circuit current. The interaction of short-circuit current and the flux produces a massive electromagnetic force which is dozens or 100 times larger than the normal electromagnetic force. If the strength of the internal support in the transformer winding cannot withstand it, the mechanical deformation of the winding will occur, such as free buckling, hoop buckling, winding tilting, displacements between primary and secondary windings, shorted turns, open-circuit, partial winding collapse, loosened clamping structures, core movement, and faulty grounding of core [1,2]. In addition, lightning strikes, switching transients, earthquakes, and incorrect transportation also may lead to the permanent damage of the winding [3]. A study that collected 964 transformer accidents in 21 countries around the world, including Japan, Germany, Canada, Australia, and Brazil, from 1996 to 2010, shows that the winding related failures appear to be the largest contributor of major failures, as shown in Figure 1 [4]. Consequently, detecting and diagnosing the transformer winding faults in the early stage is of great significance to the power system.
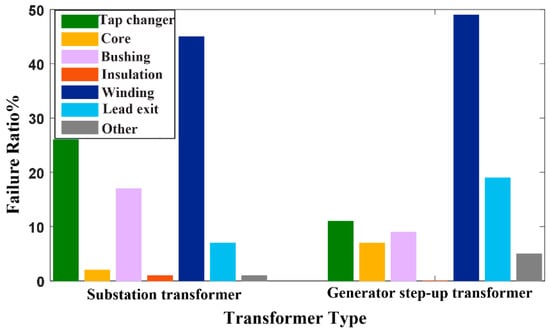
Figure 1.
The ratio of failure location of the substation and generator step-up transformers [4].
Among the existing regular non-destructive diagnosis, frequency response analysis (FRA) method is a powerful tool to detect the internal mechanical integrity of winding without any needs to dismantle the unit [5,6,7,8]. It has turned out to be an accurate and effective method through numerous significant works [9,10,11,12,13,14]. As a comparison method, the fault condition of the winding is determined by analyzing the variation of the FRA results before and after deformation over a wide frequency domain. Over recent years, the Power Industry Bureau of China, the International Council on Large Electric systems (CIGRE) Working Groups, the IEC Project Team, and the IEEE Transformer Frequency Response Group [15,16,17,18] have respectively published a Chinese standard, technical brochure, and international standards on the procedures and configurations for performing the FRA tests, common test-influencing factors, and analysis and interpretation of the FRA results. In addition, as a traditional method, short-circuit impedance (SCI) method has been used for many years to diagnose the defects of the winding by measuring the value of the SCI of the winding [19]. Since the SCI depends on the geometry of the winding, the alteration of the winding’s geometry caused by deformation will lead to a deviation of the SCI. The standard IEEE std. C57.62 published by IEEE Power and Energy Society stipulates that the transformer winding should be considered significant when the changes of SCI are more than ±3% in comparison with the nameplate [20]. According to the above analysis, it can be seen that the diagnosis criteria of the FRA and SCI methods are the variation of the FRA curves and the change of the SCI, respectively. Obviously, there is only one diagnosis criterion in the FRA or SCI method. The sweep frequency impedance (SFI) method, which is developed by taking advantage of the benefits of the SCI and FRA methods, is first introduced in [21] to study internal winding short-circuit faults of a self-designed transformer. However, as a new technique, the SFI method is in a stage of development and it still needs more practical measurements and applications to further demonstrate its feasibility and accuracy in the detecting of different types of faults of the onsite power transformer. Therefore, in this paper, the SFI method is employed to diagnose an onsite 110 kV transformer. Based on the SFI method, the open-circuit fault of this transformer winding is determined by SFI measurement. Meanwhile, the accuracy and effectiveness of the SFI method are validated through SCI and winding resistance measurements.
The remainder of this paper is organized in the following manner. The principles of SFI method, the similarities and differences between the SFI method and the SCI method, similarities and differences between the SFI method and the FRA method are introduced in Section 2, respectively. The SFI method is applied to an onsite 110 kV transformer and the experimental results are comprehensively analyzed in Section 3. In Section 4, the SCI and winding resistance measurement methods are used to further verify the accuracy of the diagnostic results that are obtained by the SFI method. Finally, the conclusion is given in Section 5.
2. SFI Method
2.1. The Basic Principle and Measurement System of the SFI Method
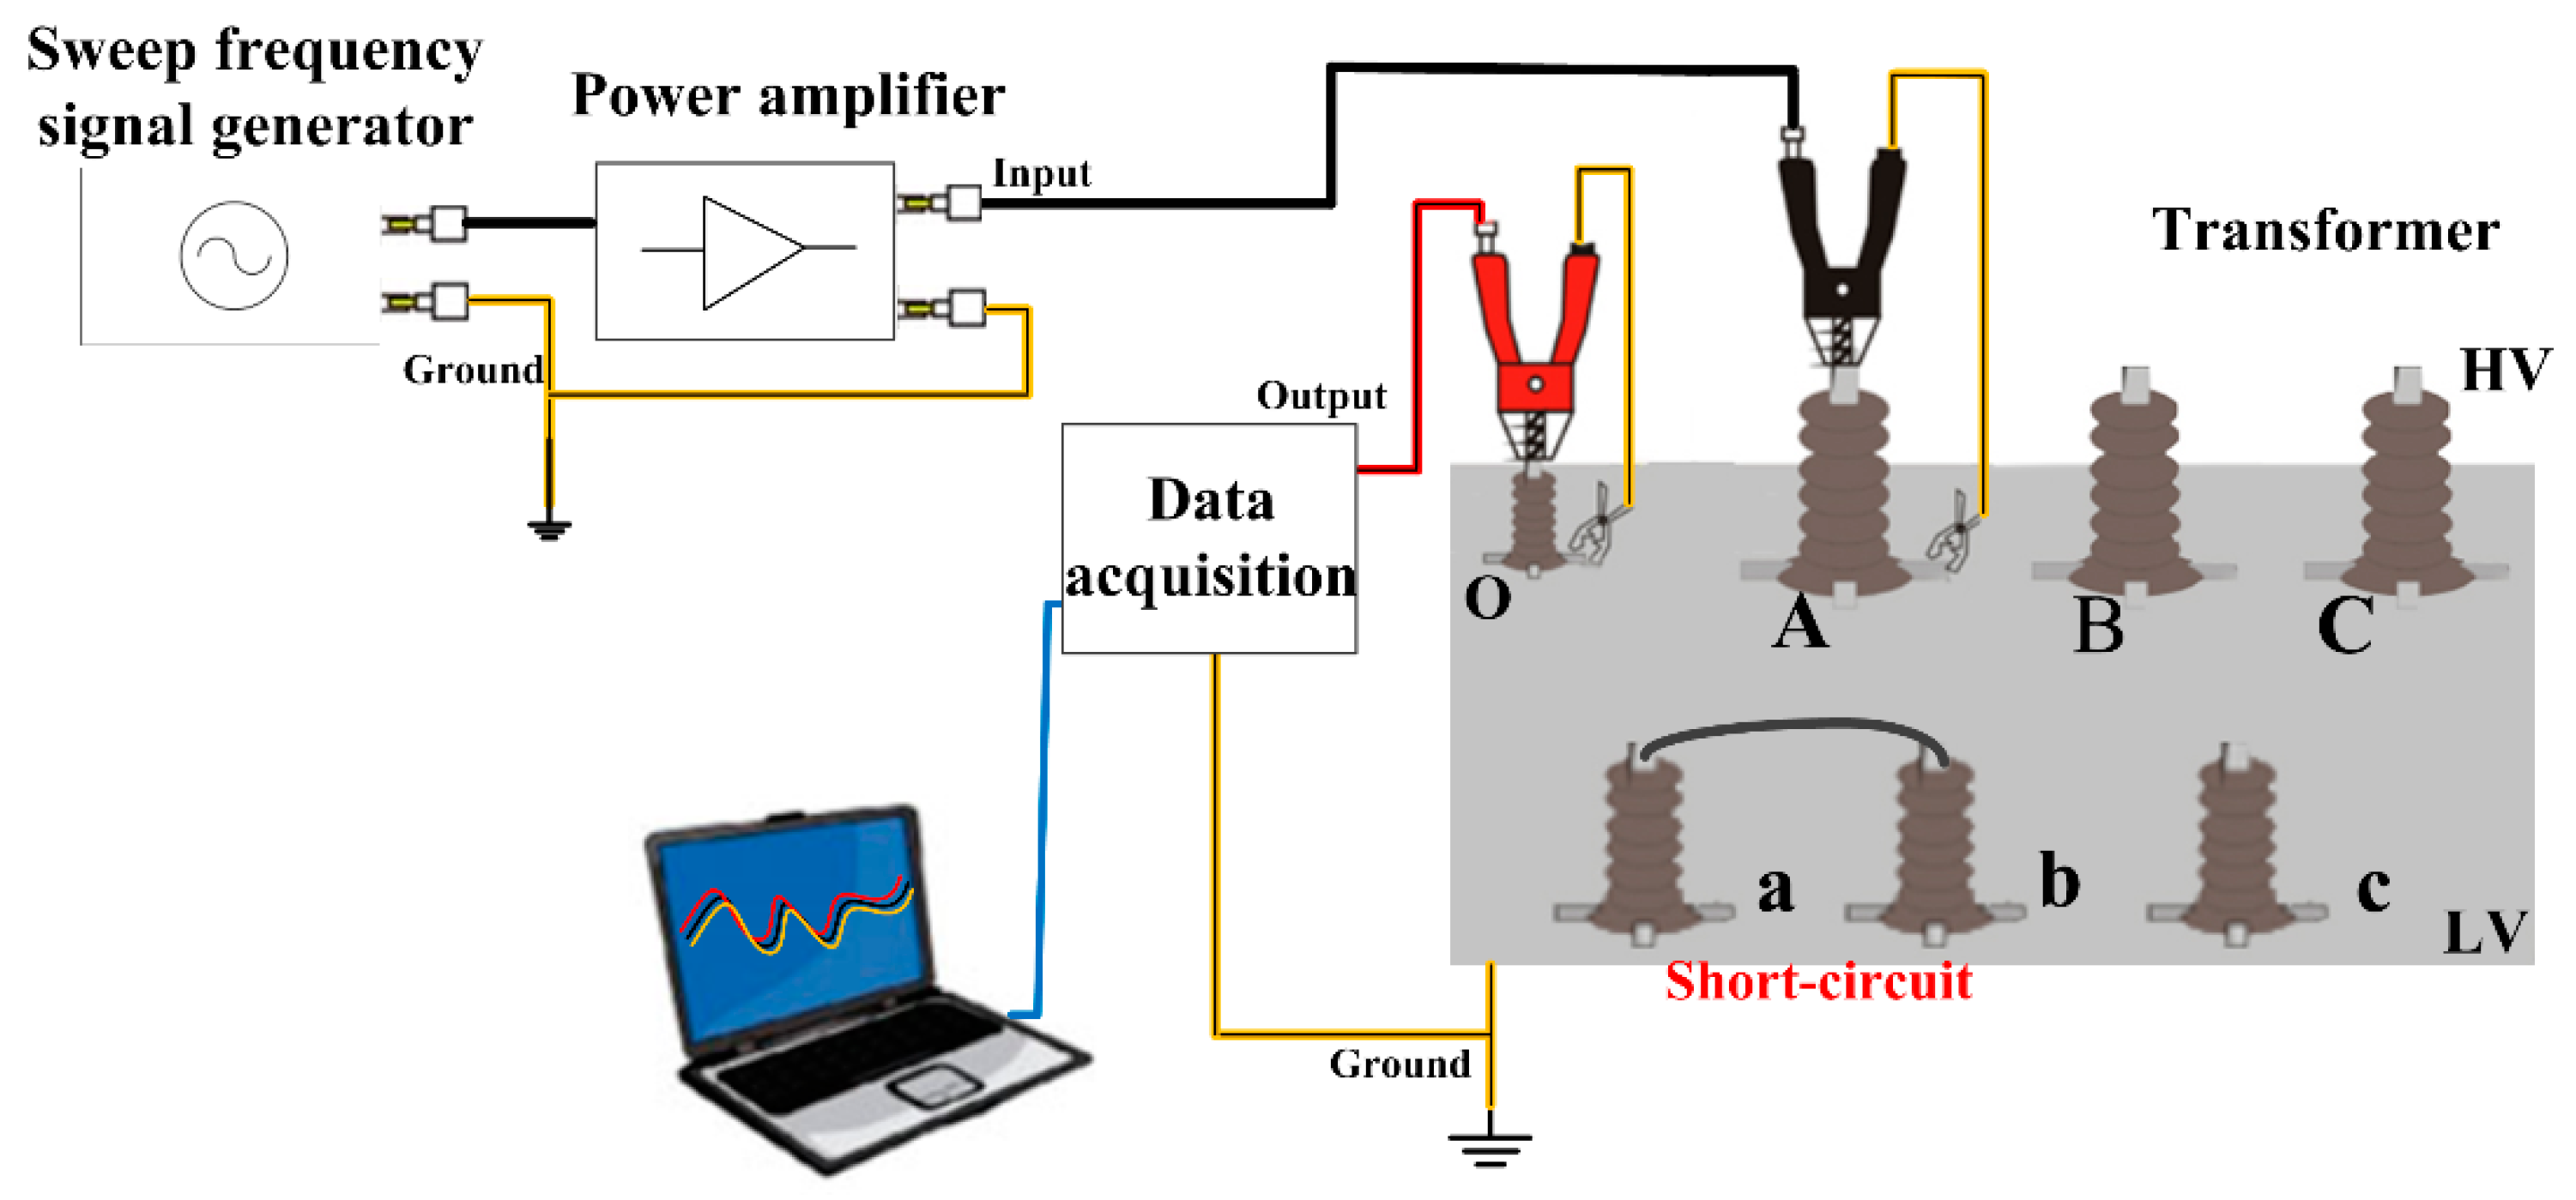
The SFI measurement system consists of a sweep frequency signal generator, a power amplifier, a data acquisition device, a computer, and two test fixtures with 50 Ω matched impedances, as shown in Figure 2. For the measurement of SFI, a series of sinusoidal low voltage signals changed from 10 Hz to 1MHz are produced by the signal generator. Then, the amplitudes of the low voltage signals are enlarged by the power amplifier. The amplified sweep frequency signals are injected into one terminal of the high voltage (HV) winding and the response signals are received by the data acquisition device from another terminal of the HV winding, with the low voltage (LV) winding shorted. Afterwards, the SFI value at each frequency point is obtained. Finally, all the SFI values can be drawn as a curve, which represents the inter impedance characteristic of the winding.
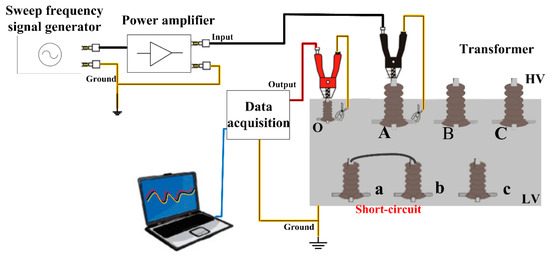
Figure 2.
The sweep frequency impedance (SFI) measurement system.
According to the connection scheme of the SFI measurement system, the SFI is calculated as:
where, the symbol “·” stands for the phasor. Uin and Uout are the input and the response voltage phasors of the primary winding, respectively. I1 is the current in the primary winding and it can be obtained as:
Taking Equation (2) into Equation (1), Equation (1) can be expressed as:
The data acquisition device not only collects the amplitude values of the input and output voltage signals but also records the phase values of the input and output voltage signals. Therefore, based on the Cosine Law, Equation (3) can be changed into Equation (4) by considering corresponding phase values.
where, θ1 and θ2 are the phases of the input and output voltages, respectively.
In order to clearly describe the SFI characteristic of the winding, Equation (4) can be presented in dB scales, as shown in Equation (5).
Through SFI measurement, the SFI curve, which contains the SFI values in the frequency range from 10 Hz to 1 MHz, can be obtained. Thus, two different diagnosis criteria are directly formed to detect the faults of the winding. The first criterion is the SFI value at power frequency (50 Hz), which is equal to the SCI value measured through the SCI method. By comparing the SFI value at power frequency and the SCI value in the nameplate, the state of the transformer winding can be determined. Since the SCI value in the nameplate is usually given in the form of the percentage impedance, the SFI value at power frequency can be transformed into the percentage impedance, as shown in Equation (6) [21,22].
where, Ur and Ir are the rated voltage and rated current of the transformer, respectively.
The second criterion is the SFI curve. Since the SFI curve is similar to the FRA curve, the numerical indices that are used in FRA field, such as the change ratio (CR) [23], absolute sum of logarithmic error (ASLE) [24,25], and relative factor RF [15,19], can also be used to quantify the variations of the SFI signatures caused by winding deformation.
2.2. SCI vs. SFI
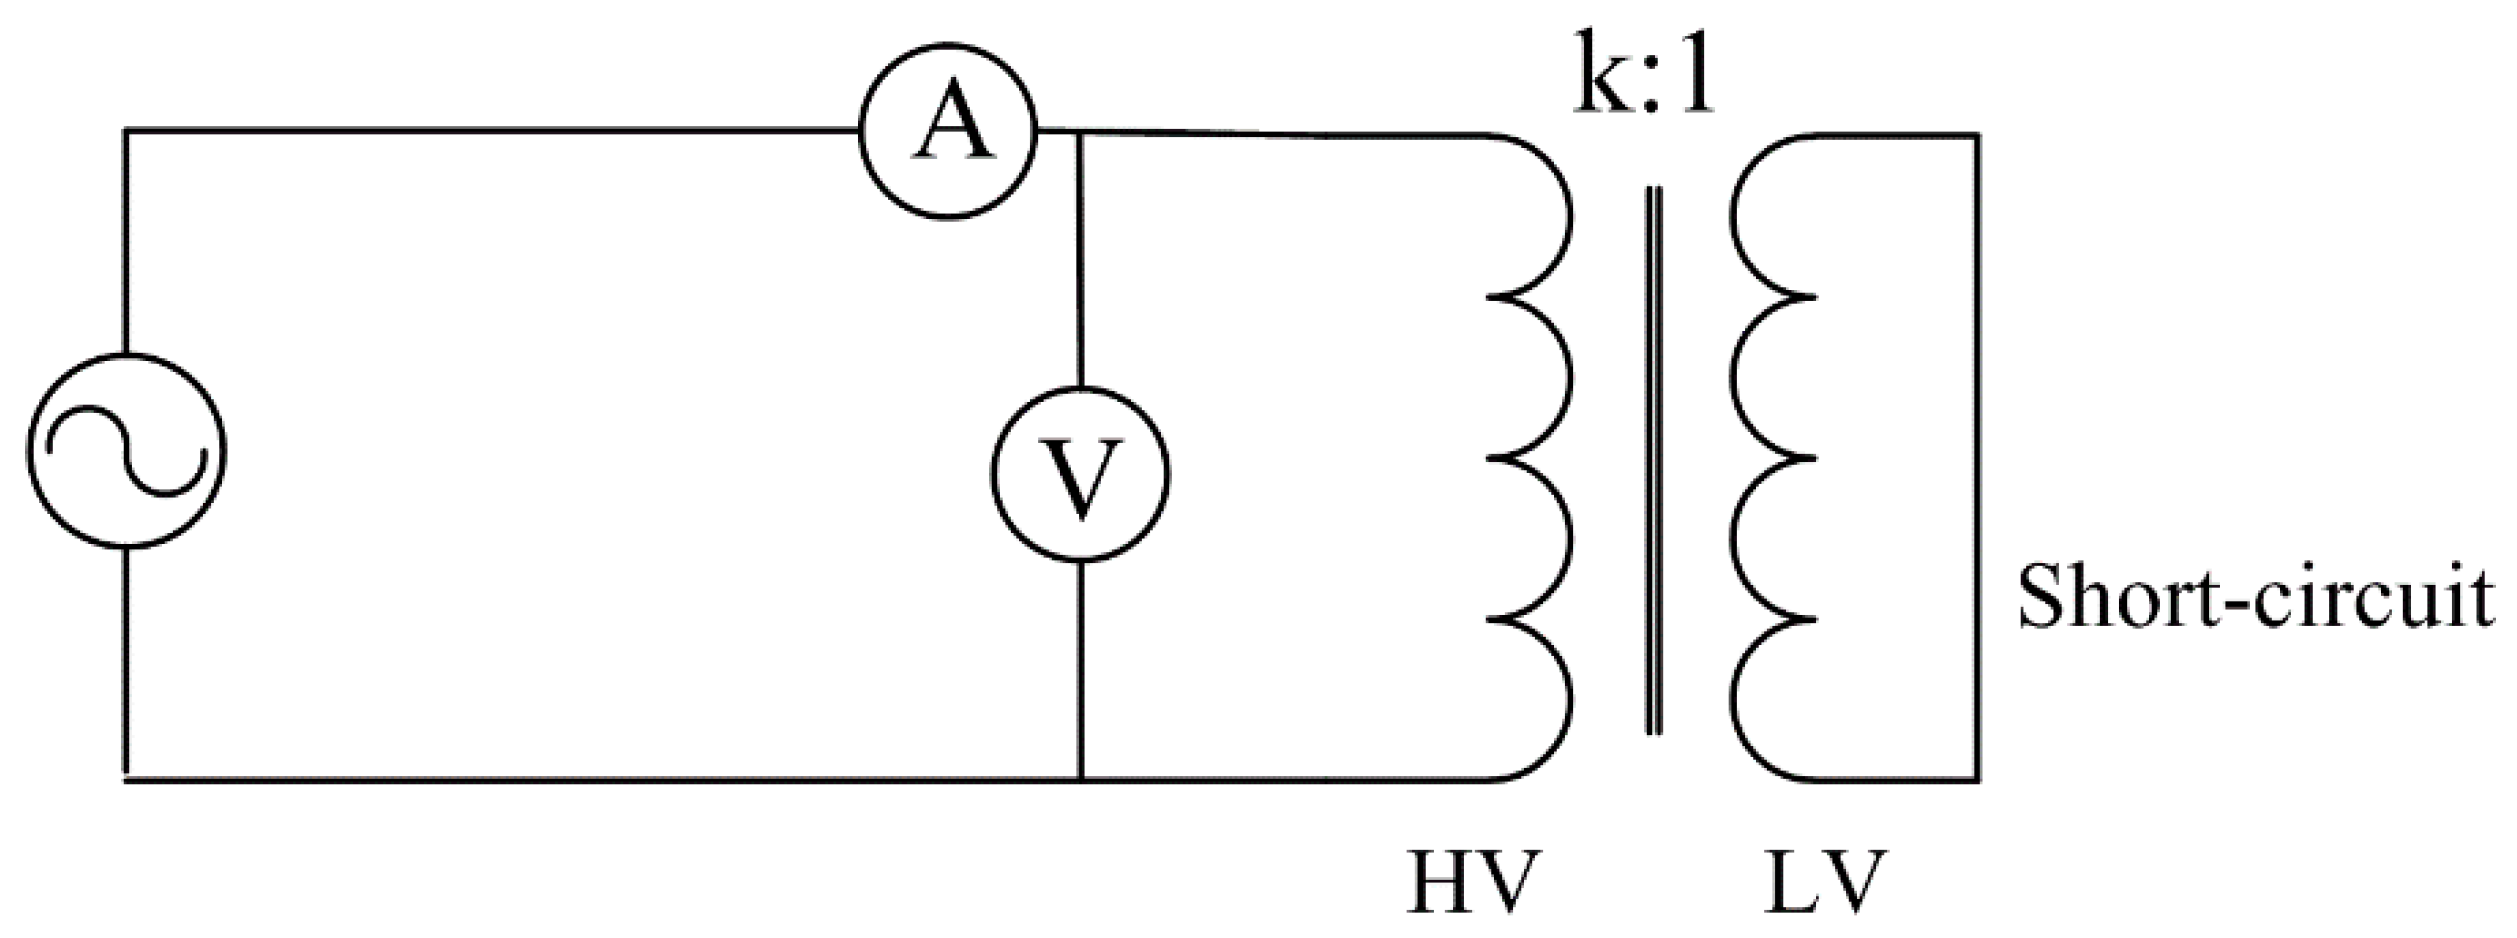
The SCI method is a conventional technique to detect winding deformation and core displacement of a transformer. In the SCI test, the voltage is usually applied to the HV winding and the LV winding is short-circuited. The ratio of the fundamental component of the voltage and the current applied to the HV winding is the SCI of the transformer under test. The schematic diagram of the SCI measurement is illustrated in Figure 3.
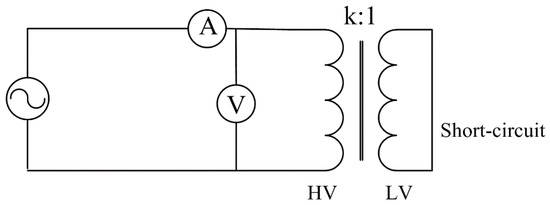
Figure 3.
The schematic diagram of the short-circuit impedance (SCI) measurement.
It is obviously seen that the connection schemes of the SFI and SCI measurements are the same by comparing Figure 2 and Figure 3. Differently, the input signal of the SCI measurement is a power frequency sinusoidal low voltage, but the input signal of the SFI test is a series of sinusoidal low voltages. It makes the output of the SFI test contain a lot of impedance values in the sweep frequency range rather than only one impedance value. Hence, the SFI method can get more characteristic information of the transformer and it is more conducive to detecting the faults of the transformer.
2.3. FRA vs. SFI
The FRA method is a very sensitive tool to detect the winding movement or deformation. The FRA results measured after the occurrence of faults are compared with the original FRA signature to determine if any difference appears. The changes of the FRA curves, such as the shifting of resonant frequencies, are usually used as the key features for diagnosis of the winding movement or faults. The magnitude of FRA results of a transformer winding is calculated as the ratio of the output voltage to the input voltage, as shown in Equation (7).
By comparing Equations (5) and (7), the first difference between the FRA method and SFI method is revealed. That is the form of the results. The FRA results are the voltage ratios, but the SFI results are the impedances. It needs to be emphasized that, although the resulting forms of these two methods are different, the values of both results depend only on the structural parameters of the transformer winding and both methods can be used to diagnose the state of the transformer.
The second difference is that the SCI value obtained by the SFI test can be treated as a diagnostic criterion, but the FRA test does not provide this important feature. It means that the SFI method can provide more internal feature information of the transformer to improve the ability to detect the mechanical defects of the transformer winding.
The FRA measurement system with the end to end open-circuit connection, which is the most widely used connection scheme, is shown in Figure 4a. In addition to this connection way, there are three other FRA test connection schemes available recommended by the standards [14,15,16]. They are end to end short-circuit, transfer voltage, and inductive inter-winding connections. In the four connections, the end to end short-circuit connection, as shown in Figure 4b, is similar to the connection scheme of the SFI test in Figure 2. Apart from the connection, the most significant difference between the SFI and FRA test systems is the power amplifier. The use of the power amplifier in the SFI test system can improve the signal-to-noise ratio (SNR) to reduce the external interferences of the onsite test. It makes the SFI measurement have a better anti-interference performance and it is more suitable for the onsite test. In FRA method, since the increased input current will make the core saturated and change the FRA curve in the low frequency range, to get the accurate FRA results of the winding, amplifying the input voltage is not needed.

Figure 4.
The frequency response analysis (FRA) measurement system with two different connections. (a) End to end open-circuit connection. (b) End to end short-circuit connection.
3. SFI Measurement and Results Analysis of an Onsite Transformer
3.1. Experiment Setup
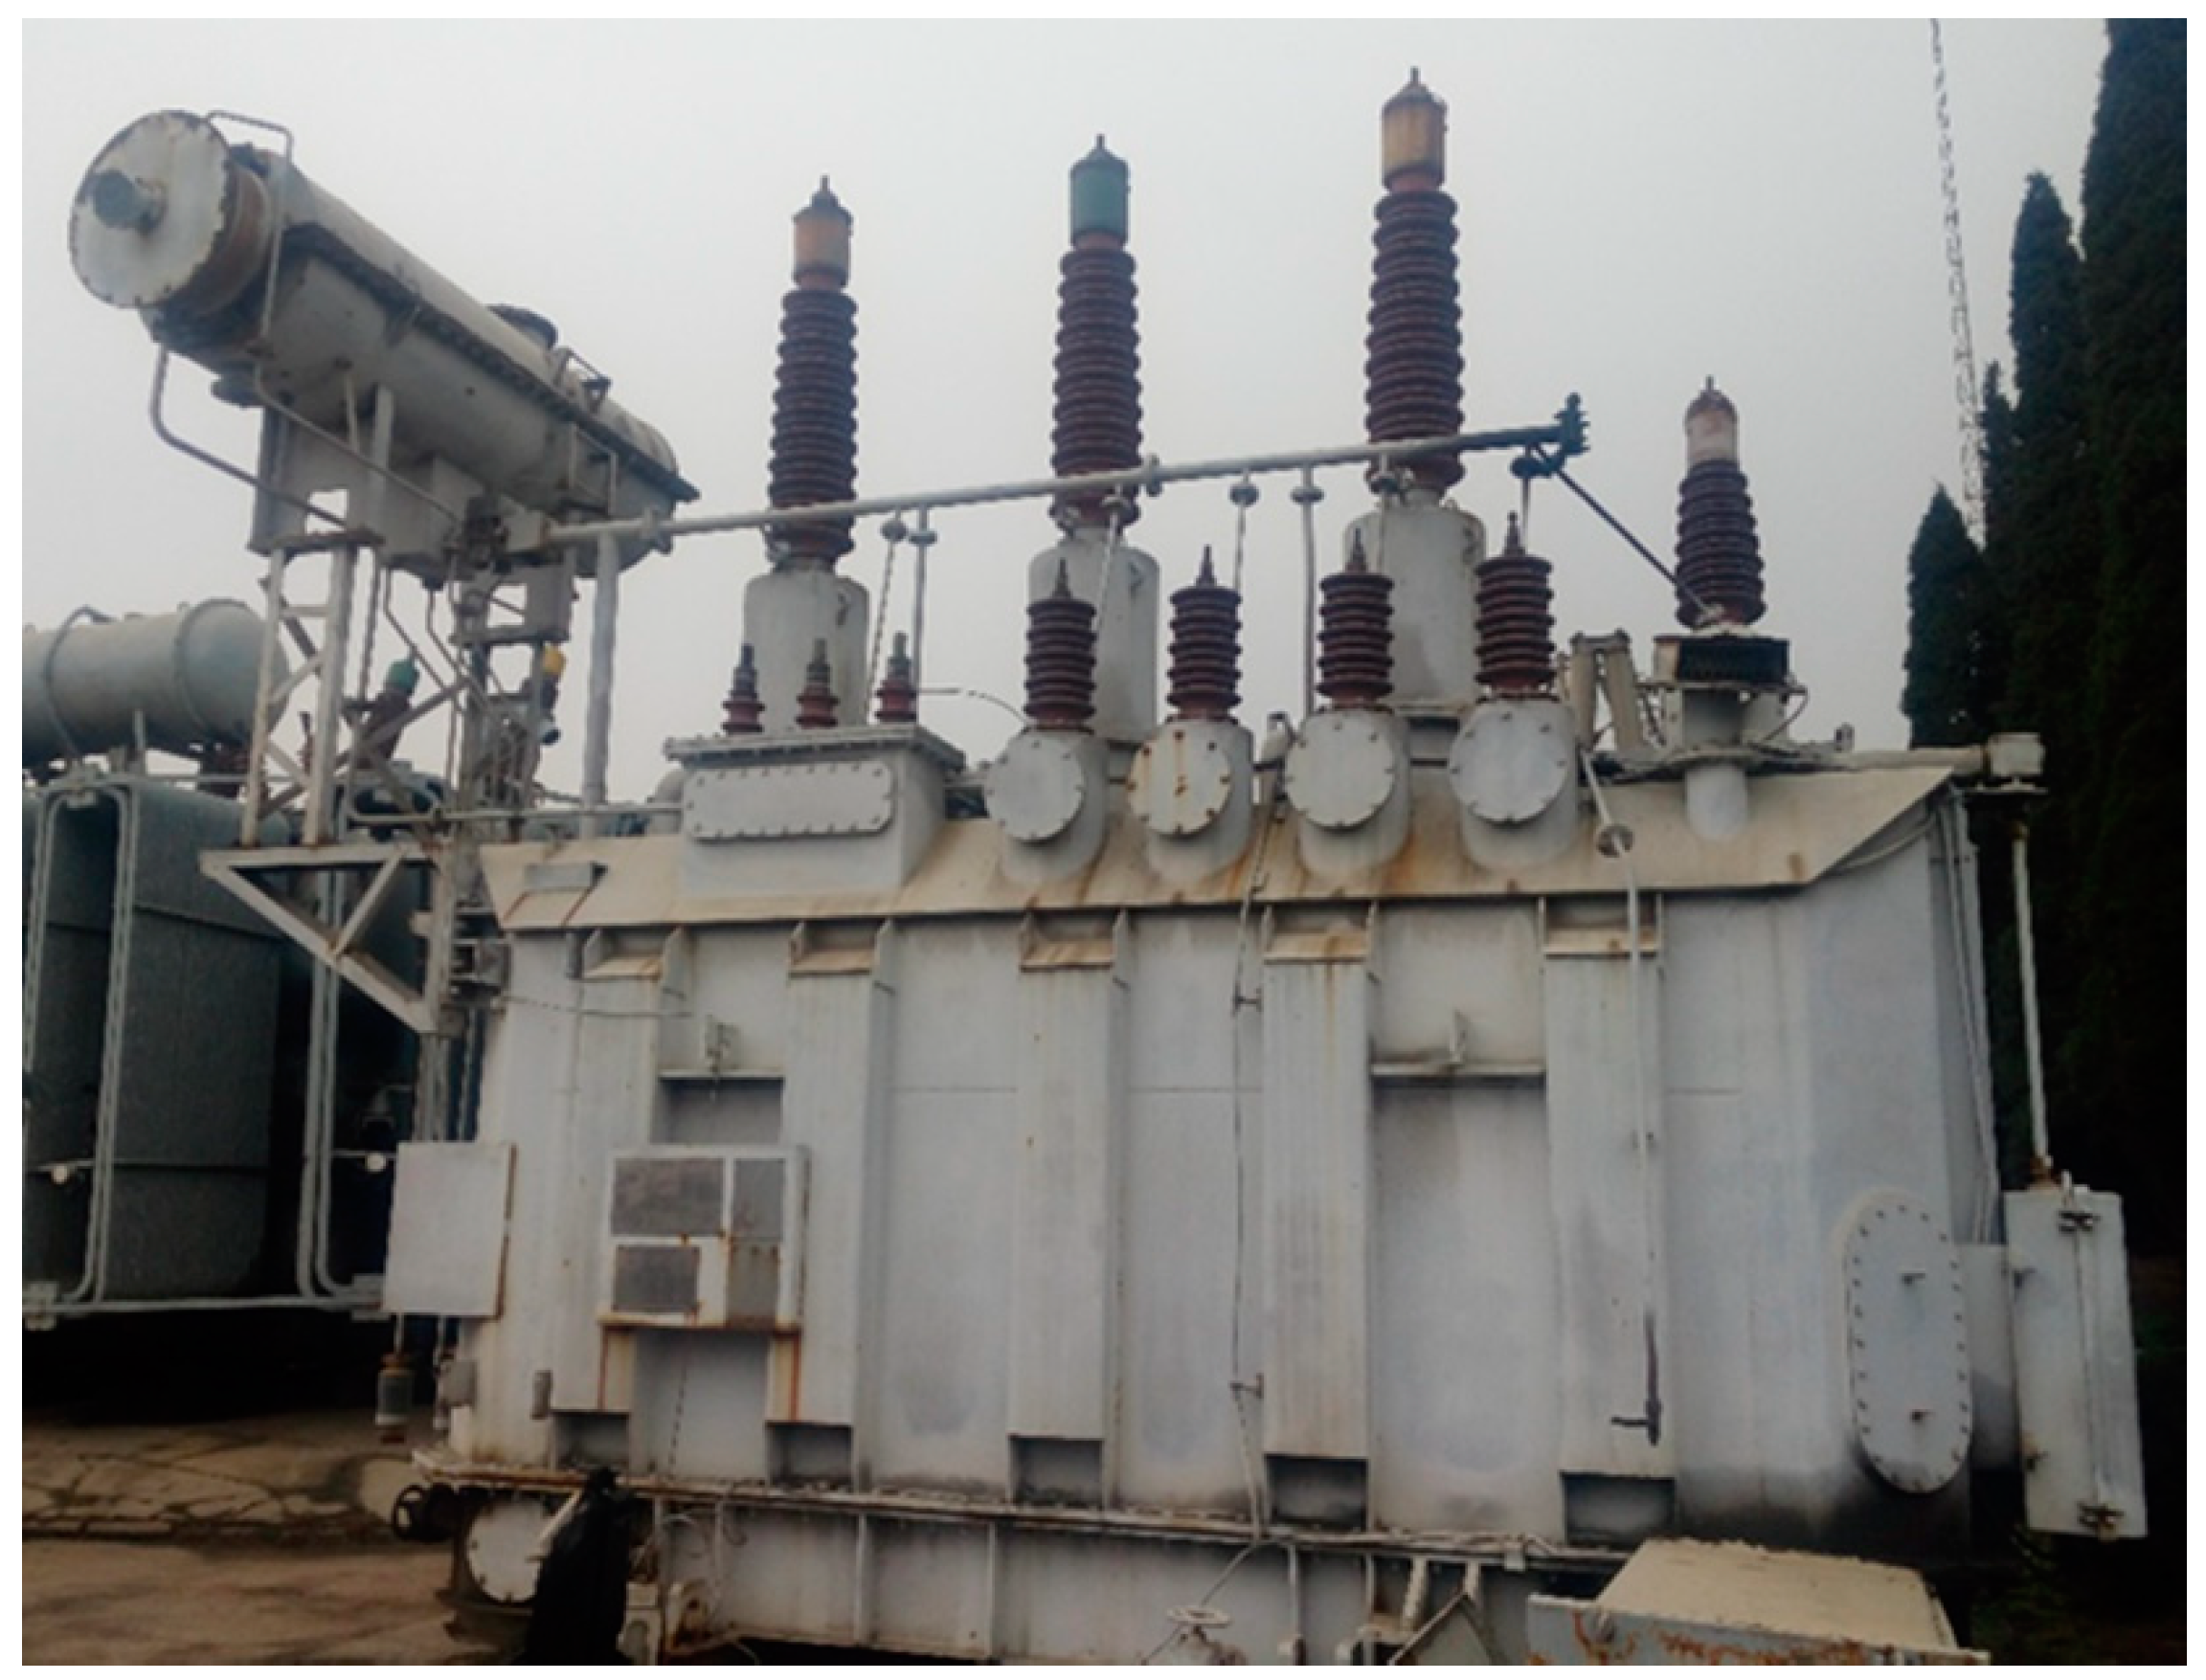
The experiment object in this study is an 110 kV onsite transformer, which contains HV, LV, and medium voltage (MV) windings, is shown in Figure 5. Detailed parameters of this transformer are listed in Table 1.
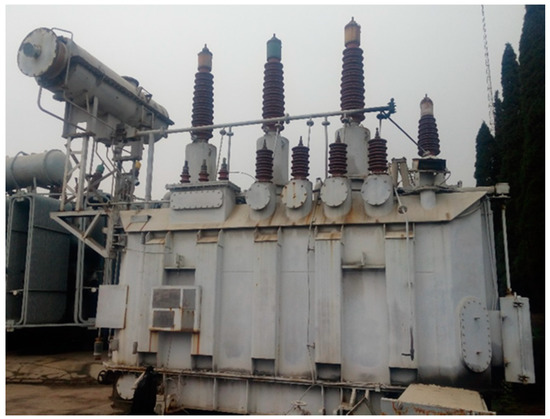
Figure 5.
The 110 kV transformer.

Table 1.
Parameters of the 110 kV transformer.
3.2. Results Analysis of the SFI Measurement
According to the measurement principle of the SFI method, it can be known that SFI measurements should be conducted on the HV winding with the LV winding shorted. For this transformer, because voltages of the HV and MV windings are both larger than that of the LV winding and voltage of HV winding is also larger than that of the MV winding, so there will be three different SFI measurement modes for this experimental transformer, i.e., “HV to MV”, “MV to LV”, and “HV to LV”. It is “HV to MV” mode when the HV winding is measured with MV winding shorted. To clearly explain the “HV-MV”, “MV-LV”, and “HV-LV” measurement connections, the schematic diagram of “HV to LV”, “MV to LV”, and “HV-LV” modes is presented in Figure 6.

Figure 6.
The schematic diagram of “high voltage (HV) to low voltage (LV)”, “medium voltage (MV) to LV”, and “HV-LV” modes.
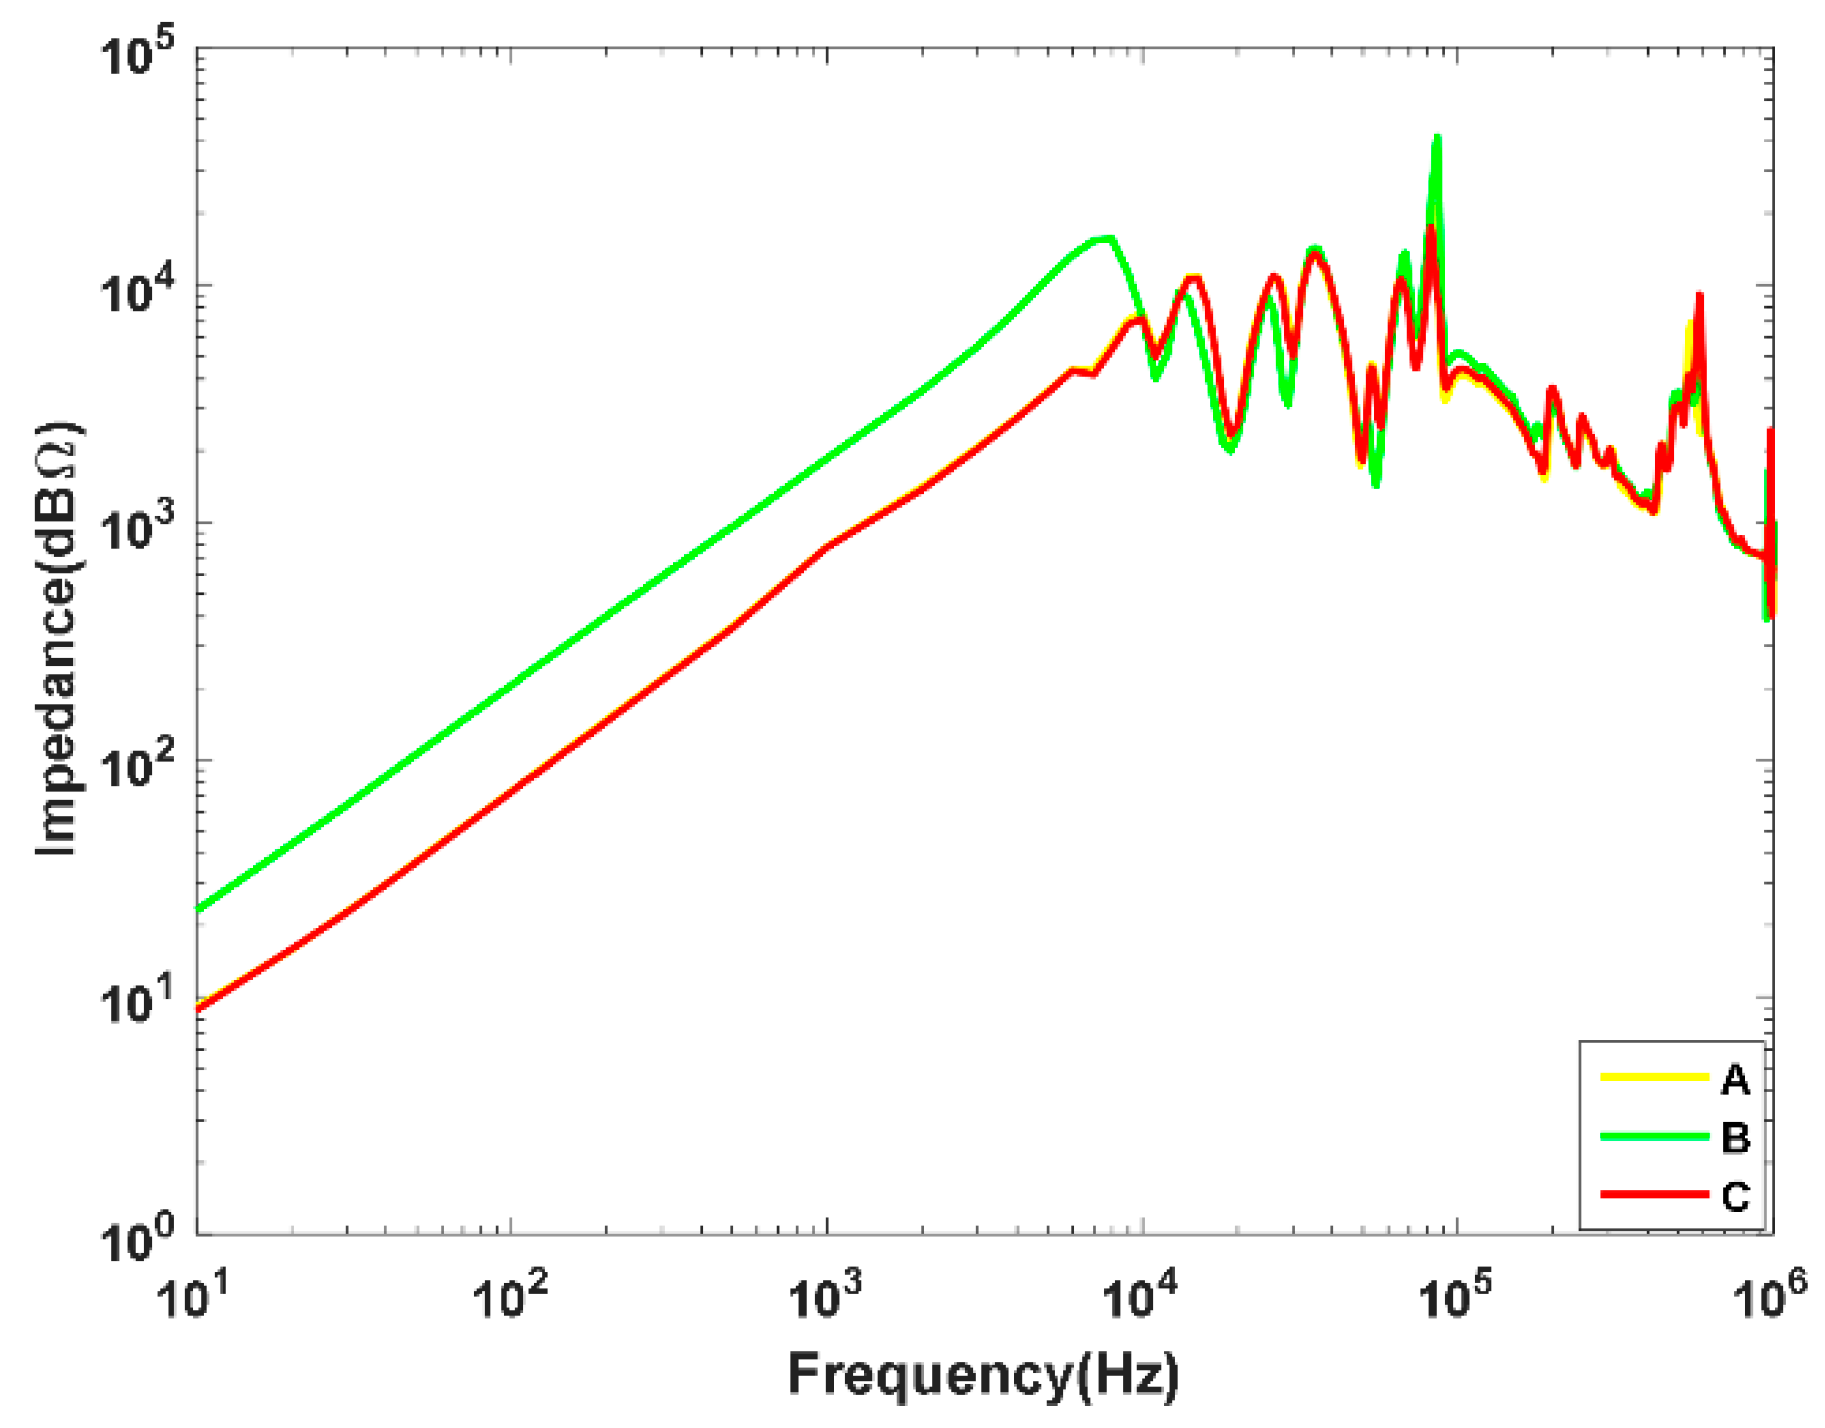
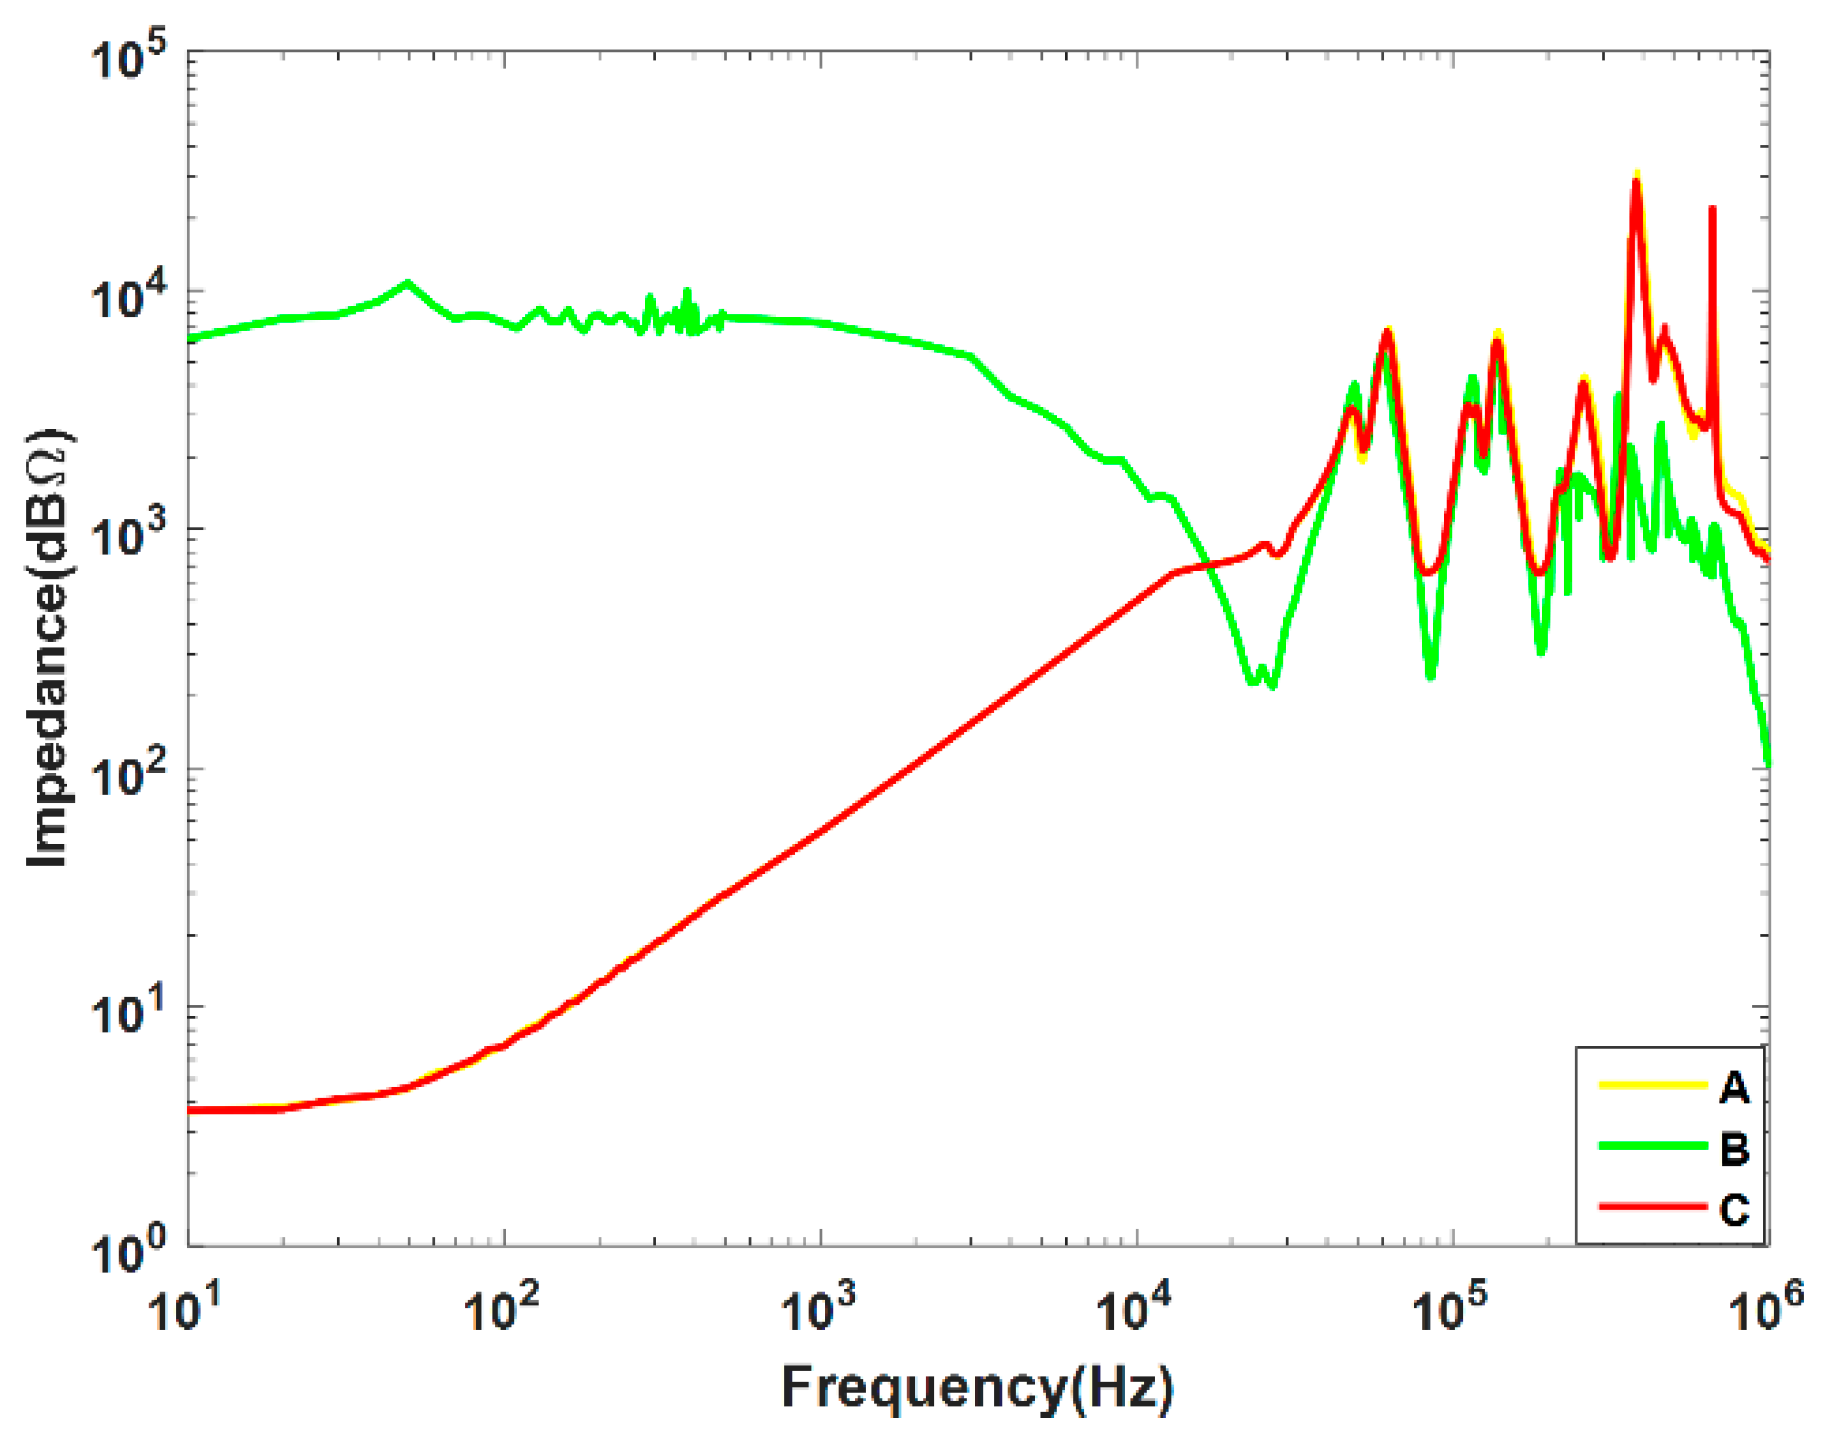
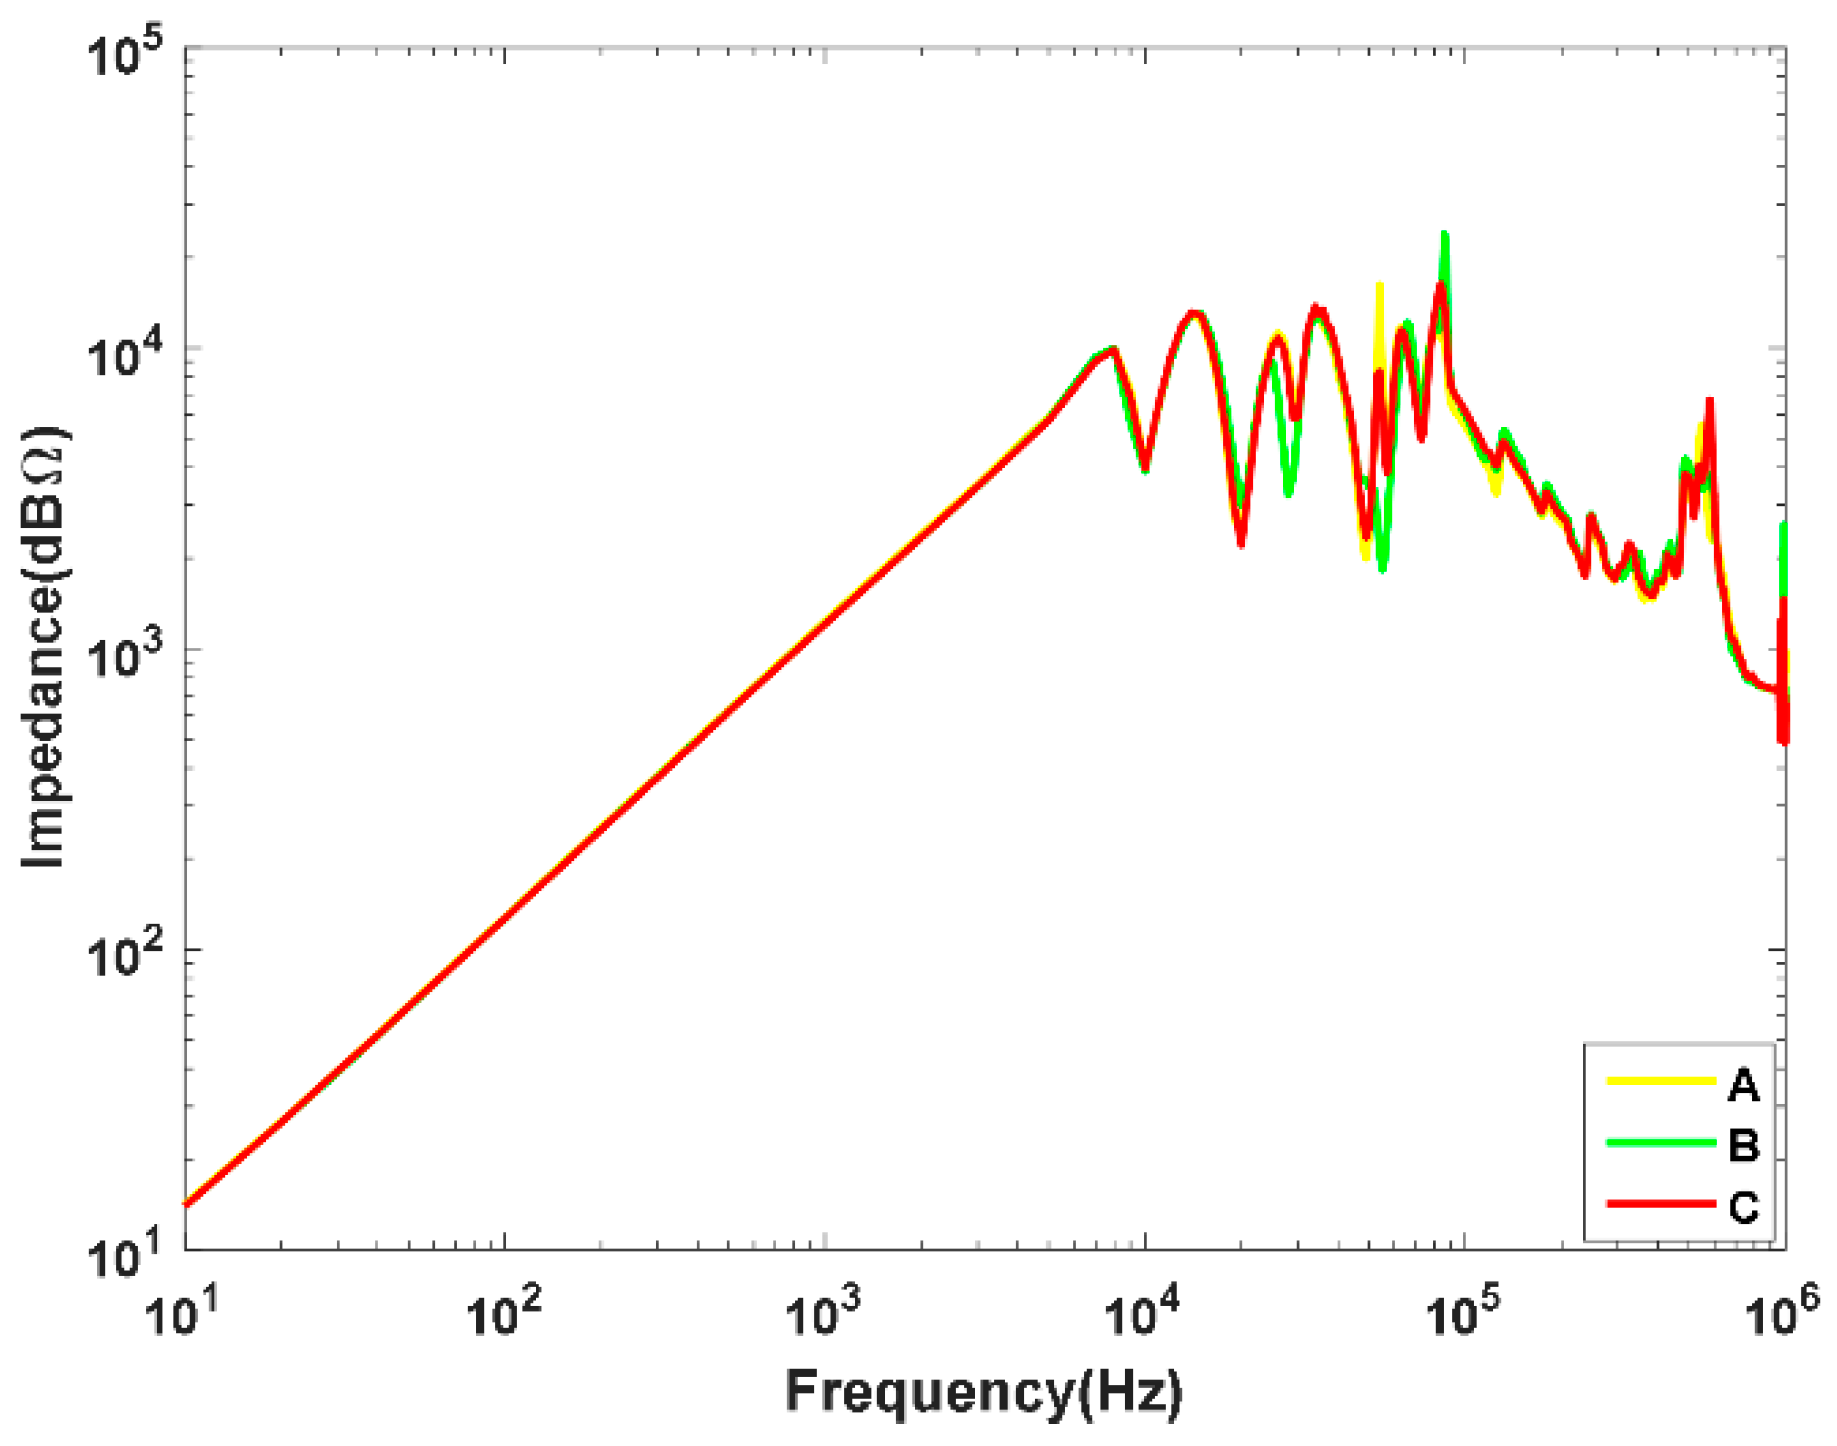
As SFI measurements have not been conducted on this transformer before, there is no original SFI reference data. Therefore, the comparison of the SFI test results can be made between the phases due to the symmetry. This comparison way is called construction-based method and it is suggested by [18]. The SFI curves of three phases of the transformer winding under the three modes are shown in Figure 7, Figure 8 and Figure 9, respectively. At the same time, to accurately analyze the variations of the SFI curves, the numerical index RF used in FRA field is applied. The calculated values of RF for the phases under three modes are, respectively, shown in Table 2, Table 3 and Table 4. The detailed calculation equations of the RF and relationship between deformation degree and the corresponding values of RF are given in Appendix A.
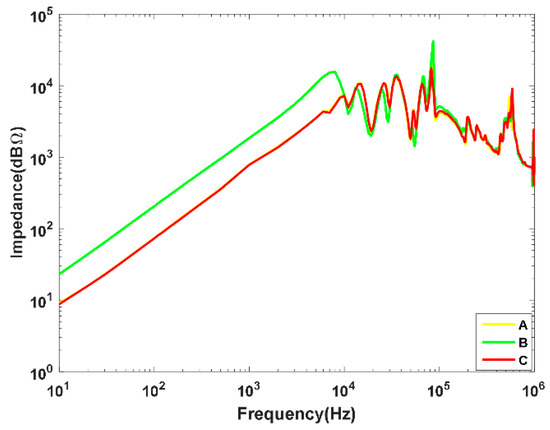
Figure 7.
The SFI curves of three phases of the transformer winding under “HV-MV” mode.
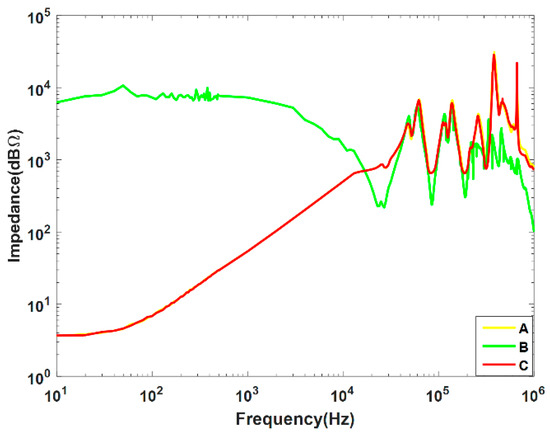
Figure 8.
The SFI curves of three phases of the transformer winding under “MV-LV” mode.
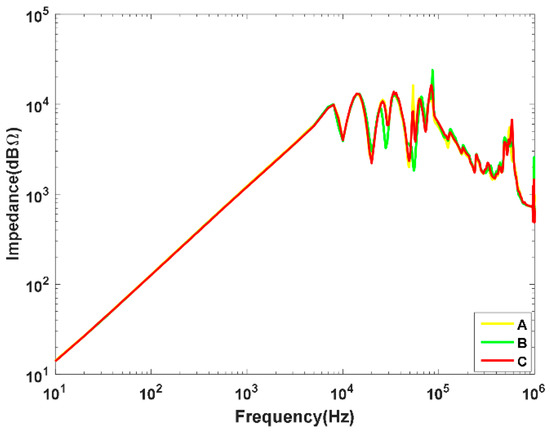
Figure 9.
The SFI curves of three phases of the transformer winding under “HV-LV” mode.

Table 2.
The values of RF under “HV-MV” mode.

Table 3.
The values of RF under “MV-LV” mode.

Table 4.
The values of RF under “HV-LV” mode.
Here, the RF of the SFI curve under different modes and the percentage impedance results obtained from the SFI test will be comprehensively analyzed to determine the deformation of the winding. In Figure 7, the SFI curves of phase A and phase C under “HV-MV” mode have good consistency in the whole frequency range. Additionally, in Table 2, the values of RFCA in the low frequency (LF), medium frequency (MF), and high frequency (HF) ranges all satisfy the RF values of the normal winding according to the relationship between deformation degree and the values of RF in Table A1. The above results indicate that HV or LV winding of phase A and phase C may be healthy. Differently, the SFI results of phase B at low frequencies from 10 Hz to 9 kHz in Figure 6 are larger than that of the other two phases and the values of RFAB and RFBC in the LF and MF ranges all conform to the RF values of the moderate deformation. It means that HV or MV winding of phase B may be faulty.
To obtain the accurate diagnosis results, the SFI curves in Figure 8 and Figure 9 and the values of RF under “MV-LV” and “HV-LV” modes in Table 3 and Table 4 are deeply analyzed. In Figure 8, the SFI curves of phase A under “MV to LV” mode is also in good agreement with those of phase C, which is similar to the SFI curves of phases A and C in Figure 7. Additionally, the values of RFCA in the whole frequency range show the MV or LV windings of phases A and C are healthy. However, the SFI curve of phase B under “MV to LV” mode shows a big difference from the SFI results of phase A and phase C. Especially, the changing trend of this SFI curve from 10 Hz to 40 kHz is opposite to those of phase A and phase C and the impedance values of phase B in this range are extremely large. The values of RFAB and RFBC in the whole frequency range are very small and they indicate that severe failure may occur in MV or LV windings of phases A, B, and C. However, since MV or LV windings of phases A and C are healthy, only MV or LV winding of phase B seems to be faulty.
According to the results in Figure 9 and Table 4, it can be easily seen that all the SFI curves of three phases under “HV to LV” mode are in good agreement with each other and the values of RF are normal. Hence, it shows that HV and LV windings of three phases are all healthy. At this point, summarizing the above analysis results, it can be obtained that HV and LV windings of three phases and MV windings of phase A and phase C are healthy, but MV winding of phase B deforms severely.
In addition to the SFI curves, the SFI value at power frequency simultaneously measured by the SFI test also can be used to further determine the fault. The comparison of the percentage impedance at power frequency obtained from the SFI test and the nameplate are given in Table 5. The deviation of the percentage impedance of “HV to LV” at power frequency measured by the SFI test is close to that obtained from the nameplate. It shows that the HV and LV winding are healthy. However, the deviations of the percentage impedance of “HV to MV” and “MV to LV” at power frequency are 62.42% and 176.09%, respectively, which are much larger than the maximum permitted change value (3%). Combining our judgment on the state of HV and LV windings, we can get that only MV winding faults occur. This diagnostic result is similar to the result obtained through analysis of the SFI curve.

Table 5.
A comparison of percentage impedance at power frequency obtained from the SFI test and the nameplate.
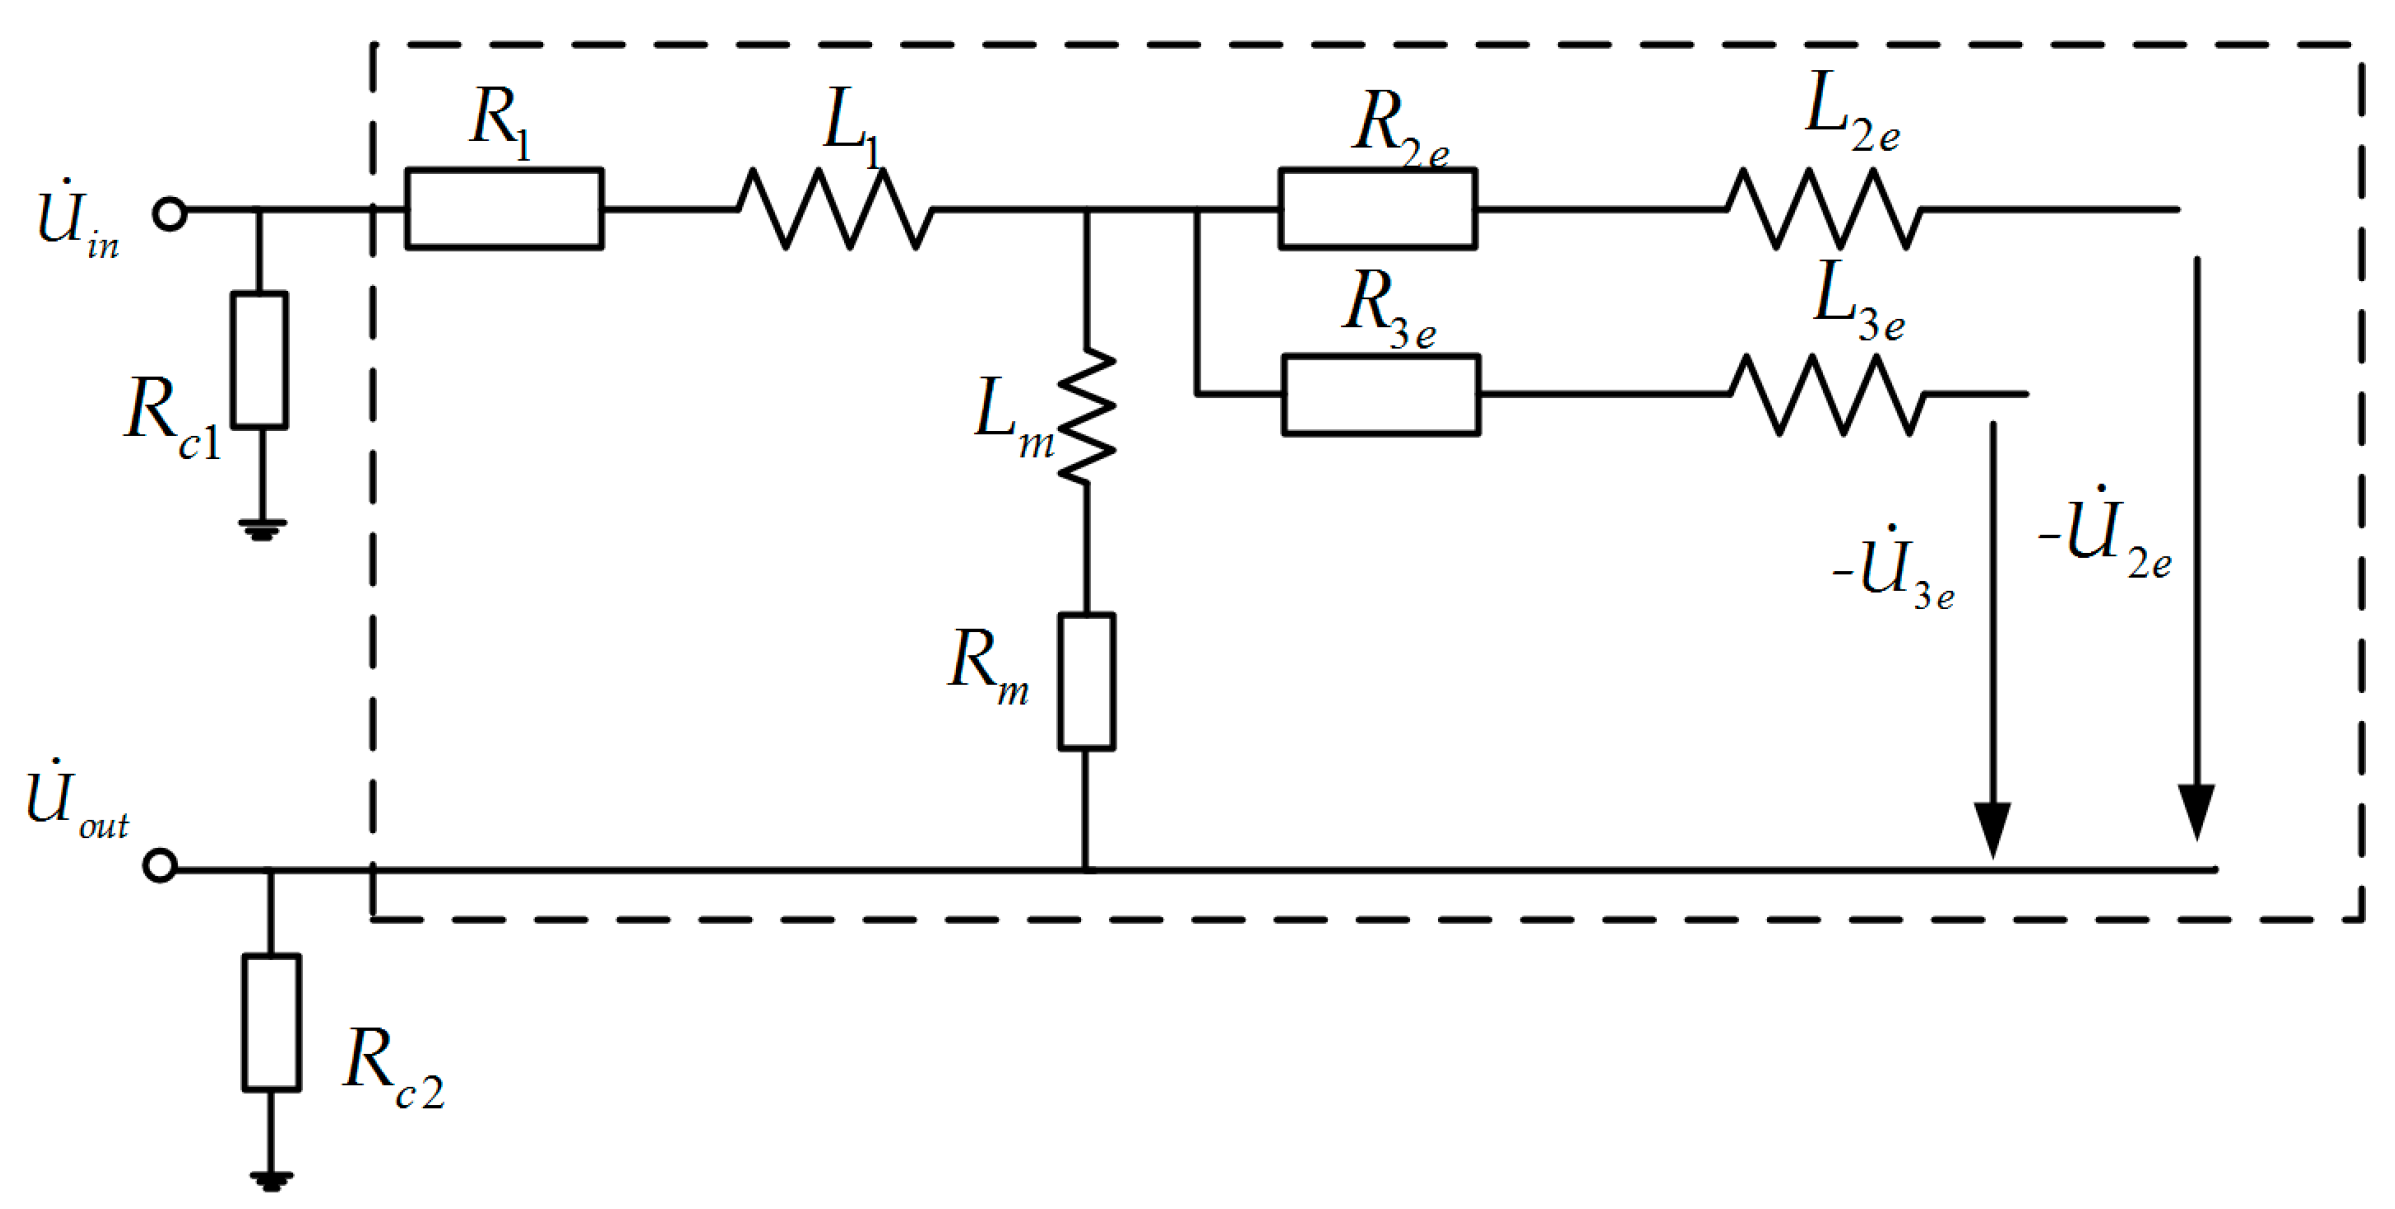
Finally, based on the changing law of the SFI curve under “HV to MV” and “MV to LV” modes and the significantly increased percentage impedances of “HV to MV” and “MV to LV” at power frequency, we can determine that an open-circuit fault occurs in the MV winding of phase B. The reason is given through analysis of the simplified equivalent circuit of the transformer, as shown in Figure 10. For the SFI test under “HV to MV” mode, when the MV winding of phase B is open-circuit, the SCI of the winding mainly depends on the magnetizing inductance Lm and resistance Rm, which are much larger than the reduction inductance L2e and resistance R2e of the MV winding from the HV side. Therefore, the percentage impedance of “HV to MV” measured by SFI test is larger than the normal value in the nameplate. For the SFI test under “MV to LV” mode, when the MV winding of phase B is open-circuit, the output voltage measured from one terminal of the MV winding will be a very small inductive voltage and it will increase with the increasing of the frequency. Therefore, according to the relationship between the impedance and the input/output voltage expressed in Equation (3), the SFI value greatly increases and the SFI curve in Figure 8 shows a very different changing trend at 10 Hz to 10 kHz.
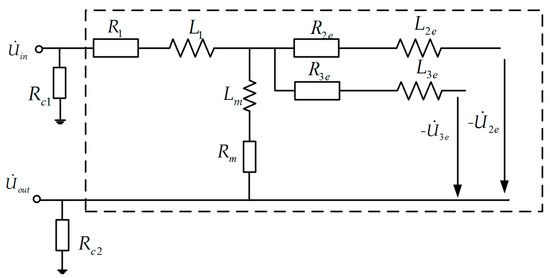
Figure 10.
The simplified equivalent circuit of the transformer winding in the low frequency range.
4. The Validation of the SFI Results by SCI and Winding Resistance Measurement Methods
In this section, first, the accuracy of the SFI values at power frequency obtained by SFI test is validated by means of the SCI test. Second, the winding resistance measurement is used to verify the accuracy of the above diagnostic results.
4.1. Results of the SCI Measurement
The comparison of the percentage impedance at power frequency obtained from the SFI test and the SCI test is shown in Table 6. It can be observed that deviation of the percentage impedance at power frequency is very small. The SFI value at power frequency measured by SFI test is accurate. Consequently, it can be considered as an important feature value to assess mechanical condition of the transformer.

Table 6.
A comparison of percentage impedance at power frequency obtained from the SFI test and the SCI test.
4.2. Results of the Winding Resistance Measurement
The winding resistance measurement is a very useful and sensitive approach to detect the integrity of the conductive loop, breakage of wires, loose connection, and tap changer contact condition [26]. The measured winding resistance is needed to compare with the historical data or between phases. Variations of more than 5% may indicate a damaged conductor in a winding [27]. It should be noticed that, first, since the winding resistance varies with temperature, the temperature should be recorded during each resistance test and the measured resistance must be converted to the reference temperature for the future comparison. Second, since the winding resistance test may generate residual magnetism inside the transformer winding, the resistance winding test should be carried out after the SFI and SCI tests.
The measured winding resistances and the comparison between phases are shown in Table 7. It is easily seen that the unbalanced coefficients of three phases in HV winding and LV winding are very small, which are less than 5%. It indicates the resistance values of HV and LV windings are normal. However, surprisingly, when the resistance test is conducted on the MV winding of phase B, the test current cannot be loaded on the winding successfully and the test device always shows “current loading failed”. This phenomenon clearly indicates that the conductive loop of MV winding of phase B is not closed. The MV winding of phase B is open-circuit. This diagnostic result is consistent with the result obtained by SFI method in Section 3.

Table 7.
A comparison of the winding resistance between phases (20 °C).
5. Conclusions
In this paper, the SFI method was used to detect the deformation of an onsite 110 kV transformer. By analyzing the SFI curve and SFI value at power frequency, which are simultaneously obtained through an SFI test, the open-circuit fault of the MV winding of phase B was determined. Meanwhile, the accuracy of the diagnostic result obtained by the SFI method was sufficiently validated by the SCI and winding resistance measurements. The experimental study performed in this paper demonstrates that the SFI method is capable of assessing the typical deformation of the onsite transformer winding effectively and accurately. Besides, the contribution of this paper not only can enrich and extend the SFI method research which is in the early stage but also could provide the technician with the analysis method of the open-circuit fault of the winding based on the SFI results.
Author Contributions
S.W. (Song Wang) wrote the manuscript; S.W. (Shuang Wang) undertook data analysis by using the numerical indicator; Y.C. and J.L. provided us with the idea and aim of this research; F.R. is responsible for conducting the experiments; S.J. and S.W. (Shuhong Wang) reviewed the manuscript. All authors have read and agreed to the published version of the manuscript.
Funding
This research is supported by the National Key Research and Development Plan of China under Grant No. 2016 YFC 0800100.
Acknowledgments
The authors appreciate Jiaozuo Power Supply Co., Ltd. for providing us with invaluable guidance for the application of transformer winding fault detection.
Conflicts of Interest
The authors declare no conflict of interest.
Appendix A
The calculation equations of the RF are expressed in Equations (A1) to (A5) [15]. Additionally, the relationship between the deformation degree and the corresponding values of RF is given in Table A1.
where, the PXY is the normalization covariance factor. It can be calculated as:
where, X(i) and Y(i) are the ith elements of the fingerprint and measured SFI traces, respectively, and N is the number of the frequency points.

Table A1.
The relationship between the degree of the deformation and the values of the corresponding relative factor (RF) [15,21].
Table A1.
The relationship between the degree of the deformation and the values of the corresponding relative factor (RF) [15,21].
| Degree of the Deformation | Relative Factor |
|---|---|
| Severe | RFLF < 0.6 |
| Moderate | 1.0 > RFLF ≥ 0.6 or RFMF < 1.0 |
| Slight | 2.0 > RFLF ≥ 1.0 or 0.6 ≤ RFMF < 1.0 |
| Normal winding | RFLF ≥ 2.0, RFMF ≥ 1.0, and RFHF ≥ 0.6 |
LF, MF, and HF are 1 kHz–100 kHz, 100 kHz–600 kHz, and 600 kHz–1000 kHz, respectively.
References
- Florkowski, M.; Furgal, J. Transformer winding defects identification based on a high frequency method. Meas. Sci. Technol. 2007, 18, 2827–2835. [Google Scholar] [CrossRef]
- Bagheri, M.; Naderi, M.S.; Blackburn, T.; Phung, T. FRA vs. Short Circuit Impedance Measurement in Detection of Mechanical Defects within Large Power Transformer. In Proceedings of the Conference Record of the 2012 IEEE International Symposium on Electrical Insulation, San Juan, PR, USA, 10–13 June 2012; pp. 301–305. [Google Scholar] [CrossRef]
- Yang, Q.; Su, P.; Chen, Y. Comparison of Impulse Wave and Sweep Frequency Response Analysis Methods for Diagnosis of Transformer Winding Faults. Energies 2017, 10, 431. [Google Scholar] [CrossRef]
- Questionnaire of CIGRE WG A2.37. Transformer Reliability Survey. November 2011. Available online: http://www.uni-stuttgart.de/ieh/wga237.html (accessed on 8 November 2011).
- Gomez-Luna, E.; Aponte, M.G.; Gonzalez-Garcia, C.; Pleite, G.J. Current status and future trends in frequency-response analysis with a transformer in service. IEEE Trans. Power Deliv. 2013, 28, 1024–1031. [Google Scholar] [CrossRef]
- Dick, E.P.; Erven, C.C. Transformer Diagnostic Testing by Frequency Response Analysis. IEEE Trans. Power Appar. Syst. 1978, 6, 2144–2153. [Google Scholar] [CrossRef]
- Islam, S.M. Detection of Shorted Turns and Winding Movements in Large Power Transformers Using Frequency Response Analysis. In Proceedings of the Power Engineering Society Winter Meeting, Singapore, 23–27 January 2000. [Google Scholar]
- Wang, S.; Wang, S.H.; Feng, H.K.; Guo, Z.; Wang, S.; Li, H.L. A New Interpretation of FRA Results by Sensitivity Analysis Method of Two FRA Measurement Connection Ways. IEEE Trans. Magn. 2018, 54, 1–4. [Google Scholar] [CrossRef]
- Hashemnia, N.; Abu-Siada, A.; Islam, S. Improved Power Transformer Winding Fault Detection using FRA Diagnostics—Part 1: Axial Displacement Simulation. IEEE Trans. Dielectr. Electr. Insul. 2015, 22, 556–563. [Google Scholar] [CrossRef]
- Aljohani, O.; Abu-Siada, A. Application of Digital Image Processing to Detect Short Circuit Turns in Power Transformers using Frequency Response Analysis. IEEE Trans. Ind. Inform. 2016, 12, 2062–2073. [Google Scholar] [CrossRef]
- Zhang, Z.; Gao, W.; Kari, T.; Lin, H. Identification of Power Transformer Winding Fault Types by a Hierarchical Dimension Reduction Classifier. Energies 2018, 11, 2434. [Google Scholar] [CrossRef]
- Gonzales, J.C.; Mombello, E.E. Fault Interpretation Algorithm Using Frequency-Response Analysis of Power Transformers. IEEE Trans. Power Deliv. 2016, 31, 1034–1042. [Google Scholar] [CrossRef]
- Banaszak, S.; Szoka, W. Cross Test Comparison in Transformer Windings Frequency Response Analysis. Energies 2018, 11, 1349. [Google Scholar] [CrossRef]
- Banaszak, S.; Gawrylczyk, K.M.; Trela, K. Frequency Response Modelling of Transformer Windings Connected in Parallel. Energies 2020, 13, 1395. [Google Scholar] [CrossRef]
- DL/T911-2004, Frequency Response Analysis on Winding Deformation of Power Transformers. The Electric Power Industry Standard of People’s Republic of China, ICS27.100, F24. Document No. 15182-2005, 1 June 2005.
- Mechanical Condition Assessment of Transformer Windings Using Frequency Response Analysis (FRA); CIGRÉ WG A2.26; Technical Brochure 342; CIGRE: Paris, France, 2008; ISBN 978-2-85873-030-8.
- IEC. IEC 60076-18: Power Transformers—Part 18 Measurement of Frequency Response; IEC Standard: Geneve, Swietzerland, 2012. [Google Scholar]
- IEEE Power and Energy Society. IEEE Guide for the Application and Interpretation of Frequency Response Analysis for Oil-Immersed Transformers; IEEE Standard Association: New York, NY, USA, 2013. [Google Scholar]
- Bagheri, M.; Naderi, M.S.; Blackburn, T.; Phung, T. Frequency response analysis and short-circuit impedance measurement in detection of winding deformation within power transformers. IEEE Electr. Insul. Mag. 2013, 29, 33–40. [Google Scholar] [CrossRef]
- IEEE Power and Energy Society. IEEE Guide for Diagnostic Field Testing of Fluid-Filled Power Transformers, Regulators, and Reactors; IEEE Std. C57.152-2013: New York, NY, USA, 2013. [Google Scholar]
- Liu, Y.; Ji, S.; Yang, F.; Cui, Y.; Zhu, L.; Rao, Z.; Ke, C.; Yang, X. A Study of the Sweep Frequency Impedance Method and Its Application in the Detection of Internal Winding Short Circuit Faults in Power Transformers. IEEE Trans. Dielectr. Electr. Insul. 2015, 22, 2046–2056. [Google Scholar] [CrossRef]
- Yang, F.; Ji, S.; Liu, Y.; Zhang, F. Research of Sweep Frequency Impedance to Determine Transformer Winding Deformation After Short-Circuit Impact. In Proceedings of the Conference Record of the 2016 IEEE International Power Modulator and High Voltage Conference (IPMHVC), San Francisco, CA, USA, 5–9 July 2016; pp. 68–72. [Google Scholar] [CrossRef]
- Behjat, V.; Mahvi, M. Statistical approach for interpretation of power transformers frequency response analysis results. IET Sci. Meas. Technol. 2015, 9, 367–375. [Google Scholar] [CrossRef]
- Kim, J.W.; Park, B.; Jeong, S.C.; Kim, S.W.; Park, P. Fault diagnosis of a power transformer using an improved frequency-response analysis. IEEE Trans. Power Deliv. 2005, 20, 169–178. [Google Scholar] [CrossRef]
- Samimi, M.H.; Tenbohlen, S.; Akmal, A.A.S.; Mohseni, H. Evaluation of numerical indices for the assessment of transformer frequency response. IET Gener. Transm. Distrib. 2017, 11, 218–227. [Google Scholar] [CrossRef]
- Islam, M.M.; Lee, G.; Hettiwatte, S.N. A review of condition monitoring techniques and diagnostic tests for lifetime estimation of power transformers. Electr. Eng. 2017, 100, 581–605. Available online: https://doi.org/10.1007/s00202-017-0532-4 (accessed on 1 May 2019). [CrossRef]
- Wang, M.; Vandermaar, A.J.; Srivastava, K.D. Review of condition assessment of power transformers in service. IEEE Electr. Insul. Mag. 2002, 18, 12–25. [Google Scholar] [CrossRef]
© 2020 by the authors. Licensee MDPI, Basel, Switzerland. This article is an open access article distributed under the terms and conditions of the Creative Commons Attribution (CC BY) license (http://creativecommons.org/licenses/by/4.0/).

