Abstract
The purpose of this study is to analyze the factors that affect CO2 emissions in the electricity generation sector in 36 OECD countries during the periods 1995–2008 and 2008–2017. This paper utilized Logarithmic Mean Divisia Index method for decomposing CO2 emission into economic activity, electricity intensity that represents demand policy effort, the share of thermal generation, the mix of thermal generation, thermal efficiency that represent supply policy efforts, and carbon emission coefficient. The results showed that EU nations achieved a higher level of CO2 reduction compared to that of non-EU nations. Regarding the policy factors, the decrease in the share of thermal generation served as the key driver, followed by the decrease in electricity intensity via improvements in energy consumption efficiency. Most non-EU countries such as South Korea, Chile, Mexico, Turkey, and Japan demonstrated an increasing trend of carbon emission during this period, which could be attributed to the changes in the generation mix on the supply side or the electricity intensity on the demand side. Increase in electricity price was confirmed to cause lower electricity intensity. South Korea had the largest amount of carbon emission among OECD countries and maintained one of the lowest electricity retail prices among OECD countries.
1. Introduction
There has been a fundamental shift in the way how governments approach energy-related environmental issues around the globe. Global warming and climate change have become a serious issue since the late 1980s [1]. Many researchers proved that human activities, such as the increased consumption of fossil fuels, have led to global warming and climate change, and the major cause of these environmental disasters is the increase in greenhouse gases (GHG) [2].
Among the six kinds of GHG, the factor that contributes the most to the greenhouse effect is carbon dioxide (CO2) [1]. Thus, any effort to reduce CO2 emissions and mitigate climate change calls for global action. At the beginning of these movements, binding targets for developed countries, “Annex I Parties,” set to limit or reduce CO2 emissions by the Kyoto Protocol in 1997 [3]. Recently, UN climate negotiations Conference of the Parties (COP) 22 (in 2016) in Marrakesh, Morocco, following the successful outcome of the Paris meeting, showed supranational effort of reducing CO2 emissions [4].
Despite the efforts, the CO2 emission from fuel combustion has recently reached an all-time high. The CO2 emission from electricity generation is in a slight downward trend, but still takes up the majority in fuel combustion (approximately 65%, Figure 1) [5].
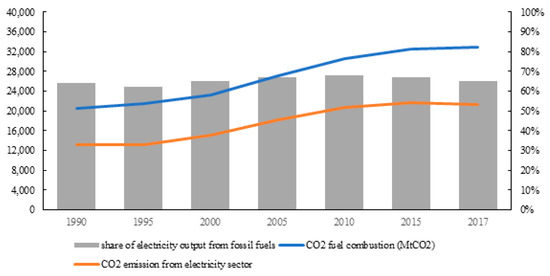
Figure 1.
CO2 emission from fuel combustion and the electricity sector [5].
The EU is at the forefront of reducing CO2 emissions in the electricity generation sector. The EU has promoted renewable generation and induced power savings by imposing large amount of taxes on top of the electricity price on the grounds of environment protection and achieved remarkable reduction results. However, unlike the EU countries, some non-EU OECD countries, including South Korea, have witnessed increases in carbon emission. Korea had the largest increment in carbon emission in the electricity generation sector, which has steadily increased since 1995.
In general, economic growth in developed countries causes a shift in the industrial structure, where energy-intensive industries are transferred to developing countries, and the energy intensity in the former countries tends to drop [6,7]. However, in the case of South Korea, even after achieving an advanced economy, electrification has occurred in all areas of manufacturing and service, causing steady increase in energy intensity. Besides, the development of Information and Communication Technology sector and low electricity price accelerated the electrification of the industries [8,9]. In China, whose main industries are manufacturing, raw materials, and chemicals, energy consumption has also continued to increase in the last 30 years since 1990, and electrification continues to occur in all industries [10].
The purpose of this study is to decompose the driving factors of CO2 emission caused by the electricity generation sector and compare them by country, so that the effect of each country’s policy could be identified. A review of previous literature indicates that case studies that decomposed CO2 emission in the electricity generation sector and observed the influence of various factors were mainly composed of analysis of only a handful of countries, and the countries of interest were mainly developing countries such as China, and those in Southeast Asia and the Middle East [11,12,13,14]. Several recent studies that decomposed CO2 emission from the energy sector in developed countries [15] analyzed CO2 emission at the country level instead of at the sectoral level, and mostly utilized aggregate data of 35 OECD countries rather than using data of individual countries, making it difficult to make comparison with the results of this study. Only one study conducted a country-by-country comparison by decomposing CO2 emissions according to various factors in developed countries only in the electricity sector, and changes between 2001 and 2012 were identified in the 28 EU countries [16].
The factors behind the fluctuation of GHG emissions consist of various aspects including economic activity, efficiency, and structure, and therefore the impact of each factor should be quantitatively identified through decomposition analysis [6]. Especially in the power industry, different types of policy measures could have a varying impact on carbon emission such as the change in energy mix and improvements in thermal efficiency, so the achievements and the results of each policy could only be discussed via decomposition.
Research on the decomposition of carbon emissions have mostly used LMDI (Logarithmic Mean Divisia Index) methods [6,10,16,17,18,19]. The main investigation of this research is the decomposition of carbon emissions into structural and activity components. This study used the LMDI-I [20,21] method to decompose the changes in CO2 emissions in the electricity generation sector into six main factors to arrive at policy implications. The factors include GDP growth, changes in energy intensity, share of thermal generation, thermal generation structure, thermal efficiency of generation facilities, and changes in emission coefficient. Among these factors, since GDP growth is unrelated to policy efforts, all other factors except for GDP growth were examined, and the policies regarding each factor were evaluated on its achievements.
The factors that could change according to policy efforts can largely be grouped into two categories—the supply side and the demand side. The share of thermal generation, thermal generation structure, and thermal efficiency of generation facilities are subject to policy actions on the supply side, and the changes in energy intensity can be considered as the policy efforts on the demand side. Energy intensity is especially an important indicator of energy savings, which indicates consumption efficiency, and is bound to have great impact on the government’s retail pricing of electricity.
This study examined the factors that influenced the reduction effort of carbon emission in each country and arrived at policy implications on how to reduce carbon emissions most effectively. This study further carried out panel analysis on the relationship between electricity intensity and retail electricity price in OECD countries, to compare and suggest the future direction of retail pricing policies of electricity to reduce CO2 emission in the electricity generation sector from the perspective of the Korean market.
2. Methodology
2.1. Estimation of CO2 Emissions
This paper follows LMDI for estimating and decomposing CO2 emission from electricity generation, because the purpose of carbon decomposition in electricity fields is similar to this research. Following IPCC guidelines [1], this study estimated CO2 emission from electricity generation in a year which is shown in Equation (1).
- : Carbon emission from electricity generation
- : Energy consumption based on fuel i (TJ)
- : Carbon emission factor of the i-th fuel (t-C/TJ)
- : Fraction of the carbon oxidized based on fuel i;
- : The molecular weight ratio of carbon dioxide to carbon (44/12).
The carbon emission factors () and the fraction of carbon oxidized () are shown in Table 1 [1]. The carbon emission factors from fuel combustion have changed over time. However, this study assumed that carbon emission factors of fuels are constant since these changes are small enough to be neglected when analyzing the macro changes in CO2 emissions. The research period in this paper starts in 1995 and ends in 2017, since there are several missing observations in IEA electricity heat information before 1995. The period is separated from 1995 to 2008 and 2008 to 2017, due to carbon emission trend changes in 2008 as shown in Figure 2. The electricity fuel input and generation data were collected from IEA electricity and heat information and GDP statistics from OECD iLibrary.

Table 1.
Carbon emission factors and fraction of carbon oxidized by fuels [1].
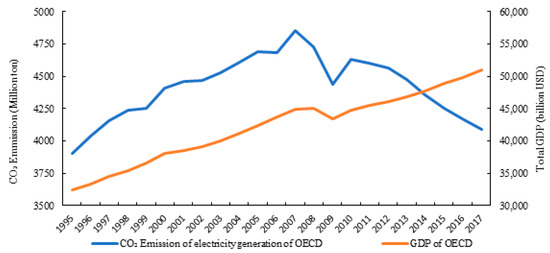
Figure 2.
Total CO2 emissions from electricity generation and GDP in OECD countries, 1995–2017.
2.2. Decomposition of CO2 Emissions
This study assumed that the CO2 emissions from electricity generation (C) consist of the following Equation (2) [22].
- : CO2 emissions from fuel i
- : Thermal power generation from fuel i
- : Total thermal power generation
- : Total electricity generation
- : Gross domestic production.
Equation (2) can be expressed differently as follows Equation (3).
- : CO2 emission coefficient of fuel i
- : Electricity generation efficiency of fuel i
- : Share of electricity generation of fuel i in total thermal power
- : Share of thermal power generation in total electricity generation
- : Electricity intensity.
Therefore, the carbon emission from electricity sector is decomposed in the perspective of CO2 emission coefficient (CF), electricity generation efficiency (EI), the structure of thermal power generation (ES, the composition ratio of fuel i in thermal power generation), the structure of electricity generation (EFS, the composition ratio of thermal power generation on total power generation), and electricity intensity (ELI).
Based on the LMDI-I method Equation (3) can be differentiated into the components in Equation (4) [20,23].
The right-hand side of Equation (3) can be represented in terms of growth rates shown in Equation (5).
and are growth rates of the CO2 emissions coefficient of each component. To estimate carbon emission changes by components, the subsequent step is to integrate both sides of Equation (5) with regard to time interval shown in Equation (6).
The function , assumed that both x and y are positive, and x and y are not equal. Missing and zero values were substituted as small bigger than zero [23].
3. Results
The CO2 emission from electricity generation in OECD countries increased by approximately 4.9% from 3.9 Bton in 1995 to 4.092 Bton in 2017. However, the trend, as can be seen in Figure 2, indicates that the emission increased by 21.2% between 1995 and 2008, but decreased by 13.4% between 2008 and 2017, forming an inverse U-shape curve. On the other hand, the GDP growth has briefly slowed down due to the global financial crisis but has continued to show constant growth overall. As of 2008, OECD countries appear to be shifting towards carbon-free growth much similar to the environmental Kuznets curve. Therefore, this study has examined the CO2 emission factors in the electricity generation sector in two separate periods: 1995–2008 and 2008–2017.
3.1. CO2 Emissions of Power Sector by OECD Countries
Figure 2 presents the growth rate of CO2 emission from the power sector for periods between 1995 and 2017 and the growth rate in 2 sub-periods by OECD countries. The countries have been placed in the order of growth rate from the smallest to largest between the years 1995 and 2017. The CO2 emission from the power sector in OECD countries has increased by approximately 4.9% from 3.9 Bton in 1995 to 4.092 Bton in 2017. 15 of the 36 countries have shown an increase in CO2 emission and the remaining 21 countries have shown a decrease, indicating that more countries have pursued reduction effort in the power sector regardless of economic growth.
During the first sub-period from 1995 to 2008, the total CO2 emission in OECD countries has increased by 21.2% from 3.9 Bton in 1995 to 4.727 Bton in 2008, showing an increase rate much higher than that of the entire period. The emission level has increased in 26 of the 36 countries, which is also higher than that of the entire period. However, in the second sub-period from 2008 to 2017, the total emission level of OECD countries had decreased by 13.4% from 4.727 Bton to 4.092 Bton. The emission increased only in 9 countries, and 27 countries had shown a decrease, offsetting most of the increased emission level in the first sub-period.
In the case of each country, the CO2 emission was found to be high in Chile, South Korea, Turkey, and Mexico, all of which have recorded the fastest economic growth between the years 1995 and 2017 (Figure 3). The total CO2 emission from the power sector of all OECD countries during this period increased by 192 Mton, whereas it increased by 408 Mton in the 4 countries, which is 3 times higher than the emission of all OECD countries combined. These 4 countries have also shown an increase in the level of CO2 emission in the years following 2008, bringing significant effect to the increase in the emission level.
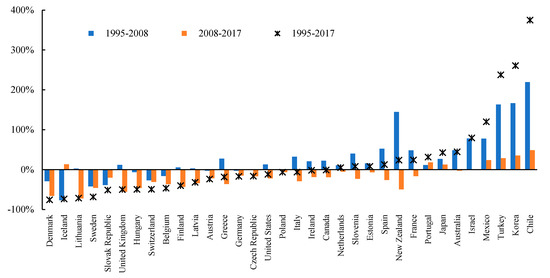
Figure 3.
CO2 emission growth rate of power sector in OECD countries, 1995–2017 and sub-periods.
However, for most of the EU countries who have pursued carbon-free policies, the CO2 emission from the power sector either decreased or was maintained at 10% level, greatly contributing to the CO2 reduction effort of OECD countries. During the 1995–2017 period, the European countries have reduced 18.4% of CO2 in the power sector, with a 25.3% reduction from the second period offsetting the 9.3% increase in the first period.
For non-EU countries excluding the 4 high emission countries aforementioned, the CO2 emission from the power sector decreased only in the United States (11.6%) and Canada (0.6%), and all other countries have shown an increase including New Zealand (23.9%), Japan (42.7%), Australia (44.7%), and Israel (79.5%) (Table 2).
Table 2.
CO2 emission changes in OECD countries, 1995–2008 and 2008–2017.
3.2. Main Factors of CO2 Emission Reduction
Table 3 presents the results of the decomposition analysis of CO2 emission factors of all OECD countries. The contribution rate of each factor during the period between 1995 and 2017 indicates that the effect of economic growth out of the total CO2 emission rate of 4.9% is 56%, a level which is 11 times higher than that of the total emission rate. However, each of these factors was offset by energy policies, and the highest level of reduction came from the electricity intensity (ELI) at 27.5%, through improvements in energy efficiency. The reduction effort was followed by improvements in thermal efficiency of electricity generation facilities at 9.4%, the change in the structure of thermal power generation facility (ES) at 7.8%, and the change in the composition ratio of thermal power generation to total power generation (EFS) at 6.5%, totaling up to 23.7% in reduction effort on the supply side.
Table 3.
The results of decomposition analysis of total OECD, 1995–2017 and sub-periods.
In the case of the changes in the emission factors in each sub-period as shown in Table 3, the GDP growth effect stands out. In the first sub-period, the level of contribution of the GDP growth rate was 39.6%, whereas it was 13.5% in the second sub-period, having decreased by approximately 1/3. This is in line with Figure 2, where the growth trend shifted to carbon-free, resulting in lower contribution of GDP.
For energy and environment policy effect, the improvement in the electricity intensity demonstrated the highest CO2 reduction effect, with 13.3% in the first sub-period and 11.7% in the second period, totaling 27.5% in the entire period. The decrease in electricity intensity indicates lower energy consumption despite the same growth rate, with the increase in energy consumption efficiency through structural changes in industries to consume less energy and implementation of more efficient production methods being the greatest causes.
For the structure of thermal generation, which is the second factor, each sub-period presents different results. In the first sub-period, the structure of thermal generation contributed to an approximate 4.4% increase in CO2 emission, whereas it contributed to an approximate 9% reduction in the second sub-period. The main cause behind this was the high level of thermal power until 2008, which is the source of CO2 emission, and the decrease in the share of fossil fuel such as coal and gas and great increase in the share of renewable energy in the power portfolio ever since. This phenomenon could be easily seen in most EU nations.
The third factor, change in the structure of thermal power generation (ES), represents the effort of changing the structure of thermal power generation by decreasing the share of coal or petroleum thermal power plants that emit large amounts of CO2 and increasing the share of gas power plants. In the first period, the contribution level was about −2.3% and −4.5% in the second sub-period, totaling −7.8% in the entire period.
The last factor is the reduction effect from improvements in thermal efficiency caused by the improvements in the efficiency of boiler in coal and gas power plants. In the first sub-period, the level of contribution was high at −7.5%, but turned out to be low in the second sub-period at −1.6%. The improvement in thermal efficiency in the case of coal power plants can be largely attributed to the shift from subcritical steam turbine to super-critical or ultra-super critical steam turbine. The commercialization of the latter was seen in the early 2000s, and therefore turned out to be high in the first period and relatively lower in the second period.
The decomposition results of emission factors of each country are presented in Figure 4 and Figure 5. In Figure 4, the level of contribution of GDP in the first sub-period ranges from 14.8% to 111.8% with the media of 48.4%, but the level of contribution by GDP growth in the second sub-period in Figure 5 seems to be substantial lower, ranging from −23.2% to 54% with the median of 10.5%.
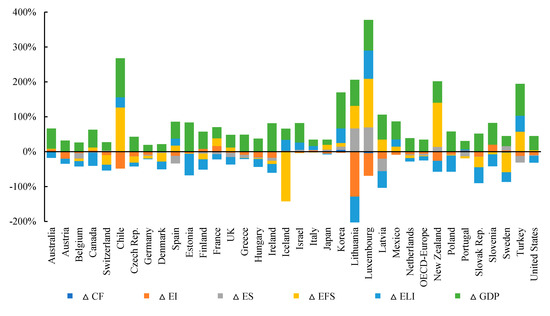
Figure 4.
Decomposition results of CO2 emission in power sector by driving factors, 1995–2008.
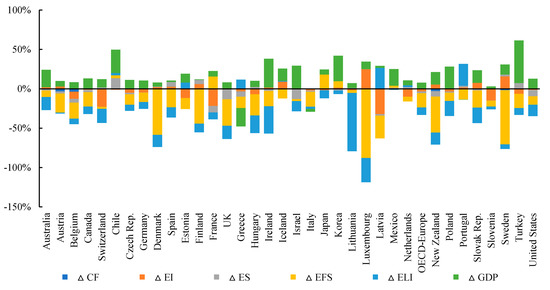
Figure 5.
Decomposition results of CO2 emission in power sector by driving factors, 2008–2017.
Most of European countries have significantly reduced carbon emission from GDP growth through various policy efforts in both sub-periods such as electricity intensity, closing down of thermal generation, and change in energy mix. The second sub-period has especially displayed low emission level from economic growth, which was greatly overwhelmed by other policy factors, ultimately leading to reduction of CO2 in most of European countries.
However, non-European countries such as Chile, Korea, Turkey, Mexico, Israel, and New Zealand showed positive contribution for aforementioned policy effects, and therefore the reduction effort of these countries seemed to be not sufficient enough compared to that of European countries. The four countries—Chile, South Korea, Turkey, and Mexico—have continued to show growth in the structure of thermal generation and the ES effect is consequently all positive (Table 4). This result reveals that these over-emission countries have retrogressed in the effort of improving generation mix to reduce CO2 emission between 1995 and 2017.
Table 4.
The results of decomposition analysis of carbon emission growth countries, 1995–2017.
3.3. Policy Effects on CO2 Emission Reduction
The decomposition analysis presents which of the CO2 emission factors have contributed the most to the emission reduction effort. However, GDP growth cannot be controlled by policy effects and is an aspect that governments try to promote. Therefore, GDP growth should be controlled in the analytical process, and emission factors should be examined for all other factors. Consequently, this study calculates the net policy effect by excluding the effect of GDP growth from the total CO2 emission growth rate and analyzed the effects of each emission factor (Since the change effect of emission coefficient cannot control the emission level, it has also been subtracted from the model. In other words, ΔCPolicy Effect = ΔCTotal − ΔCGDP − ΔCcf). The emission factor can be largely grouped into 2 categories: the policy effects on the demand side and the effects on the supply side. This study has assumed the electricity intensity (ELI), which indicates the improvements in the efficiency of energy consumption, as the policy effect on the demand side, and 3 types of effects including the structure of thermal generation (EFS), change in the structure of thermal generation (ES), and improvement in generation efficiency (EI) as the policy effects on the supply side.
Table 5 shows the results of the decomposition analysis categorized according to emission factors by each policy for all OECD countries. This table demonstrates which of the policies have been more effective in the reduction effort in each country. For overall policy effect, Chile seems to have implemented the most insufficient effort to reduce emission level, having increased CO2 emission by 168% if all policy effects are summed, followed by Korea at 67.6%, Mexico at 30.6%, Japan (In the case of Japan, all nuclear plants have been shut down after the earthquake of 2011, which were all replaced by thermal generation, leading to an increase in GHG emission. Therefore, it is inappropriate to interpret the impact as a failure of CO2 policies in the power sector) at 18.4%, Portugal at 5.1%, and Turkey at 3.9%. Excluding these 6 countries, the policy effect is negative for all other countries, indicating a significant policy effect in the CO2 reduction effort in the power sector.
Table 5.
The policy effect of CO2 emission rate of change in power sector of OECD, 1995–2017.
When the supply and demand side are compared, the policy effects slightly differ among the countries, but most of the European countries show a greater reduction effect in the supply side than that of the demand side. However, for non-European countries such as the United States, Canada, Australia, and New Zealand, the effects through the improvement in electricity intensity, the demand side, showed relatively more outstanding CO2 reduction effect when compared to the supply side.
In the case of the 4 over-emission countries, the emission can be contributed to both the supply and demand side. In the case of Chile, the contribution from the supply side increased by 130.4%, Korea by 37.3%, and Mexico by 12.3%, indicating that the electricity generation mix shifted to sources that emit more greenhouse gases between 1995 and 2017. In addition, on the demand side, the emission increased by 37.8% in Chile, 30.5% in Korea, 18.3% in Mexico, and 23.1% in Turkey, also indicating that the countries have shifted to production structure that emits large amount of energy to increase GDP.
3.3.1. Supply-Side Management Policy
Among the 3 policy effects on the supply side—structure of thermal generation, structure of electricity generation, and improvements in thermal efficiency—the most effective policy was the structure of electricity generation, meaning the change in the share of thermal generation. Figure 6 demonstrates the correlation between the individual policy effects and the fluctuation in CO2 (total policy effect), excluding the GDP effect in OECD countries. According to the results, the correlation coefficient of the share of thermal generation was 0.653, which had the greatest impact on the policy effects. The coefficients of the change in the structure of thermal generation and improvements in thermal efficiency were 0.02 and 0.01, respectively, and did not have a significant impact on policy effects. The results suggest that shifting from thermal generation to carbon-free generation including nuclear or renewable energy is more effective, rather than improving the efficiency of boilers by shifting from coal to gas.
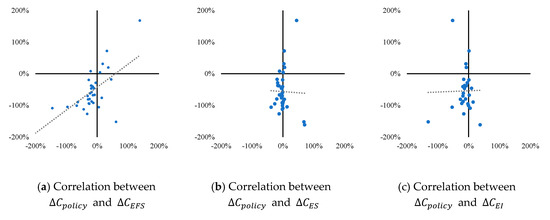
Figure 6.
Correlation between total policy effect and supply-side policy factors driving CO2 emission.
Table 6 shows the regression results of the individual supply-side policy effects on the CO2 fluctuation effect (total policy effect) or OECD countries. The coefficient of the structure of electricity generation, which resulted in the highest correlation, was significant at 1% level, while the other coefficients were insignificant. If CO2 is reduced by 1% from the reduction of the ratio of thermal generation to the total power generation, the CO2 emission from the power sector decreased by 0.714%.
Table 6.
The regression results of the supply-side policy effects on the CO2 fluctuation effect.
3.3.2. Demand-Side Management Policy
The reduction from policy effort on the demand side is the decrease in electricity intensity. Electricity intensity indicates the energy consumed to produce 1 unit of GDP, and changes in the industrial structure or energy consumption efficiency usually has an impact on electricity intensity [24,25]. Rather than being subject to policies, the changes in industrial structure are a shift from the manufacturing industry to the service industry during the process of economic development. On the other hand, improvements in energy efficiency can be evaluated as a policy factor. There are policies to induce highly efficient equipment [26], or respond to changes in prices through pricing policies of electricity [27].
Figure 7 presents the relationship between the changes in CO2 (total policy effect) and the changes due to electricity intensity after excluding the effects from GDP. The correlation between the two is 0.701, demonstrating a relatively high correlation between the two factors. This signifies that lowering electricity intensity through better efficiency had great impact on CO2 reduction in electricity generation sector.
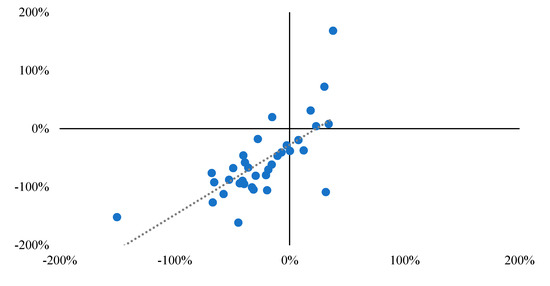
Figure 7.
Correlation between total policy effect and demand-side policy factor driving CO2 emission.
The policy that affects electricity intensity the most is the energy price [28]. If electricity price is maintained at a low level, there would not be enough incentives to save energy will be lowered, which would ultimately lead to lower investments in facilities for energy efficiency. To confirm the existence of such a phenomenon, this study has carried out regression analysis with panel data between electricity intensity and electricity price. To control for the changes in industry structure that also affects electricity intensity, the share of manufacturing has been included as an independent variable. 36 OECD countries between the years 1990 and 2017 have been selected for the analysis using the industrial electricity price from the energy prices and taxes database of IEA and the share of manufacturing in GDP from the OECD National Account Database.
The results of the estimation of Equation (7) are shown in Table 7. The electricity price and industrial structure (share of manufacturing) were significant at 1% and 10% level, respectively. The results indicate that electricity intensity decreases by 0.14% when the electricity price increases by 1% and increases by 0.08% when the share of manufacturing increases by 1%. In the case of OECD countries, when the share of manufacturing was controlled for, the increase in the electricity price significantly reduced electricity intensity. This demonstrates that maintaining a high level of electricity price through energy tax policy could induce investment in thermal efficiency and reduce CO2 emissions in the electricity generation sector in a long-term perspective.
Table 7.
Empirical results of electricity prices and intensity.
4. Discussion
According to the results of the LMDI analysis of CO2 emissions in OECD countries, various factors in each country have reduced CO2 emission. The biggest reason for this is that the energy resource environment and industrial structure are different in each country. However, most OECD countries have reduced GHG emissions in the electricity generation sector during the periods between 1995 and 2017 and the greatest contribution came from policies that improved generation mix. In certain countries that have achieved relatively rapid growth, the emission has increased due to economic activities, ultimately weakening the effect of policy efforts. The policy implications from the results of this study are as follows.
- Key drivers that reduce CO2 emission in the generation sector on the supply side is the reduction of the share of fossil fuels. Converting the generation mix from coal or petroleum to gas generation also seems a viable strategy. Countries with low gas prices or well-equipped gas supply infrastructure are model examples, such as the United States, Britain, and Belgium. However, not all countries have such conditions, therefore a more general policy direction is to shift from coal to renewable energy. Nevertheless, strategies to induce changes to the generation portfolio cannot cover the increase in emission from economic growth. Therefore, policies on the demand side, i.e., policies that improve electricity intensity is also needed.
- The trend of decoupling of economic growth and energy use since the 2008 global financial crisis was also evident in the power sector. This was largely due to the relatively large reduction in the economic impact of traditional industrial sectors that consumed large amounts of electricity. These changes have resulted in a continued decline in electricity intensity over time.
- However, the reduction in electricity intensity is not only due to the changes in industrial structure due to external shocks but also to improvements in energy consumption efficiency in the industrial sector. This is evidenced by the fact that OECD-Europe countries’ intensity had been steadily declining even before the 2008 global financial crisis. This is due to the energy efficiency obligation schemes at the EU level which have been imposed on energy providers, giving them solid energy-saving goals. In addition, the EU has been steadily pushing for policies that reduce intensity, including energy label policies, energy efficiency improvement policies for buildings, and energy audit policies in the industrial sector.
- The reduction in electricity intensity is greatly affected by the policy of encouraging energy efficiency as well as the policy of power pricing. This is because energy environment taxes and various surcharges have resulted in relatively higher electricity intensity effects in countries with high electricity prices. This is because when electricity prices are high, the incentive for facility investment to improve consumption efficiency is higher, further increasing the effectiveness of the policies that promote energy efficiency.
In the case of Korea, the results indicate that the CO2 emission increased by 200.5 million tons during the period from 1995 to 2017, which was the highest among OECD countries. This was mainly due to GDP growth, but even when the GDP effect was excluded, all other factors affected the high level of emission. In terms of electricity intensity, there was an increase factor of 30.3%, unlike other OECD countries, which is mainly due to over-consumption of electricity caused by a low level of electricity price and the subsequent failure to induce energy consumption behavior. Korean government maintained a policy of keeping the electricity prices low compared to other OECD countries. On the supply side, the share of thermal generation contributed to a 31.7% increase in CO2 emission. This is attributable to the expansion of large coal thermal generation facilities since the 1990s. In 1995, the coal generation amounted to 49.3 TWh, accounting for 26.8%, and in 2017, the generation amount was 252.7 TWh, having increased by 5.1 times, and the share was also expanded to 44.6%.
From the results above, this study advises the following to the policymakers of Korea to reduce GHG emissions. The most suitable strategy for Korea to reduce GHG from the power sector is to lower the share of the sources that emit a high level of CO2 and break from the policy that strictly regulates the increase in electricity price. To achieve this, it is of utmost importance to retire aged coal facilities as early as possible and replace them with either gas or renewable generation. Such transition should not only be carried out from the perspective of the expansion of carbon-free generation, but also in terms of the improvement in electricity intensity. The reason behind why the Korean government has increased coal power generation so far, is that it has preferred low cost base-load generation facilities such as nuclear and coal to maintain low electricity price. Renewable or gas generation is a carbon-free source but is also a factor that increases electricity price. If the cost of power supply becomes more expensive from the shift in generation sources, the response to price from consumers will result in increased reduction effect in energy consumption, ultimately leading to a reduction of GHG emissions. The increase in electricity price may be a negative factor in terms of consumer welfare but considering the exogenous effects that affect the entire society due to GHG emission, such policy measures should be deeply considered.
5. Conclusions
The CO2 emissions from the electricity generation sector in OECD countries have been analyzed through LMDI decomposition analysis. Emission levels by country show that the reduction effect of European OECD countries was high, whereas the emission of non-European OECD countries often increased. The level of emission was especially high in developing countries with rapid economic growth, such as South Korea, Chile, Mexico, and Turkey. Such difference is due to the reduction effort and policies of EU countries, cutting down CO2 emissions in the electricity generation sector via a supply of renewable energy and the withdrawal of thermal power generation.
Examining the factors that affect CO2 emission, the improvement in electricity intensity and decrease in the share of thermal generation proved to be the most effective in the reduction of CO2 emission, whereas the improvement of thermal generation structure (transition from coal to gas) and improvement in boiler efficiency did not show a significant effect. European countries demonstrated clear policy effects by decreasing the share of thermal generation and increasing the share of renewable energy on top of improving electricity intensity, whereas non-European countries put in reduction efforts on the demand side to decrease electricity intensity, rather than on the supply side. This was made possible by policies inducing the reduction of the share of over-consuming manufacturing industries and increasing the energy consumption efficiency.
The level of electricity price was the factor that most influenced the improvement of electricity intensity. The increase in retail electricity price through energy tax reform induces investments in energy efficiency and ultimately reduces electricity intensity. According to the results of the panel analysis of OECD countries between the periods 1990 and 2017, electricity prices and electricity intensity were significantly negative, even when the industrial structure that differs across the countries was controlled for.
Author Contributions
Conceptualization H.K. (Haein Kim), S.P.; Writing—original draft preparation H.K. (Haein Kim), H.K. (Hyunggeun Kim); investigation H.K. (Haein Kim), M.K.; data curation H.K. (Haein Kim); formal analysis H.K. (Haein Kim); writing—reviewing and editing M.K.; visualization M.K.; supervision S.P.; methodology S.P.; software S.P. All authors have read and agreed to the published version of the manuscript.
Funding
This research received no external funding.
Conflicts of Interest
The authors declare no conflict of interest.
References
- IPCC. Climate Change 1995-The Science of Climate Change: Contribution of Working Group I to the Second Assessment Report of the Intergovernmental Panel on Climate Change; IPCC: Geneva, Switzerland, 1995. [Google Scholar]
- Pachauri, R.K.; Mayer, L. Intergovernmental Panel on Climate Change Climate Change 2014: Synthesis Report; IPCC: Geneva, Switzerland, 2014; ISBN 9789291691432. [Google Scholar]
- UNFCCC. Kyoto Protocol to the United Nations Framework Convention on Climate Change; UNFCCC: New York, NY, USA, 1997. [Google Scholar]
- UNFCCC. Report of the Conference of the Parties on its Twenty-First Session, Held in Paris from 30 November to 13 December 2015; UNFCCC: New York, NY, USA, 2016. [Google Scholar]
- IEA. CO2 Emissions from Fuel Combustion 2019; IEA: Paris, France, 2019. [Google Scholar]
- Ang, B.W.; Su, B. Carbon emission intensity in electricity production: A global analysis. Energy Policy 2016, 94, 56–63. [Google Scholar] [CrossRef]
- Voigt, S.; De Cian, E.; Schymura, M.; Verdolini, E. Energy intensity developments in 40 major economies: Structural change or technology improvement? Energy Econ. 2014, 41, 47–62. [Google Scholar] [CrossRef]
- Cho, Y.; Lee, J.; Kim, T.Y. The impact of ICT investment and energy price on industrial electricity demand: Dynamic growth model approach. Energy Policy 2007, 35, 4730–4738. [Google Scholar] [CrossRef]
- Yoo, S.H. Electricity consumption and economic growth: Evidence from Korea. Energy Policy 2005, 33, 1627–1632. [Google Scholar] [CrossRef]
- Wang, W.; Mu, H.; Kang, X.; Song, R.; Ning, Y. Changes in industrial electricity consumption in china from 1998 to 2007. Energy Policy 2010, 38, 3684–3690. [Google Scholar] [CrossRef]
- Malla, S. CO2 emissions from electricity generation in seven Asia-Pacific and North American countries: A decomposition analysis. Energy Policy 2009, 37, 1–9. [Google Scholar] [CrossRef]
- Shrestha, R.M.; Anandarajah, G.; Liyanage, M.H. Factors affecting CO2 emission from the power sector of selected countries in Asia and the Pacific. Energy Policy 2009, 37, 2375–2384. [Google Scholar] [CrossRef]
- Zhu, L.; He, L.; Shang, P.; Zhang, Y.; Ma, X. Influencing Factors and Scenario Forecasts of Carbon Emissions of the Chinese Power Industry: Based on a Generalized Divisia Index Model and Monte Carlo Simulation. Energies 2018, 11, 2398. [Google Scholar] [CrossRef]
- Yang, L.; Lin, B. Carbon dioxide-emission in China’s power industry: Evidence and policy implications. Renew. Sustain. Energy Rev. 2016, 60, 258–267. [Google Scholar] [CrossRef]
- Chen, J.; Wang, P.; Cui, L.; Huang, S.; Song, M. Decomposition and decoupling analysis of CO2 emissions in OECD. Appl. Energy 2018, 231, 937–950. [Google Scholar] [CrossRef]
- Karmellos, M.; Kopidou, D.; Diakoulaki, D. A decomposition analysis of the driving factors of CO2 (Carbon dioxide) emissions from the power sector in the European Union countries. Energy 2016, 94, 680–692. [Google Scholar] [CrossRef]
- Ang, B.W. Decomposition analysis for policymaking in energy: Which is the preferred method? Energy Policy 2004, 32, 1131–1139. [Google Scholar] [CrossRef]
- De Oliveira-De Jesus, P.M.; Galvis, J.J.; Rojas-Lozano, D.; Yusta, J.M. Multitemporal LMDI Index Decomposition Analysis to Explain the Changes of ACI by the Power Sector in Latin America and the Caribbean between 1990–2017. Energies 2020, 13, 2328. [Google Scholar] [CrossRef]
- De Oliveira-De Jesus, P.M. Effect of generation capacity factors on carbon emission intensity of electricity of Latin America & the Caribbean, a temporal IDA-LMDI analysis. Renew. Sustain. Energy Rev. 2019, 101, 516–526. [Google Scholar] [CrossRef]
- Ang, B.W.; Zhang, F.Q.; Choi, K.H. Factorizing changes in energy and environmental indicators through decomposition. Energy 1998, 23, 489–495. [Google Scholar] [CrossRef]
- Ang, B.W. LMDI decomposition approach: A guide for implementation. Energy Policy 2015, 86, 233–238. [Google Scholar] [CrossRef]
- Zhang, M.; Liu, X.; Wang, W.; Zhou, M. Decomposition analysis of CO2 emissions from electricity generation in China. Energy Policy 2013, 52, 159–165. [Google Scholar] [CrossRef]
- Ang, B.W.; Liu, N. Handling zero values in the logarithmic mean Divisia index decomposition approach. Energy Policy 2007, 35, 238–246. [Google Scholar] [CrossRef]
- Hankinson, G.A.; Rhys, J.M.W. Electricity consumption, electricity intensity and industrial structure. Energy Econ. 1983, 5, 146–152. [Google Scholar] [CrossRef]
- Duro, J.A.; Alcántara, V.; Padilla, E. International inequality in energy intensity levels and the role of production composition and energy efficiency: An analysis of OECD countries. Ecol. Econ. 2010, 69, 2468–2474. [Google Scholar] [CrossRef]
- Horowitz, M.J. Electricity intensity in the commercial sector: Market and public program effects. Energy J. 2004, 25, 115–137. [Google Scholar] [CrossRef]
- Cornillie, J.; Fankhauser, S. The energy intensity of transition countries. Energy Econ. 2004, 26, 283–295. [Google Scholar] [CrossRef]
- Adeyemi, O.I.; Hunt, L.C. Modelling OECD industrial energy demand: Asymmetric price responses and energy-saving technical change. Energy Econ. 2007, 29, 693–709. [Google Scholar] [CrossRef]


© 2020 by the authors. Licensee MDPI, Basel, Switzerland. This article is an open access article distributed under the terms and conditions of the Creative Commons Attribution (CC BY) license (http://creativecommons.org/licenses/by/4.0/).