Abstract
The low-temperature start problem of polymer electrolyte membrane fuel cells (PEMFCs) is a factor limiting their large-scale application. To improve the low-temperature start performance of a PEMFC, a novel microporous layer (MPL) and a gas diffusion layer (GDL) with planar wettability distribution, in which the hydrophilic and hydrophobic lines were arranged alternately in the in-plane direction, were investigated in this study. The influence of the dual planar-distributed wettability of the MPL and GDL on the normal temperature and low-temperature start performance of the PEMFC was investigated. Before performing the major experiment, the effect of the assembly pressure of the membrane electrode assembly (MEA), which has a significant effect on the PEMFC performance, was examined and determined to use in the experiment. The experimental results show that the dual hybrid MPL and GDL can further prolong the operation time of the PEMFC at different below-freezing temperatures owing to efficient water management and thus significantly improve the low-temperature start performance of the PEMFC.
1. Introduction
Fuel cell vehicles (FCVs) have attracted increasing attention in recent years owing to their high energy efficiency and environmental friendliness. However, some issues hinder their practical application, including the problem of low-temperature start. Because polymer electrolyte membrane fuel cells (PEMFCs) generate water inside the cell during FCV operation at below-freezing temperatures, the water generated is in a liquid supercooled state, which may freeze inside the cell [1]. Studies have shown that repeated freezing in the PEMFC causes irreversible damage to the cell. For example, cracks are formed in the proton exchange membrane after repeated freeze/thaw cycles [2], and platinum particles in the catalytic layer (CL) may also detach [3]. In addition, freezing causes gaps between the proton exchange membrane and the CL [4] and damage the fiber structure inside the gas diffusion layer (GDL) [5]. It is possible to improve the low-temperature start ability of PEMFCs using a microporous layer (MPL), because the MPL can contact the CL more closely and reduce the accumulation of water on the surface of the GDL [6]. However, when freezing occurs between the CL and the MPL, the generated ice blocks air transport to the CL, and the PEMFC fails to low-temperature start [7]. Therefore, to improve the adaptability of the PEMFC to below-freezing temperature environments, the management of water effectively inside the cell is important, particularly in the MPL and GDL.
Since CL, MPL, and GDL are porous materials, their physical properties change when pressure is applied on the membrane electrode assembly (MEA). It is important to clarify the effect of MEA assembly pressure, as it has a significant effect on PEMFC performance [8]. Radhakrishnan et al. [9] studied the influence of compression on GDL thickness, surface morphology, pore diameter and porosity, impedance, surface roughness, contact angle, water absorption capacity, and other parameters. The results showed that compression could reduce the GDL thickness, pore diameter, porosity, and other parameters. The experimental results of Velan et al. [10] also indicated that increase in the compressive stress reduced the pore size and porosity of GDL. Simon et al. [11] tested the effects of compression on the oxygen transfer resistance in GDL, and results showed that increasing the compression degree could increase the oxygen transfer resistance in GDL. In addition, Carcadea et al. [12] used numerical simulation method to study the influence of different GDL compression degrees on the water distribution in the cathode CL and GDL during PEMFC operation. The water saturation of CL and GDL increased with increasing GDL compression degree, and the liquid water was mainly concentrated in the corresponding area under the ridge. Dafalla et al. [13] studied the influence of assembly pressure on the low-temperature startup of PEMFC by numerical calculation, and the results showed that increasing assembly pressure led to the ice aggregation more easily in the CL area under the flow channel, accelerated the dehydration of membrane of the anode side, and worsened performance of the low-temperature startup. However, current studies on the influence of assembly pressure on MEA and PEMFC operation performance are mainly focused on normal temperature conditions, i.e., 60–80 °C, or are only numerical simulation studies. There is therefore a lack of relevant experimental studies on subfreezing temperature.
On the other hand, when a PEMFC operates at temperatures ranging from −10 °C to 0 °C, the generated water maintains its supercooled state inside the cell until supercooling is no longer in effect [14]. With the decrease in the temperature, it is more difficult for the supercooled water to reach the cathode channel [15]. For a better water management of the fuel cell, different MPL and GDL structures have been proposed. For example, a hydrophobic treatment of the MPL and GDL can help rapidly discharge water from the cell [16]. Aoyama et al. [17] studied the method of water generation and removal in a MEA and designed a seamless interface between the CL and the MPL for improving the performance of PEMFCs at a high current density. Ito et al. [18] showed the effect of a self-supporting MPL to reduce the heterogeneity of the interfaces between the GDL and MPL. Hirakata et al. [19] concluded that a hydrophilic MPL can improve the low-temperature start ability of PEMFCs by improving the water retention capacity of the MPL. Utaka et al. [20,21,22,23] proposed and designed a GDL (hybrid GDL) with planar wettability distribution, which can drive water from the hydrophobic region to the hydrophilic region, and keep channels for gas diffusion paths in the hydrophobic region of the GDL to diffuse air to the CL. Manzi-Orezzoli et al. [24] also experimentally studied the internal water distribution of hybrid GDL in different states. However, in the experiment, the conventional MPL had a uniformly distributed wettability, and the improved PEMFC performance with a hybrid GDL was shown at normal temperature. Hybrid GDL has not been tested at subfreezing temperature before. Wang et al. [25] proposed and experimentally examined a novel structure of MPL with planar wettability distribution, in which hydrophilic and hydrophobic lines were arranged alternately in the in-plane direction. This can extend to the lower temperature range for continuous operation and the operation time of the PEMFC at below-freezing temperatures. However, the liquid movement in the GDL and gas channel of the bipolar plate should be further controlled to improve the low-temperature start performance of PEMFCs, because the liquid from the CL was considered to arrive at the gas channel (through the MPL and GDL) and freeze there in previous low-temperature start experiments.
As it is important to control water in the overall MEA, a dual hybrid MPL and GDL (dual H-MPL & GDL) with a planar-distributed wettability structure for both the MPL and GDL was proposed in this study. The objective of this research was to examine the effectiveness of the dual hybrid MPL and GDL in improving the low-temperature start performance of the PEMFC. The proposed structure controls the movement and distribution of the water generated at below-freezing temperatures while maintaining the performance in the normal temperature range. Furthermore, the characteristics of assembly pressure on the low-temperature start performance for PEMFC with both conventional and hybrid MPL were investigated and the adequate assembly pressure was decided for the experiment. The low-temperature start ability of a PEMFC with the dual hybrid structure was compared with those of PEMFCs with the single hybrid MPL structure and a conventional MPL and GDL structure under the optimum assembly pressure.
2. Structures of Hybrid MPL/GDL and Experimental Apparatus
2.1. Principle of Dual Hybrid MPL and Hybrid GDL
Figure 1 shows the schematics of structure and functions of the dual H-MPL & GDL with planar wettability distribution applied to both the MPL and GDL. The hydrophilic and hydrophobic nano-porous and micro-porous media were striped and distributed in alternating parallel lines in the in-plane direction of the hybrid MPL and GDL, respectively. The position of the hydrophilic/hydrophobic MPL corresponded to that of the hydrophilic/hydrophobic GDL. For the hydrophobic MPL/GDL, the surface inside the pores was non-wettable, so the water was more easily separated from the surface. On the contrary, the surface inside the pores of hydrophilic MPL/GDL was wettable, so water was more likely to stay on the surface. It is precisely because of the difference in wetting characteristics between hydrophilic and hydrophobic pores that the capillary pressure difference is caused, as the liquid water can move from hydrophobic to hydrophilic regions. When the water generated by the CL stays in the narrow gap between CL and MPL, the liquid water moves from the hydrophobic area to the hydrophilic area in the MPL, owing to the capillary pressure difference based on the water repellent nature of the hydrophobic area and the absorbing nature of the hydrophilic area. Subsequently, the water mainly penetrates the hydrophilic areas from the MPL to the GDL. Furthermore, the hybrid GDL also contains hydrophobic and hydrophilic regions. When some amount of water penetrates the MPL and GDL of the hydrophobic areas, it migrates to the hydrophilic region from the hydrophobic region, owing to the capillary pressure difference. According to the previous research, the structure of planar wettability distribution can improve the oxygen diffusivity in GDL under different water saturation. Therefore, it is possible to keep channels as pathways for gas diffusion from the gas channel through the hydrophobic region to the CL. The channels enable the PEMFC to operate continuously, thus improving its low-temperature start performance.
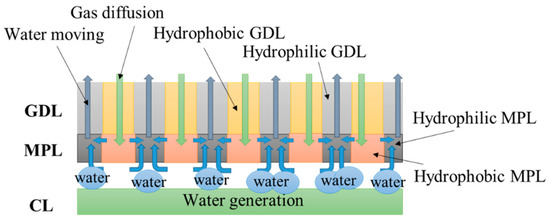
Figure 1.
Schematics of structure and functions of the dual hybrid microporous layer (H-MPL) & gas diffusion layer (GDL).
The main material of the H-MPL used in this research was carbon black. Adding polytetrafluoroethylene (PTFE) can make the MPL hydrophobic, whereas adding polyamide resin can make it hydrophilic. The detailed process of preparing the H-MPL with high reproducibility was described in a former study [25]. The contact angle of hydrophobic area in H-MPL was 135.0 ± 5.0°. The measurement of contact angle for hydrophilic MPL was difficult, because the water drop was absorbed immediately inside when touching the MPL surface. This shows that the hydrophilic MPL has a strong hydrophilicity. Toray 060 was used as the GDL, which could be treated with PTFE to make it hydrophobic. The detailed method of PTFE treatment for preparing hydrophobic stripes of the hybrid GDL (H-GDL) can be found in another study [21].
The liquid water distribution on the surface of GDL side, after immerging the dual H-MPL & GDL in water for 30 s, is shown in Figure 2. The water distribution inside hybrid GDL was investigated by X-ray in previous research [21]. When the liquid water saturation in the hybrid GDL was not 100%, water would accumulate in the hydrophilic region, leaving channels for gas diffusion in the hydrophobic region. In addition, the distribution of liquid water on the hybrid MPL surface has been described in literature [25]. Water accumulated in the hydrophilic MPL while the hydrophobic MPL remained waterless. Such water management of dual H-MPL & GDL affects the performance of PEMFC.
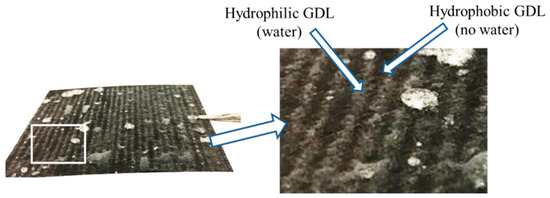
Figure 2.
Water distribution on the hybrid GDL surface after immersion treatment.
Conventional MPL and GDL (C-MPL & GDL) with a uniform wettability distribution were prepared to compare the performance with those of hybrid MPL or GDL. Both the conventional MPL (C-MPL) and conventional GDL (C-GDL) were hydrophobic treated with PTFE. The C-GDL and H-GDL were the same size. The PTFE concentrations in C-GDL and in hydrophobic area of H-GDL were also same and ensured the equal contact angle. Three different combinations of MPL and GDL were tested: C-MPL & GDL, H-MPL & C-GDL, and dual H-MPL & GDL. Among them, the mass fraction of PTFE in C-MPL and in the hydrophobic region of H-MPL was 30%, and the polyamide resin mass fraction in the hydrophilic region of H-MPL was 20%.
The area of the MPL was 5.0 × 5.0 cm2, the thickness was 30 ± 5 μm, and the hydrophilic or hydrophobic stripe width of each H-MPL and H-GDL was 1.0 mm. Different stripe widths and angles can be studied in future research. The pore size of the conventional MPL was mainly around 77 nm, while that of the hybrid MPL was mainly around 96 nm.
2.2. Experimental System for Low-Temperature Start of PEMFC
Table 1 lists the specification and experimental conditions for the low-temperature start of the PEMFC used in this experiment. A carbon bipolar plate with a parallel flow gas channel was used. The widths of the flow channel and rib ensured that the hydrophilic and hydrophobic lines of H-MPL coild be fixed parallel to the gas channel, so as to avoid the effect of location difference between the flow channel and the hydrophilic/hydrophobic region on the PEMFC performance. The boundaries between the hydrophilic and hydrophobic areas of the GDL were arranged such that they were located at the center of the rib and the channel. SGL 29BC with the MPL was used for the anode GDL, and the three types of structures (mentioned in Section 2.1) were used for the cathode GDL and MPL. In each set of tests, all other factors were the same except for the cathode GDL and/or MPL. It should be noted that the PEMFC operated at a low current density (0.04 A·cm−2) in order to avoid the rapid generation of supercooled water in CL and to prevent membrane dehydration, which are adverse to the low-temperature start performance of the cell [26].

Table 1.
Specification of polymer electrolyte membrane fuel cells (PEMFC) and low-temperature start experimental conditions.
Figure 3 shows the experimental system for the low-temperature start of the PEMFC. The PEMFC was positioned in the constant-low-temperature chamber. The temperatures of the fuel cell and reactant gas were controlled by exchanging heat with the air in the chamber. After the reactant gas was refrigerated in the cooling coil and reached the preset temperature, it entered the PEMFC. In addition, an electrochemical workstation was used to measure the variation in the internal ohmic resistance (high-frequency resistance) of the PEMFC under subfreezing conditions, and the frequency was 2500 Hz.
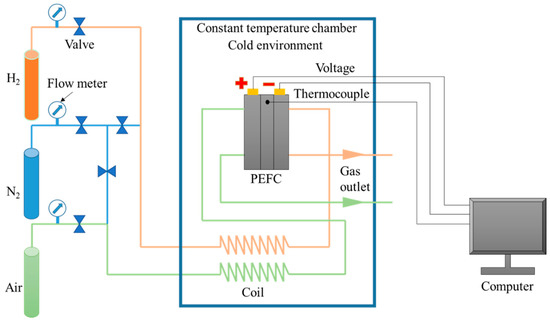
Figure 3.
Experimental system for the low-temperature start of PEMFC.
On the other hand, the performance of the PEMFC under normal temperature (70 °C) was tested using an experimental system (Figure 3). The fuel cell temperature was controlled at 70 °C by pumping the circulating constant-temperature water into the end plate of the PEMFC. The stoichiometric ratio of hydrogen and air entering the PEMFC was 5.0, and the relative humidity of air and hydrogen was 70% and 100%, respectively.
The low-temperature start experiment was conducted by first purging the cathode and anode of PEMFC with nitrogen (50 °C, 35% RH, 1000 mL/min) for 1.5 h to set the initial state of the moisture distribution inside the PEMFC. Second, the fuel cell was placed in the constant-temperature chamber to cool it down to the target temperature and was maintained there for 1 h. Third, hydrogen and air were pumped into the anode and cathode of the PEMFC, respectively, and the current density was set. When the PEMFC started to operate, relevant data were recorded. Finally, the recording was stopped after the PEMFC operated for 30 min or when it failed to start. The first step was repeated for the next experiment.
3. Relation Between Assembly Pressure and Structural Change in GDL, and Determination of Adequate Assembly Pressure
3.1. Characteristics of MEA Structural Change by Assembly Pressure
The assembly pressure on MEA is mainly controlled by bolt tightening torque on PEMFC assembly. In this research, pressure sensitive paper was used to test the assembly pressure distribution between CL and MPL under bolt torque of 1 N·m, 2 N·m, and 4 N·m, respectively. The range of assembly torque was set to prevent gas leakage from PEMFC and severe damage to GDL. As shown in Figure 4a, the assembly pressure acting on MEA increased with increasing bolt torque. When bolt torque was 1 N·m, 2 N·m, and 4 N·m, the corresponding average assembly pressure acting on CL and MPL were 0.30–0.75 MPa, 0.50–1.50 MPa, and 1.50–2.50 MPa, respectively. Particularly, the pressure in the region under the ridge was greater than in the region under the gas flow channel.
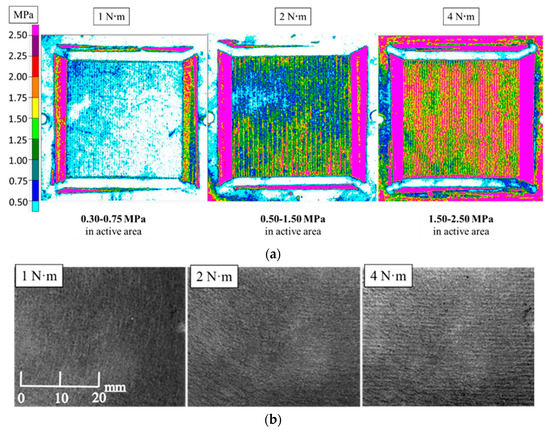
Figure 4.
Assembly pressure distribution between catalytic layer (CL) and microporous layer (MPL) and morphology changes of GDL surface at different assembly pressures: (a) Assembly pressure distribution between CL and MPL under different bolt torques; (b) Surface morphology of GDL at different assembly pressures.
Figure 4b shows the different magnification photos of the GDL surface under different assembly pressure. Figure 4b shows that the GDL surface was flat when the assembly pressure was 1 N·m. When the assembly pressure increased, the surface of GDL with striped unevenness was seen. Particularly, under 4 N·m, the pattern was obvious. In addition, original thickness of GDL with MPL without the addition of the tightening force was 175 ± 5 µm. When the assembly pressure was 1 N·m, 2 N·m, and 4 N·m, the thickness was 150 µm, 130 µm, and 100 µm, respectively. Under the assembly pressure of 4 N·m, the thickness of GDL with MPL was 0.571-times thicker than original one.
The features of microstructure and pore in GDL at different assembly pressures are shown in Figure 5. The photos of GDL cross-section were taken by scanning electron microscopy (SEM), as shown in Figure 5a. It can be seen that when the assembly pressure was 1 N·m, there was no obvious fracture of the carbon fibers on the upper surface of GDL. There were slight destructions in the carbon fiber of GDL under 2 N·m. However, when the assembly pressure was 4 N·m, the carbon fibers on the GDL surface were significantly broken. The GDL under the ridge was significantly thinner than that under the gas flow channel due to high compression. Figure 5b shows the porosity and pore size distribution of GDL and MPL under different assembly pressures. It should be noted that the pore size and porosity were measured using the mercury intrusion porosimetry (MIP) method. The two peaks in the curve for 1 N·m case indicate that the pore diameter of GDL and MPL were around 33.0 μm and 95.4 nm, respectively. However, when the assembly pressure was 2 N·m, in addition to a higher peak (indicating that the pore size of GDL was mainly 33.0 μm), there were two lower peaks in the curve. The peak at 77.1 nm represents the pore size of MPL, while the peak at 1.0 μm shows the pore size of GDL compressed under the ridge. Similarly, when the assembly pressure was 4 N·m, there were three peaks in the curve, indicating that the pore diameters of GDL and MPL were 24.2 μm (GDL under the gas flow channel), 0.8 μm (GDL under the ridge), and 62.5 nm, respectively. The comparison of the pore size distribution of GDL and MPL under different assembly pressures indicates that the larger the assembly pressure was, the smaller the pore size of MPL or GDL was. Moreover, under lager assembly pressure, the thicknesses of GDL under gas flow channel and under ridge were different, and the pore size distributions of GDL under the two regions were also different. In this study, since MPL was combined with GDL, the porosity of GDL or MPL could not be measured separately. The results of the test show that when the assembly pressure was 1 N·m, 2 N·m, and 4 N·m, the average porosity of GDL and MPL was 76.4%, 74.9%, and 64.0%, respectively. Thus, the increase in assembly pressure resulted in the decrease of porosity of GDL and MPL. When PEMFC was working, the changes in GDL directly affected the transfer of liquid water and the freezing of supercooled water inside.
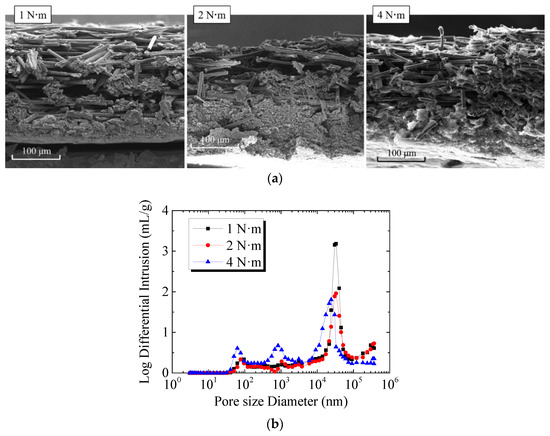
Figure 5.
Features of microstructure and pore in GDL and MPL at different assembly pressures: (a) Cross-section of GDL at different assembly pressures; (b) Pore size distribution of GDL and MPL at different assembly pressures.
The performance of PEMFC with two different combinations of MPL + GDL (C-MPL & GDL, H-MPL & C-GDL) was tested and compared under 1 N·m, 2 N·m, and 4 N·m to decide the optimum assembly pressure on low-temperature start ability. Then, the performance of PEMFC with different MPL and GDL structures at 70 °C and low-temperature start performance were investigated under the optimum assembly pressure.
3.2. The Effect of Assembly Pressure on Low-temperature Start Performance
Figure 6a,b summarize the voltage variation with time when PEMFC works at different supercooling degrees under different assembly torques for conventional and H-MPL & C-GDL, respectively. When the assembly pressure was 1 N·m, PEMFC worked more than 30 min at −4.2 °C for C-MPL & GDL and at −4.2 °C and −5.5 °C for H-MPL & C-GDL. With the decreasing startup temperature, the working time of PEMFC became shorter. Comparing Figure 6a,b PEMFC had a longer working time with hybrid MPL compared to conventional MPL for each supercooling degree and assembly pressure. In general, the cold startup process of PEMFC was affected by exothermic reaction and supercooling degree. When the degree of supercooling increased, the freezing probability of the liquid water inside the fuel cell increased and was one of the reasons why the PEMFC working time reduced.
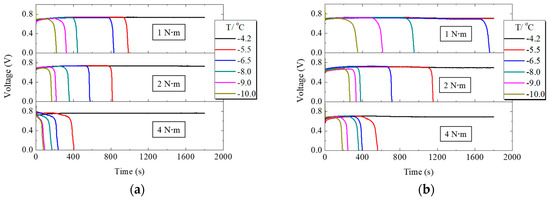
Figure 6.
Voltage variation of PEMFC with conventional microporous layer (C-MPL) & GDL and H-MPL & conventional gas diffusion layer (C-GDL) under different assembly pressures: (a) Voltage changes of PEMFC with C-MPL & GDL; (b) Voltage changes of PEMFC with H-MPL & C-GDL.
In addition, the influence of the tightening bolt torque can be seen from Figure 6a,b. With the increasing assembly pressure, the working time of PEMFC with both hybrid and conventional MPLs reduced at the same supercooling degree, because the capacity of the total water retention of MPL and GDL is considered a very important factor in cold start condition. Since the increase in assembly pressure leads to a decrease in the porosity of MPL and GDL due to thickness reduction by pressure and easier water saturation, it is easier to block its pores and prevent oxygen from reaching the cathode CL with the freezing of supercooled water in MEA and GDL. Excessive assembly pressure, however, damages the structure of carbon fiber in GDL. All of these changes decreased the working time of PEMFC. However, if the assembly pressure is too low, gas leaks from PEMFC. Therefore, 1 N·m was the most suitable assembly pressure in this experiment.
When PEMFC works, liquid water first accumulates in CL and then passes through the cathode MPL and GDL to reach the gas flow channel. The accumulation or freezing of supercooled water in the cathode gas flow channel causes the pressure drop between the inlet and outlet to increase. Figure 7a,b shows the variation of pressure drop in the cathode gas flow channel when PEMFC worked under different assembly pressures. From the comparison of −4.2 °C curves under different assembly pressures in Figure 7a,b the growth range of pressure drop increased with the increase of assembly pressure, indicating that liquid water can pass through MPL and GDL faster and then move into the gas flow channel. Although increasing the assembly pressure increased the transfer resistance of the liquid water, it also reduced the thickness of GDL and MPL. This resulted in a shorter moving distance for the liquid water, as the water or ice could gather in the gas flow channel faster. Comparing Figure 7a,b the ranges of the pressure drop increase of PEMFC with H-MPL & C-GDL were smaller than that of C-MPL & GDL. Since the hydrophilic area in hybrid MPL stored part of the generated water, the amount of liquid water entering the flow channel was smaller than that of C-MPL & GDL.
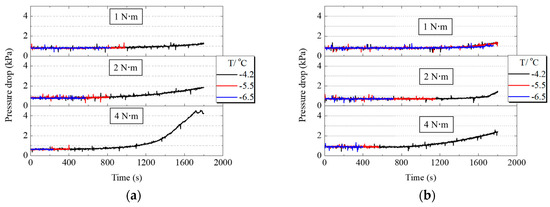
Figure 7.
Pressure drop variation of PEMFC with C-MPL & GDL and H-MPL & C-GDL under different assembly pressures: (a) Pressure drop changes of PEMFC with C-MPL & GDL; (b) Pressure drop changes of PEMFC with H-MPL & C-GDL.
The variations of ohmic resistance during PEMFC operation at different assembly pressures are shown in Figure 8. When PEMFC worked at low temperature, the ohmic resistance gradually decreased at the initial stage. When PEMFC failed to start at a low temperature, the voltage started to decrease and the ohmic resistance inside the fuel cell gradually increased. Since the supercooled water inside the PEMFC froze and an ice layer was formed in the MEA, the PEMFC resistance increased [6,26]. Comparison of Figure 8a,b shows that at freezing, the resistance of fuel cell with H-MPL & C-GDL increased gradually compared to C-MPL & GDL, since H-MPL & C-GDL contained water in hydrophilic MPL regions, and the water in the interface between MPL and CL was less than that of C-MPL & GDL. Figure 8 clearly shows that with increasing assembly pressure, the increase range of resistance decreased when the cold startup failed. A possible reason is that when assembly pressure increased, the porosity of MPL and GDL decreased, causing a decrease in the volume of liquid water drops inside them.
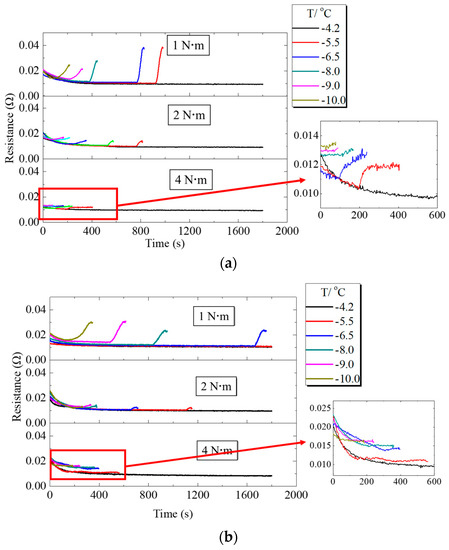
Figure 8.
Ohmic resistance changes of PEMFC under different assembly pressures: (a) Ohmic resistance changes of PEMFC with C-MPL & GDL; (b) Ohmic resistance changes of PEMFC with H-MPL & C-GDL.
4. Results and Discussion
4.1. Performance of PEMFC with Different MPL/GDL Structures at Normal Temperature
As 1 N·m is the most suitable assembly pressure for PEMFC according to the research in Section 3.2, all of the following experiments were conducted under the assembly pressure of 1 N·m. Figure 9 shows the performance of PEMFC with different MPL or GDL structures at 70 °C in terms of the voltage V and power density P vs the current density I. Three measurements were performed under each condition to verify the repeatability. The error in each condition was within 2% at the maximum power density. Moreover, the trends in the curves were similar. The I-V and I-P curves show that there was no larger difference in the range of smaller I (−0.2 A/ cm2) among the three types of MEAs. However, the differences in V and P can be seen in a wider range of I (0.2–1.9 A/ cm2). In particular, the features of the curves were different when 1.3 < I < 1.9 A/cm2. The P values are the maximum for the dual hybrid MPL & GDL at a relatively low current density I (1.4 A/cm2) compared with the other two cases. The PEMFCs with the H MPL & C-GDL and C-MPL & GDL exhibited the same maximum I of 1.9 A/cm2, which was greater than that in the dual H-MPL & GDL case.
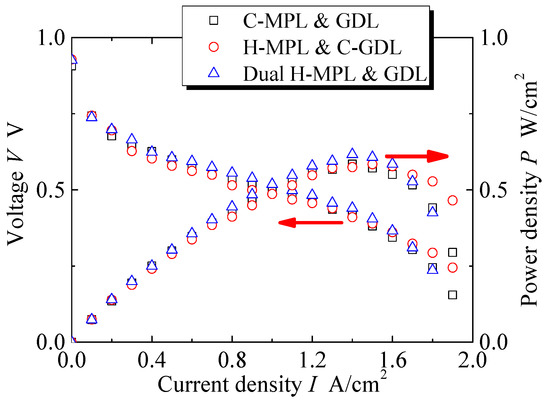
Figure 9.
Curves of current density–voltage and current density–power density of PEMFC at 70 °C with different MPL/GDL structures.
The dual H-MPL & GDL could absorb water in the hydrophilic area and provide a straight path for oxygen diffusion in a relatively wide range of I (0.8–1.6 A/cm2). On the other hand, the anti-flooding property was remarkable in the C-GDL (+ H-MPL or + C-MPL) with the hydrophobic property because of the formation of homogeneously distributed discrete droplets at I values ranging from 1.7 A/cm2 to 1.9 A/cm2, though the diffusion path for oxygen was longer because of the formation of bent paths due to the discrete randomly distributed liquid. Moreover, as shown in Figure 9 and Figure 10, although the generated water tended to stagnate in the gap between CL and MPL due to their hydrophobic properties for C-MPL, the water was quickly absorbed in the hydrophilic area in the MPL and only a little amount of water stagnated in the gap between the CL and MPL for the hybrid MPL. Therefore, the hybrid MPL gave higher V and P values because of the active electrochemical reaction taking place without any excess water on the CL in a wider range of I. In particular, while extension to largest I range (approximately 1.9 A/cm2) with larger V and P was seen for the H MPL & C-GDL case, the dual H-MPL & GDL gave the highest V and P values at approximately I = 1.4 A/cm2 as described previously. Thus, the PEMFC with the dual H-MPL & GDL structure showed the best performance under the normal temperature condition.
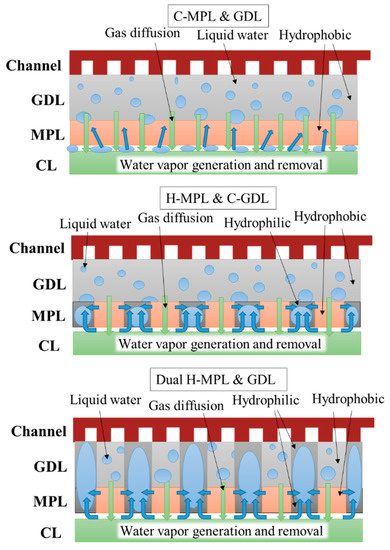
Figure 10.
Predicted sketch of liquid water distribution in PEMFC with different MPL/GDL structures.
4.2. Low-temperature Start Performance of PEMFC with Different Structures
Figure 11 shows the tested results of the low-temperature start performance of PEMFC with different MPL and GDL structures. The PEMFC with C-MPL & GDL operated for more than 30 min at −4.2 °C, and the operation time decreased with the decrease in the temperature. The operation time of the PEMFC with the dual H-MPL & GDL at below-freezing temperatures was even better than that of the PEMFC with H-MPL & C-GDL. This was because of the alternating structure of the hydrophilic or hydrophobic regions in the dual H-MPL & GDL, as the structure made the supercooled water at the interface of the CL/MPL quickly move from the hydrophobic to hydrophilic regions. Moreover, the water in the MPL and GDL could concentrate in the hydrophilic region, keeping channels for air diffusion to the cathode CL in the hydrophobic region. Therefore, the PEMFC can continue to work for a long time, even if the supercooled water freezes. The prolonged operation time of the PEMFC at below-freezing temperatures can improve the low-temperature start performance of FCVs under below-freezing conditions. Moreover, the performance of PEMFC at normal temperature conditions after 17-times of low-temperature start experiments was tested, and the data before and after low-temperature start were compared. As a result, the structure of the hybrid MPL or GDL can be maintained after operation at low temperatures, and there was no significant degradation in the performance of the PEMFC before and after several low-temperature start experiments.
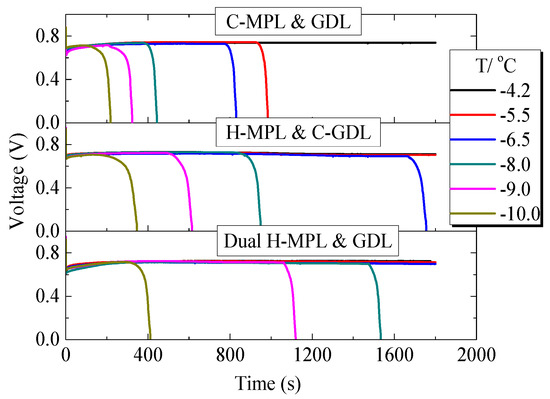
Figure 11.
Variation in the voltage of the PEMFC with different structures of MPL/GDL.
Figure 12a shows the ohmic resistance changes of PEMFC with different MPL/GDL structures under different below-freezing temperatures. For the cell with C-MPL & GDL, it can be seen that at −4.2 °C, the ohmic resistance gradually decreased in the initial 200 s, which was due to the generated water which moistened the MEA, making the ohmic resistance of the cell decrease. As the PEMFC continued to work, the ohmic resistance tended to stabilize. However, at −10.0 °C to −5.5 °C, when the PEMFC stopped working, the ohmic resistance suddenly increased due to the internal freezing of MEA [26]. Moreover, at −5.5 °C and −6.5 °C, the ohmic resistance increased faster than that of −9.0 °C and −10.0 °C when the PEMFC stopped. This is because at higher temperatures (−5.5 °C and −6.5 °C), the water in the cell will remain super-cooled state and accumulate in the MEA. At the moment of stopping, the ohmic resistance will rise rapidly due to the sudden formation of the ice layer in the MEA. However, at lower temperatures (−9.0 °C and −10.0 °C), water will quickly freeze after generation and ice will gradually accumulate in MEA, so ohmic resistance will gradually increase until the PEMFC stops working. For the PEMFC with H-MPL & C-GDL and Dual H-MPL & GDL, due to the rapid water movement in MEA and longer working time, ohmic resistance showed a similar gradually increasing trend only at −10.0 °C.
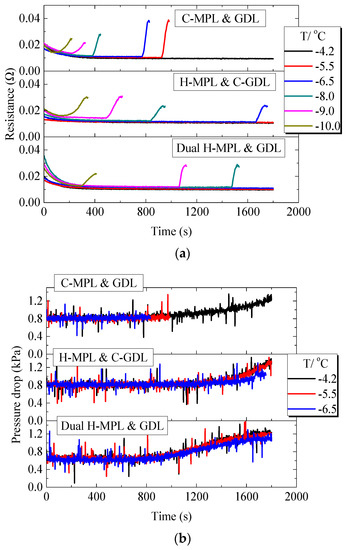
Figure 12.
Low-temperature start performance of the PEMFC with different structures of MPL/GDL: (a) Variation in the ohmic resistance of the PEMFC; (b) Variation in the pressure drop in cathode gas channel.
Figure 12b shows the change in the pressure drop in the PEMFC cathode flow channel when using different MPL/GDL structures. The pressure drop of the cathode channel did not increase significantly in the first 800 s (this is common to all the three PEMFCs), and after approximately 800 s, the pressure drop gradually increased. As the temperature was −5.5 °C or lower for the PEMFC with C-MPL & GDL, the pressure drop did not augment significantly during the first 1000 s of cell operation, indicating that water mainly existed and froze in the MEA area during the operation of the PEMFC. The PEMFCs with the dual H-MPL & GDL and H MPL & C-GDL operated for more than 800 s at −5.5 °C and −6.5 °C. Water reached the cathode flow channel and accumulate therein because of the increase in the pressure drop. The increasing rate of the pressure drop was reduced, because the water easily froze in the MEA with decreasing temperature, i.e., the amount of water moving to the flow channel reduced [11]. This trend also indicates that the supercooling degree affected the distance travelled by the supercooled water in the MEA. As the distance travelled by the supercooled water was shorter with the decrease in the temperature, the freezing mainly occurred in the area near the CL.
Figure 13a,b summarizes the effect of different structures on the PEMFC operation time at different below-freezing temperatures. The operation time was defined as the duration from the start of operation until the voltage becomes zero. As shown in Figure 13a, when only applying the hybrid MPL structure at −8.0 °C, the operation time of the PEMFC was 950 s, which is 2.14-times greater than that of the PEMFC with C-MPL & GDL (444 s). Furthermore, in the case of the dual H-MPL & GDL structure, the operation time was 1533 s, which is 3.45-times greater than that of the PEMFC with the C-MPL & GDL. Similarly, when the low-temperature start was at −9.0 °C, the operation times were 615 s and 1118 s for the PEMFCs with the H-MPL & C-GDL and dual H-MPL & GDL, respectively. As shown in Figure 13b, in which the enhancement ratio of operational time denotes the magnifications for C-MPL & GDL, the enhancement ratios of operation time were improved by 1.90- and 3.45-times. As described previously, the improvements can be attributed to the wettable area of the H-GDL, which mainly absorbed and kept the supercooled water inside the hydrophilic region. This also helped maintain an air diffusion channel in the hydrophobic area of the GDL, thus further prolonging the operation time at below-freezing temperatures. However, at −10.0 °C, the enhancement ratios of operation time of the PEMFCs with the H MPL & C-GDL and dual H-MPL & GDL were 347 s and 411 s, respectively, which are not significantly better (1.59- and 1.89-times) than that of the PEMFC with the C-MPL & GDL (218 s). The enhancement ratio was reduced with lowering temperature, because the water more likely froze with the increased supercooling of the water at such low temperatures. The amount of water reaching the GDL at −10.0 °C was less than that at −8.0 °C and −9.0 °C. Therefore, the influence of the hybrid MPL became more important, and the effectiveness of the H-GDL in improving the low-temperature start performance of the PEMFC decreased with the decrease in the temperature. When the temperature is below −10 °C, water may freeze in CL [6]. Therefore, H-MPL and H-GDL can improve the PEMFC’s low-temperature start performance above −10 °C under the condition of this study, in which the effectiveness of hybrid MPL/GDL is merely shown. However, a relatively thick bipolar plate was used in this study and the thermal insulation was not enough. Therefore, with thin bipolar plate and strict insulation, such as the central cell in the stack, the rate of temperature rise due to power generation becomes larger, and it is likely to operate in the further lower temperature range.
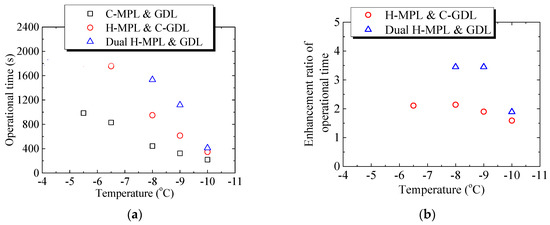
Figure 13.
Effect of different structures on the PEMFC operation time at different below-freezing temperatures: (a) Relationship between low-temperature start temperature and operation time of PEMFC with different structures of MPL/GDL; (b) The relation between the enhancement ratio of operational time and temperature.
5. Conclusions
The performance of a PEMFC with a novel H-MPL and H-GDL structure exhibiting planar-distributed wettability (dual H-GDL & MPL), in which hydrophilic and hydrophobic lines were alternately arranged in the in-plane direction, was investigated. The experiment was performed under the adequate assembly pressure of the MEA as an affecting factor on the PEMFC performance. The experimental results of the study are as follows.
- (1)
- The effect of the assembly pressure of MEA was first determined to use in the experiment, since increasing the assembly pressure between MEA reduces the thickness of GDL and MPL and causes a decrease in porosity. As a result, the working time of PEMFC at subfreezing temperature was longer at the lowest assembly pressure in this experiment.
- (2)
- The PEMFC with the dual H-GDL & MPL exhibited a better low-temperature start performance than those with the H-MPL & C-GDL and C-MPL & GDL. Therefore, it was shown further improvement in cold start ability by adding H-GDL to H-MPL.
- (3)
- The PEMFC with the dual hybrid MPL & GDL operated for more than 30 min at −4.5 °C, −5.5 °C, and −6.5 °C, whereas the PEMFCs with the H-MPL & C-GDL and C-MPL & GDL stopped operating when the temperature fell below −6.5 °C and −5.5 °C, respectively. The operation times of the PEMFC with the dual hybrid MPL & GDL for low-temperature start at −8.0 °C and −10.0 °C were 3.45- and 1.89-times greater than that of the PEMFC with the conventional MPL & GDL, respectively.
- (4)
- As the water froze easily in the MEA with decreasing temperature, the increasing rate of the pressure drop in the cathode flow channel was reduced because of the reduction in the amount of water moving to the flow channel. As the increased supercooling affected the freezing of the supercooled water in the MEA, the main freezing area became closer to the CL at lower temperatures.
Author Contributions
Conceptualization, Y.U.; methodology, G.W. and S.W.; resources, S.W.; writing—original draft preparation, G.W.; writing—review and editing, Y.U. All authors have read and agreed to the published version of the manuscript.
Funding
This research was funded by Joint Research Program between MOST & JST, No.2018YFE0202003 and the National Key Research and Development Program of China, No.2018YFB0105405.
Conflicts of Interest
The authors declare no conflict of interest. The funders had no role in the design of the study; in the collection, analyses, or interpretation of data; in the writing of the manuscript, or in the decision to publish the results.
References
- Xie, X.; Wang, R.; Jiao, K.; Zhang, G.; Zhou, J.; Du, Q. Investigation of the effect of micro-porous layer on PEM fuel cell cold start operation. Renew. Energy. 2018, 117, 125–134. [Google Scholar] [CrossRef]
- Wakatake, N.; Tabe, Y.; Chikahisa, T. Water Transport in Ionomer and Ice Formation during Cold Startup with Supercooled State in PEFC. ECS Trans. 2016, 75, 623–630. [Google Scholar] [CrossRef]
- Luo, Y.; Jiao, K. Cold start of proton exchange membrane fuel cell. Prog. Energy Combust. Sci. 2018, 64, 29–61. [Google Scholar] [CrossRef]
- Yang, Z.; Du, Q.; Huo, S.; Jiao, K. Effect of membrane electrode assembly design on the cold start process of proton exchange membrane fuel cells. Int. J. Hydrogen Energy 2017, 42, 25372–25387. [Google Scholar] [CrossRef]
- Wan, Z.; Chang, H.; Shu, S.; Wang, Y.; Tang, H. A Review on Cold Start of Proton Exchange Membrane Fuel Cells. Energies 2014, 7, 3179–3203. [Google Scholar] [CrossRef]
- Tabe, Y.; Aoyama, Y.; Kadowaki, K.; Suzuki, K.; Chikahisa, T. Impact of micro-porous layer on liquid water distribution at the catalyst layer interface and cell performance in a polymer electrolyte membrane fuel cell. J. Power Sources 2015, 287, 422–430. [Google Scholar] [CrossRef]
- Huo, S.; Jiao, K.; Park, J. On the water transport behavior and phase transition mechanisms in cold start operation of PEM fuel cell. Appl. Energy 2019, 233–234, 776–788. [Google Scholar] [CrossRef]
- Ozden, A.; Shahgaldi, S.; Li, X.; Hamdullahpur, F. A review of gas diffusion layers for proton exchange membrane fuel cells—With a focus on characteristics, characterization techniques, materials and designs. Prog. Energy Combust. Sci. 2019, 74, 50–102. [Google Scholar] [CrossRef]
- Vijay, R.; Prathap, H. Effect of cyclic compression on structure and properties of a Gas Diffusion Layer used in PEM fuel cells. Int. J. Hydrogen Energy 2010, 35, 11107–11118. [Google Scholar]
- Velan, V.S.; Velayutham, G.; Rajalakshmi, N.; Dhathathreyan, K.S. Influence of compressive stress on the pore structure of carbon cloth based gas diffusion layer investigated by capillary flow porometry. Int. J. Hydrogen Energy 2014, 39, 1752–1759. [Google Scholar] [CrossRef]
- Simon, C.; Hasche, F.; Muller, D.; Gasteiger, H.A. Influence of the Gas Diffusion Layer Compression on the Oxygen Mass Transport in PEM Fuel Cells. ECS Trans. 2015, 69, 1293–1302. [Google Scholar] [CrossRef]
- Carcadea, E.; Varlam, M.; Ingham, D.B.; Patularu, L.G.; Marinoiu, A.; Ion-Ebrasu, D.; Stefanescu, I. Effect of GDL (+MPL) Compression on the PEM Fuel Cell Performance. ECS Trans. 2016, 75, 167–177. [Google Scholar] [CrossRef]
- Dafalla, A.M.; Wei, L.; Liao, Z.H.; Jiang, F.M. Effects of Clamping Pressure on Cold Start Behavior of Polymer Electrolyte Fuel Cells. Fuel Cells 2019, 19, 221–230. [Google Scholar] [CrossRef]
- Oberholzer, P.; Boillat, P.; Siegrist, R.; Perego, R.; Kastner, A.; Lehmann, E.; Scherer, G.G.; Wokaun, A. Cold-Start of a PEFC Visualized with High Resolution Dynamic In-Plane Neutron Imaging. J. Electrochem. Soc. 2012, 159, B235–B245. [Google Scholar] [CrossRef]
- Stahl, P.; Biesdorf, J.; Boillat, P.; Friedrich, K.A. An Investigation of PEFC Sub-Zero Startup: Evidence of Local Freezing Effects. J. Electrochem. Soc. 2016, 163, F1535–F1542. [Google Scholar] [CrossRef]
- Wong, A.; Ge, N.; Shrestha, P.; Liu, H.; Fahy, H.; Bazylak, A. Polytetrafluoroethylene content in standalone microporous layers: Tradeoff between membrane hydration and mass transport losses in polymer electrolyte membrane fuel cells. Appl. Energy 2019, 240, 549–560. [Google Scholar] [CrossRef]
- Aoyama, Y.; Suzuki, K.; Tabe, Y.; Chikahisa, T.; Tanuma, T. Water Transport and PEFC Performance with Different Interface Structure between Micro-Porous Layer and Catalyst Layer. J. Electrochem. Soc. 2016, 163, F359–F366. [Google Scholar] [CrossRef]
- Ito, H.; Heo, Y.; Ishida, M.; Nakano, A.; Someya, S.; Munakata, T. Application of a self-supporting microporous layer to gas diffusion layers of proton exchange membrane fuel cells. J. Power Sources 2017, 342, 393–404. [Google Scholar] [CrossRef]
- Hirakata, S.; Hara, M.; Kakinuma, K.; Uchida, M.; Tryk, D.A.; Uchida, H.; Watanabe, M. Investigation of the effect of a hydrophilic layer in the gas diffusion layer of a polymer electrolyte membrane fuel cell on the cell performance and cold start behavior. Electrochim. Acta 2014, 120, 240–247. [Google Scholar] [CrossRef]
- Utaka, Y.; Hirose, I.; Tasaki, Y. Characteristics of oxygen diffusivity and water distribution by X-ray radiography in microporous media in alternate porous layers of different wettability for moisture control in gas diffusion layer of PEFC. Int. J. Hydrogen Energy 2011, 36, 9128–9138. [Google Scholar] [CrossRef]
- Koresawa, R.; Utaka, Y. Improvement of oxygen diffusion characteristic in gas diffusion layer with planar-distributed wettability for polymer electrolyte fuel cell. J. Power Sources 2014, 271, 16–24. [Google Scholar] [CrossRef]
- Utaka, Y.; Koresawa, R. Performance enhancement of polymer electrolyte fuel cells by combining liquid removal mechanisms of a gas diffusion layer with wettability distribution and a gas channel with microgrooves. J. Power Sources 2016, 323, 37–43. [Google Scholar] [CrossRef]
- Utaka, Y.; Koresawa, R. Effect of wettability-distribution pattern of the gas diffusion layer with a microgrooved separator on polymer electrolyte fuel cell performance. J. Power Sources 2017, 363, 227–233. [Google Scholar] [CrossRef]
- Manzi-Orezzoli, V.; Siegwart, M.; Scheuble, D.; Chen, Y.; Schmidt, T.; Boillat, P. Impact of the Microporous Layer on Gas Diffusion Layers with Patterned Wettability I: Material Design and Characterization. J. Electrochem. Soc. 2020, 167, 064516. [Google Scholar] [CrossRef]
- Wang, G.; Utaka, Y.; Wang, S. Planar-distributed wettability of microporous layer of polymer electrolyte fuel cell to improve cold start performance. J. Power Sources 2019, 437, 226930. [Google Scholar] [CrossRef]
- Li, L.; Wang, S.; Yue, L.; Wang, G. Cold-start icing characteristics of proton-exchange membrane fuel cells. Int. J. Hydrogen Energy 2019, 44, 12033–12042. [Google Scholar] [CrossRef]


© 2020 by the authors. Licensee MDPI, Basel, Switzerland. This article is an open access article distributed under the terms and conditions of the Creative Commons Attribution (CC BY) license (http://creativecommons.org/licenses/by/4.0/).