A New Effective Method of Induction Machine Condition Assessment Based on Zero-Sequence Voltage (ZSV) Symptoms


Abstract
:
1. Introduction
2. Application of ZSV to Induction Motor Fault Detection
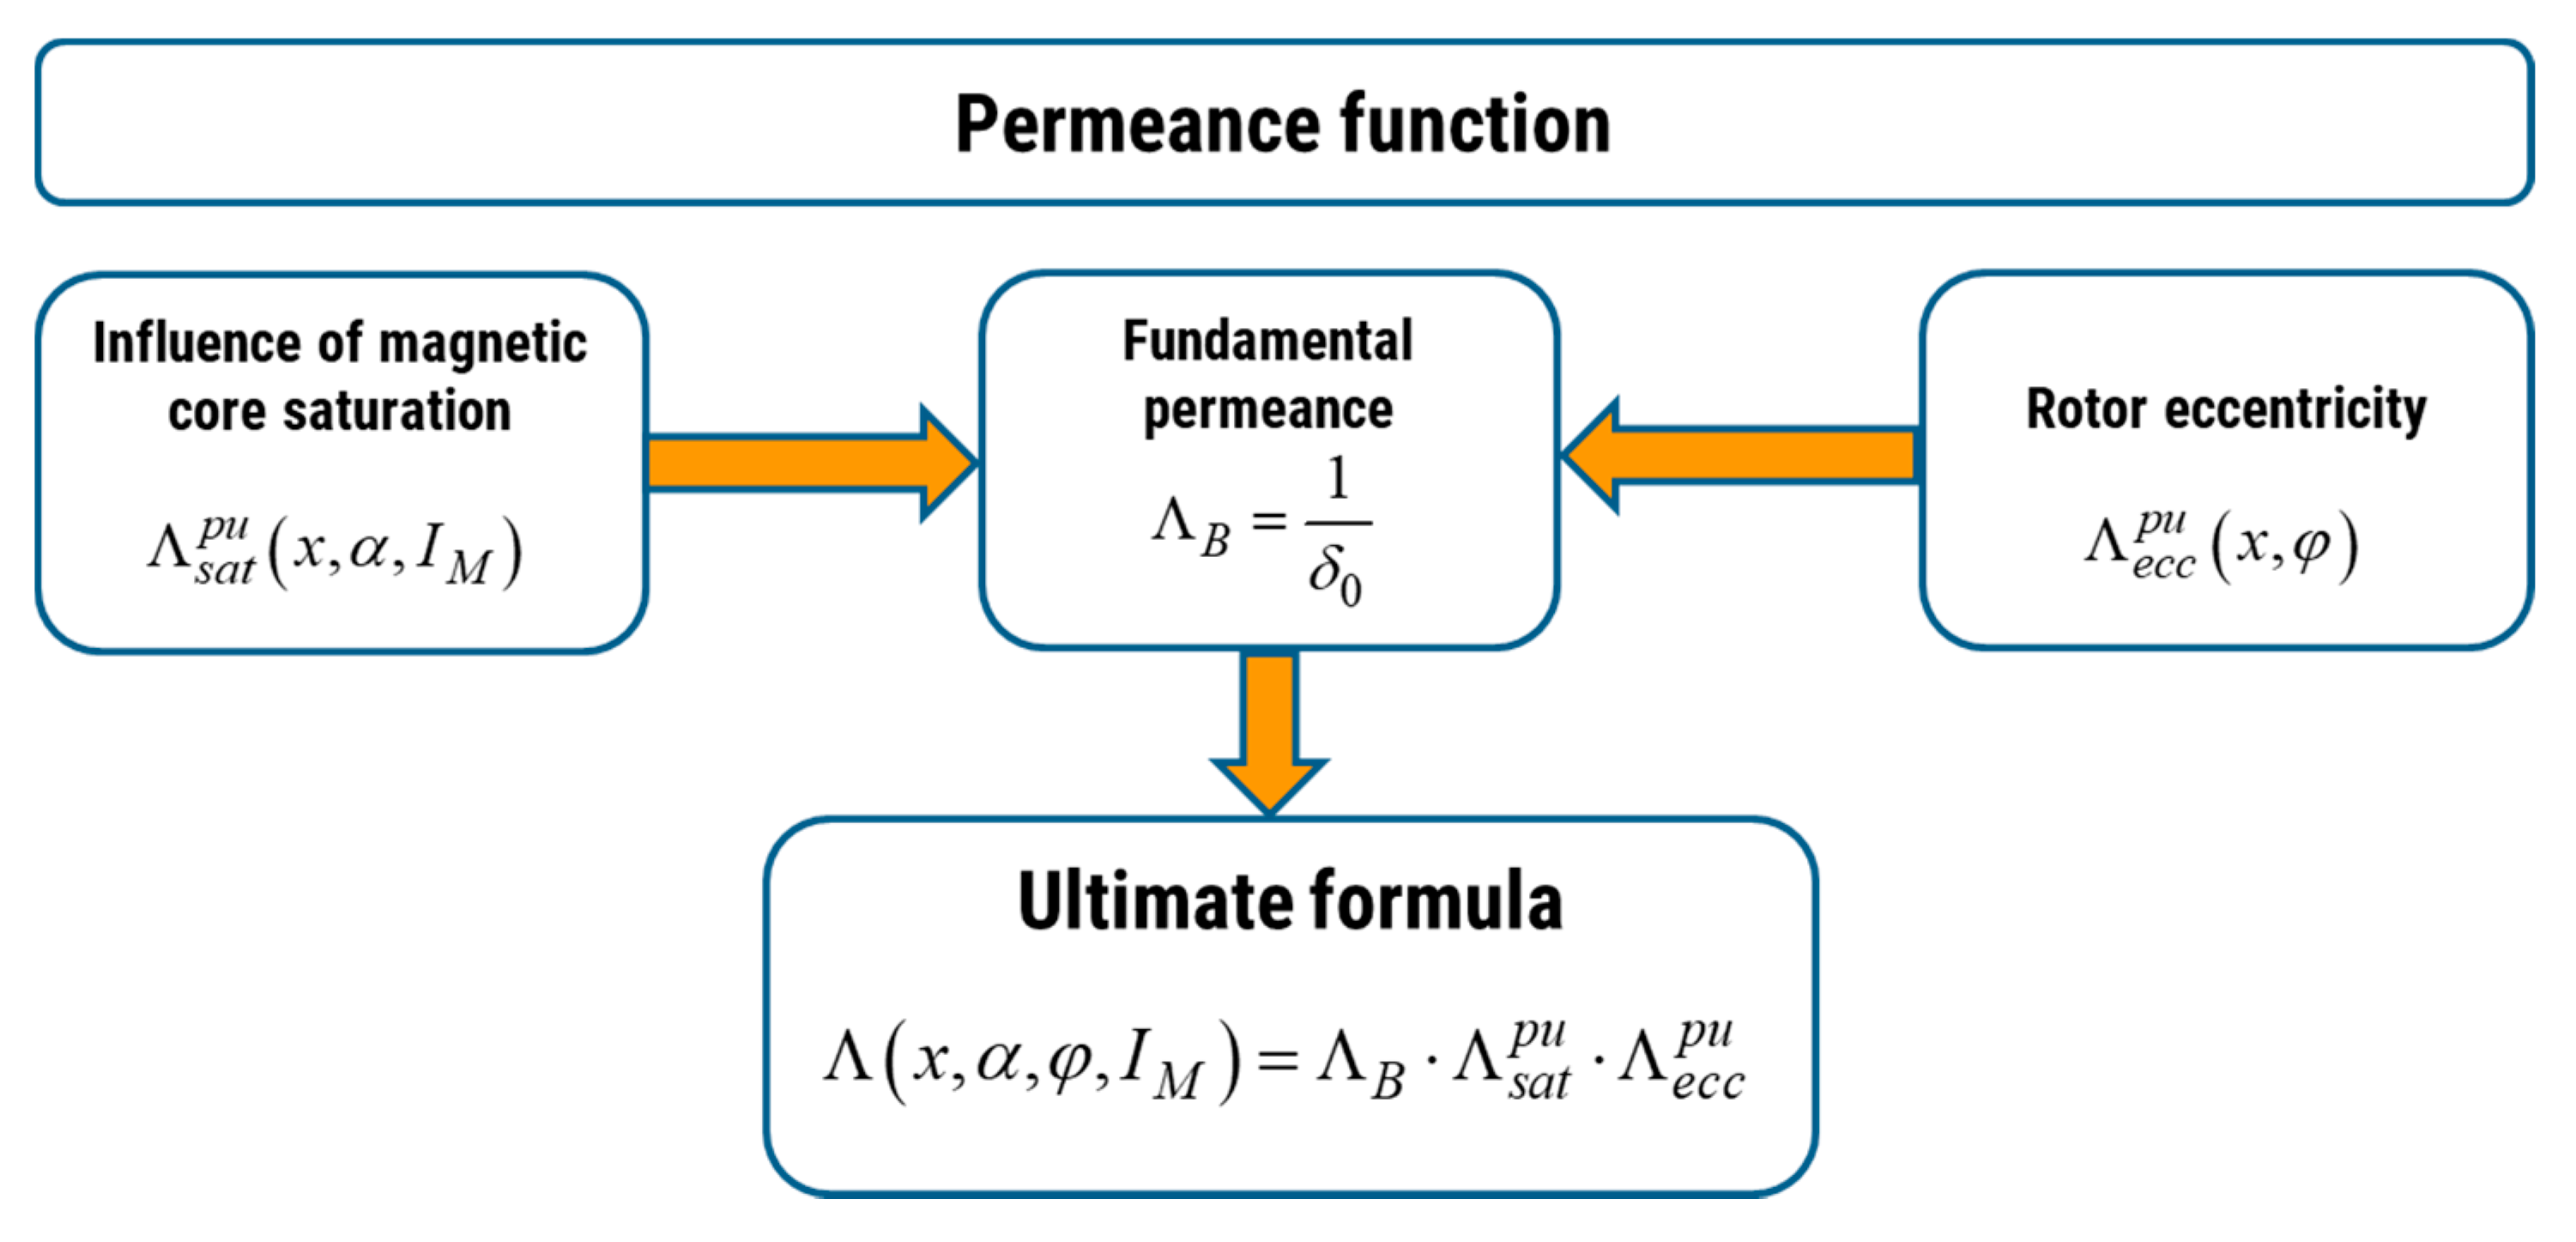
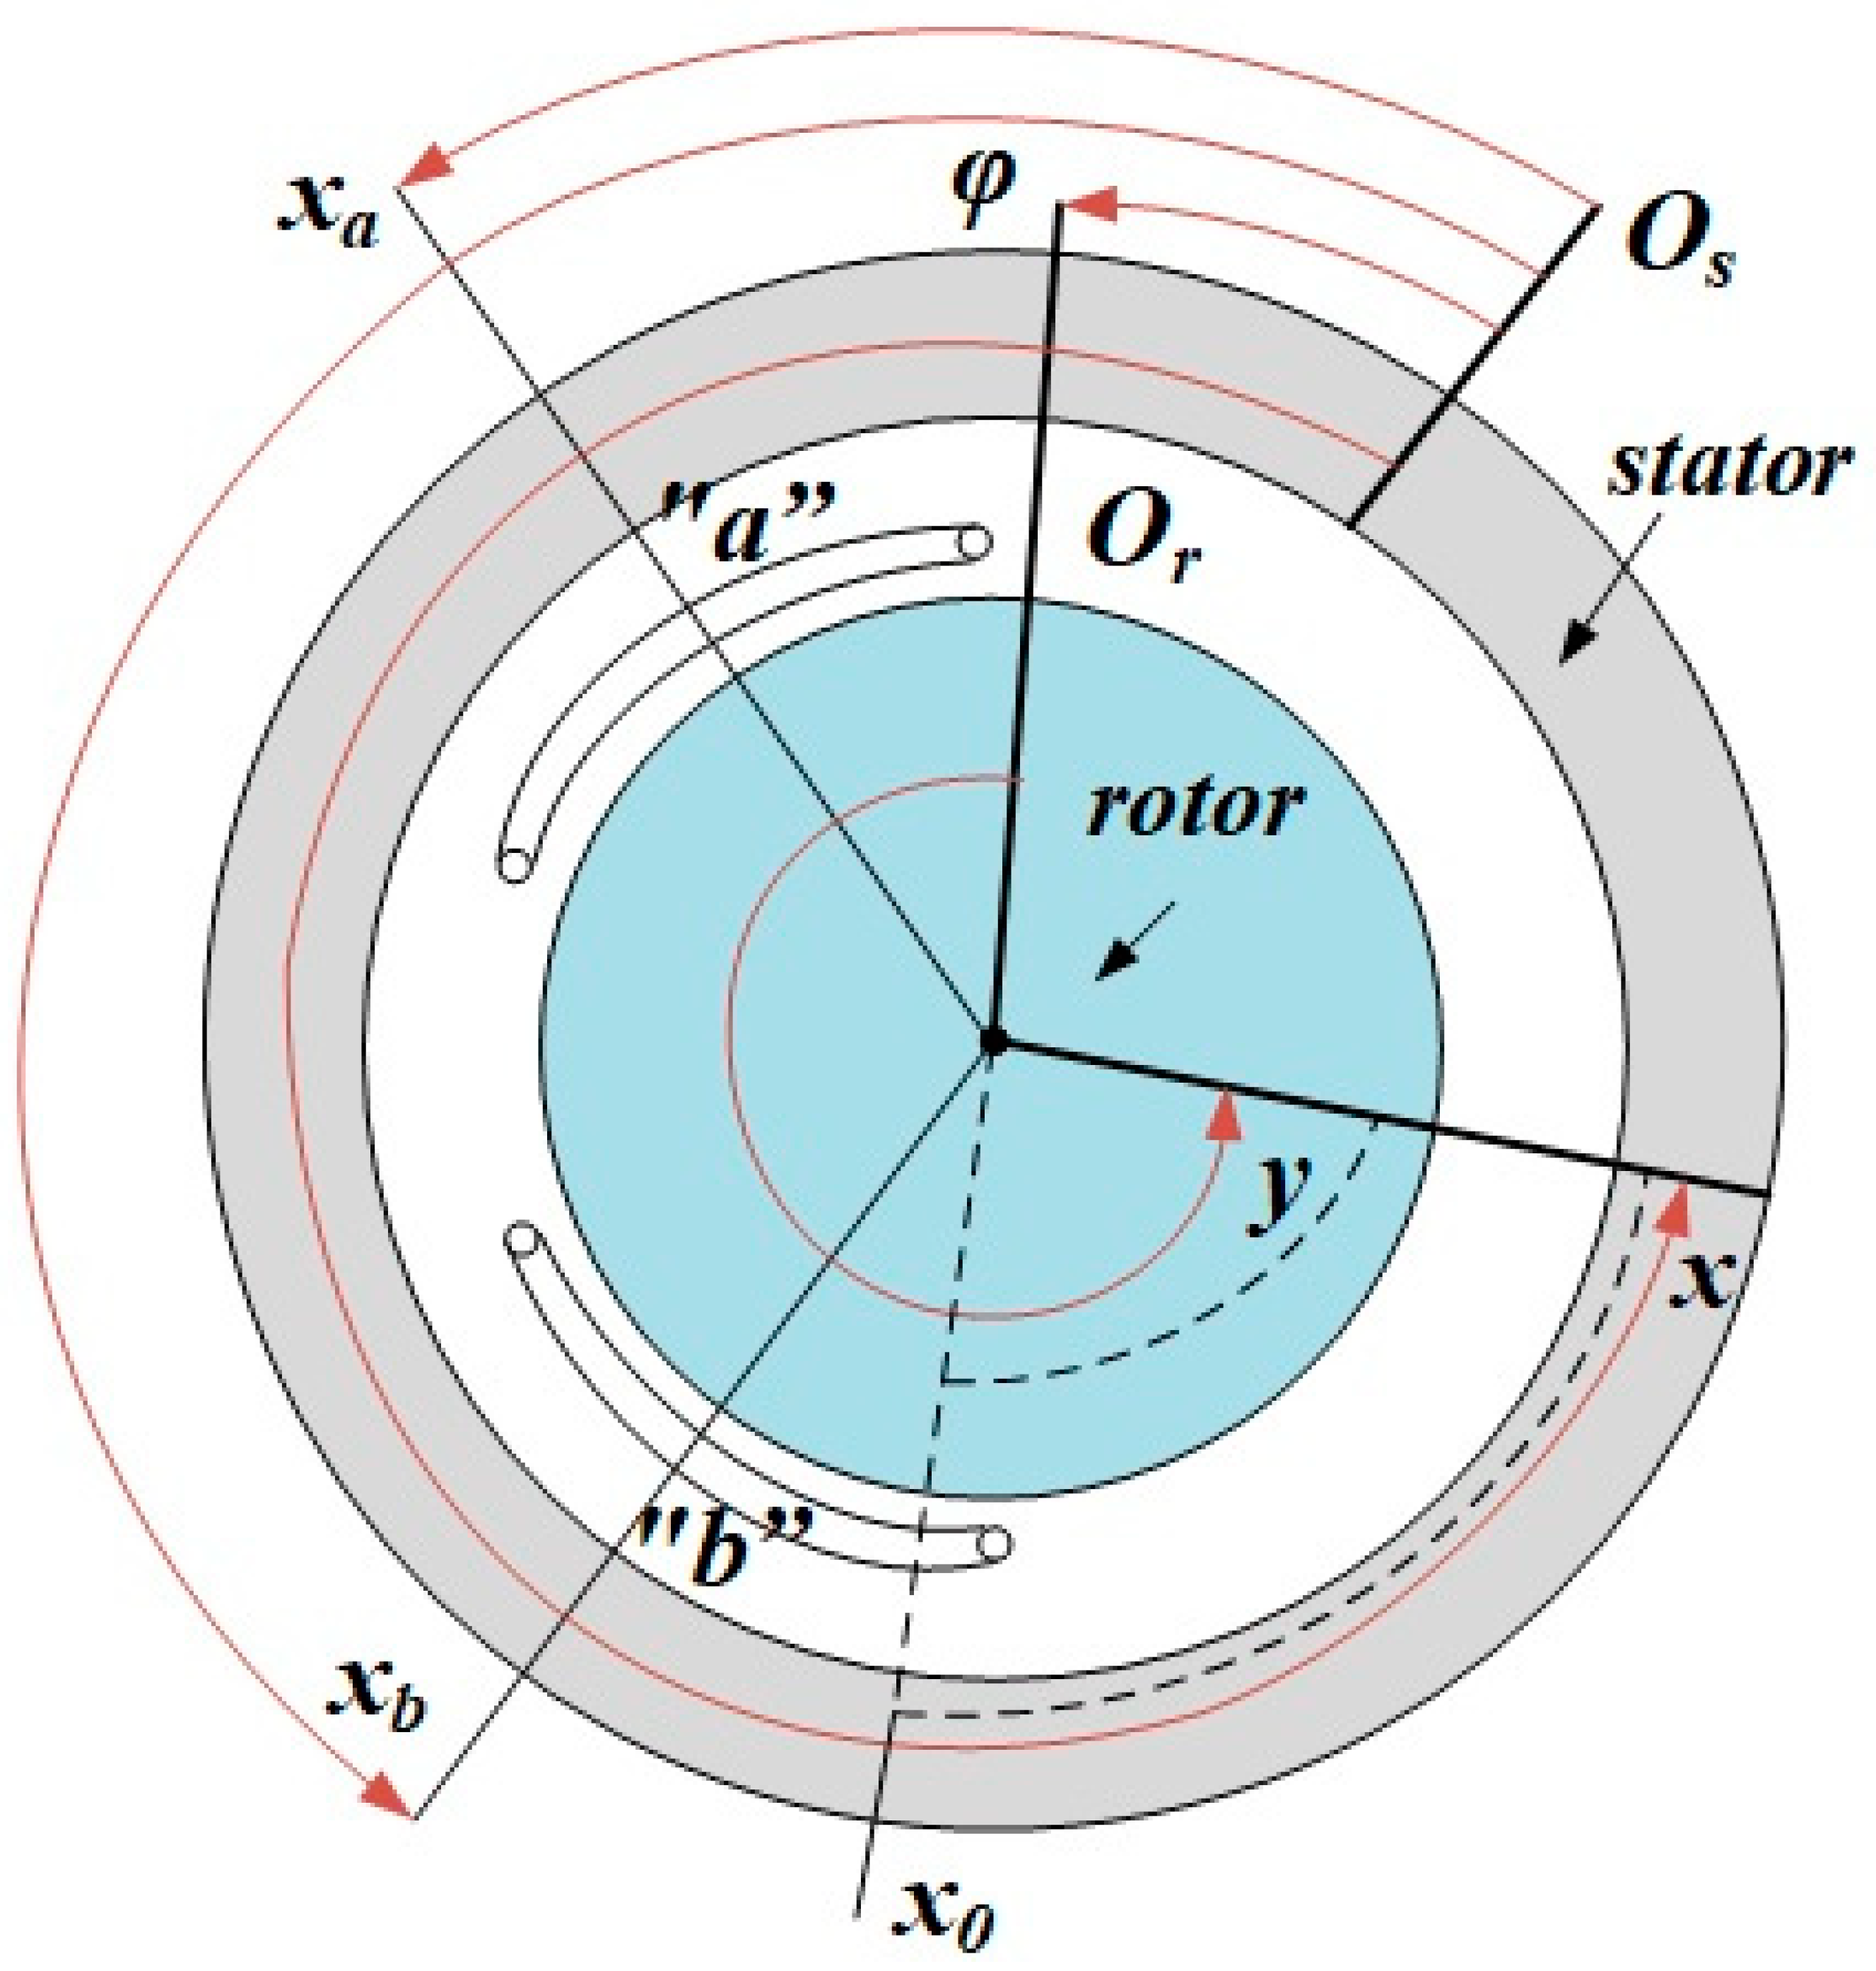
3. Permeance Function Including the Influence of Magnetic Circuit Saturation for Different Types of Eccentricity
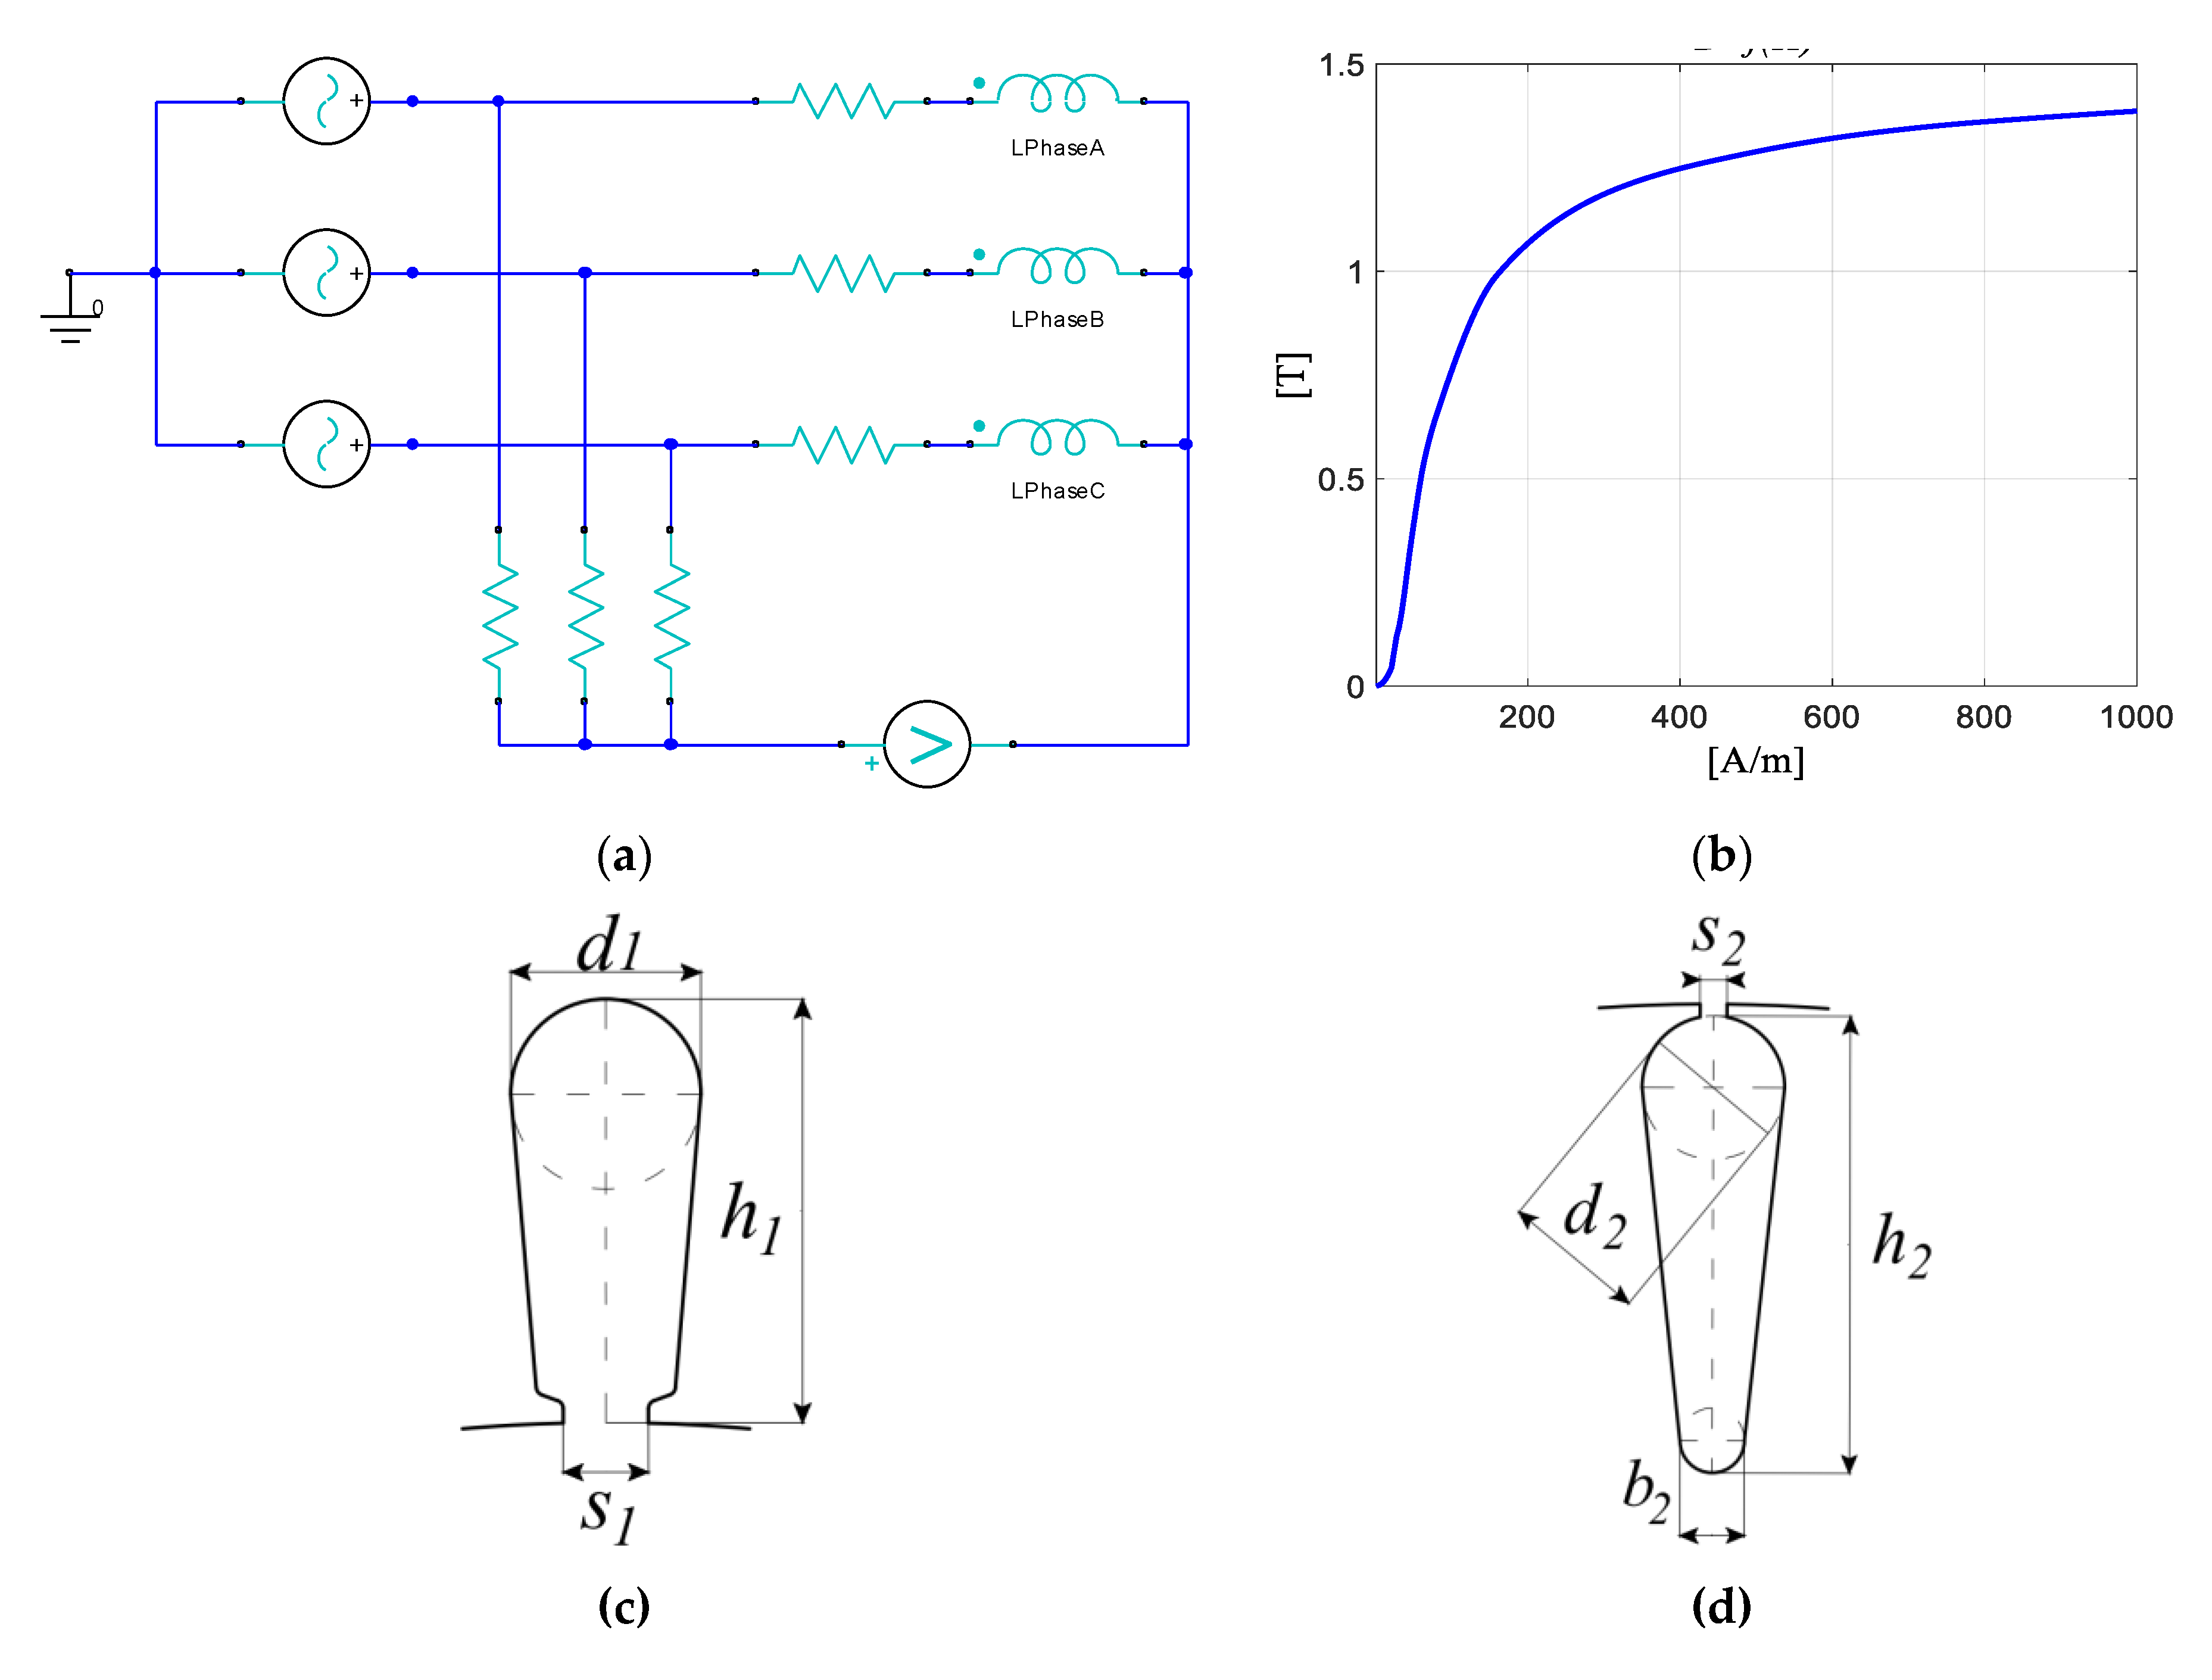
4. Mathematical Model of the Cage Induction Motor
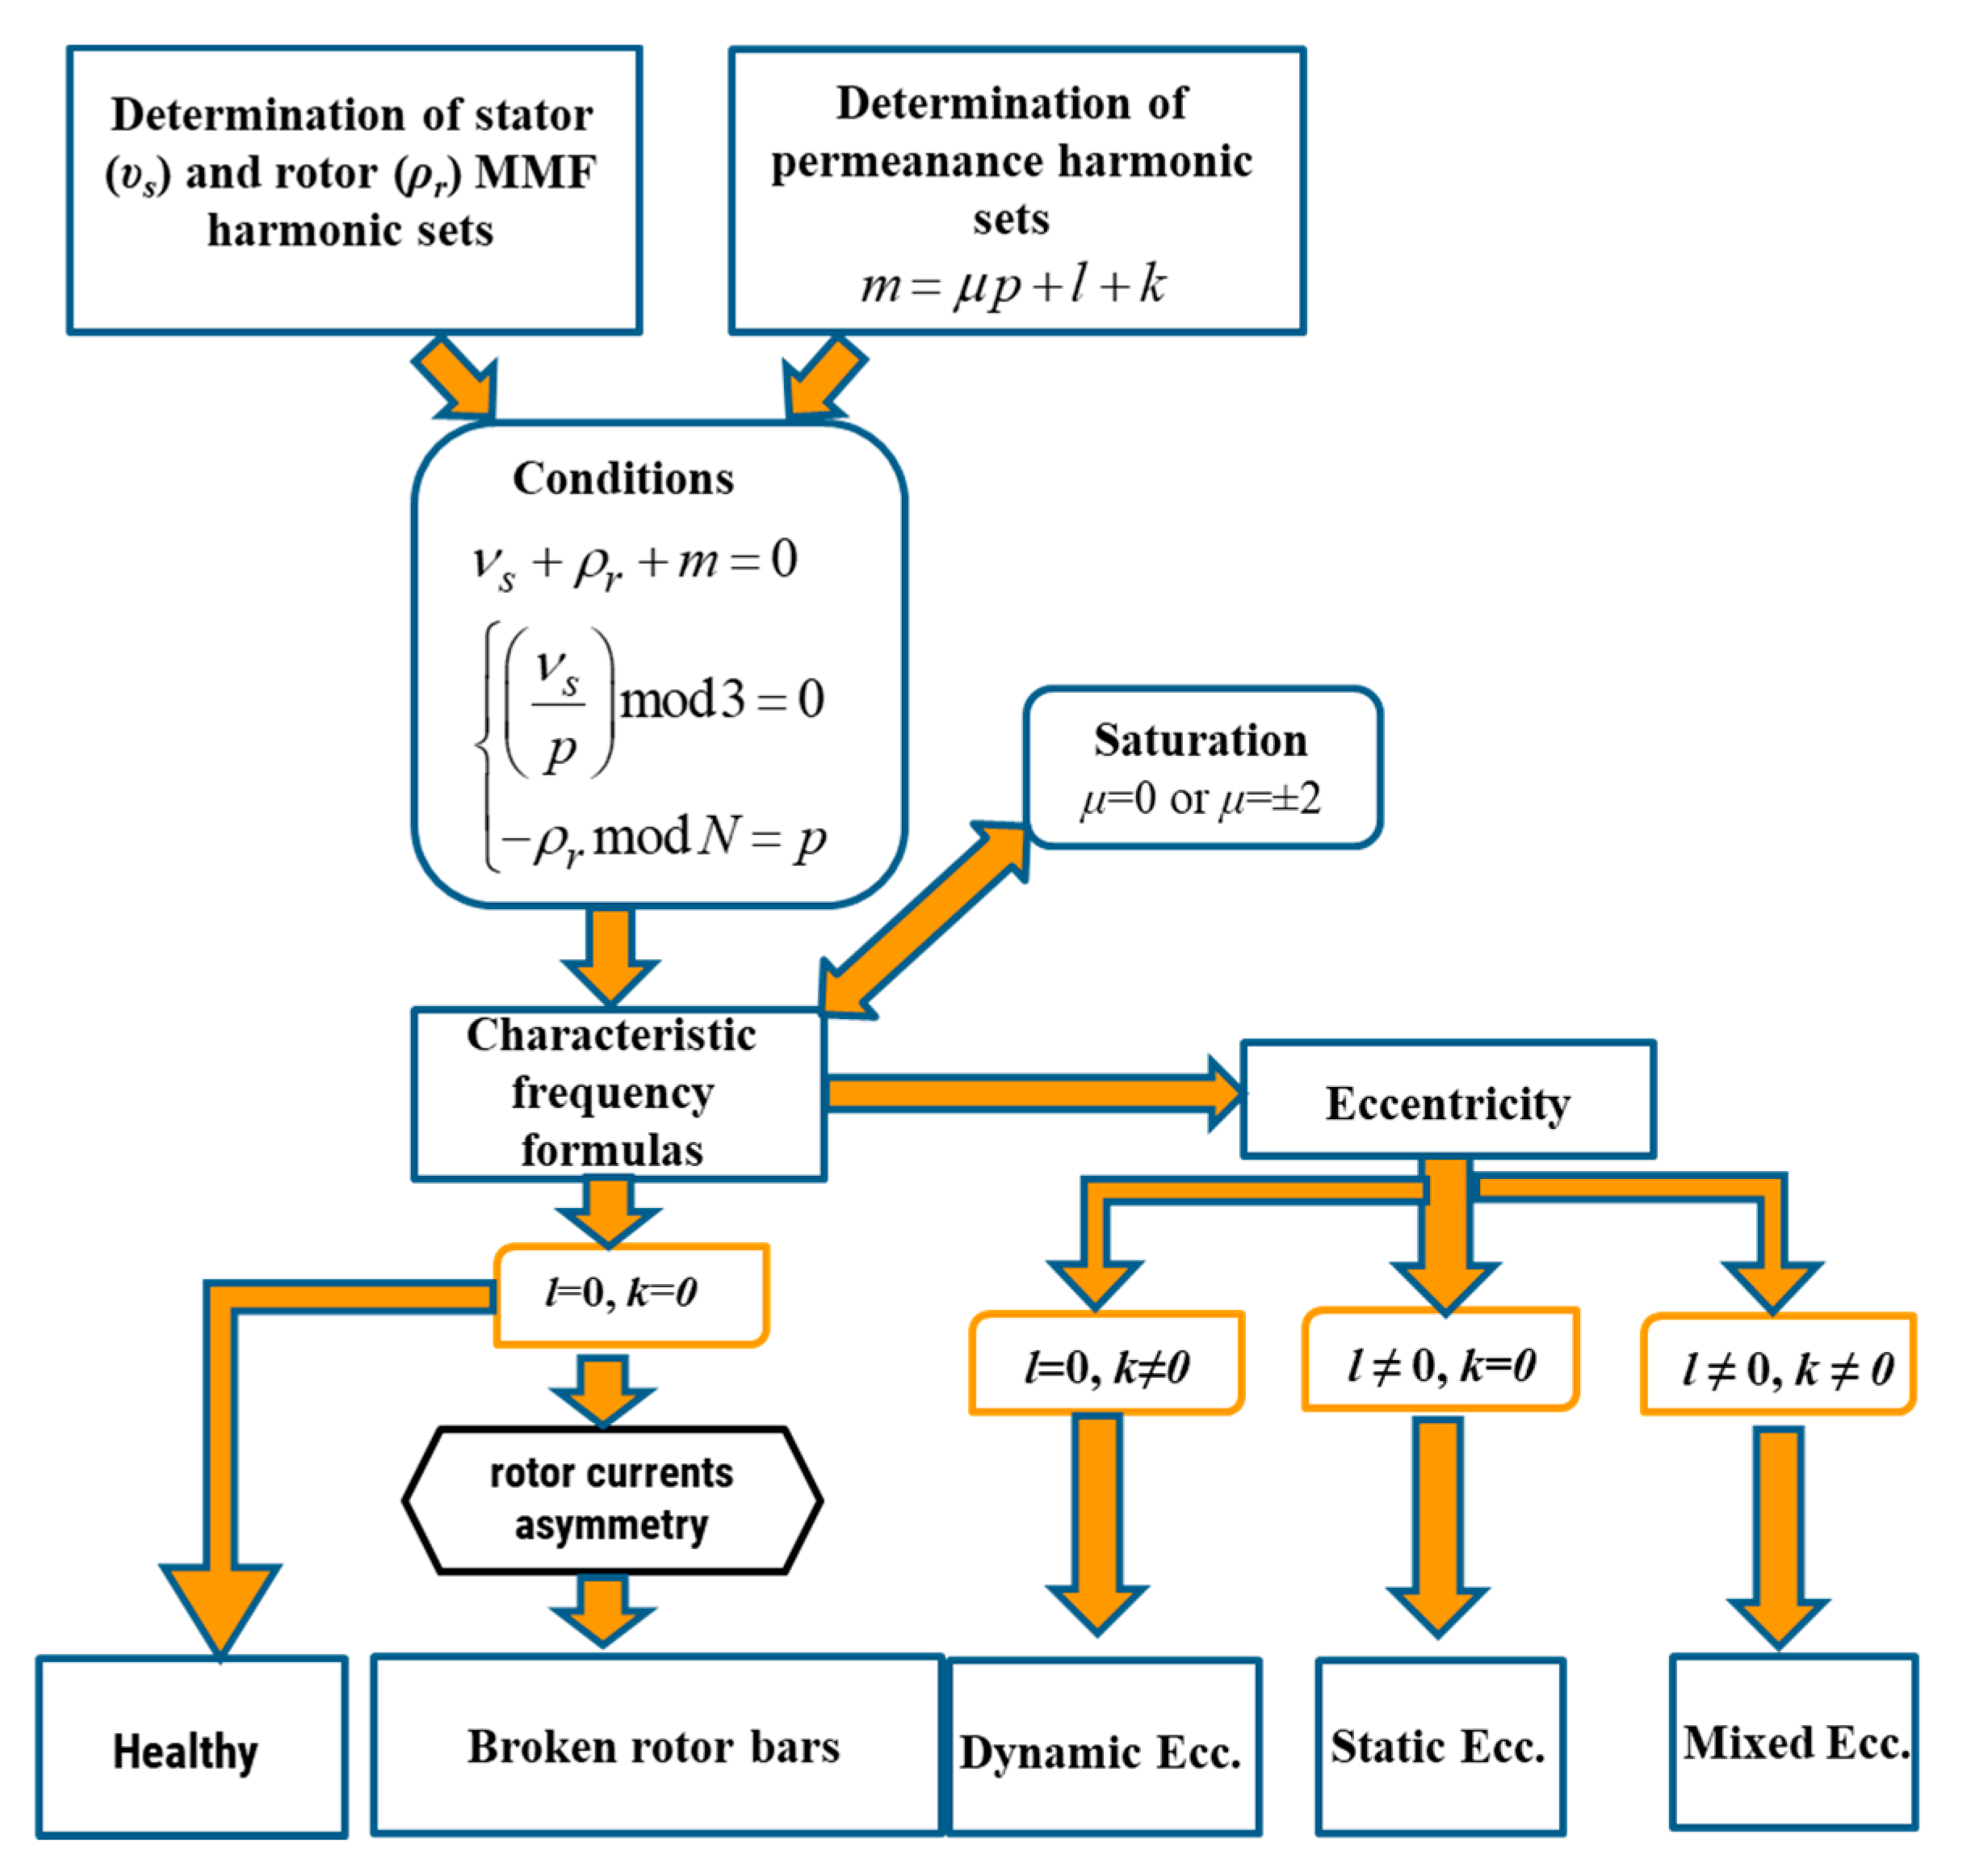
Algorithm of Characteristic Frequencies Calculation for a Given Type of Asymmetry
- Define the set of harmonic orders approximating the magnetic field of the stator and rotor , following the assumptions.
- Define the set of harmonic orders, which model the air gap magnetic permeance , determined by eccentricity sets: , and magnetic core saturation .
- Generate the combination of harmonic orders from sets , , and , respectively, which meet the inductance existence condition below:
- Select the combination of harmonic orders generated in point 3, which are related to the cell located in the 0-th row and p-th column of the stator-rotor mutual inductance matrix. Such combinations meet the condition:
- Generate frequency patterns using Formulas (30) and (32), and next select the right patterns depending on the type of fault, according to Table 2.
- The magnetic field of the stator winding with pole pair p = 2 and the magnetic field of the rotor cage with rotor bars numbering N = 28 were approximated by a Fourier series containing harmonics and , respectively.
- In the permeance function, the following harmonic orders were included: , where: , , and .
5. FEM Analysis
6. Results
6.1. Simulation Results
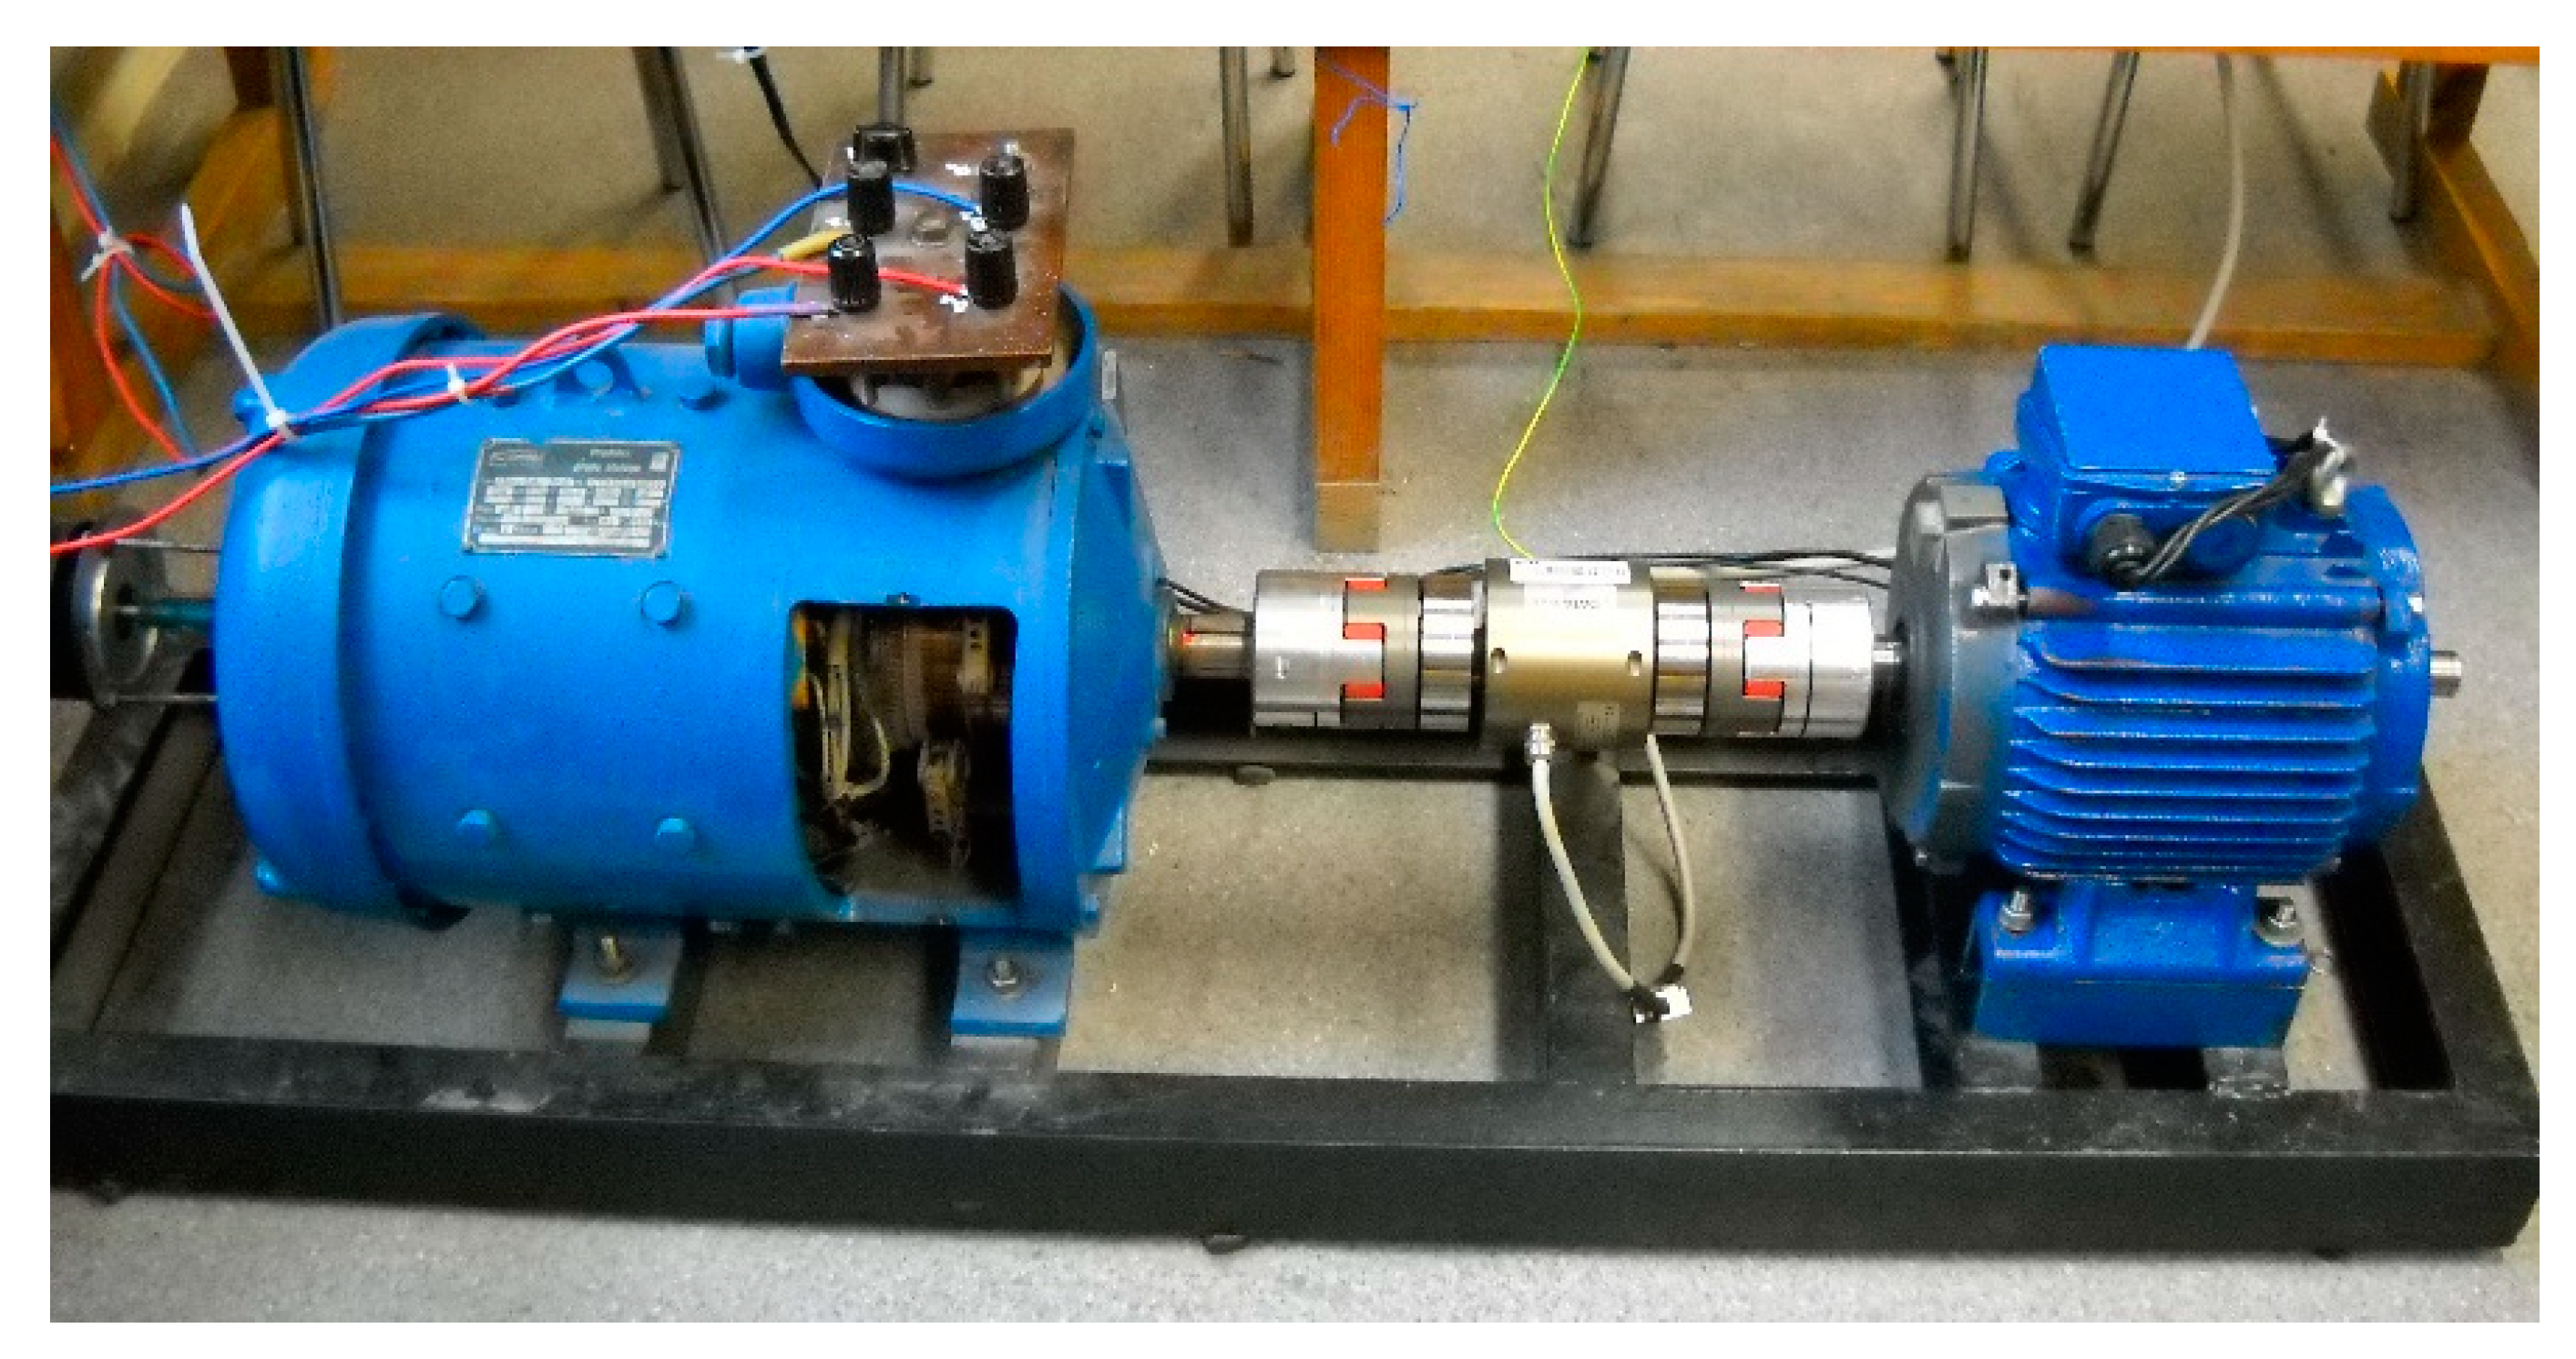
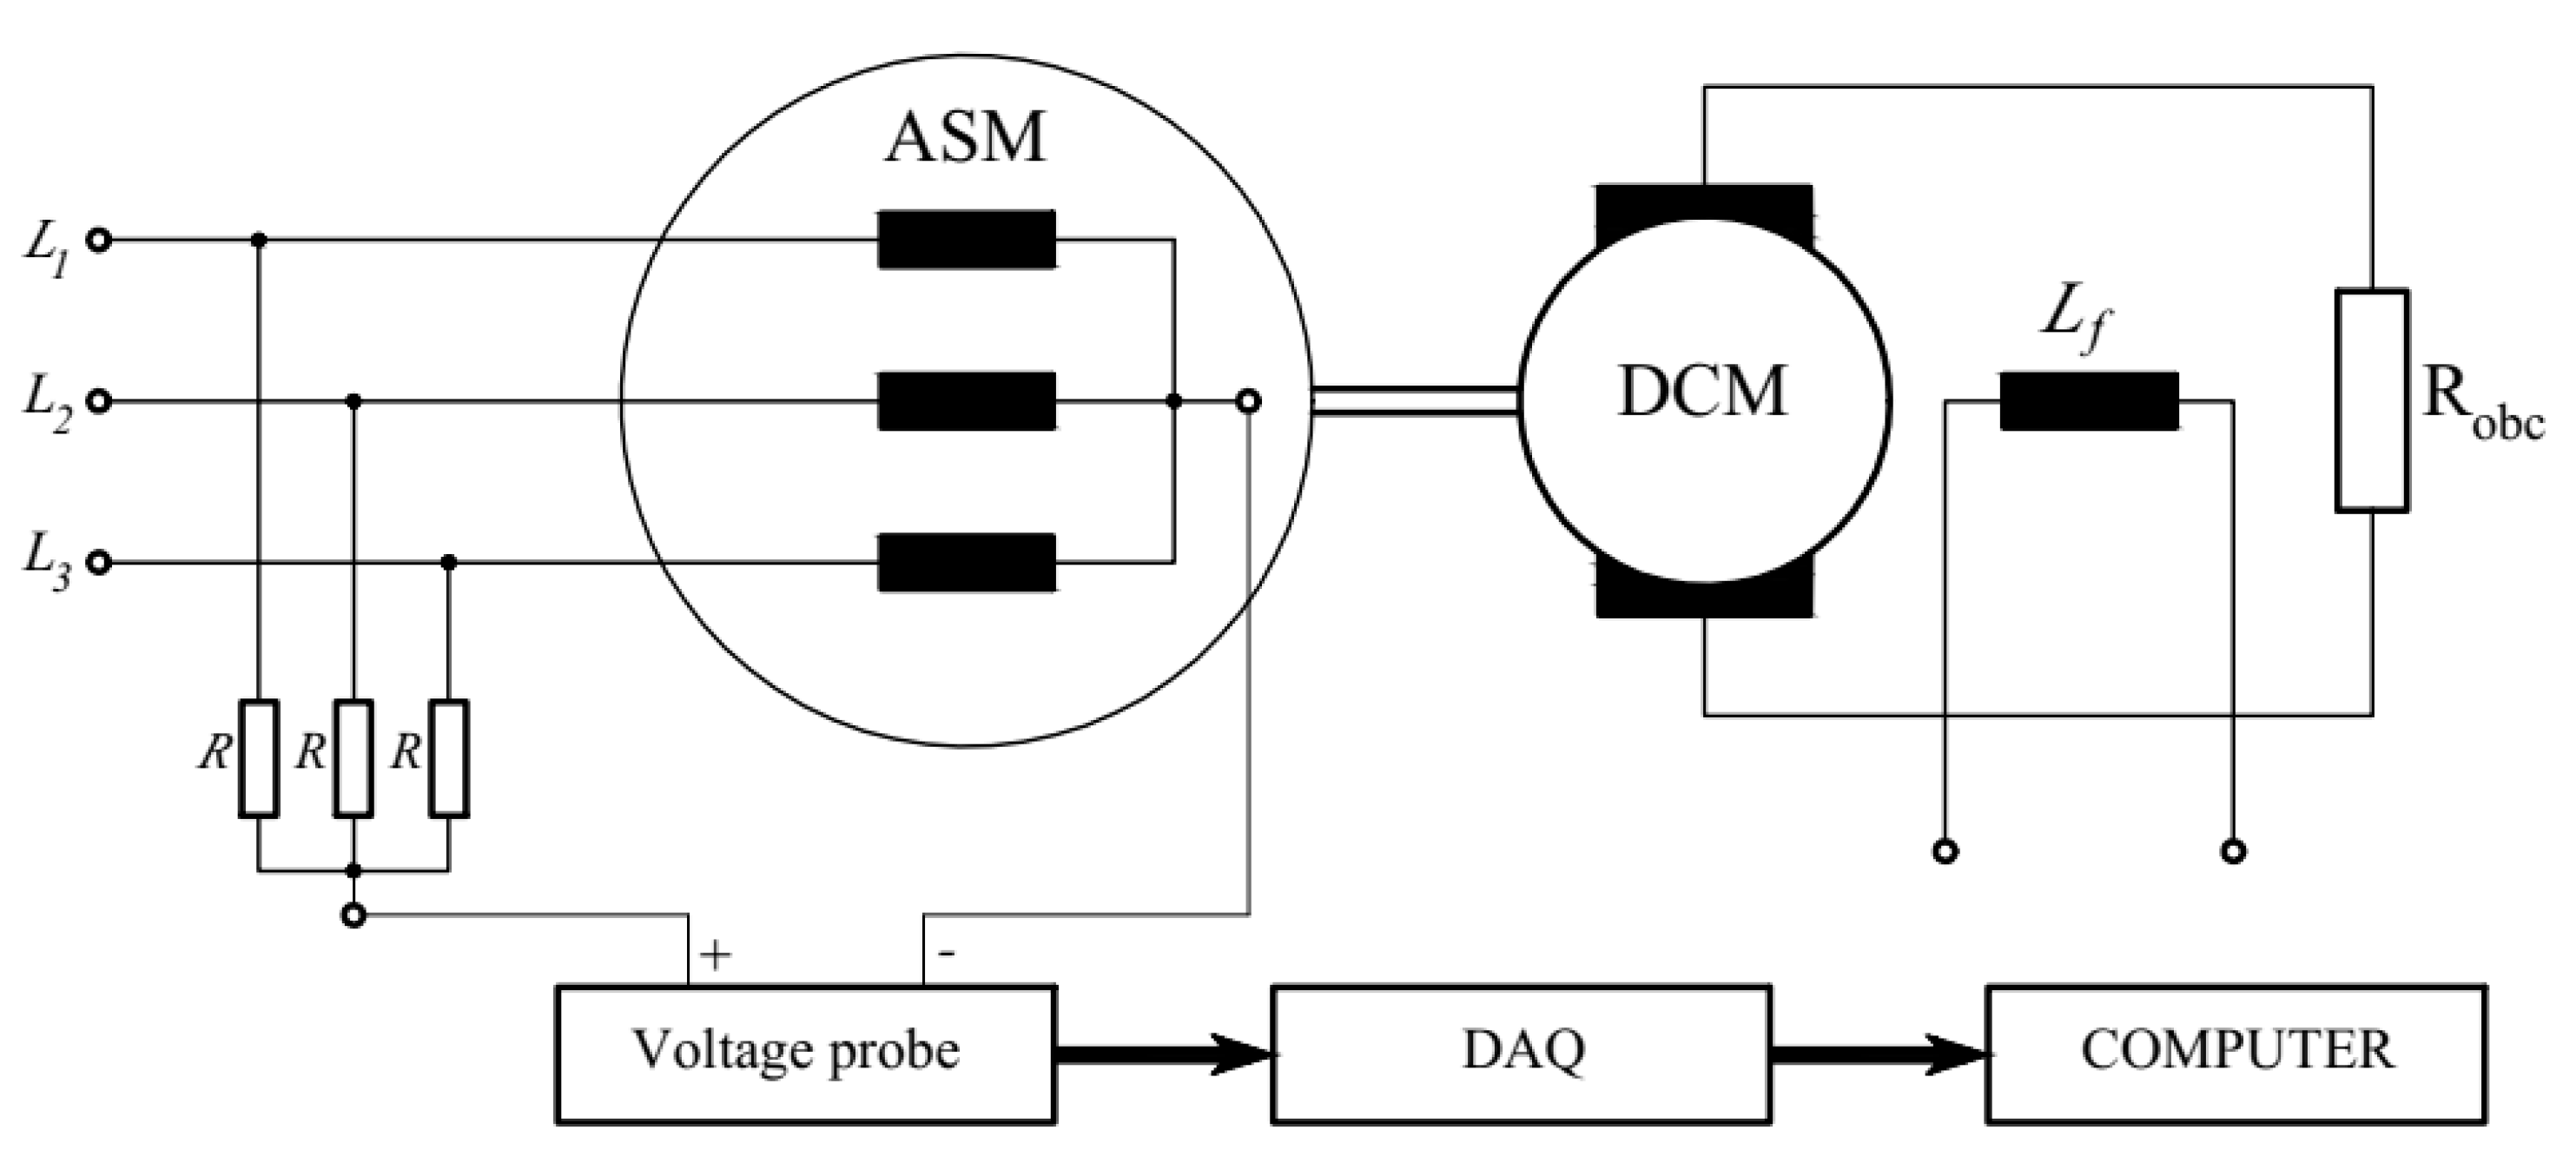
6.2. Laboratory Tests
7. Discussion
7.1. Algorithm
7.2. Rotor Cage Asymmetry and Dynamic Eccentricity
7.3. Static Eccentricity
7.4. Mixed Eccentricity
7.5. Drawbacks of ZSV-Based Cage Induction Motor Fault Detection
8. Conclusions
Author Contributions
Funding
Conflicts of Interest
References
- Merizalde, Y.; Hernández-Callejo, L.; Duque-Perez, O. State of the art and trends in the monitoring, detection and diagnosis of failures in electric induction motors. Energies 2017, 10, 1056. [Google Scholar] [CrossRef] [Green Version]
- Henao, H.; Capolino, G.A.; Fernandez-Cabanas, M.; Filippetti, F.; Bruzzese, C.; Strangas, E.; Pusca, R.; Estima, J.; Riera-Guasp, M.; Hedayati-Kia, S. Trends in fault diagnosis for electrical machines: A review of diagnostic techniques. IEEE Ind. Electron. Mag. 2014, 8, 31–42. [Google Scholar] [CrossRef]
- Bellini, A.; Filippetti, F.; Tassoni, C.; Capolino, G. Advances in diagnostic techniques for induction machines. IEEE Trans. Ind. Electron. 2008, 55, 4109–4126. [Google Scholar] [CrossRef]
- Khelfi, H.; Hamdani, S. Induction motor rotor fault diagnosis using three-phase current intersection signal. Electr. Eng. 2019. [Google Scholar] [CrossRef]
- Miljković, D. Brief review of motor current signature analysis. HDKBR Info Mag. 2015, 5, 14–26. Available online: https://hrcak.srce.hr/148715 (accessed on 2 June 2020).
- Concari, C.; Franceschini, G.; Tassoni, C. Rotor fault detection in closed loop induction motors drives by electric signal analysis. In Proceedings of the 2008 18th International Conference on Electrical Machines, Vilamoura, Portugal, 6–9 September 2008; pp. 1–6. [Google Scholar]
- Burriel-Valencia, J.; Puche-Panadero, R.; Martinez-Roman, J.; Sapena-Bano, A.; Pineda-Sanchez, M. Fault diagnosis of induction machines in a transient regime using current sensors with an optimized slepian window. Sensors 2018, 18, 146. [Google Scholar] [CrossRef] [Green Version]
- Zhen, D.; Wang, Z.; Li, H.; Zhang, H.; Yang, J.; Gu, F. An improved cyclic modulation spectral analysis based on the CWT and its application on broken rotor bar fault diagnosis for induction motors. Appl. Sci. 2019, 9, 3902. [Google Scholar] [CrossRef] [Green Version]
- Zolfaghari, S.; Noor, S.B.M.; Rezazadeh Mehrjou, M.; Marhaban, M.H.; Mariun, N. Broken rotor bar fault detection and classification using wavelet packet signature analysis based on fourier transform and multi-layer perceptron neural network. Appl. Sci. 2018, 8, 25. [Google Scholar] [CrossRef] [Green Version]
- Gyftakis, K.N.; Kappatou, J.C. The zero-sequence current as a generalized diagnostic mean in Δ-connected three-phase induction motors. IEEE Trans. Energy Convers. 2014, 29, 138–148. [Google Scholar] [CrossRef]
- Gyftakis, K.N.; Antonino-Daviu, J.A.; Kappatou, J.C. The influence of the induction motor rotor geometry on the higher harmonic index of the zero-sequence current. In Proceedings of the 2016 19th International Conference on Electrical Machines and Systems (ICEMS), Chiba, Japan, 13–16 November 2016; pp. 1–5. [Google Scholar]
- Gyftakis, K.N.; Antonino-Daviu, J.A.; Garcia-Hernandez, R.; McCulloch, M.D.; Howey, D.A.; Cardoso, A.J.M. Comparative experimental investigation of broken bar fault detectability in induction motors. IEEE Trans. Ind. Appl. 2016, 52, 1452–1459. [Google Scholar]
- Briz, F.; Degner, M.W.; Garcia, P.; Dicz, A.B. Induction machine diagnostics using zero sequence component. In Proceedings of the Fourtieth IAS Annual Meeting, Kowloon, Hong Kong, 2–6 October 2005; Volume 1, pp. 34–41. [Google Scholar]
- Antonino-Daviu, J.A.; Gyftakis, K.N.; Garcia-Hernandez, R.; Razik, H.; Cardoso, A.J.M. Comparative influence of adjacent and non-adjacent broken rotor bars on the induction motor diagnosis through MCSA and ZSC methods. In Proceedings of the IECON 2015-41st Annual Conference of the IEEE Industrial Electronics Society, Yokohama, Japan, 9–12 November 2015; pp. 001680–001685. [Google Scholar]
- Morinigo-Sotelo, D.; Romero-Troncoso, R.J.; Panagiotou, P.A.; Antonino-Daviu, J.A.; Gyftakis, K.N. Reliable detection of rotor bars breakage in induction motors via MUSIC and ZSC. IEEE Trans. Ind. Appl. 2018, 54, 1224–1234. [Google Scholar] [CrossRef]
- Hou, Z.; Huang, J.; Liu, H.; Ye, M.; Liu, Z.; Yang, J. Diagnosis of broken rotor bar fault in open- and closed-loop controlled wye-connected induction motors using zero-sequence voltage. IET Electr. Power Appl. 2017, 11, 1214–1223. [Google Scholar] [CrossRef]
- Drozdowski, P.; Duda, A. Influence of magnetic saturation effects on the fault detection of induction motors. Arch. Electr. Eng. 2014, 63, 489–506. [Google Scholar] [CrossRef] [Green Version]
- Garcia, P.; Briz, F.; Degner, M.W.; Diez, A.B. Diagnostics of induction machines using the zero sequence voltage. In Proceedings of the 39th IAS Annual Meeting, Seattle, WA, USA, 3–7 October 2004; Volume 2, pp. 735–742. [Google Scholar]
- Oumaamar, M.E.K.; Khezzar, A.; Boucherma, M.; Razik, H.; Andriamalala, R.N.; Baghli, L. Neutral voltage analysis for broken rotor bars detection in induction motors using hilbert transform phase. In Proceedings of the 2007 IEEE Industry Applications Annual Meeting, New Orleans, LA, USA, 23–27 September 2007; pp. 1940–1947. [Google Scholar]
- Nemec, M.; Ambrožič, V.; Fišer, R.; Nedeljković, D.; Drobnič, K. Induction motor broken rotor bar detection based on rotor flux angle monitoring. Energies 2019, 12, 794. [Google Scholar] [CrossRef] [Green Version]
- Zamudio-Ramírez, I.; Osornio-Ríos, R.A.; Antonino-Daviu, J.A.; Quijano-Lopez, A. Smart-sensor for the automatic detection of electromechanical faults in induction motors based on the transient stray flux analysis. Sensors 2020, 20, 1477. [Google Scholar] [CrossRef] [Green Version]
- Iglesias-Martínez, M.E.; Antonino-Daviu, J.A.; Fernández de Córdoba, P.; Conejero, J.A. Rotor fault detection in induction motors based on time-frequency analysis using the bispectrum and the autocovariance of stray flux signals. Energies 2019, 12, 597. [Google Scholar] [CrossRef] [Green Version]
- Capolino, G.; Romary, R.; Hénao, H.; Pusca, R. State of the art on stray flux analysis in faulted electrical machines. In Proceedings of the 2019 IEEE Workshop on Electrical Machines Design, Control and Diagnosis (WEMDCD), Athens, Greece, 22–23 April 2019; pp. 181–187. [Google Scholar]
- Romary, R.; Pusca, R.; Lecointe, J.P.; Brudny, J.F. Electrical machines fault diagnosis by stray flux analysis. In Proceedings of the 2013 IEEE Workshop on Electrical Machines Design, Control and Diagnosis (WEMDCD), Paris, France, 11–12 March 2013; pp. 247–256. [Google Scholar]
- Gyftakis, K.N.; Panagiotou, P.A.; Lee, S.B. The role of the mechanical speed frequency on the induction motor fault detection via the stray flux. In Proceedings of the 2019 IEEE 12th International Symposium on Diagnostics for Electrical Machines, Power Electronics and Drives (SDEMPED), Toulouse, France, 27–30 August 2019; pp. 201–207. [Google Scholar]
- Panagiotou, P.A.; Arvanitakis, I.; Lophitis, N.; Gyftakis, K.N. FEM study of induction machines suffering from rotor electrical faults using stray flux signature analysis. In Proceedings of the 2018 XIII International Conference on Electrical Machines (ICEM), Alexandroupoli, Greece, 3–6 September 2018; pp. 1861–1867. [Google Scholar]
- Gyftakis, K.N.; Panagiotou, P.A.; Palomeno, E.; Lee, S.B. Introduction of the zero-sequence stray flux as a reliable diagnostic method of rotor electrical faults in induction motors. In Proceedings of the IECON 2019-45th Annual Conference of the IEEE Industrial Electronics Society, Lisbon, Portugal, 14–17 October 2019; pp. 6016–6021. [Google Scholar]
- Faiz, J.; Ebrahimi, B.M.; Toliyat, H.A. Effect of magnetic saturation on static and mixed eccentricity fault diagnosis in induction motor. IEEE Trans. Magn. 2009, 45, 3137–3144. [Google Scholar] [CrossRef]
- Cusidó, J.; Romeral, L.; Ortega, J.A.; Garcia, A.; Riba, J. Signal injection as a fault detection technique. Sensors 2011, 11, 3356–3380. [Google Scholar] [CrossRef] [Green Version]
- Xu, X.; Han, Q.; Chu, F. Review of electromagnetic vibration in electrical machines. Energies 2018, 11, 1779. [Google Scholar] [CrossRef] [Green Version]
- Gyftakis, K.N.; Kappatou, J.C. The zero-sequence current spectrum as an on-line static eccentricity diagnostic mean in Δ-connected PSH-induction motors. In Proceedings of the 2013 9th IEEE International Symposium on Diagnostics for Electric Machines, Power Electronics and Drives (SDEMPED), Valencia, Spain, 27–30 August 2013; pp. 302–308. [Google Scholar]
- Constantin, A.; Fireţeanu, V. Efficiency in the detection of three important faults in induction motors through external magnetic field. In Proceedings of the 2015 9th International Symposium on Advanced Topics in Electrical Engineering (ATEE), Bucharest, Romania, 7–9 May 2015; pp. 430–435. [Google Scholar]
- Vitek, O.; Janda, M.; Hajek, V.; Bauer, P. Detection of eccentricity and bearings fault using stray flux monitoring. In Proceedings of the 8th IEEE Symposium on Diagnostics for Electrical Machines, Power Electronics & Drives, Bologna, Italy, 5–8 September 2011; pp. 456–461. [Google Scholar]
- Chernyavska, I.; Vítek, O. Analysis of air-gap eccentricity in inverter fed induction motor by means of motor current signature analysis and stray flux of motor. In Proceedings of the 2017 IEEE 11th International Symposium on Diagnostics for Electrical Machines, Power Electronics and Drives (SDEMPED), Tinos, Greece, 29 August–1 September 2017; pp. 72–76. [Google Scholar]
- Sobczyk, T.J.; Sułowicz, M.; Tulicki, J. Influence of winding’s active parts on axial flux in AC machines. In Proceedings of the 2019 IEEE 12th International Symposium on Diagnostics for Electrical Machines, Power Electronics and Drives (SDEMPED), Toulouse, France, 27–30 August 2019; pp. 208–213. [Google Scholar]
- Toh, G.; Park, J. Review of vibration-based structural health monitoring using deep learning. Appl. Sci. 2020, 10, 1680. [Google Scholar] [CrossRef]
- Areias, I.A.S.; Borges da Silva, L.E.; Bonaldi, E.L.; de Lacerda de Oliveira, L.E.; Lambert-Torres, G.; Bernardes, V.A. Evaluation of current signature in bearing defects by envelope analysis of the vibration in induction motors. Energies 2019, 12, 4029. [Google Scholar] [CrossRef] [Green Version]
- Frosini, L.; Harlişca, C.; Szabó, L. Induction machine bearing fault detection by means of statistical processing of the stray flux measurement. IEEE Trans. Ind. Electron. 2015, 62, 1846–1854. [Google Scholar] [CrossRef]
- Pusca, R.; Romary, R.; Ceban, A.; Brudny, J.-F. An online universal diagnosis procedure using two external flux sensors applied to the AC electrical rotating machines. Sensors 2010, 10, 10448–10466. [Google Scholar] [CrossRef]
- Zhang, D.; Liu, T. Effects of voltage sag on the performance of induction motor based on a new transient sequence component method. CES Trans. Electr. Mach. Syst. 2019, 3, 316–324. [Google Scholar] [CrossRef]
- Goh, Y.-J.; Kim, O. Linear method for diagnosis of inter-turn short circuits in 3-phase induction motors. Appl. Sci. 2019, 9, 4822. [Google Scholar] [CrossRef] [Green Version]
- Bottiglieri, G.; Consoli, A.; Scarcella, G.; Scelba, G. Zero-sequence flux and voltage of induction motors supplied with low-and high-frequency currents. IEEE Int. Electr. Mach. Drives Conf. 2007, 2, 1201–1207. [Google Scholar] [CrossRef]
- Silva, M.D.C.; Filho, A.L.F.; Abada, C.C. Evaluation of the effect of the zero and negative sequence components on the current and temperature of a three phase induction motor. In Proceedings of the 2016 17th International Conference on Harmonics and Quality of Power (ICHQP), Belo Horizonte, Brazil, 16–19 October 2016; pp. 937–942. [Google Scholar]
- Kubo, H.; Yamamoto, Y.; Kondo, T.; Rajashekara, K.; Zhu, B. Zero-sequence current suppression for open-end winding induction motor drive with resonant controller. In Proceedings of the 2016 IEEE Applied Power Electronics Conference and Exposition (APEC), Long Beach, CA, USA, 20–24 March 2016; pp. 2788–2793. [Google Scholar]
- Shahin, A.; Martin, J.; Pierfederici, S. Zero-sequence current based diagnostic method for open-switch fault detection in parallel inverters system. IEEE Trans. Power Electron. 2019, 34, 3750–3764. [Google Scholar] [CrossRef]
- Burriel-Valencia, J.; Puche-Panadero, R.; Riera-Guasp, M.; Sapena-Bano, A.; Pineda-Sanchez, M.; Martinez-Roman, J. Low computational cost algorithm for detecting rotor asymmetries in IM based on the negative sequence component of the startup currents. In Proceedings of the 2017 IEEE 11th International Symposium on Diagnostics for Electrical Machines, Power Electronics and Drives (SDEMPED), Tinos, Greece, 29 August–1 September 2017; pp. 628–634. [Google Scholar]
- Sobczyk, T.J.; Tulicki, J.; Weinreb, K.; Mielnik, R.; Sułowicz, M. Characteristic features of rotor bar current frequency spectrum in cage induction machine with inner faults. In Proceedings of the 2019 IEEE 12th International Symposium on Diagnostics for Electrical Machines, Power Electronics and Drives (SDEMPED), Toulouse, France, 27–30 August 2019; pp. 115–120. [Google Scholar]
- Dineva, A.; Mosavi, A.; Gyimesi, M.; Vajda, I.; Nabipour, N.; Rabczuk, T. Fault diagnosis of rotating electrical machines using multi-label classification. Appl. Sci. 2019, 9, 5086. [Google Scholar] [CrossRef] [Green Version]
- Hsueh, Y.-M.; Ittangihal, V.R.; Wu, W.-B.; Chang, H.-C.; Kuo, C.-C. Fault diagnosis system for induction motors by CNN using empirical wavelet transform. Symmetry 2019, 11, 1212. [Google Scholar] [CrossRef] [Green Version]
- Glowacz, A.; Glowacz, Z. Diagnosis of the three-phase induction motor using thermal imaging. Infrared Phys. Technol. 2017, 81, 7–16. [Google Scholar] [CrossRef]
- Xie, Y.; Guo, J.; Chen, P.; Li, Z. Coupled fluid-thermal analysis for induction motors with broken bars operating under the rated load. Energies 2018, 11, 2024. [Google Scholar] [CrossRef] [Green Version]
- Saad, K.; Mirzaeva, G. Advanced diagnosis of rotor faults in large induction motors based on internal flux measurement. In Proceedings of the 2016 IEEE Industry Applications Society Annual Meeting, Portland, OR, USA, 2–6 October 2016; pp. 1–8. [Google Scholar]
- Chang, H.-C.; Jheng, Y.-M.; Kuo, C.-C.; Hsueh, Y.-M. Induction motors condition monitoring system with fault diagnosis using a hybrid approach. Energies 2019, 12, 1471. [Google Scholar] [CrossRef] [Green Version]
- Wei, Y.; Li, Y.; Xu, M.; Huang, W. A review of early fault diagnosis approaches and their applications in rotating machinery. Entropy 2019, 21, 409. [Google Scholar] [CrossRef] [Green Version]
- Drozdowski, P. An equivalent permeance of the air-gap of induction motor in case of saturation. In Proceedings of the Seminar on Fundamentals of Electrotechnics and Circuit Theory, SPETO’94, Gliwice-Ustroń, Poland, 25–28 May 1994; tom 1. pp. 167–172. [Google Scholar]
- Drozdowski, P.; Duda, A. MATLAB-SIMULINK modelling of induction machine incorporating magnetic saturation. In Scientific; Institute of Electrical Machines Drives and Measurment of the Wrocław University of Technology: Wroclaw, Poland, 2012; Volume 66, pp. 92–101, Studies and Research No. 32, t. 2. [Google Scholar]
- Duda, A. Squirrel Cage Induction Motors Fault Diagnostics Using Influence of Magnetic Core Nonlinearity. Ph.D. Thesis, Cracow University of Technology, Kraków, Poland, 2018. [Google Scholar]
- Węgiel, T.; Weinreb, K.; Sułowicz, M. Main inductances of induction motor for diagnostically specialized mathematical models. Arch. Electr. Eng. 2010, 59, 51–66. [Google Scholar] [CrossRef] [Green Version]
- Sobczyk, T.J.; Drozdowski, P. Inductances of electrical machine winding with a nonuniform air-gap. Arch. Elektrotech. 1993, 76, 213–218. [Google Scholar] [CrossRef]
- Węgiel, T.; Weinreb, K.; Warzecha, A.; Sułowicz, M. Model of cage induction motor with saturated main magnetic circuit for diagnostic applications. Tech. Trans. 2005, Z.5-E/2005, 101–117. [Google Scholar]
- Tang, J.; Chen, J.; Dong, K.; Yang, Y.; Lv, H.; Liu, Z. Modeling and evaluation of stator and rotor faults for induction motors. Energies 2020, 13, 133. [Google Scholar] [CrossRef] [Green Version]


| Machine’s Condition | Harmonics Orders | |
|---|---|---|
| Symmetry | ||
| Static Ecc. | ||
| Dynamic Ecc | ||
| Mixed Ecc. |
| Machine’s Condition | l | k | m | Formula | |
|---|---|---|---|---|---|
| Symmetry | l = 0 | k = 0 | {0, ±2} | ||
| Static Ecc. | l ≠ 0 | k = 0 | |||
| Dynamic Ecc. | l = 0 | k ≠ 0 | |||
| Mixed Ecc. | l ≠ 0 | k ≠ 0 | |||
| Broken rotor bars | l = 0 | k = 0 |
| ν | ρ | m | µ | l | k | Formula |
|---|---|---|---|---|---|---|
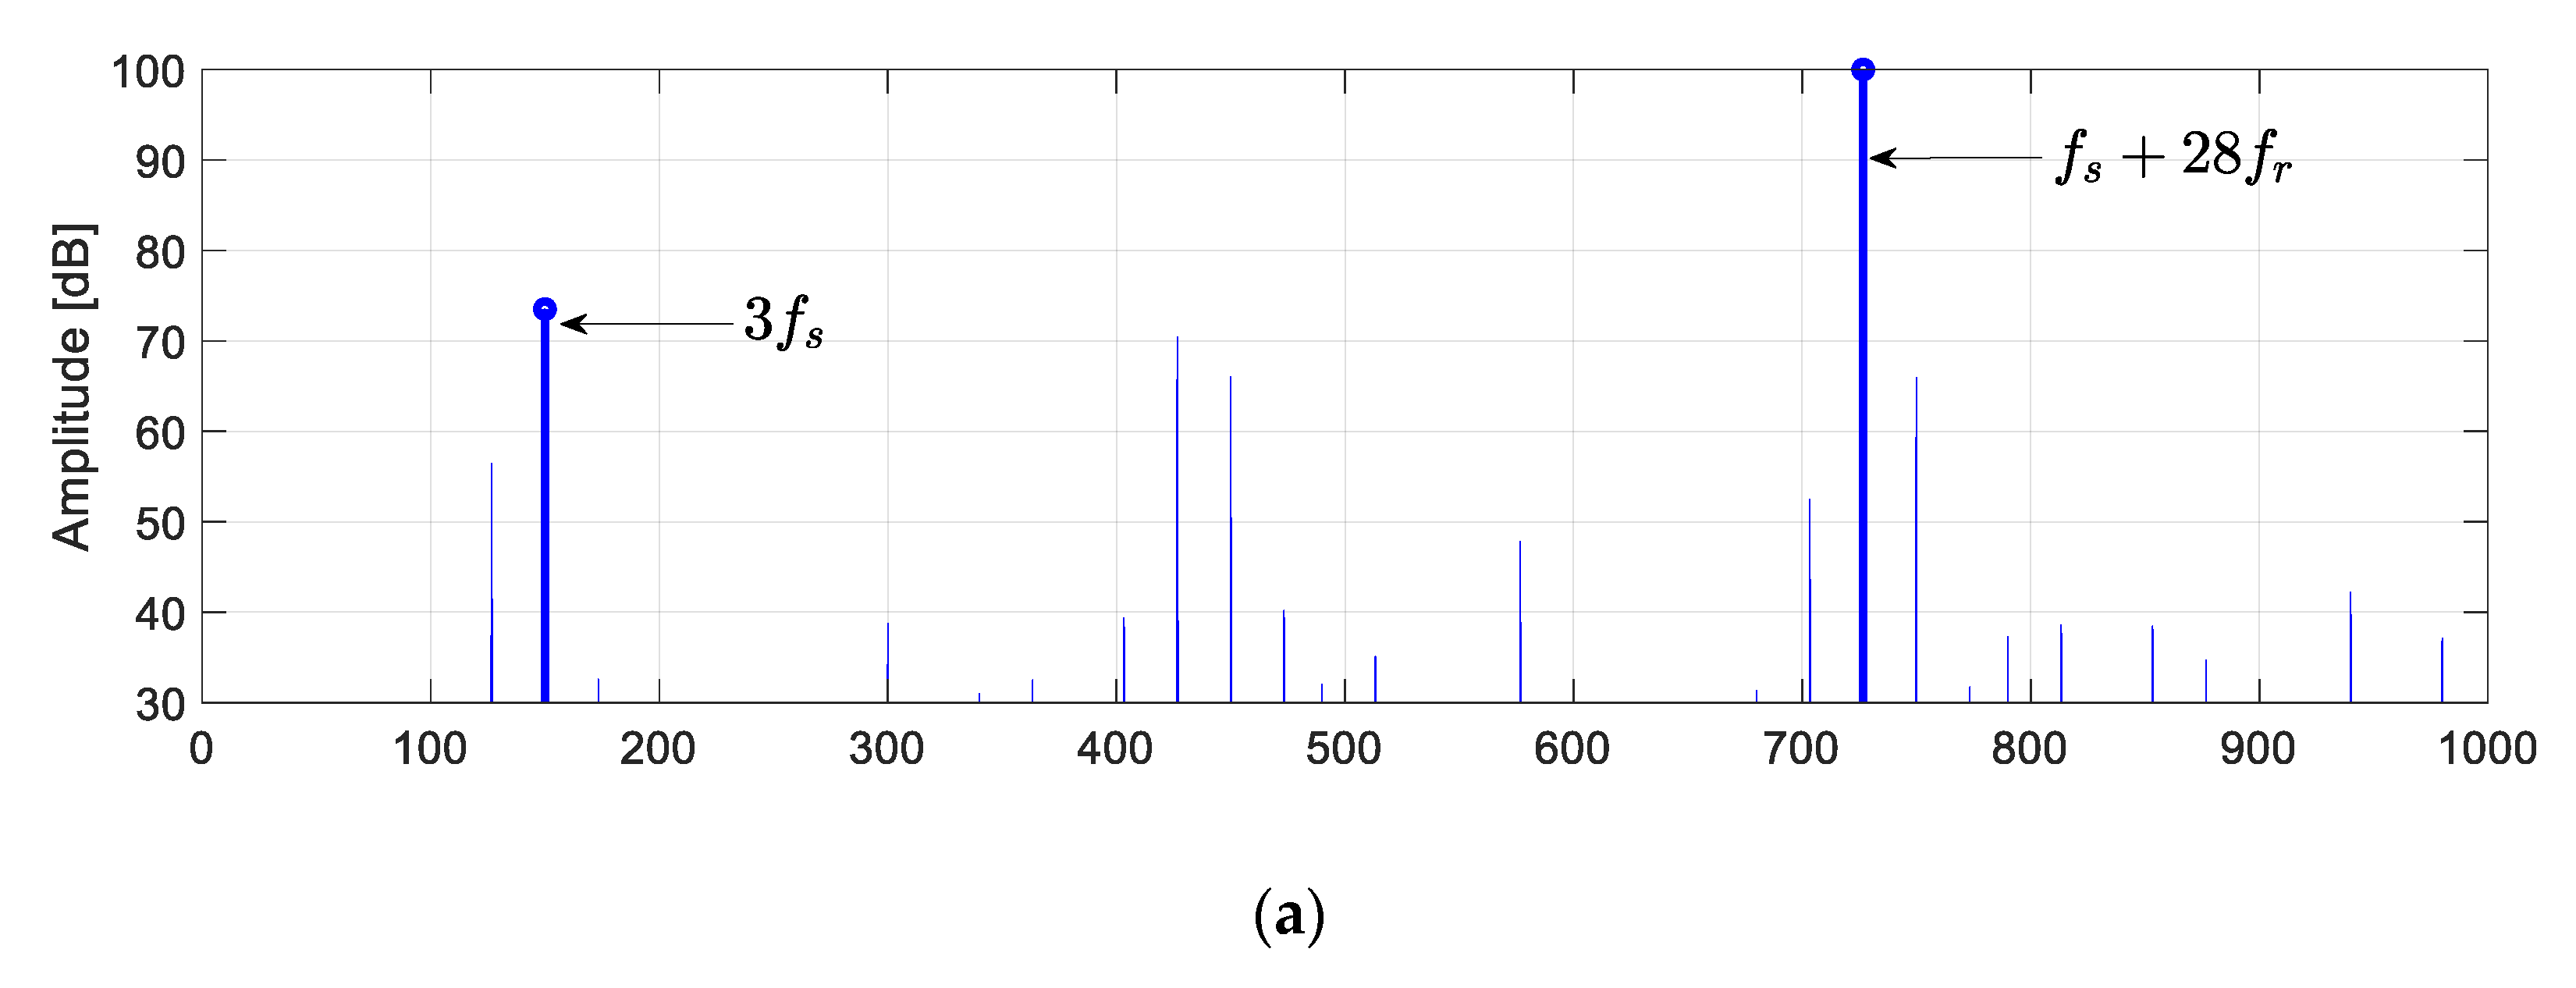
| 30 | −30 | 0 | 0 | 0 | 0 | fs + 28fr |
| 6 | −2 | −4 | −2 | 0 | 0 | 3fs |
| ν | ρ | m | µ | l | k | Formula |
|---|---|---|---|---|---|---|
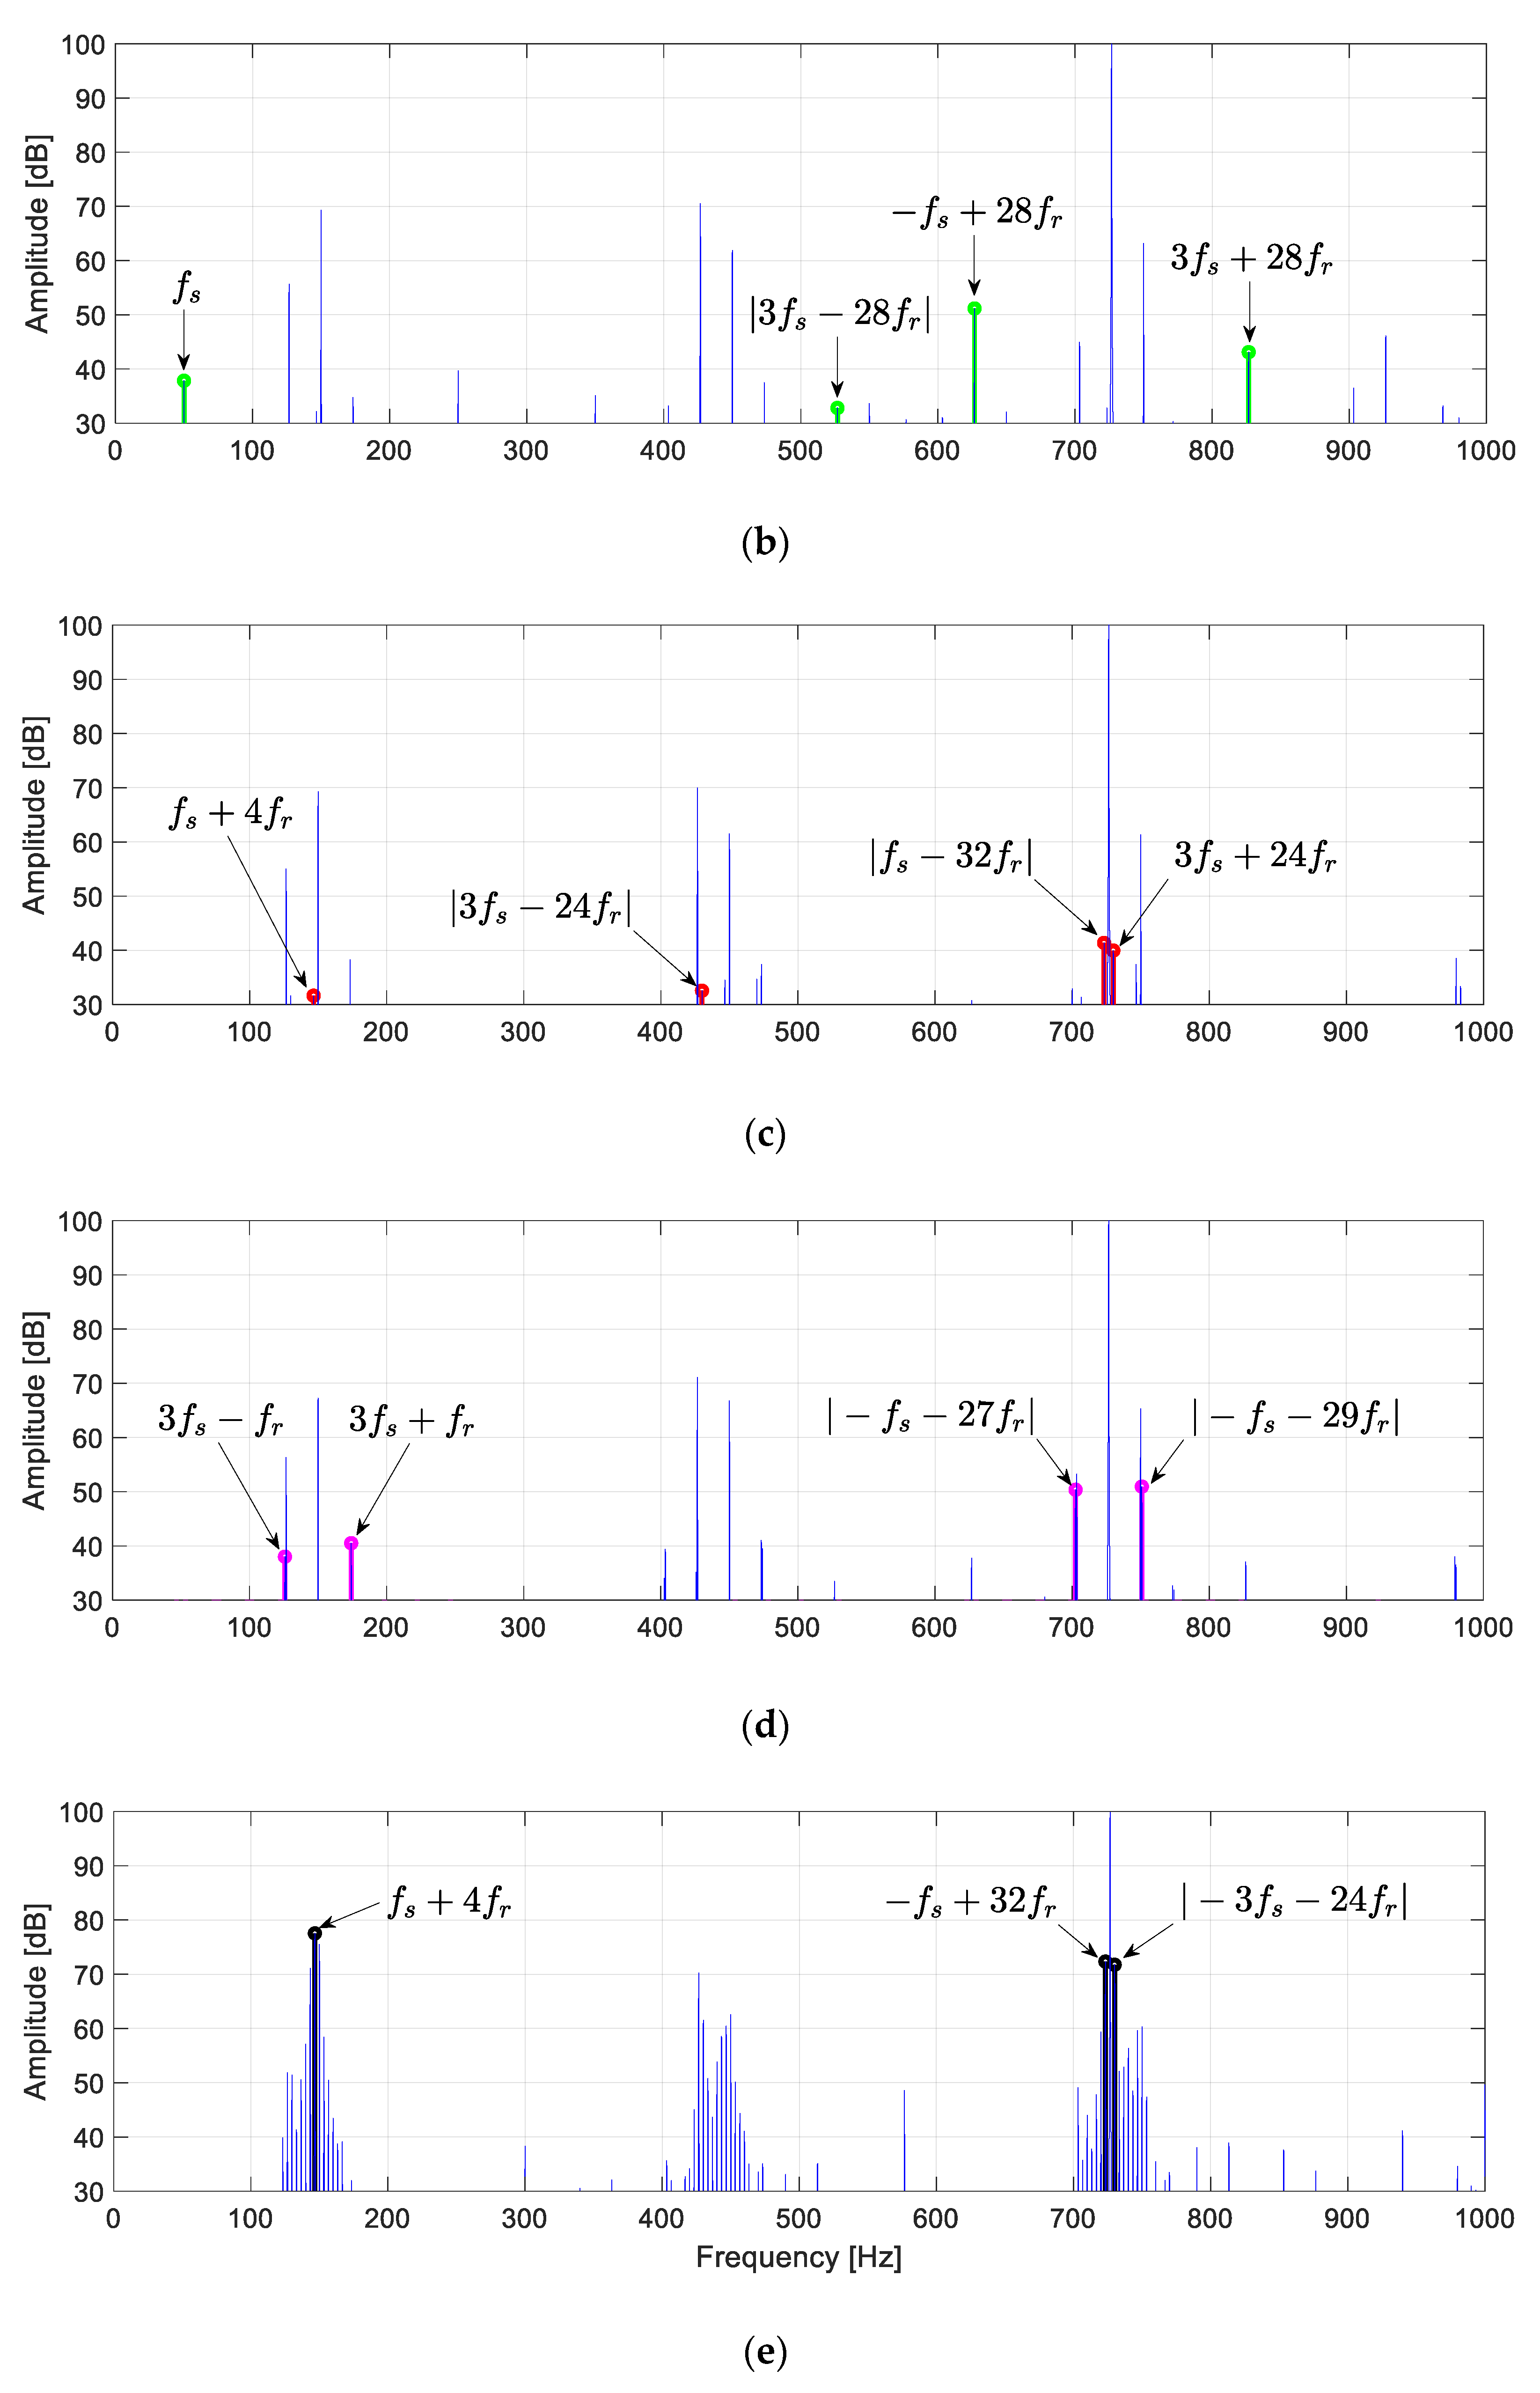
| 6 | −2 | −4 | 0 | −4 | 0 | fs |
| −18 | 26 | −8 | −2 | −4 | 0 | |3fs − 28fr| |
| 30 | −30 | 0 | 2 | −4 | 0 | |−fs + 28fr| |
| 30 | −30 | 0 | −2 | 4 | 0 | 3fs + 28fr |
| ν | ρ | m | µ | l | k | Formula |
|---|---|---|---|---|---|---|
| −30 | 26 | 4 | 0 | 0 | 4 | |fs − 32fr| |
| 6 | −2 | −4 | 0 | 0 | −4 | fs + 4fr |
| −18 | 26 | −8 | −2 | 0 | −4 | |3fs − 24fr| |
| 30 | −30 | 0 | −2 | 0 | 4 | 3fs + 24fr |
| ν | ρ | m | µ | l | k | Formula |
|---|---|---|---|---|---|---|
| 6 | −2 | −4 | −2 | 1 | −1 | |3fs + fr| |
| 6 | −2 | −4 | −2 | −1 | 1 | |3fs − fr| |
| −30 | 26 | 4 | 2 | −1 | 1 | |−fs − 29fr| |
| −30 | 26 | 4 | 2 | 1 | −1 | |−fs − 27fr| |
| ν | ρ | m | µ | l | k | i1 | Formula |
|---|---|---|---|---|---|---|---|
| 30 | −30 | 0 | 0 | 0 | 0 | −1 | |−fs + 32fr| |
| −30 | 26 | 4 | 2 | 0 | 0 | −1 | |−3fs − 24fr| |
| 6 | −2 | −4 | −2 | 0 | 0 | −1 | fs(3 − 2s) |
| 6 | −2 | −4 | −2 | 0 | 0 | −2 | fs(3 − 4s) |
| 6 | −2 | −4 | −2 | 0 | 0 | 1 | fs(3 + 2s) |
| 6 | −2 | −4 | −2 | 0 | 0 | 2 | fs(3 + 4s) |
| Formula | Broken (dB) | Healthy (dB) | Difference (dB) | |
|---|---|---|---|---|
| Dynamic Ecc. | fs + 4fr | 31.64 | 5.59 | 26.05 |
| |3fs − 24fr| | 32.55 | 5.14 | 27.41 | |
| |fs − 32fr| | 41.37 | 18.01 | 23.36 | |
| |3fs + 24fr| | 39.96 | 14.26 | 25.7 | |
| Static Ecc. | fs | 37.83 | 0 | 37.83 |
| |3fs − 28fr| | 32.81 | 9.02 | 23.79 | |
| |−fs + 28fr| | 51.16 | 12.51 | 38.65 | |
| 3fs + 28fr | 43.10 | 6.17 | 36.93 | |
| Mixed Ecc. | 3fs − fr | 38.02 | 0.7 | 37.32 |
| 3fs + fr | 40.51 | 0 | 40.51 | |
| |−fs − 27fr| | 50.37 | 0.6 | 49.77 | |
| |−fs − 29fr| | 50.94 | 8.3 | 42.64 |
| Formula | Broken (dB) | Healthy (dB) | Difference (dB) | |
|---|---|---|---|---|
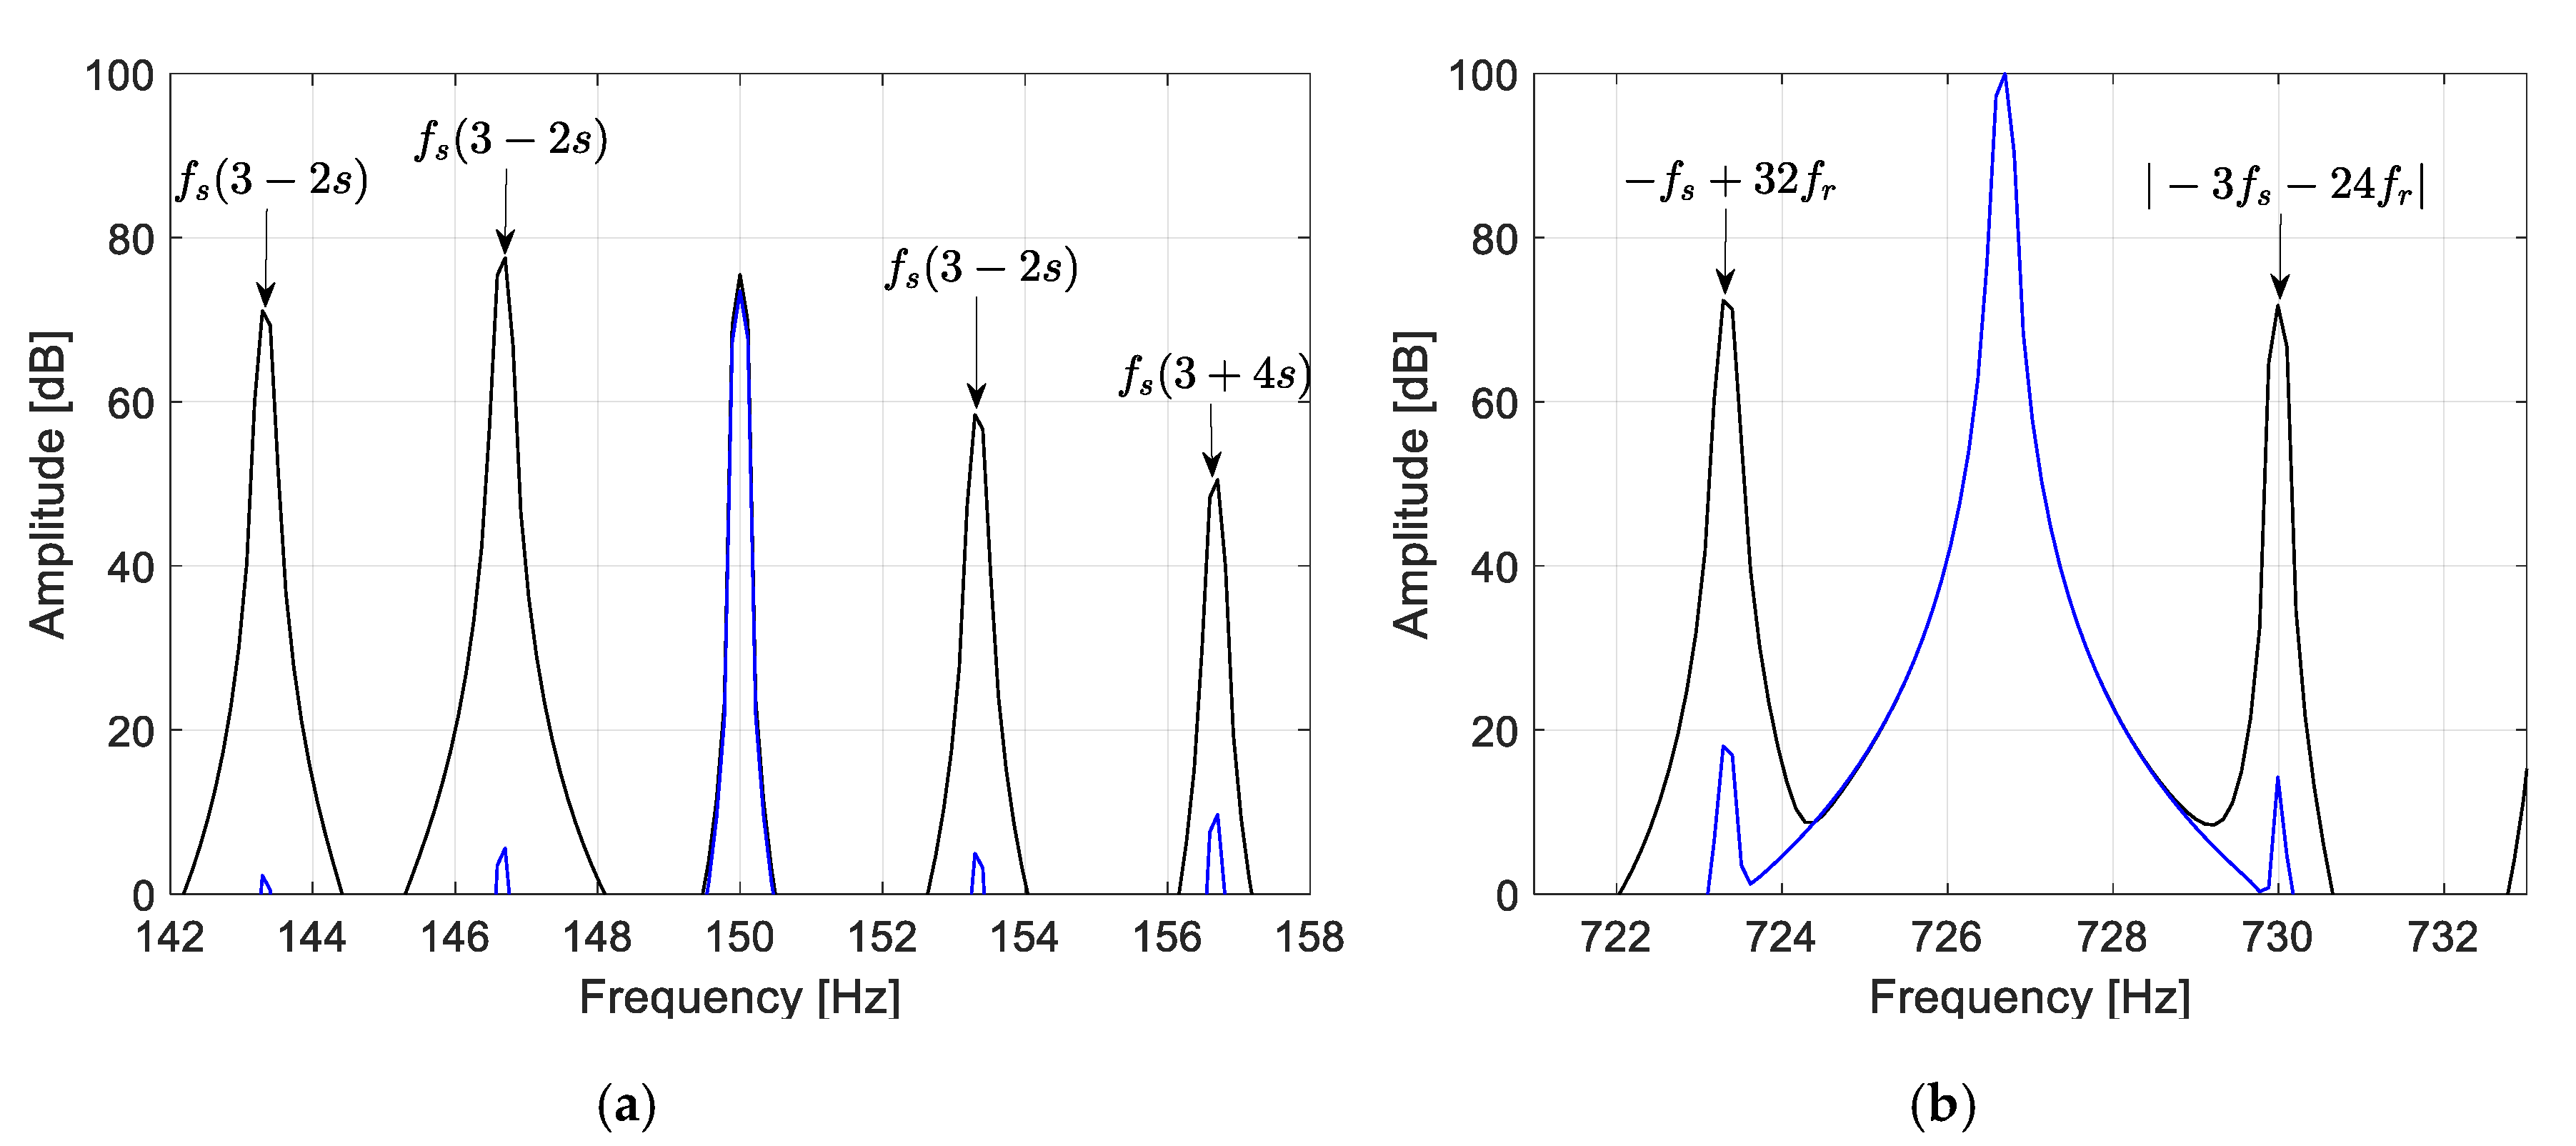
| Broken Rotor Bars | fs(3 − 4s) | 71.08 | 2.25 | 68.83 |
| fs(3 − 2s) | 77.54 | 5.59 | 71.95 | |
| fs(3 + 2s) | 58.42 | 4.98 | 53.44 | |
| fs(3 + 4s) | 50.49 | 9.71 | 40.78 | |
| −fs + 32fr | 72.34 | 18.01 | 54.33 | |
| |−3fs − 24fr| | 71.75 | 14.26 | 57.49 |
| Formula | Broken (dB) | Healthy (dB) | Difference (dB) | |
|---|---|---|---|---|
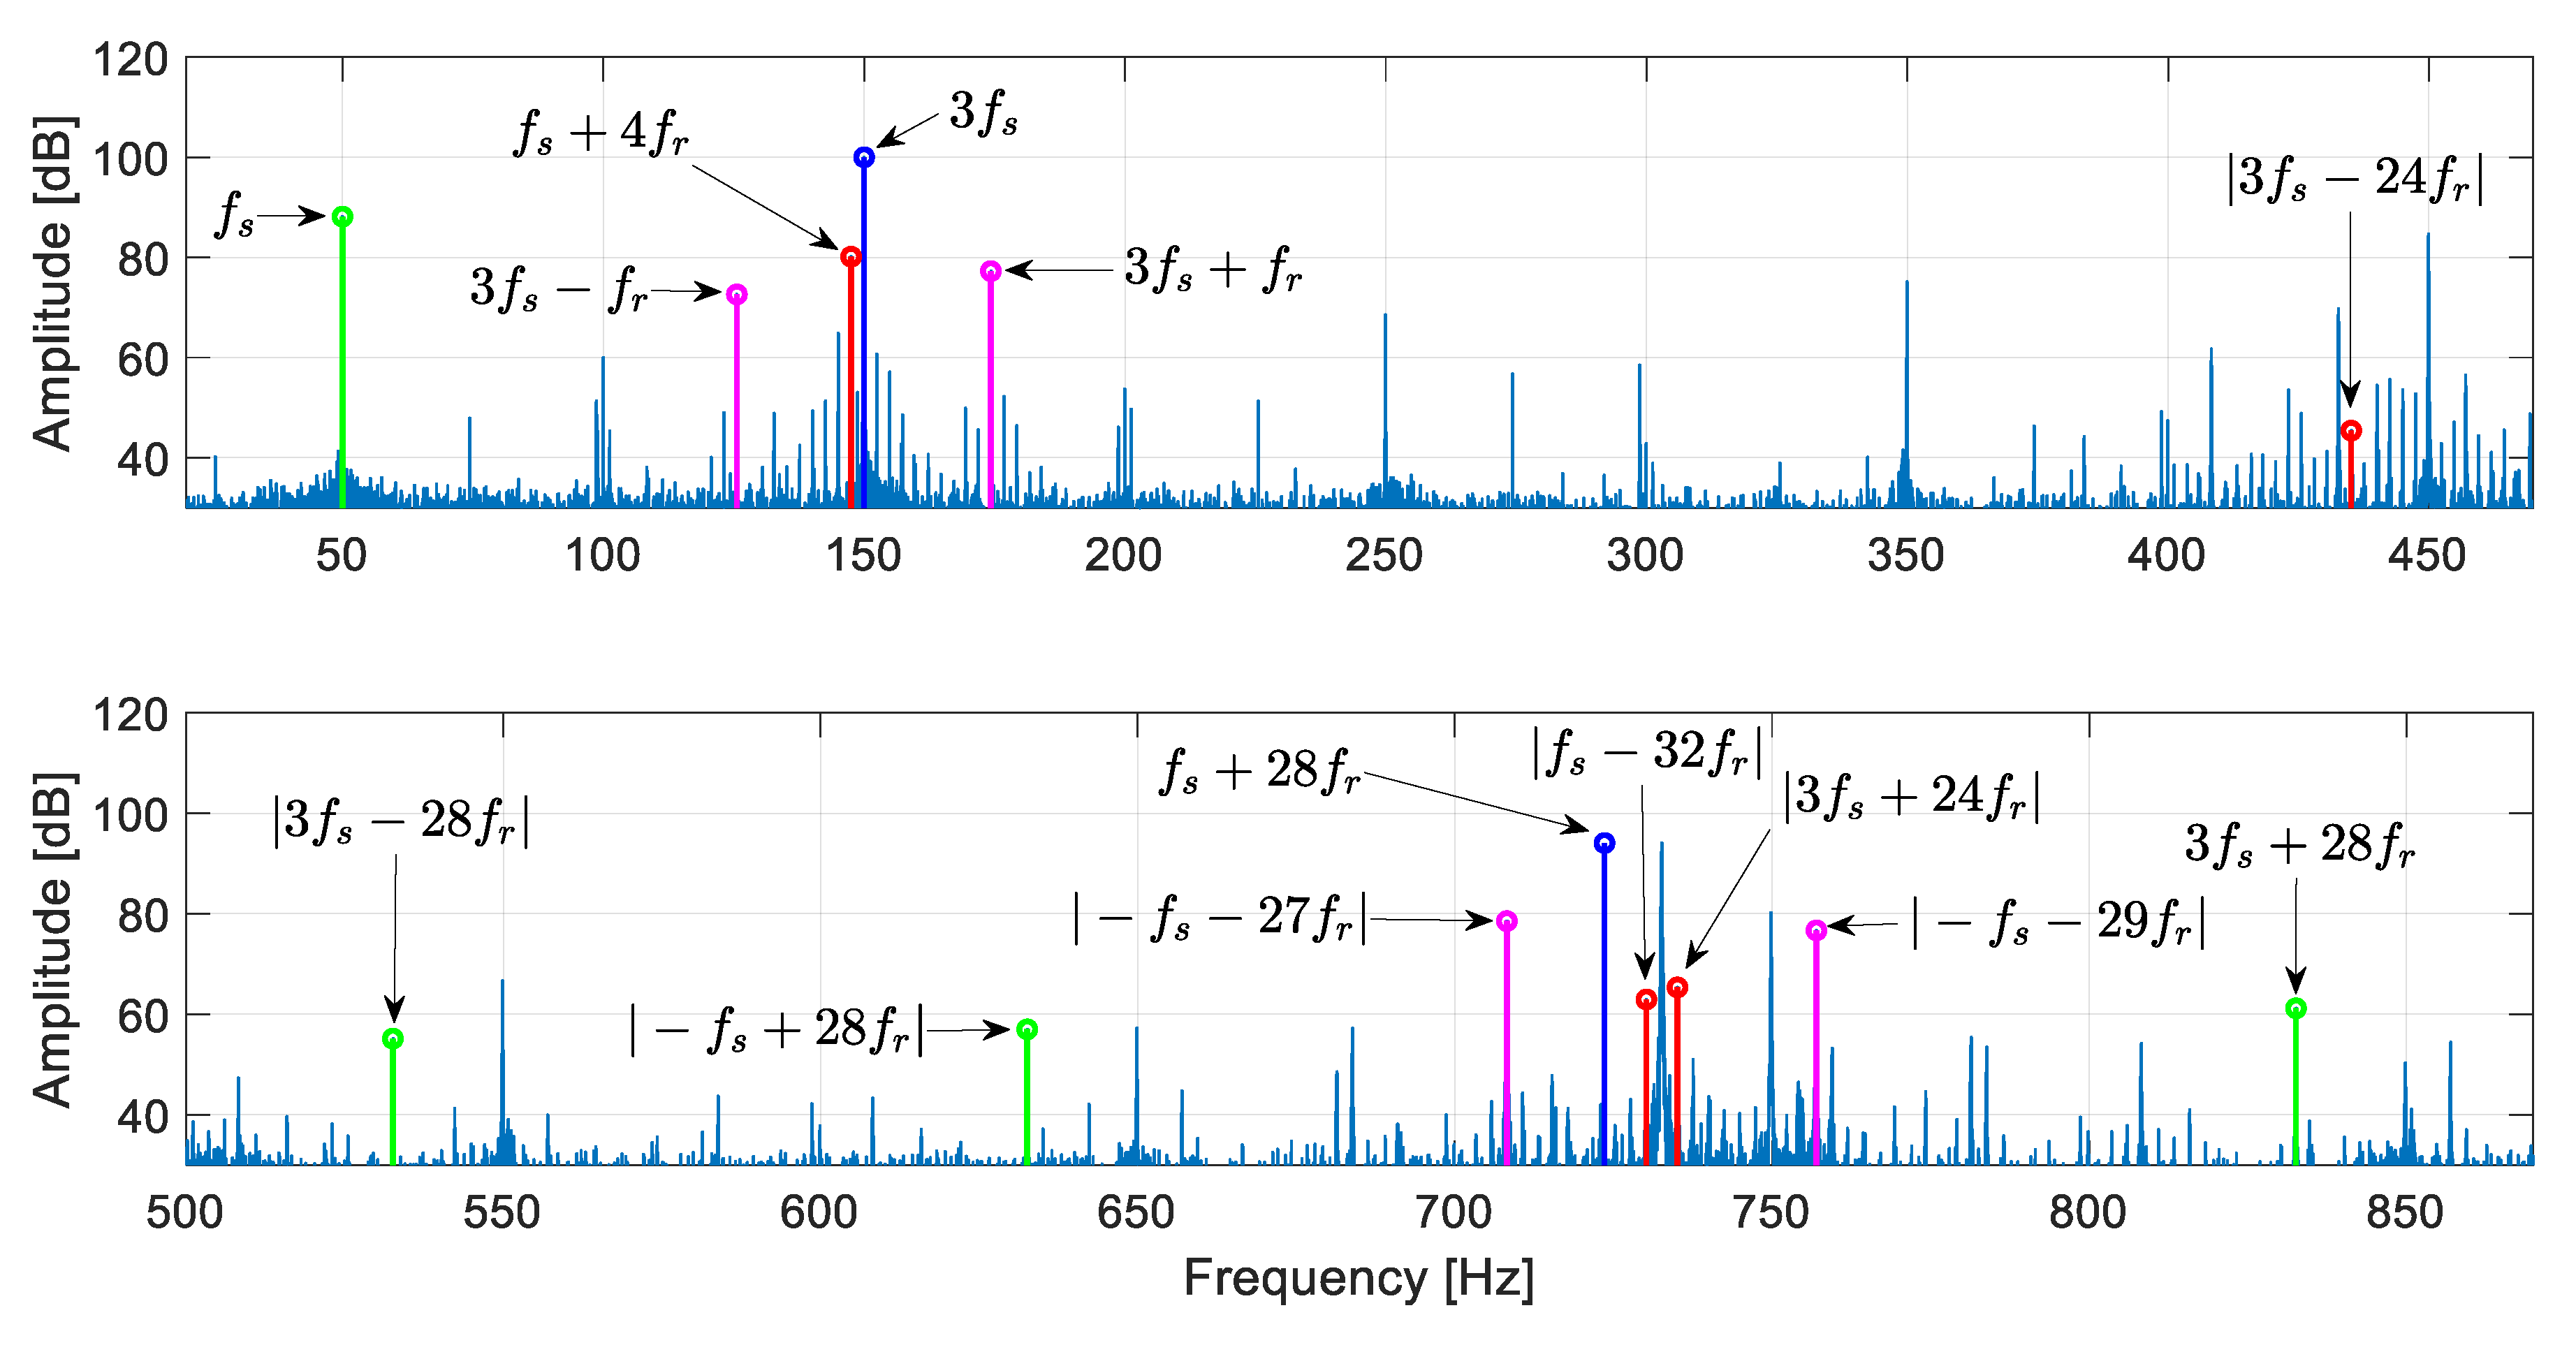
| Static Ecc. | fs | 88.15 | 82.03 | 6.12 |
| |3fs − 28fr| | 55.14 | 51.4 | 3.74 | |
| |−fs + 28fr| | 57 | 51.4 | 5.6 | |
| 3fs + 28fr | 61.19 | 55.82 | 5.37 | |
| Dynamic Ecc. | fs + 4fr | 80.14 | 74.88 | 5.26 |
| |3fs − 24fr| | 45.42 | 29.66 | 15.76 | |
| |fs − 32fr| | 62.95 | 52.74 | 10.21 | |
| |3fs + 24fr| | 65.35 | 55.62 | 9.73 | |
| Mixed Ecc. | 3fs − fr | 72.62 | 31 | 41.62 |
| 3fs + fr | 72.26 | 42 | 35.26 | |
| |−fs − 27fr| | 78.54 | 42.13 | 36.41 | |
| |−fs − 29fr| | 76.68 | 49.67 | 27.01 |
| Formula | Broken (dB) | Healthy (dB) | Difference (dB) | |
|---|---|---|---|---|
| Broken Rotor Bars | fs(3 − 4s) | 90.08 | 72.69 | 17.39 |
| fs(3 − 2s) | 93.14 | 78.27 | 14.87 | |
| fs(3 + 2s) | 53.99 | 54.05 | −0.06 | |
| fs(3 + 4s) | 54.58 | 57.23 | −2.65 | |
| −fs + 32fr | 76.08 | 55.47 | 20.61 | |
| |−3fs − 24fr| | 75.38 | 59.02 | 16.36 |
© 2020 by the authors. Licensee MDPI, Basel, Switzerland. This article is an open access article distributed under the terms and conditions of the Creative Commons Attribution (CC BY) license (http://creativecommons.org/licenses/by/4.0/).
Share and Cite
Duda, A.; Sułowicz, M. A New Effective Method of Induction Machine Condition Assessment Based on Zero-Sequence Voltage (ZSV) Symptoms. Energies 2020, 13, 3544. https://doi.org/10.3390/en13143544
Duda A, Sułowicz M. A New Effective Method of Induction Machine Condition Assessment Based on Zero-Sequence Voltage (ZSV) Symptoms. Energies. 2020; 13(14):3544. https://doi.org/10.3390/en13143544
Chicago/Turabian StyleDuda, Arkadiusz, and Maciej Sułowicz. 2020. "A New Effective Method of Induction Machine Condition Assessment Based on Zero-Sequence Voltage (ZSV) Symptoms" Energies 13, no. 14: 3544. https://doi.org/10.3390/en13143544