Article

Highly Renewable District Heat for Espoo Utilizing Waste Heat Sources

Department of Mechanical Engineering, School of Engineering, Aalto University, P.O. Box 14100, FIN-00076 Aalto, Finland
*
Author to whom correspondence should be addressed.
Energies 2020, 13(14), 3551; https://doi.org/10.3390/en13143551
Submission received: 29 May 2020 / Revised: 3 July 2020 / Accepted: 5 July 2020 / Published: 10 July 2020
(This article belongs to the Special Issue Modelling Climate-Neutral Energy Systems and Markets)

Abstract

:
The district heating operator Fortum and the city of Espoo have set a goal to abandon the use of coal in district heating production and increase the share of renewable sources to 95% by the year 2029. Among renewable fuels and heat pumps, waste heat utilization has an important role in Fortum’s plans for the decarbonization of district heating production, and Fortum is considering the possibility of utilizing waste heat from a large data center in its district heating network. The goal of this paper is to investigate the feasibility and required amount of waste heat to achieve this goal. Two different operation strategies are introduced—an operation strategy based on marginal costs and an operation strategy prioritizing waste heat utilization. Each strategy is modeled with three different electricity price scenarios. Because the low temperature waste heat from a data center must be primed by heat pumps, the electricity price has a significant impact on the feasibility of waste heat utilization. Prioritizing waste heat utilization leads to higher production costs, but a lower waste heat capacity is needed to reach the goal of 95% renewables in production. The higher electricity price emphasizes the differences between the two operation strategies. Waste heat utilization also leads to significant reductions of CO2 emissions.

1. Introduction

The Finnish city of Espoo (290,000 inhabitants) and the district heating (DH) operator, Fortum, have set the goal of ending the use of coal in district heating by the year 2025. The DH network provides heat for over 80% of the population in Espoo and the neighboring cities of Kirkkonummi and Kauniainen. The total annual heat demand is about 2.6 TWh. The majority of Espoo’s heat supply is produced by combined heat and power (CHP) plants, and coal is in an important role as a heat source [1]. Ending the use of coal is expected to increase the share of renewable sources in heat production from 26% to 85% by the year 2026. By 2029, the share of renewables is expected to reach 95%. Some natural gas capacity will remain in the system due to security of supply, and this share will be compensated by international compensation mechanisms. Abandoning coal also means that that a large share of the CHP plants will be closed. The reduced capacity is planned to be replaced with wood fuel burning heat-only boilers (HOB) and increased use of heat pumps (HP). In addition, a geothermal plant will be commissioned, which is estimated to cover 10% of the annual heat demand, while utilization of waste heat in the DH network will be in an important part of Fortum’s plans [2].
Fortum is currently operating three CHP units in Espoo—a coal-burning steam turbine, a natural-gas-burning open-cycle gas turbine (OCGT), and a combined-cycle gas turbine (CCGT). It has already been decided that the coal-burning unit with 160 MW thermal capacity and 80 MW electric capacity will be shut down in 2025. At the moment, there are no public plans to reduce the remaining natural-gas-burning capacity [2]. The goal of this paper is to model Espoo’s DH system and assess the waste heat capacity that would be needed to replace the remaining natural-gas-burning CHP thermal capacity of 290 MW and reach the planned goal of 95% renewable sources in heat production.
Volkova et al. [3]. Studied the decarbonization of Estonian DH systems. Some of the 146 studied DH networks could be decarbonized by simply reducing the heat losses and consumption. In some of the systems, it would be possible to replace fossil-fuel-based production with renewable fuels, but if fossil fuels are already used very rarely (i.e., mainly for the peak demand), replacing the peak boilers would not be feasible. In a case study of the Tallinn DH system [4], the possibility of replacing natural-gas-based heat production with large-scale HPs was investigated. The total HP capacity of 122 MW through utilizing heat from sewage water, river water, seawater, groundwater, and ambient air would reduce the share of natural gas in heat production from 50% to 34%, however the decreased natural gas consumption would not necessarily result in lower CO2 emissions. Because of the current high emissions factor in the Estonian electricity mix, heat pumps would actually increase the emissions instead.
The Heat Roadmap Europe [5] recognizes the importance of waste heat utilization for decarbonizing European heat markets. In the report, excess heat availability is quantified. Waste heat sources from energy-intensive industrial sectors with a capacity of more than 50 MW were included in the report. The total potential of the industrial excess heat in 28 European Union countries (including the UK) was estimated to be 2943 PJ, representing approximately 30% of the primal energy supply of the named industrial sectors. From these industrial sectors, the fuel supply and refineries sector has the highest potential of 1059 PJ. Non-ferrous metals have an excess heat potential of 600 PJ, iron and steel have an excess heat potential of 525 PJ, and the chemical and petrochemical industry has an excess heat potential of 467 PJ.
Fortum has published the buy-in prices for the open DH network in the Espoo area for heat suppliers with a capacity of less than 5 MW [6], showing that some waste heat sources are already connected to the network. For example, Espoo hospital provides 1.5 MW and Ericsson data center provides 2.8 MW of heat to the DH system [7]. The waste heat from sewage water is utilized in two 20 MW heat pumps and the plan is to commission a third unit in 2021 [8]. There are also plans to build a 100 MW data center (DC) in Espoo, whose waste heat would be utilized in the DH network [9]. To support the decarbonization of DH systems, the Finnish government is considering lowering the electricity taxation for large-scale heat pumps producing district heating [10].
Lund et al. [11] conducted a mapping of heat sources for HPs in Danish DH systems. A total potential of 138.8 PJ/a was found for industrial waste heat sources. The greatest number of sources were from flue gas cooling, of which the majority had a temperature level higher than 100 °C. From process cooling, approximately 99% of the individual sources provided excess heat at temperature lower than 100 °C. Other identified types of industrial processes with potential waste heat sources are, for example, evaporation and condensation, drying, freezing and cooling, waste steam, and chemical reactions. Lund et al. also listed supermarkets as a potential waste heat source. Utilizing waste heat from a supermarket has the benefit that there is usually HP already installed to provide cooling, and with only a small additional investment the installation can be converted so that it provides cooling for the supermarket and heat to a DH network simultaneously. Low-temperature industrial waste heat is potentially available in 17.1% of Danish DH systems and the potential heat volume is 3.4 TWh/a. The waste heat from supermarkets is available for a greater number of DH networks (61.5% of Danish DH systems), but the potential heat volume is much lower at only 0.4 TWh/a. Excess heat from the waste heat treatment has a total potential heat volume of 2.9 TWh/a in 34.5% of Danish DH networks.
There are numerous previous studies on DCs as waste heat providers. Utilization of DC waste heat has been studied, for example, in [12,13,14,15]. Information technology (IT) equipment inside DCs process and store data in large volumes, consuming large amounts of electricity. Another important energy consumer in DCs is the heating, ventilation and air conditioning (HVAC) equipment, which is needed to produce a proper working environment and extract any excess heat produced by the IT equipment. In addition to the correct temperature, the HVAC system is responsible for regulating the humidity and pollution in the air at a safe level for the delicate IT equipment. Currently, DCs are estimated to consume 3% of the world’s total electricity, while the energy demand on data storage and processing is estimated to increase in the upcoming years. To reduce the environmental impact of DCs, heat reuse has increased. Additionally, the possibility of utilizing the renewable electricity sources as forms of integrated production or power purchase agreements has been considered in literature and existing projects. The use of renewable energy can be increased by scheduling the non-critical electricity consumption processes for the hours where there is a high proportion of renewable electricity in the grid, i.e., photovoltaic electricity during day time [12].
According to Lu et al. [13], 97% of the electricity consumed in DCs could be utilized as waste heat, providing an attractive heat source for DH, but the low temperature causes some problems related to efficient utilization. Outdoor temperatures have an impact on the power consumption of a DC, especially for HVAC systems, however DCs can provide a somewhat steady load throughout the year [14]. Waste heat temperatures vary from 25 to 35 °C in air-cooled DCs. In liquid-cooled DCs, the waste heat temperature can range from 50 to 60 °C, although liquid cooling often covers only the hottest components, while lower temperature components are still cooled by air [15]. These waste heat temperatures are often too low for current DH operating temperatures. In Finland, the DH supply temperature usually varies between 75 and 120 °C, meaning the low-temperature waste heat would require priming, for example by heat pumps. The DH return water temperature usually stays below 50 °C, which is easier to achieve with waste heat sources [16]. However, higher return temperatures would have negative effects on the efficiency of the system [17]. Thus, the DH operator would often prefer the waste heat feed to be on the supply side; for example, Fortum’s buy-in price is higher for the supply side than for the return side [6].
In a review, Huang et al. [12] listed 17 existing DC projects that utilize waste heat or have committed to using renewable electricity within their own production or by power purchase agreements. Seven of these DCs are located in Finland and most of them utilize waste heat in some form. An exception to this is Google’s DC in Hamina, where the DC cooling is implemented via a natural seawater cooling system, however the DC has committed to purchasing wind energy. From a DC owner’s point-of-view, there are many advantages to placing a DC in Finland or other Nordic countries. Electricity is cheap and the share of renewable electricity is usually high, which can help to create a green image for the DC. The cold climate in Nordic countries decreases the cooling demands of a DC, thus reducing the costs. Additionally, the proximity to lakes or seawater allows the use of natural water for cooling. Moreover, the high heat demands and extensive DH networks in Nordic cities enable the efficient reuse of DC waste heat.
Due to the high investment costs of a DH network, the DC must be located close to the heat demand for efficient waste heat utilization. Additionally, in smaller DCs the waste heat reuse in DH systems may not be a feasible solution [18]. In such cases, a more feasible solution could be utilizing the waste heat in the DC building or some other nearby buildings without a connection to DH network. This would also allow lower utilized waste heat temperatures, but the lower and less stabile heat demand would limit the reuse of waste heat. Other potential uses for waste heat recovery have been studied as well. These include electricity production in an organic Rankine cycle, water desalination and absorption chillers for cooling [15]. Waste heat can also be used to preheat inlet water to power plant boilers, and in Switzerland, a swimming pool is heated by a nearby data center [12].
Pärssinen et al. [19] conducted an investment analysis for utilization of DC waste heat from the perspective of a DC operator. The DC operator would invest in the heat recovery equipment, including a HP to prime the heat. The analysis was done for three different sizes of DCs, and the results showed that selling waste heat from a small DC is not profitable for a DC owner, but it could be feasible to invest in heat utilization from larger scale DCs. The payback times varied between 2 and 4 years in the feasible cases of the study. Wahlroos et al. [18] also concluded that heat recovery from a DC is profitable and the payback time of an investment is less than the lifetime of the equipment. Waste heat utilization can lead to reduction of the CO2 emissions if the use of fossil-fuel-burning HOBs can be avoided. On the other hand, if the DH system is already highly decarbonized and waste heat can replace low-emissions sources, increased electricity consumption can even increase the total emissions of the DH system.
Oró et al. [20] studied waste heat recovery from different air cooling systems in DCs. The study was based on a 1000 kW DC in Spain. The results show that the waste heat recovery increased the power usage effectiveness (PUE) value. The PUE is a commonly used metric for measuring the energy effectiveness of DCs. It is calculated by dividing the total power consumption of a DC by the power consumption of IT equipment. Thus, the theoretical minimum is 1 when all the power consumed by a DC is used in its IT equipment, and the power usage is more effective when the PUE is closer to 1. Although PUE is commonly used, it does not take into account the energy that is recovered and reused. For this, Oró used the energy reuse factor (ERF) based on the primary energy consumption, which is the share of reused primary energy out of the total consumption of a DC. The results showed that 55% of the consumed primary energy could be reused in a DH network. With the assumption that the DC owner operates and invests in the heat recovery equipment, a cooling system recovering heat from hot return air proved to be economically feasible, with payback times varying between 10 and 14 years. In other studied cooling systems, waste heat was captured from a condenser in a chiller, which cooled down the chilled water circulation. With these systems, the payback time exceeded the assumed 15-year lifetime of the equipment.
He et al. [21] studied DC waste heat utilization as a means to replace heat production based on coal as a case study in China. The results showed that waste utilization led to significant power savings and increased energy efficiency for the DC. The temperature level of the waste heat could be raised by installing a distributed cooling system, where the heat absorbed from the server racks evaporates the cooling fluid in pipes placed in the back of the racks. The cooling fluid is condensed via chilled water circulation, from which waste heat is recovered by heat pumps. Such a system resulted in increased DC energy efficiency when compared to a free cooling system, where waste heat is dumped into the environment. Two-phase cooling systems are based on the latent heat of the cooling fluid, and can remove greater amounts of heat with a smaller mass flow for the cooling fluid. Additionally, capturing the waste heat at higher temperatures is possible in two-phase cooling systems [12].
Lowering the DH supply temperature would reduce the utilization of different waste heat and renewable sources, but lower operation temperatures would also decrease the heat losses in the distribution and increase the system efficiency [22]. In new low-energy houses, a supply temperature of 50 °C would be enough for space heating, but older buildings are often designed for higher supply temperatures. Additionally, old domestic hot water substations would need to be replaced and special care would need to be taken to avoid the increased legionella risk due to lower temperatures [23]. According to Volkova et al. [24], low-temperature district heating is one of the most important factors in lowering the emissions and fuel consumption of DH systems, however the transition to large systems would require a long period of time, and there are no public plans for lowering the operation temperatures in Espoo. Thus, low-temperature district heating is not considered in this paper.

2. Materials and Methods

The goal of this paper was to analyze the impact of waste heat utilization on the DH production costs after abandoning coal- and natural-gas-based CHP production. Espoo’s DH system was modeled using EnergyPRO software from EMD International A/S, Aalborg, Denmark [25]. EnergyPRO is a commercial software and it was chosen for this study as it is able to model complex systems of different production units with different characteristics. EnergyPRO is widely used for research purposes. At every time step, EnergyPRO calculates priority numbers based on marginal production costs, taking into account any possible limitations on the use of a production unit. In this paper, the used time step was one hour and the optimization period was one year. The electricity price, outdoor temperature, DH supply, and return temperatures were input into the model for each time step as a time series. The modeling in this study was done with EnergyPRO version 4.6.797.
The DH system was modeled as three scenarios of different electricity prices. The assumed year of the simulation was 2030, when all the coal-based capacity should be shut down in the Espoo area and the share of renewable sources in the DH production should be 95% [2]. The DH system was modeled in each electricity price scenario without coal-based capacity, but the natural-gas-burning CHP plants were still in operation. The amount of waste heat needed to replace the CHP capacity and to increase the share of renewables to 95% was studied by removing the CHP capacity and increasing the capacity of waste heat from 0 to 200 MW. Two different operation strategies were introduced—an operation strategy based on marginal costs and an operation strategy prioritizing waste heat utilization.
After optimizing the production in EnergyPRO (EMD International A/S, Aalborg, Denmark), the results were used in an investment analysis. The production costs of a system with waste utilization were compared to the production costs of a DH system without waste heat and the annual savings achieved were considered as a revenue source.

2.1. External Conditions

The DH operator published the hourly heat demand for the year 2016 in Helsinki’s DH network [26]. This demand was scaled down to estimate Espoo’s heat demand and hourly profile. The total annual demand was 2601.7 GWh and the peak load was 942.5 MW. For outdoor temperature, hourly data for 2016 from the weather observation station in Kaisaniemi, Helsinki, were used [27]. Because the supply temperature has a significant impact on the performance of heat pumps, the supply temperature was modeled according to the outdoor temperature and a control curve in [16]. The control curve is shown in Figure 1. The return water temperature was assumed to be constant at 50 °C. Figure 2 shows the supply and return temperatures over a year.

2.2. Heat Pumps

The software (EnergyPRO, EMD International A/S, Aalborg, Denmark) calculated the coefficient of performance (COP) for heat pumps at each time step according to the given initial characteristics of a heat pump and the operation temperatures, i.e., the supply and return temperatures and the heat source’s inlet and outlet temperatures [25]. Heat pumps were used to recover low temperature waste heat from data centers and purified sewage water. It is assumed that the HPs can produce heat in the required supply temperature independently. In reality, HPs often need priming by other heat plants to achieve the highest supply temperatures. For example, the Katri Vala heat pump plant in Helsinki can produce heat at temperatures up to 90 °C, and at higher temperatures the DH supply water is primed by a natural-gas-burning HOB. In Mäntsälä (21,000 inhabitants) in Finland, a HP harvests heat from warm cooling air from a data center. The HP’s supply temperature can reach 90 °C and it can cover all of Mäntsälä’s DH heat demands during summer; however, during the winter months, it needs priming by other production units [28]. The Suomenoja wastewater heat pump (WWHP) plant in Espoo recovers heat from sewage water. The plant consists of two 23.5 MW units, and a third unit is planned for 2021. During winter, the sewage water temperature is 10 °C and the HPs cool it down to 3 °C. In summer, the sewage water is cooled down from 14 to 7 °C. The HP can produce heat with a COP of 3.7 [29].
The COP of heat recovery HPs and heat source temperature depend on the cooling system of a DC. The most efficient cooling system is all-liquid cooling, in which the waste heat can be recovered at temperatures ranging between 50 and 60 °C. In such a system, HPs can have COP of up to 6.3. In mixed air–liquid cooling systems the COP can reach 5.5, while in air-cooled systems the COP can reach 4.1 [15]. In Finland, the most commonly used system in DC is an air cooling system, in which cold cooling air is led to the IT equipment through a floor plenum. Cooling efficiency can be increased by adding a chilled water system to capture heat from the warm cooling air, but this decreases the temperature level [13].
In Figure 3, a typical DC air cooling system with chilled water circulation and a heat recovery HP is illustrated, showing the approximate temperature levels. Cold cooling air is led from the computer room air conditioning (CRAC) unit through the floor plenum and perforated floor tiles to the cold aisle between the service racks. Air flows through the service racks cooling them. Finally, via the hot aisles, the warmed up cooling air circulates back to the CRAC unit, where it is cooled down to the required temperature by chilled water circulation. Waste heat is recovered from the chilled water circulation by HPs [21]. Heat can be recovered from the chilled water at temperatures in the range of 10–20 °C. The inlet temperature to the service racks typically varies between 15 and 25 °C, while the temperature of the returning hot air ranges between 25 and 35 °C [15]. Some studies show that even though heat can be captured at higher temperatures directly from returning cooling air, this increases the complexity of the cooling system; thus, heat recovery from chilled water can be more beneficial [21].
In this paper, it is assumed that data center heat pumps (DCHPs) use a DC chilled water circuit as the heat source. The heat source inlet and outlet temperatures are 15 and 10 °C, respectively. These temperatures are collected from [13]. In the example in Figure 3, to produce 10 MW of heat, a DH operator buys 2.8 MW of electricity from the spot market and pays a buy-in price for 7.2 MW of waste heat to the DC owner. Table 1 shows the assumed design characteristics and actual operation temperatures of the DCHP and WWHP. To allow easier comparison, same design characteristics are assumed for DCHP than WWHP. In the model, the maximum electric capacity of HPs is set high enough so that it does not limit the heat production.

2.3. Buy-In Heat

The DH operator, Fortum, published buy-in prices for an open DH network in the Espoo area. The price varies according to the outdoor temperature and differs depending on whether heat is fed on the return or supply side [6]. The buy-in prices are shown in Table 2. In this paper, it is assumed that the DH operator is responsible for upgrading the DC waste heat to the supply temperature, thus the DH operator pays the lower return side price. The DH operator pays for the cold temperature heat fed on the evaporator side of the DCHP. In the model, the amount of energy provided by a DC is calculated every hour by subtracting the consumed electricity in the DCHP from the heat produced by the DCHP. The DH operator also pays the spot price, electricity tax, and distribution costs for the consumed electricity, along with the variable operation and maintenance (O&M) costs of the HP.
An energy company, ST1, is planning to open a geothermal plant in Espoo. Heat from the geothermal plant would be sold to the DH network [2]. The prices in Table 2 were used for this as well. Because it is assumed that geothermal heat can be fed to DH network in the required supply temperature, the DH operator pays the higher supply side price for it.

2.4. Assumptions

Three different scenarios were assumed with different electricity prices. In scenario A, the average electricity price is 29.36 €/MWh. The electricity price and its hourly profile were taken from [30]. In [30], Khosravi et al. studied different scenarios of development of the Finnish energy mix. In scenario 9, Khosravi et al. assumed that wind power capacity is increased in Finnish electricity markets with a support from feed-in tariffs. Additionally, nuclear power capacity is increased and coal-based power production is shut down. CO2 allowances were assumed to be 30 €/tCO2. The average electricity price of scenario C, 77 €/MWh, was taken from [31], where the price of CO2 allowances was assumed to be 30 €/tCO2 as well. The average price of scenario B, 54 €/MWh, corresponds to electricity price estimation in 2030 in Germany, with CO2 allowances of 29 €/tCO2 and 22% of volatile renewable electricity production [32]. The value was chosen here because it is roughly in between the other two scenarios. The hourly price profile for 2016 [33] is scaled in scenarios B and C.
The DH operator has to pay for the electricity that the heat pumps consume. In addition to the spot market price, distribution fees and electricity tax are paid for the consumed electricity. The electricity from CHP production is also sold at the spot price. Distribution fees are collected from the high voltage price list of the network operator in the Espoo area [34]. The electricity grid customer is able to choose from two different pricing methods. Here, pricing with lower distribution costs but higher fixed monthly costs was chosen. The distribution costs consisted of the consumption fee, load fee, and security of supply fee. A reactive energy or reactive power fee was not considered. From December until February, the consumption fee was 9.91 €/MWh during the daytime (from 07:00 am until 09:00 pm), and at any other time the fee was 3.29 €/MWh. In this paper, it was assumed that heat pumps pay taxes according to the lower tax category 2, which was 6.9 €/MWh. Both electricity consuming and producing units pay a load fee to the grid operator. The electricity costs are shown in Table 3 and the fuel costs are shown in Table 4. The price of the CO2 allowance was assumed to be 30 €/tCO2 [31]. For CHP production, all the costs were assumed to be costs of DH production and the revenue from electricity production was subtracted from the total costs. Electricity consumption was assumed to cause emissions of 0.091 tCO2/MWh, which was the average emission factor of electricity consumption in Finland in 2019 [35].
The DH system had a total HOB capacity of 816 MW, including the two planned new wood-chip-burning HOBs. The HOBs were burning natural gas, oil, bio-oil, wood pellets, or wood chips. The HOBs were not modeled as individual units, rather the same fuel burning boilers were modeled as one unit. The wastewater heat pump thermal capacity was 70.5 MW, which also included the planned third unit in the Suomenoja power plant area. In the reference scenarios, there were also two natural-gas-burning CHP units—an OCGT and CCGT. Start-up and shut-down times were limited for CHP units by adding minimum operation and non-operation times. These times were 24 h for the CCGT and 4 h for the OCGT. The minimum running capacity was 40% for the CHP units. HPs or HOBs did not have such restrictions. The production units and their variable operation costs are shown in Table 5. The DH system also included a 20,000 m3 hot water thermal storage unit, with a total storage capacity of 857.5 MWh. Heat losses for the storage or the network were not considered. For CHP units, heat rejection was allowed if it lowered the production costs.

2.5. Investment Analysis

The economic feasibility of the waste heat utilization was studied further by calculating the net present value (NPV) and discounted payback period (DPP) for DCHP investments of different capacities. In the calculations, the capital costs and fixed annual costs were considered. The investment gained revenue, which came from the production cost savings from waste heat utilization when compared to the situation of 0 MW of waste heat and no CHP production. Annual cash flows were assumed to be the same for every year, while changes in weather conditions, heat demands, electricity and fuel prices, and operation and maintenance (O&M) costs were not considered. The NPV can be calculated with Equation (1), where C0 is the initial investment costs, r is the rate of return, t is the investment’s life time, and C is the annual cash flow, which is equal every year after the investment is made. The annual cash flow equals the annual production cost savings subtracted with annual fixed costs. The equation is based on an equation represented in [43]:
N P V = C 1 ( 1 + r ) t r C 0
The assumptions for the costs contain a great level of uncertainty. For example, the location of a DC had an impact on costs, as a high share of the investment costs was due to building the DH network and connection to the DC [18]. The Danish Energy Agency estimated the investment costs for a 10 MW HP for recovering industrial waste heat to be 0.58 M€/MWheat in 2030, while if the HP needed to be capable of producing a DH supply temperature of 80 °C, the investment costs would be 5% higher. The annual fixed O&M costs were estimated to be 2000 €/MWheat/a [42]. Wahlroos et al. in [18] estimated similar sized HP’s investment costs to be 500 €/kWheat, while Rämä et al. [44] used value of 650 €/kWheat for HP investments. Another source of uncertainty is the rate of return. Companies operating in different business areas evaluate the rate of return differently. For example, if an investment contain high risks, the rate of return can be expected to be higher [19]. Often, DC owners have higher expectations for returns on their investments than DH operators [18].
Here, the investment costs were assumed to be 0.6 M€/MWheat and the annual fixed O&M costs were assumed to be 2000 €/MWheat/a. The DH operator also pays the monthly fixed fee for the electricity grid owner. A high-voltage connection in the Espoo area costs 19,500 €/month, leading to the total annual cost of 234,000 €/a [34]. The rate of return was assumed to be 6%, which was the same as Rämä et al. used in [44]. In addition to the NPV, the discounted payback period (DPP) was calculated with Equation (2) [43]:
D P P = l n ( 1 C 0 r C ) l n ( 1 + r )

3. Results

In the reference scenarios, when the CCGT and OCGT plants were still running and waste heat was not fed into the system, the average and total production costs were 37.34 €/MWh and 97.2 M€ in scenario A, 37.02 €/MWh and 96.3 M€ in B, and 32.26 €/MWh and 83.9 M€ in C. The shares of renewable energy sources (RES) are 80% in A, 79% in B and 67% in C. CO2 emissions of the reference scenarios are 130 ktCO2 in A, 136 ktCO2 in B and 205 ktCO2 in C. The emissions of electricity production are excluded from these numbers according to the power to heat ratio of the CHP plants. CHP plants can reject heat, if it leads to negative net production costs. In B, 75 MWh and, in C, 3841 MWh of heat is rejected. CO2 emissions from heat pumps are estimated throughout this paper assuming the 2019 average CO2 emission coefficient of electricity production (91 g/kWhel) in Finland [35].

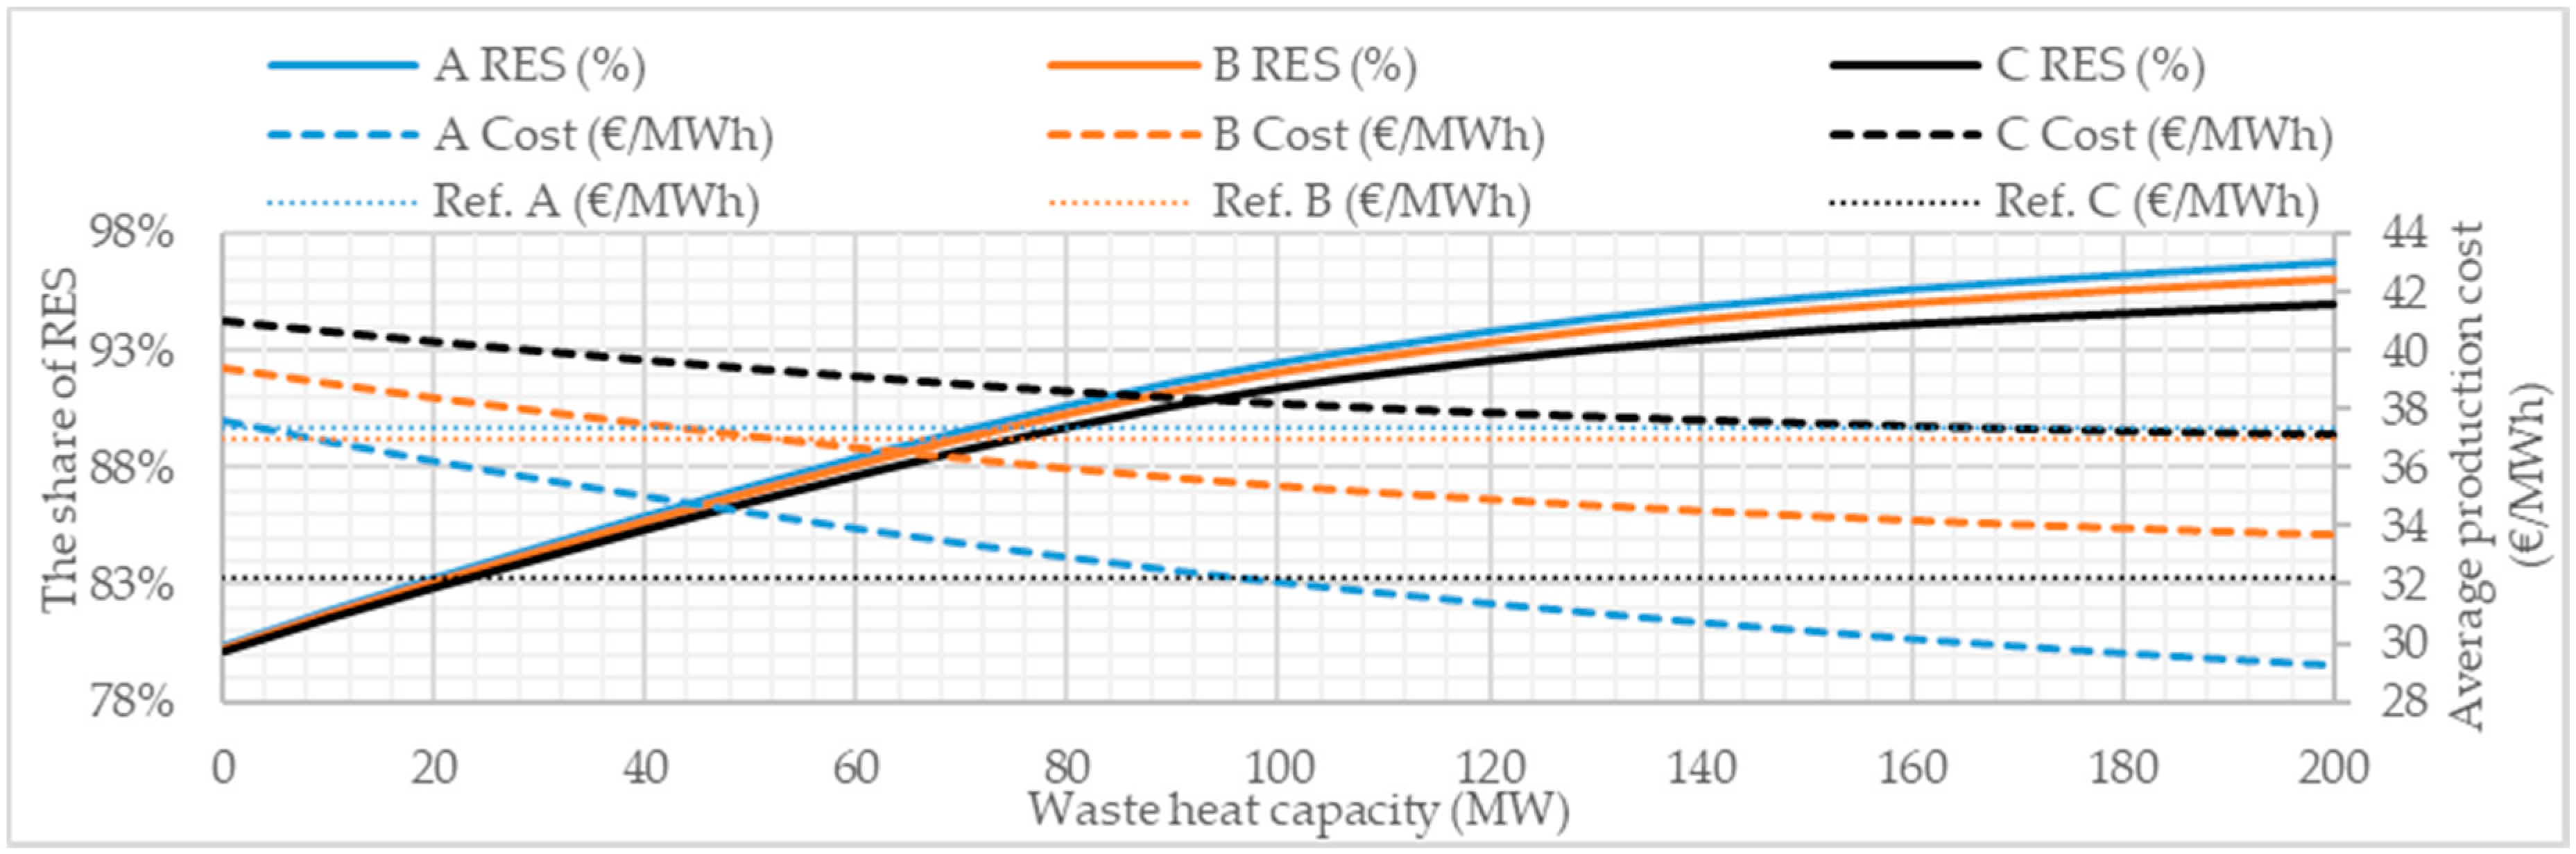
3.1. Operation Strategy Based on Marginal Costs

After removing the CHP capacity from the model, the capacity of DCHP is increased gradually from 0 MW to 200 MW by 10 MW steps. The production order of different units is based on their marginal costs and waste heat is utilized only if it is beneficial according to the total production costs. Thus, the production costs decrease as the waste heat capacity is increased. In Figure 4, the increase of the share of RES and the decrease of the production costs are represented, as waste heat capacity is added to the model. The key values of the results are represented also in Table 6.
In reference scenario A, the production share of the CHP plants is very small, at only 2% of the annual demand. Thus, removing the CHP capacity has a very small influence on the average production costs. Already the 10 MW waste heat can lower the average costs below the level of reference scenario A. In scenario B, approximately 60 MW of waste heat is needed to lower the average cost to the reference level. In reference scenario C, 29% of the annual heat demand is produced by the two CHP units. Due to the high electricity price, the cost of waste heat utilization is much higher and production costs cannot be lowered below the reference level, with a reasonable amount of waste heat.
The share of RES can be increased above the goal level of 95% with 150 MW of DCHP output in scenario A. The capacity factor of the DCHP is then 65%. In scenario B, approximately 160 MW output from the DCHP is needed to increase the share of renewables to the level of 95%, which leads to 60% capacity factor for the DCHP. In scenario C, 200 MW of the DCHP capacity is needed to increase the share of RES to the target level. The DCHP capacity factor is 45%. When the DCHP capacity of 200 MW is used, the total production costs are 76.1 M€ in scenario A, 87.7 M€ in scenario B, and 96.5 M€ in scenario C. With 95% share of renewables, the emissions are 68 ktCO2 in scenario A, 67 ktCO2 in scenario B, and 65 ktCO2 in scenario C.
In all of the scenarios, the capacity factor for DCHP decreases as more waste heat is added to the system. When the waste heat capacity is increased from 10 to 200 MW, the capacity factor for DCHP is 84–63% in scenario A, 85–56% in scenario B, and 78–45% in scenario C. For comparison, the 70 MW wastewater heat pump plant, which does not have buy-in costs, has a capacity factor of 99–98% in scenario A, 97–91% in scenario B, and 94–86% in scenario C. The 40 MW geothermal plant, which has higher buy-in costs but no electricity costs, has a capacity factor of 99–80% in scenario A and 100% in scenarios B and C. In scenarios B and C, the increase of the DCHP capacity does not have a significant impact on the production of the geothermal plant, but in scenario A it is seen that the DCHP replaces some of the production of the geothermal plant. If the DCHP capacity is set to 40 MW to be equal with the geothermal capacity in scenario A, the capacity factors are 77% for the DCHP and 97% for the geothermal plant.

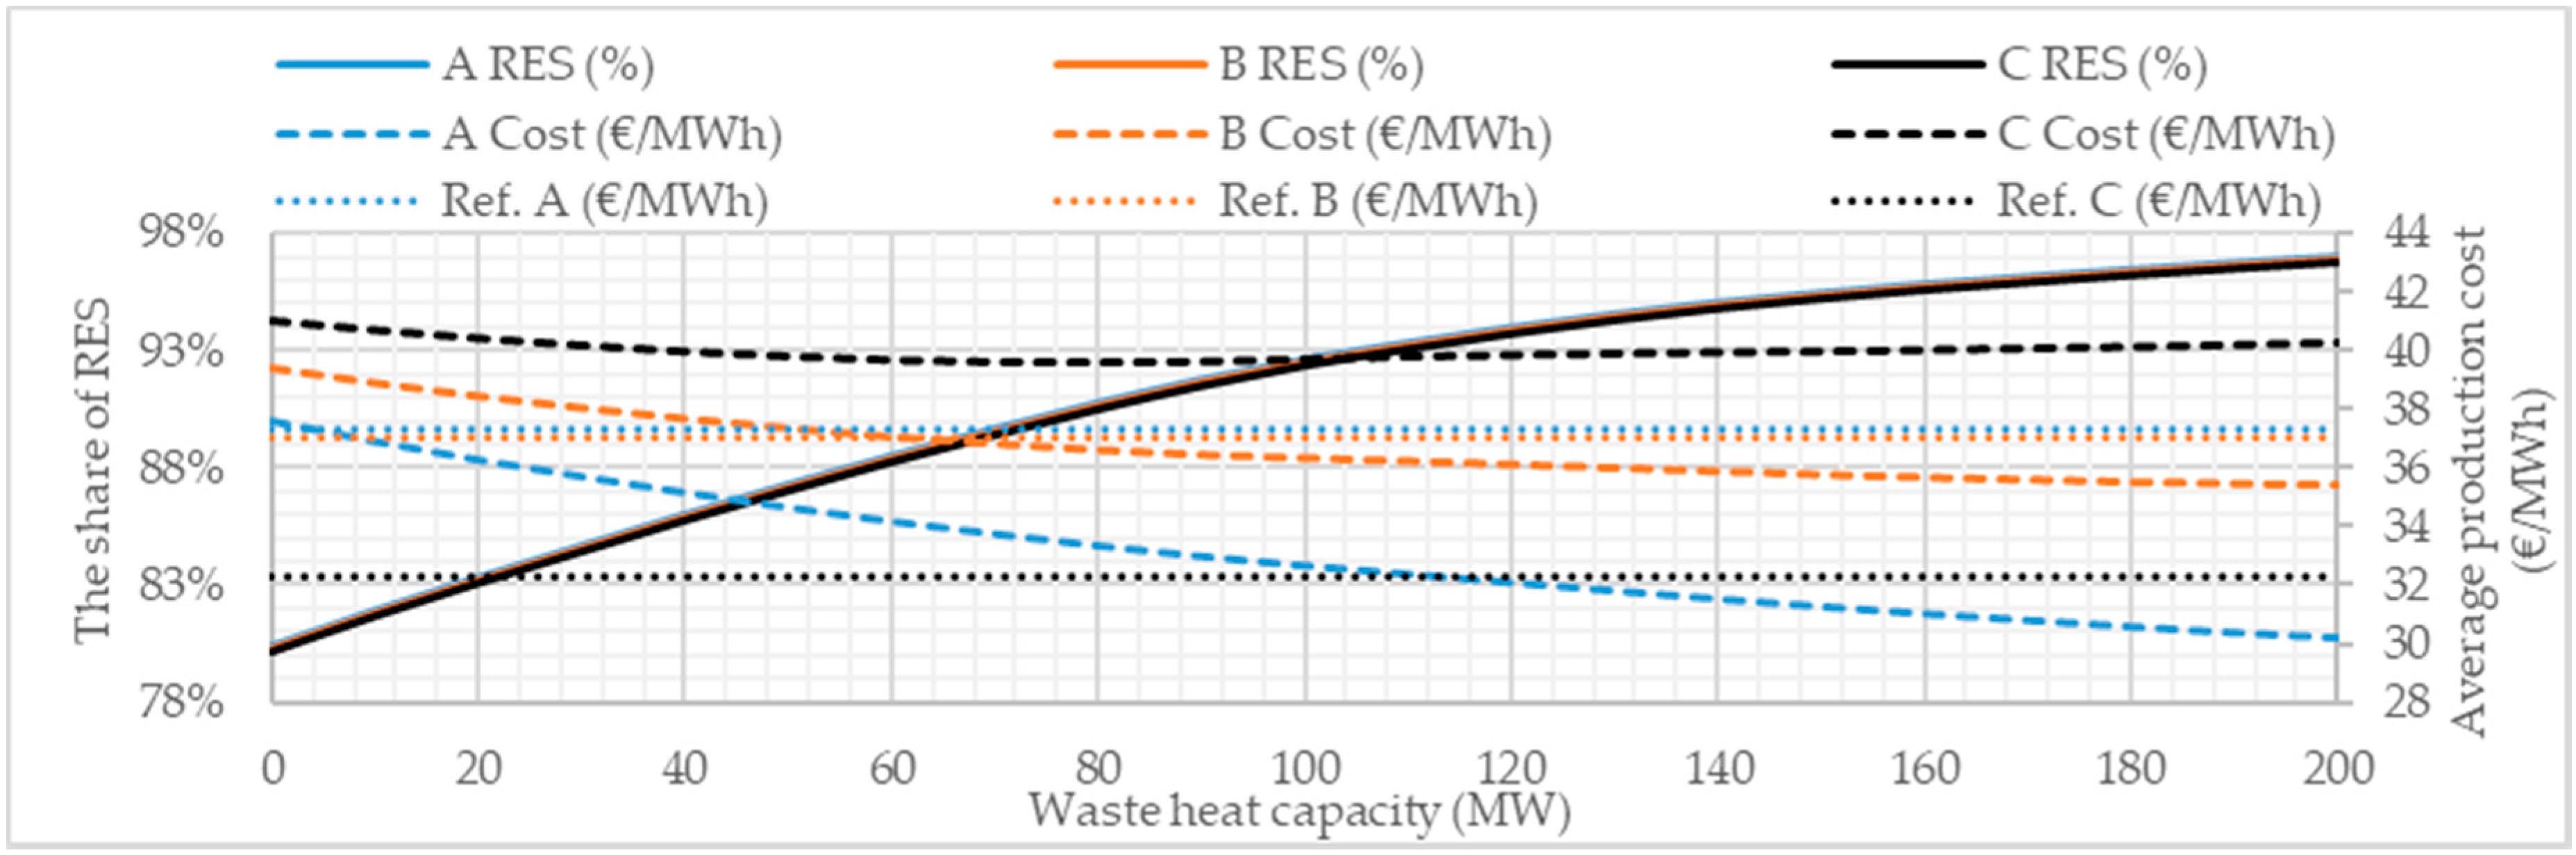
3.2. Operation Strategy Prioritizing Waste Heat

The waste heat utilization is prioritized so that waste heat is always fed in the network when it is possible. This raises the production costs, as waste heat starts to replace some of the cheaper production outputs, but the goal of 95% renewable production is achieved with a lower waste heat capacity. Because the electricity price does not have an impact on the capacity factor of a DCHP, the goal is achieved with 140–150 MW capacity of the DCHP in all the scenarios. There are small differences between the scenarios, because the higher electricity price still decreases the production of WWHPs and increases the natural gas consumption in HOBs. With a waste heat capacity of less than 100 MW, the DCHPs can produce heat at full load throughout the year, however after this the heat demand starts to limit the production. The annual minimum heat demand is 63.4 MW, however the thermal storage gives some flexibility to the heat production. The share of RES and the average production cost are shown in Figure 5 and Table 7 for different waste heat capacities.
Because the prioritized waste heat replaces some of the cheaper production outputs, the average production cost is higher than with a purely marginal-cost-based operation strategy. With 150 MW waste heat, the total production cost is 81.3 M€ in scenario A, which is about 2.7% higher than with the marginal-cost-based operation strategy. With 200 MW of waste heat production, the costs are 3.1% higher in scenario A, 5.2% higher in scenario B, and 8.5% higher in scenario C than with the marginal-cost-based operation strategy. Nevertheless, it is possible to decrease the production cost below the reference level in scenarios A and B. In scenario C, the reference cost level is not met. In scenario C, the minimum cost is achieved with 80 MW of DCHP capacity; after this point adding more waste heat increases the average production cost. When the 95% share of RES is achieved, the total annual emissions equal 71 ktCO2 in scenario A and 70 ktCO2 in scenarios B and C.

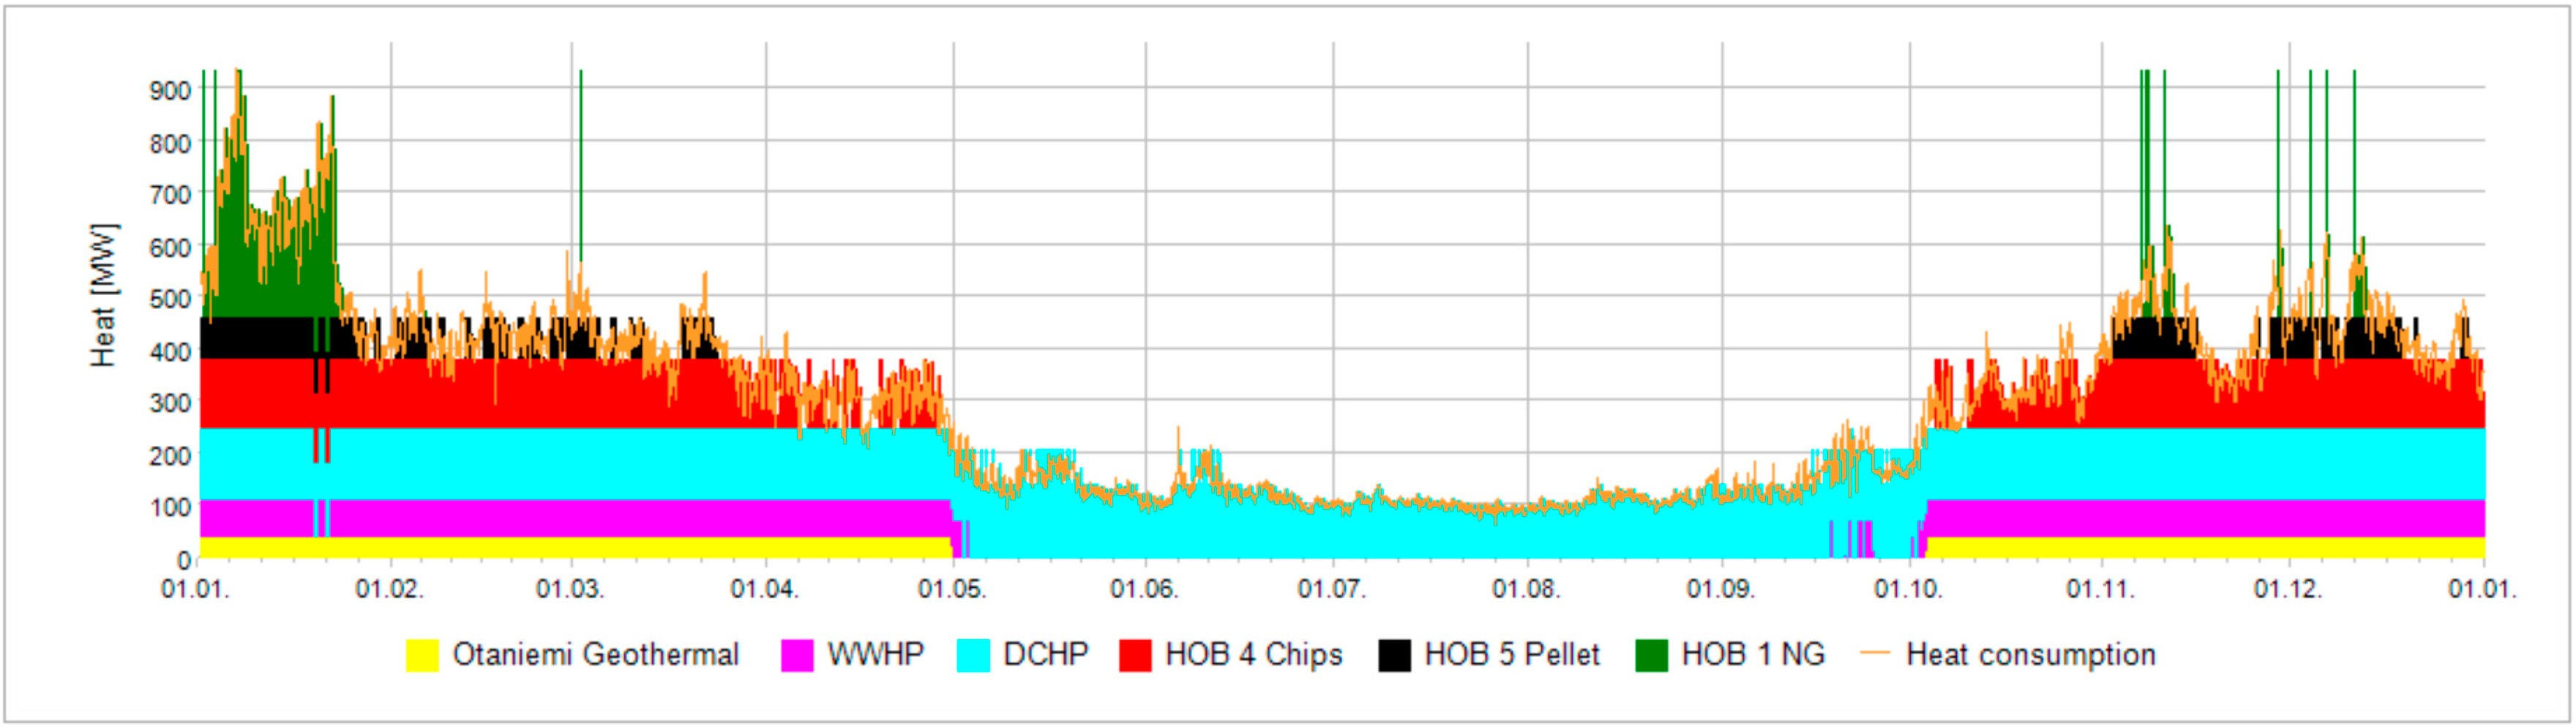
3.3. Fuel Consumption

When the 95% share of RES is reached by increasing the waste heat capacity, heat production from the DCHP replaces other heat sources. The greatest reduction is seen in natural gas consumption, which is the most expensive fuel that is used in the model. Oil and bio oil burning HOBs have higher fuel costs, but in the reference scenarios or 95% RES situation, they are not producing heat at all or only a very little, thus there are no changes. The reductions in natural gas consumption are the highest in the scenarios with higher electricity prices when the 95% RES situation is compared to the reference scenarios. This is due to the fact that higher electricity prices increase CHP production and natural gas consumption in the reference scenarios. Natural gas consumption decreases by 75–76% in scenario A depending on the operation strategy, 76–78% in scenario B, and 85–86% in scenario C. In total, the fuel consumption decreases by 48–51% in scenario A, 49–51% in scenario B, and 46–52% in scenario C.
In Table 8, the consumed fuels and other heat sources are represented in the reference scenarios and 95% RES situations. The values for sewage water heat and DC waste heat are calculated by subtracting the consumed electricity in a HP from the heat produced by the HP. The fuel consumption of the CHP plants (CCGT and OCGT) is allocated for heat and electricity production according to Equation (3), where Q is the fuel consumption, P is the electricity production, and is heat production:
Q F u e l H e a t = Q F u e l T o t a l T h P E l + T h
In Table 8, it can be seen that waste heat utilization decreases fuel consumption significantly, but for the total input energy to the DH system such large changes cannot be seen. In reference scenarios B and C, the total electricity production is greater than the consumption. When the two operation strategies are compared, prioritizing waste heat utilization (OS2) does not have a significant impact on the total energy input to the DH system. Changing the operation strategy from marginal-cost-based (OS1) to prioritizing waste heat decreases the fuel consumption only a little. In scenario A, the fuel consumption even increases if waste heat is prioritized. This is due to the lower DCHP capacity, which increases the need for HOBs during the peak demand hours. The most significant changes between the two operation strategies are seen in the use of geothermal plants and WWHPs. Figure 6 and Figure 7 show the production graphics for scenario A with both of the operation strategies.
When the operation strategy is based on marginal costs, the base load is produced mainly from the geothermal plant, WWHP, and DCHP. The heat production of the DCHP is emphasized during the colder months, as WWHP and geothermal plant cover the summer heat demand. In scenario A, only 24% of the annual heat production of the DCHP is produced during the six-month period between April and September. If the waste heat utilization is prioritized, the increased DCHP production has only a small impact on the need for HOBs during the peak demand hours. The most significant change is that during summer, the DCHP replaces the production from the WWHP and the geothermal plant, which are considered as renewable and sustainable heat sources as well. Therefore, increasing waste heat utilization by prioritizing it does not have a significant impact on fuel consumption in HOBs. In scenarios B and C, the pattern is not as clear and the higher electricity price limits waste heat utilization more during winter months if the operation strategy based on marginal costs is used. Therefore, a greater difference in fuel consumption can be seen after prioritizing the DC waste heat.

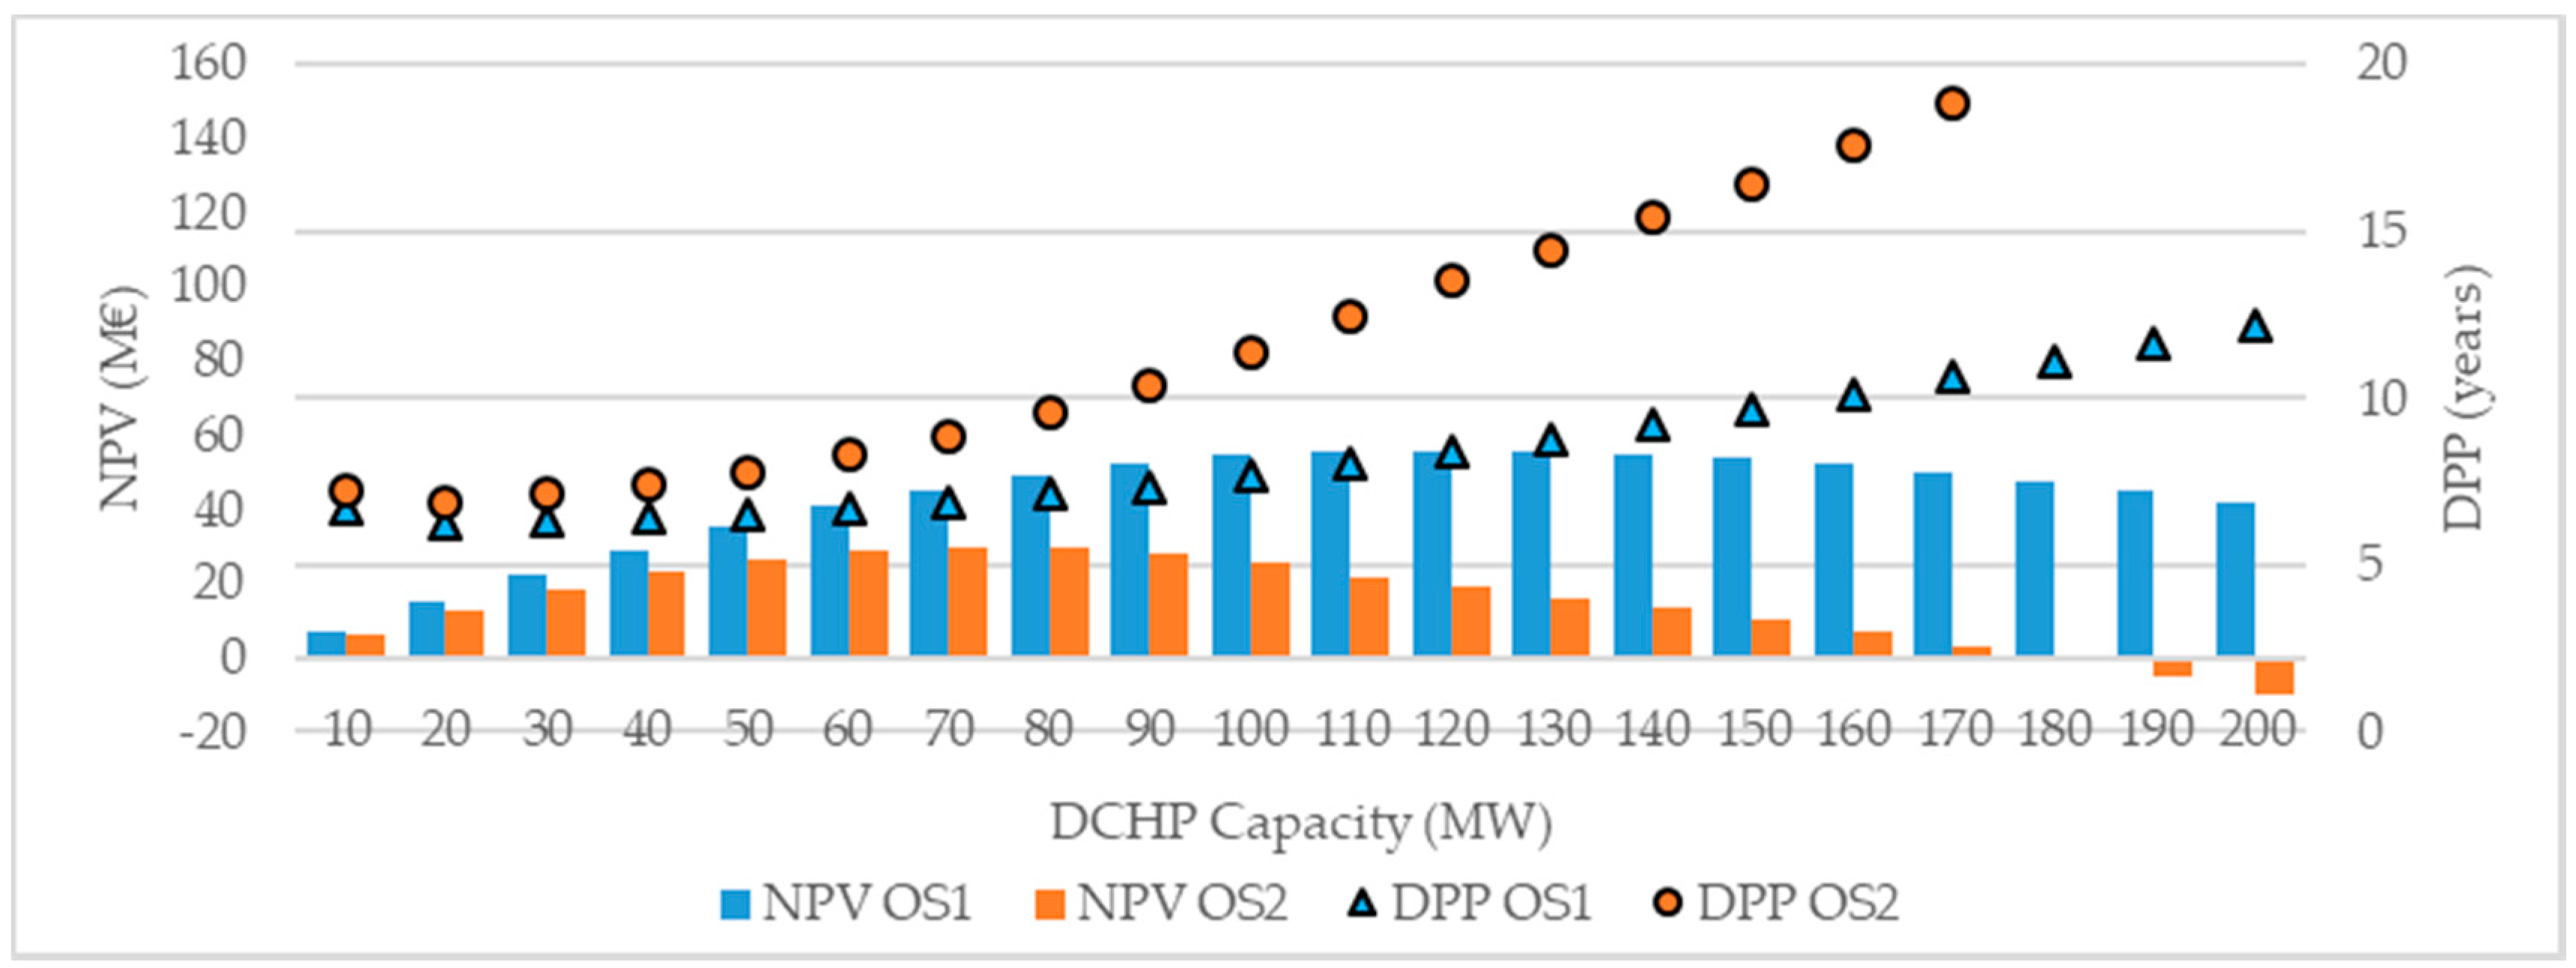
3.4. Investment Analysis

The NPV and DPP are calculated in every scenario and both of the operation strategies, with a DCHP capacity of 10–200 MW. The lifetime of the HP investment is assumed to be 20 years. In Table 9, the investment costs and annual net cash flows for each scenario are shown with some of the different DCHP capacities. Equations (1) and (2) are used to calculate the NPV and DPP for different scenarios, which are represented in Figure 8, Figure 9 and Figure 10.
With the operation strategy based on marginal costs, the NPV is positive in scenarios A and B for all of the DCHP capacities. In scenario C, a capacity of 180 MW or higher results in a negative NPV. As the capacity of the DCHP is increased, the increase of the NPV slows down and reaches its maximum of 121.9 M€ with 190 MW in scenario A, 56.0 M€ with 120 MW of DCHP in scenario B, and 19.7 M€ is reached with 90 MW of DCHP capacity in scenario C. The DPP is then 6.9 years in scenario A, 8.4 years in scenario B, and 12.0 years in scenario C. Prioritizing waste heat utilization over some of the cheaper production technologies decreases the NPV, however in scenario A the NPV is positive for all the capacities. If waste heat is prioritized in scenario A, the maximum NPV of 95.2 M€ is achieved with 180 MW of DCHP and the DPP is then 7.8 years. In the scenarios with higher electricity prices, the differences between operation strategies are greater. In scenario B, the maximum NPV of 29.7 M€ is achieved with 70 MW of DCHP and the DPP is then 8.9 years if waste heat is prioritized. Adding a capacity of 180 MW or more in scenario B results in a negative NPV. In scenario C, the maximum NPV is only 3.3 M€ with 30 MW capacity, while 60 MW or more results in a negative NPV.
The goal of a 95% share of RES in the DH production is achieved with a DCHP capacity of 150 MW in scenario A, 160 MW in scenario B, and 200 MW in scenario C if the operation strategy is based on marginal costs. This results in NPV and DPP values of 117.6 M€ and 6.1 years in scenario A, 52.4 M€ and 10.1 years in scenario B, and −11.1 M€ and 24.4 years in scenario C, respectively. By prioritizing waste heat utilization, the goal can be achieved with lower capacity and investment costs, however the NPV is lower in all scenarios. The capacity of 140 MW of DCHP in scenario A results in a NPV of 91.7 M€ NPV and a DPP of 6.9 years. In scenarios B and C, 150 MW capacity would be needed. In scenario B, this results in a NPV of 10.6 M€ and DPP of 16.4 years. In scenario C, the NPV is negative with 150 MW capacity.

4. Discussion

4.1. The Goal of 95% of Renewable Production Can Be Achieved

Two different operation strategies were studied with three different electricity price scenarios. The results showed that it is possible to lower DH production costs and have a high share of RES in the production by utilizing DC waste heat in the studied network. With marginal-cost-based operation strategy, waste heat was only utilized when it was beneficial according to the total production costs. This means that adding more waste heat capacity lowers the production costs, but at the same time the capacity factor of the DCHPs decreases. The goal of 95% share of RES in production was achieved in all scenarios. Figure 4 shows that the increase of the share of RES decreases when adding greater waste heat capacity to the system. Waste heat utilization leads to significant reductions of CO2 emissions in all of the scenarios. In this study, the 95% RES situation leads to average emissions of 25–27 g/kWhheat, depending on the electricity price and chosen operation strategy. By comparison, in 2018 in Finland, the average emissions for DH production equaled 147.1 g/kWhheat [45]. In 2012, the average emissions for Espoo’s DH production were significantly higher at approximately 300 g/kWhheat [46].

4.2. The Costs of Waste Heat Utilization are Highly Dependent on the Electricity Price

Approximately half of the total annual costs of waste heat utilization in scenario C are from the electricity spot price, one-third is from the waste heat buy-in, and the rest of the costs are from the heat pump O&M and electricity distribution. While a higher electricity price increases the waste heat costs, it also benefits the CHP production in the reference scenarios. In reference scenario A with the lowest electricity price, only 2% of the heat demand is produced by the natural-gas-burning CHP plants; thus, closing down these two plants only has a slight impact on the production costs. In the scenarios with higher electricity prices, the share of CHP production is higher and the impact on production costs is stronger. It was possible to lower the average production costs below the reference level in the scenarios A and B, but in C the reference cost level was not met.

4.3. Waste Heat Cannot Replace Winter Peak Production in Espoo

Waste heat utilization also leads to fuel savings in the DH system in the 95% RES situation when compared to the reference scenarios with CHP production. With the marginal-cost-based operation strategy, waste heat utilization is emphasized during the winter months, while in summer the demand is met mainly by the WWHP and geothermal plant. Natural gas and wood fuel burning HOBs are used mainly to meet the winter peak demand. Therefore, prioritizing waste heat utilization does not reduce fuel consumption significantly, however largest changes are seen in the utilization of geothermal energy and heat from sewage water, which are also considered renewable sources.
With the operation strategy prioritizing waste heat utilization, the maximum capacity of DCHP that can be fed to the DH network continuously is approximately 100 MW. A higher capacity than this would decrease the annual full load hours and lead to energy losses in the DCs. As the waste heat mainly competes against cheaper and already sustainable heat sources to produce the base load and because of the mismatch between the load and demand, DC waste heat does not fit well in terms of lowering the peak consumption of fossil fuels. Seasonal heat storage could be one solution for shifting waste heat production for the periods of higher demand and should be considered in future studies.

4.4. A Mutually Beneficial Operating Contract is Essential

In this paper, the DH operator paid the buy-in price for the waste heat provider according to the outdoor temperature. Fortum’s public open district heating network pricing was used. The public pricing is meant for heat producers with thermal capacity of less than 5 MW, thus the pricing may differ at a larger scale. It is important that a bilateral contract for waste heat utilization benefits both the DH operator and the waste heat provider. Depending on the terms of the contract, waste heat recovery may require high investments from both of the parties, and the pricing and terms of the contract should be set out so that these investment costs can be covered in a reasonable time [18]. The higher supply side pricing seems to be more beneficial to the DH operator, as the geothermal plant full load hours stay close to 100% in all of the scenarios.
Wahlroos et al. evaluated the barriers for waste heat utilization in [18]. Utilizing waste heat from an industrial facility also contains a risk for a DH operator, whereby the facility could be run down at relatively short notice, which should be considered when the investment decision is made. Additionally, the uncertainty in electricity markets can have an impact on the profitability, thus increasing the risks [28]. Additionally, from a DC operator’s perspective, there is a risk that the market situation may change and the DH operator may stop or reduce their purchasing of waste heat [18]. In this paper, the possibility of increasing the operating hours of the DCHPs by prioritizing waste heat was studied. In scenario A, prioritizing waste heat caused a relatively small increase in the costs when compared to the marginal-cost-based operation strategy. The higher electricity price led to a greater difference between the operation strategies. Increasing the costs related to priming the waste heat would likely decrease the price that the DH operator is willing to pay for heat. Waste heat does not seem to be a competitive heat source for the summer base load production, which implying that by lowering summer pricing could help the system reach higher annual full load hours for waste heat utilization, which could benefit both the DH and DC operators.

4.5. Liquid Cooling and LTDH Would Improve Utilization of Waste Heat

The DC was assumed to be cooled by traditional air cooled system with chilled water circulation to capture the heat from the cooling air. In many newly built DCs, especially larger scale DCs, the cooling demand is satisfied by liquid cooling systems, which allows the heat to be captured at higher temperatures. This would decrease the power needed to prime the heat and improve the COP of the HPs [12]. In this paper, the amount of waste heat capacity that is realistic in the Espoo area was not evaluated. The total waste heat capacity can consist of a few large DCs or multiple smaller ones. The results can be generalized to involve other low-temperature waste heat sources in an open DH network as well. In the Heat Roadmap Europe [5], the industrial excess heat potential in Finland is estimated to be 92 PJ (26 TWh), however this number does not include industrial facilities with a thermal capacity of less than 50 MW; thus, the estimation could be conservative.

4.6. Employment Shifts to IT Sector

The impact of closing down large energy plants on the employment rate in Espoo was not considered. While a power plant closing down could have a negative impact on employment, new DCs would also create jobs in the same area. For example, Google’s new DC in Hamina, Finland, has been estimated to have created approximately 100 new jobs in the area of the city [47].
Another energy company, Helen, and the city of Helsinki are planning to reduce their coal-based CHP capacity [48]. Closing down a large-scale CHP plant could have an impact on Finnish electricity markets as well. Khosravi et al. [30] concluded that if no replacement electricity generation capacity is provided, the decision to ban the use of coal in energy production would increase the net imports of electricity.

4.7. Future Electricity Price and CO2 Price Determine the Profitability of New Investments

The investment analysis showed that large-scale investment in waste heat utilization could be a profitable and feasible solution for decarbonization of Espoo’s DH system if the electricity price stayed at a low level. High electricity prices could easily make the investment unprofitable, as seen in scenario C in this paper. The prioritization of waste heat utilization in scenario C would not be profitable at a larger scale and capacity greater than 50 MW would result in a negative NPV. In the scenarios with lower electricity prices, the situation is better. In scenario A, the payback time for an investment to allow a 95% share of RES is approximately 6–7 years, depending on the operation strategy, which is relatively low when compared to the lifetime of the investment. In scenario B, the payback time is 10–17 years. In the scenario with the highest electricity price, the heat recovery investment to allow a 95% share of RES would not be profitable. The assumption that the profits and costs of waste heat utilization throughout the calculation period bring uncertainty to the investment analysis. The prices for electricity and fuel could change significantly over the 20-year period; for example, O&M costs may increase as well. Additionally, the annual average outdoor temperature has an impact on the heat demand, which would affect the outcome of the optimization. The DH network was modeled for a one-year optimization period. Taking into account changes to the costs and heat demand would have required the system to have been modeled for the whole 20-year period.
The future price of the CO2 emission allowance in the European market is crucial in determining the costs of the planned decarbonization. In this study, a moderate price of 30 €/tonCO2 was assumed, which is about 5 €/tonCO2 higher than the present level. With higher CO2 prices, the abandonment of coal and replacement with renewables and waste heat sources would be even more attractive.

5. Conclusions

In the studied price scenarios, it is possible to reach the goal of a high amount of renewable district heating production. In the reference scenarios for the lowest electricity prices, revenues from electricity production only have a slight impact on the total production costs, and it is possible to lower the production costs below the reference level via waste heat utilization. In the scenario with the highest electricity price, the situation is different. The high electricity price benefits the CHP production in the reference scenario and at the same time the costs of heat pumps increase, thus the reference level for the production costs cannot be reached by increasing the waste heat capacity. From the studied operation strategies, the strategy based on marginal costs leads to lower average production costs. On the other hand, if waste heat is prioritized in the district heating system, less capacity would be needed to reach the goal of renewable production. The difference in the needed capacity between the two operation strategies is especially significant in the scenario with the highest electricity price, where 200 MW is needed if marginal-cost-based strategy is used; by prioritizing waste heat, 150 MW is enough to reach this goal. Large-scale waste heat utilization also leads to significant CO2 emission reductions in all of the scenarios.
Even though waste heat utilization can lead to significant reductions of fossil fuel consumption, data center waste heat fits poorly when it comes to replacing fuel-burning heat-only boilers as peak demand producers. As the heat load provided by a data center is not dependent on the district heat demand and data centers provide heat throughout the year, data center waste heat works best as a base load heat source. The simulation of this study shows that increasing the waste heat utilization by prioritizing it in the running order mostly influences the utilization of other renewable and low-carbon heat sources. Additionally, the capacity needed for a 95% share of renewable production already exceeds the summer time minimum demand. For these reasons, reaching higher shares of renewable production can be difficult and other technologies or heat sources should be considered to decarbonize the peak load production.
Lower capacity and investments are needed to reach the goal of renewable production, if waste heat is prioritized, but the operation strategy based on marginal costs is more beneficial according to the net present value and payback time analysis. The investment is feasible in the two lower electricity price scenarios, but with the highest price the net present value is negative after the assumed lifetime for the heat recovery heat pumps.

Author Contributions

The conceptualization of the study was done by P.H. and S.S.; Methodology and formal analysis was done by P.H.; S.S. supervised the study; Writing—original draft and visualization was done by P.H.; Writing—review & editing was done by P.H. and S.S. All authors have read and agreed to the published version of the manuscript.

Funding

This research was funded by EU H2020 Grant Agreement number 856602—FINEST TWINS project.

Conflicts of Interest

The authors declare no conflict of interest.

References

  1. Finnish Energy, District Heating in Finland 2016. Available online: https://energia.fi/files/2144/District_heating_in_Finland_2016.pdf (accessed on 15 January 2020).
  2. Fortum, Espoo Clean Heat. Available online: https://www.fortum.com/espoo (accessed on 7 January 2020).
  3. Volkova, A.; Latõšov, E.; Lepiksaar, K.; Siirde, A. Planning of district heating regions in Estonia. Int. J. Sustain. Energy Plan. Manag. 2020, 27, 5–16. [Google Scholar] [CrossRef]
  4. Pieper, H.; Mašatin, V.; Volkova, A.; Ommen, T.; Elmegaard, B.; Markussen, W.B. Modelling framework for integration of large-scale heat pumps in district heating using low-temperature heat sources: A case study of Tallinn, Estonia. Int. J. Sustain. Energy Plan. Manag. 2020, 20, 67–86. [Google Scholar] [CrossRef]
  5. Persson, U. Quantifying the Excess Heat Available for District Heating in Europe. Heat Roadmap Europe, Project No: IEE/13/650, Work Package 2, Background Report 7. 2015. Available online: https://heatroadmap.eu/wp-content/uploads/2018/09/STRATEGO-WP2-Background-Report-7-Potenital-for-Excess-Heat.pdf (accessed on 15 June 2020).
  6. Fortum. Avoin Kaukolämpö, Ostohinnat (Website in Finnish: Open District Heating, Buy-in Prices). Available online: https://www.fortum.fi/yrityksille-ja-yhteisoille/lammitys/kaukolampo-0/avoin-kaukolampo/avoin-kaukolampo-ostohinnat (accessed on 9 January 2020).
  7. Larmio, R.; Fortum Power and Heat Oy. Waste Heat Utilization in Espoo’s District Heating Network. Building Energy Exergy: From Analysis to Applications Aalto University. Espoo, Finland, 9.3.2020. Available online: https://www.aalto.fi/sites/g/files/flghsv161/files/2020-03/Risto%20-%20Fortum_WasteHeatEspoo%20Distrib.pdf (accessed on 8 April 2020).
  8. Fortum. New Heat Pump Unit for Fortum at Suomenoja—The Share of Carbon-Neutral will Increase to over 50 Percent in 2022. Fortum, 27.5.2019. Available online: https://www.fortum.com/media/2019/05/new-heat-pump-unit-fortum-suomenoja-share-carbon-neutral-district-heating-production-will-increase-over-50-cent-2022 (accessed on 8 April 2020).
  9. Helsingin Sanomat. Fortumin Kiistelty Datakeskus Hanke sai Suunnitteluluvan Espoossa: Latuverkkoon ei Kosketa, Kaupunki Vakuuttaa (News Article in Finnish: Fortum’s Data Center Project Received a Planning Permission). Helsingin Sanomat, 17.9.2019. Available online: https://www.hs.fi/kaupunki/espoo/art-2000006241463.html (accessed on 14 January 2020).
  10. Ministry of Finance. Työryhmä Selvittämään Energiaverotuksen Uudistamista 13.11.2019 (Statement in Finnish: Working Committee Examine Renewing of Energy Taxation). Available online: https://valtioneuvosto.fi/artikkeli/-/asset_publisher/10623/tyoryhma-selvittamaan-energiaverotuksen-uudistamista (accessed on 8 April 2020).
  11. Lund, R.; Persson, U. Mapping of potential heat sources for heat pumps for district heating in Denmark. Energy 2016, 110, 129–138. [Google Scholar] [CrossRef]
  12. Huang, P.; Copertaro, B.; Zhang, X.; Shen, J.; Löfgren, I.; Rönnelid, M.; Fahlen, J.; Andersson, D.; Svanfeldt, M. A review of data centers as prosumers in district energy systems: Renewable energy integration and waste heat reuse for district heating. Appl. Energy 2020, 258, 1–20. [Google Scholar] [CrossRef]
  13. Lu, T.; Xiaoshu, L.; Remes, M.; Viljanen, M. Investigation of air management and energy performance in a data center in Finland: Case study. Energy Build. 2011, 43, 3360–3372. [Google Scholar] [CrossRef]
  14. Wahlroos, M.; Pärssinen, M.; Manner, J.; Syri, S. Utilizing data center waste heat in district heating—Impacts on energy efficiency and prospects for low-temperature district heating network. Energy 2017, 140, 1228–1238. [Google Scholar] [CrossRef]
  15. Davies, G.G.; Maidment, G.G.; Tozer, R.M. Using data centres for combined heating and cooling: An investigation for London. Appl. Therm. Eng. 2016, 94, 296–304. [Google Scholar] [CrossRef]
  16. Energiateollisuus, R.Y. Kaukolämmön Käsikirja (Book in Finnish: Handbook of District Heating); Kirjapaino Libris Oy: Helsinki, Finland, 2006; pp. 336–337. [Google Scholar]
  17. Fredriksen, S.; Svendsen, S. District Heating and Cooling; Studentliteratur: Lund, Sweden, 2013; pp. 462–468. [Google Scholar]
  18. Wahlroos, M.; Pärsinnen, M.; Rinne, S.; Syri, S.; Manner, J. Future views on waste heat utilization—Case of data centers in Northern Europe. Renew. Sustain. Energy Rev. 2018, 82, 1749–1764. [Google Scholar] [CrossRef]
  19. Pärssinen, M.; Wahlroos, M.; Manner, J.; Syri, S. Waste heat from data centers: An investment analysis. Sustain. Cities Soc. 2019, 44, 428–444. [Google Scholar] [CrossRef]
  20. Oró, E.; Taddeo, P.; Salom, J. Waste heat recovery from urban air cooled data centres to increase efficiency of district heating networks. Sustain. Cities Soc. 2019, 45, 522–542. [Google Scholar] [CrossRef]
  21. He, Z.; Ding, T.; Liu, Y.; Li, Z. Analysis of a district heating system using waste heat in a distributed cooling data center. Appl. Therm. Eng. 2018, 141, 1131–1140. [Google Scholar] [CrossRef]
  22. Schmidt, D.; Kallert, A.; Blesl, M.; Svendsen, S.; Li, H.; Sipilä, K. Low Temperature District Heating for Future Energy Systems. Energy Procedia 2017, 116, 26–38. [Google Scholar] [CrossRef]
  23. Brand, M.; Svendsen, S. Renewable-based low-temperature district heating for existing buildings in various stages of refurbishmen. Energy 2013, 62, 311–319. [Google Scholar] [CrossRef]
  24. Volkova, A.; Mašatin, V.; Siirde, A. Methodology for evaluating the transition process dynamics towards 4th generation district heating networks. Energy 2018, 150, 253–261. [Google Scholar] [CrossRef]
  25. EMD International A/S. EnergyPRO. Available online: https://www.emd.dk/energypro/ (accessed on 17 January 2020).
  26. Helen Oy. Open Data. Available online: https://www.helen.fi/yritys/vastuullisuus/ajankohtaista/avoindata (accessed on 17 January 2020).
  27. Finnish Meteorological Institute. Open Data. Available online: https://en.ilmatieteenlaitos.fi/download-observations#!/ (accessed on 17 January 2020).
  28. VALOR Partners Oy. Large Heat Pumps in District Heating Systems (In Finnish). Energiateollisuus Oy, 29.8.2016. Available online: https://energia.fi/files/993/Suuret_lampopumput_kaukolampojarjestelmassa_Loppuraportti_290816_paivitetty.pdf (accessed on 10 February 2020).
  29. Frioterm, A.G. Fortum—Utilizing waste heat with 2 Unitop 50 FY heat pumps. 2015. Available online: https://www.friotherm.com/wp-content/uploads/2017/11/E10-15_Suomenoja (accessed on 30 January 2020).
  30. Khosravi, A.; Olkkonen, V.; Farsaei, A.; Syri, S. Replacing Hard Coal with Wind and Nuclear Power in Finland—Impacts on Electricity and District Heating Markets. Energy 2020, 203. [Google Scholar] [CrossRef]
  31. Hast, A.; Syri, S.; Welsch, J.; Korkmaz, P.; Balyk, O. Transition to Carbon Neutral Energy Systems—Implications to District Heating in Cities. In Proceedings of the 2018 15th Internarnational Conference on the European Energy Market. (EEM), Lodz, Poland, 27–29 June 2018; pp. 1–5. [Google Scholar] [CrossRef] [Green Version]
  32. Helistö, N.; Kiviluoma, J.; Holttinen, H. Sensitivity of electricity prices in energy-only markets with large amounts of zero marginal cost generation. In Proceedings of the 2017 14th International Conference on the European Energy Market. (EEM), Dresden, Germany, 6–9 June 2017; pp. 1–6. [Google Scholar] [CrossRef]
  33. Nordpool. Historical Market Data, Elspot prices_2016_Hourly_EUR. Available online: https://www.nordpoolgroup.com/historical-market-data/ (accessed on 17 January 2020).
  34. Caruna. Electricity Distribution Rates, Price List for High Voltage Network, 1.1.2020. Available online: https://www.caruna.fi/en/our-services/products-and-rates/electricity-distribution-rates (accessed on 15 April 2020).
  35. Fingrid. Sähköntuotannon CO2-Päästöarvio (Website in Finnish: CO2 Emissions Estimation of Electricity Production). Available online: https://www.caruna.fi/en/our-services/products-and-rates/electricity-distribution-rates (accessed on 22 January 2020).
  36. Tilastokeskus. Fuel Classification. Available online: http://www.stat.fi/tup/khkinv/khkaasut_polttoaineluokitus.html (accessed on 22 January 2020).
  37. Fortum Power and Heat Oy. Environmental Permisson Application (In Finnish). Aluehallintovirasto, Lupa-tietopalvelu. Espoo. 31.12.2018. Available online: https://tietopalvelu.ahtp.fi/Lupa/Lisatiedot.aspx?Asia_ID=1568523 (accessed on 26 June 2020).
  38. ÅF-Consult Oy. Kivenlahden Lämpökeskuksen Toiminnan Muuttaminen, Ympäristöluvan Tarkistaminen Sekä Toiminnan Aloittamislupa (Permission in Finnish). Espoo. 29.9.2017. Available online: https://tietopalvelu.ahtp.fi/Lupa/Lisatiedot.aspx?Asia_ID=1420804 (accessed on 8 January 2020).
  39. Ramboll Oy. Ämmänsuon Lämpölaitoksen Ympäristölupa ja Toiminnan Aloituslupa (Evironmental Permission in Finnish). Espoo. 15.8.2018. Available online: https://tietopalvelu.ahtp.fi/Lupa/Lisatiedot.aspx?Asia_ID=1518935 (accessed on 15 August 2018).
  40. Hast, A.; Syri, S.; Lekavičius, V.; Galinis, A. District heating in cities as a part of low-carbon energy system. Energy 2018, 152, 627–639. [Google Scholar] [CrossRef]
  41. Fortum. Vermon BioöljyLaitos Vihittiin Käyttöön—BioölJyllä Korvataan FossiiLisia PolttoaiNeita LämmöntuotanNossa (In Finnish: Vermo Bio Oil Heat Plant was Commissioned—Bio Oil Replaces Fossil Fuels in Heat Production). Fortum. 9.10.2017. Available online: https://www.fortum.fi/media/2017/10/vermon-biooljylaitos-vihittiin-kayttoon-biooljylla-korvataan-fossiilisia-polttoaineita-lammontuotannossa (accessed on 14 January 2020).
  42. Danish Energy Agency. Technology Data Catalogue for Electricity and District Heating Production—Updated April 2020. Available online: https://ens.dk/en/our-services/projections-and-models/technology-data/technology-data-generation-electricity-and (accessed on 15 May 2020).
  43. Bhandari, S.B. Discounted payback period—Some extensions. Proc. ASBBS 2009, 16. Available online: https://www.researchgate.net/publication/228645884_DISCOUNTED_PAYBACK_PERIOD-SOME_EXTENSIONS (accessed on 22 May 2020).
  44. Rämä, M.; Wahlroos, M. Introduction of new decentralised renewable heat supply in an existing district heating system. Energy 2018, 154, 68–79. [Google Scholar] [CrossRef]
  45. Finnish Energy, District Heating in Finland 2018. Available online: https://energia.fi/files/4092/District_heating_in_Finland_2018.pdf (accessed on 22 May 2020).
  46. Helsinki Region Environmental Services Authority. Pääkaupunkiseudun Ilmastoraportti, Päästöjen Kehitys 2012; (In Finnish: Climate Report of the Capital Area); Edita Prima Oy: Helsinki, Finland, 2013; pp. 49–50. Available online: https://vanha.hsy.fi/sites/EsitteetKatalogi/Julkaisusarja/10_2013_pks_ilmastoraportti_2012.pdf (accessed on 27 May 2020).
  47. Tillaeus, J.; Lönnblad, K. Mitä Googlen Jätti-Investointi Merkitsee Suomelle? Kokosimme Vastaukset Viiteen Kysymykseen (News Article in Finnish: What Does Google’s Investment Mean to Finland? We Collected the Answers for Five Questions). Yle. 24.9.2019. Available online: https://yle.fi/uutiset/3-10984672 (accessed on 26 June 2020).
  48. Helen. Hiilineutraali Energia (In Finnish: Carbon-Neutral Energy). Helen. 25.3.2020. Available online: https://www.helen.fi/helen-oy/vastuullisuus/vastuullisuusraportti/hiilineutraali-tulevaisuus/energiantuotanto (accessed on 26 June 2020).
Figure 1. The control curve of the DH supply temperature.
Energies 13 03551 g001
Figure 2. The modelled supply and return temperatures.
Energies 13 03551 g002
Figure 3. Typical air cooling system of a data center with chilled water circulation and a heat recovery heat pump.
Energies 13 03551 g003
Figure 4. Production costs and share of renewable sources as a function of waste heat capacity in operation based on marginal costs. Abbreviations: Renewable energy source (RES), Reference scenario (Ref.).
Energies 13 03551 g004
Figure 5. Production costs and share of renewable sources as functions of the waste heat capacity in an operation prioritizing waste heat. Abbreviations: Renewable energy source (RES), Reference scenario (Ref.).
Energies 13 03551 g005
Figure 6. Production curve for scenario A for the 95% RES situation with 150 MW of DCHP capacity and for the operation strategy based on marginal costs. The figure is captured from the EnergyPRO model (EMD International A/S, Aalborg, Denmark).
Energies 13 03551 g006
Figure 7. Production curve for scenario A for the 95% RES situation with the operation strategy prioritizing 140 MW DCHP capacity. The figure is captured from the EnergyPRO model (EMD International A/S, Aalborg, Denmark).
Energies 13 03551 g007
Figure 8. The net present value (NPV) and discounted payback period (DPP) of scenario A with the marginal-cost-based operation strategy (OS1) and waste heat prioritization strategy (OS2).
Energies 13 03551 g008
Figure 9. The net present value (NPV) and discounted payback period (DPP) for scenario B with the marginal-cost-based operation strategy (OS1) and waste heat prioritization strategy (OS2).
Energies 13 03551 g009
Figure 10. The net present value (NPV) and discounted payback period (DPP) for scenario C with the marginal-cost-based operation strategy (OS1) and waste heat prioritization strategy (OS2).
Energies 13 03551 g010
Table 1. The design and actual temperatures of the heat pumps [29]. Abbreviations: Coefficient of performance (COP), District heating (DH), Waste water heat pump (WWHP), Data center heat pump (DCHP).
TypeCOPSource, Hot (°C)Source, Cold (°C)DH, Return (°C)DH, Supply (°C)
Design3.71475065
WWHPCalculated14/10 *7/3 *50Figure 2
DCHPCalculated151050Figure 2
* The higher value is the sewage water temperature during summer (April–September) and the lower value is during winter (October–March).
Table 2. Heat buy-in prices for supply and return side feeds [6].
Outdoor Temperature (°C)−20−16−12−10−8−6−4−20246810121620
Supply (€/MWh)5050505050454540303030252020202015
Return (€/MWh)353535353532322821212118141010108
Table 3. The costs of electricity distribution, fuel prices, and the average electricity price for three different scenarios. The costs of electricity distribution are collected from [34]. Average electricity prices are from [30,31,32]
Electricity Distribution€/MWh
Consumption fee3.29 (9.91) *
Load fee, intake from network1.81
Load fee, output to network0.72
Security of supply fee0.13
Electricity tax6.90
Average electricity price **:
Scenario A [30]29.36
Scenario B [32]54
Scenario C [31]77
* The higher price is used from December until February during the day time (from 7:00 am until 9:00 pm). ** In scenario A, the used hourly price profile was taken from [30] and the 2016 price profile [33] was scaled in scenarios B and C.
Table 4. Fuel costs [31] and emission factors [36] for different fuels. The price of CO2 allowances is assumed to be 30 €/tCO2 [31].
FuelPrice (€/MWh)Tax HOB (€/MWh)Tax CHP (€/MWh)Emissions (tCO2/MWh)
Natural gas32.418.612.90.199
Wood chips32---
Wood pellets38---
Oil6122.9-0.267
Bio-oil67---
Table 5. Production units in the model. Abbreviations: Operation and maintenance (O&M), Combined-cycle gas turbine (CCGT), Open-cycle gas turbine (OCGT), Heat-only boiler (HOB), Waste water heat pump (WWHP), Data center heat pump (DCHP), Natural gas (NG), Wood pellets (W. pellets), Wood chips (W. chips).
UnitFuelFuel Capacity (MW)Thermal Capacity (MW)Electric Capacity (MW)Minimum LoadMin. Operation/Non-Operation TimeO&M Costs
CCGT *NG49821423440%24 h4.5 €/MWhel
OCGT *NG132754540%4 h4.5 €/MWhel
HOB 1NG525473---2 €/MWhfuel
HOB 2Oil9485---2 €/MWhfuel
HOB 3Bio-oil4945---2 €/MWhfuel
HOB 4W. pellets9080---2 €/MWhfuel
HOB 5W. chips147133---2 €/MWhfuel
Geothermal--40----
WWHP--70.5---3 €/MWhheat
DCHP------3 €/MWhheat
* Used only in the reference scenarios. The approximate capacities of the CHP plants were taken from [37], HOB plants were taken from [38,39,40,41], the geothermal plant was taken from [2], and the WWHP plant was taken from [8,29]. Estimations of the variable operation and maintenance (O&M) costs were based on [42].
Table 6. Results with some selected data center heat pump (DCHP) capacities and the operation strategy based on marginal costs. Total annual emissions, the share of the renewable energy sources (RES) in production, and average production costs are represented in the table.
DCHP
Capacity
Emissions (ktCO2)RES %Costs (€/MWh)
ABCABCABC
Reference13013620580.3%79.3%67.0%37.3437.0232.26
0 MW13013113180.4%80.3%80.2%37.5939.3740.98
10 MW12412412481.9%81.8%81.6%36.8738.8440.61
140 MW68.569.070.694.9%94.4%93.5%30.7134.5137.59
150 MW67.668.069.295.3%94.8%93.8%30.4234.3437.49
160 MW66.967.168.195.7%95.1%94.1%30.1534.1937.39
200 MW65.564.865.296.8%96.1%95.0%29.2433.6937.09
The results in the 95% RES situation are highlighted with bold font.
Table 7. Results with some selected data center heat pump (DCHP) capacities and an operation strategy prioritizing waste heat utilization. Total annual emissions, the share of the renewable energy sources (RES) in production, and average production costs are shown in the table.
DCHP
Capacity
Emissions (ktCO2)RES %Costs (€/MWh)
ABCABCABC
Reference13013620580.3%79.3%67.0%37.3437.0232.26
10 MW12412412481.9%81.8%81.7%36.8938.8740.67
80 MW86.485.284.990.7%90.7%90.5%33.3236.6239.57
140 MW70.871.070.795.0%94.9%94.8%31.5035.9039.91
150 MW69.870.069.795.4%95.4%95.2%31.2435.7939.94
160 MW69.069.369.095.8%95.7%95.6%30.9935.7039.99
200 MW67.767.967.397.0%96.9%96.8%30.1735.4440.25
The results for the 95% RES situation are highlighted with bold font.
Table 8. Fuel and electricity consumption in different scenarios in the 95% RES situation with both of the marginal-cost-based (OS1) and waste heat prioritization (OS2) strategies. Abbreviations: Combined-cycle gas turbine (CCGT), Open-cycle gas turbine (OCGT), Heat-only boiler (HOB), Waste water (WW), Data center (DC), Natural gas (NG). Summations are represented in bold font.
Heat SourceA Ref.A OS1A OS2B Ref.B OS1B OS2C Ref.C OS1C OS2
DCHP capacity (MW)015014001601500200160
CCGT NG (GWh)36001620057600
OCGT NG (GWh)25001710026300
HOB NG (GWh)506136144265142134116145138
Oil (GWh)000000000
Bio-oil (GWh)000000010
Pellets (GWh)425170191410170170249221175
Chips (GWh)831592613825620592729670612
Fuels total1824898947183393289619331036925
Geothermal (GWh)348323202350351207344351218
WW heat (GWh)420418260412387248356362222
DC heat (GWh)060582105968630554863
Electricity (GWh)192445464189428476163400464
Total energy input278426902696278426942690279627042693
Electricity production49002520071000
Table 9. Investment costs and annual net cash flows for different scenarios with the marginal-cost-based operation strategy (OS1) and waste heat prioritization strategy (OS2). Abbreviations: Data center heat pump (DCHP).
DCHP CapacityInvestment (M€)Scenario A
Cash Flow (M€)
Scenario B
Cash Flow (M€)
Scenario C
Cash Flow (M€)
OS 1OS2OS1OS2OS1OS2
50 MW307.87.45.74.93.92.8
100 MW6013.912.410.07.46.92.9
150 MW9018.116.012.58.88.62.2
200 MW12021.118.714.19.69.51.3

