Abstract
In this paper, a novel two-stage dish concentrator (TSD) with a rotary secondary mirror (SM) is presented for solar thermal water/CO2 splitting. An in-house code for ray-tracing simulation of the concentrator was developed and validated. Among all feasible geometries, a hyperboloid with an upper sheet is the most popular option and is widely used as a secondary reflector, which is mainly discussed here. All para-hyperboloid geometric combinations can be categorized into three typical patterns (φ1 < π/2, φ1 = π/2, φ1 > π/2, φ1 = field angle of PM). The initial designs of the TSD, respective to different off-axis levels for each combination, were first designed. Then a new mathematical model was introduced to reshape the SM to reach optimal truncated designs. Finally, a new concept of an off-axis primary mirror (PM) combined with the truncated SM was evaluated by using the in-house ray-tracing code. The results include the optical efficiency, concentration ratio and intercepted radiant flux. The best solutions with the highest optical efficiency fall in the range π/2 ≤ φ1 ≤ (π − arcsin 0.8) rads and 0.4 ≤ NA2 ≤ 0.6 (NA2 = sin φ2, φ2 = field angle of SM), which vary with the concentration ratio and inclination angle.
1. Introduction
Concentrating solar thermal (CST) energy can be used to produce solar fuels through thermochemical processes for industrial, agricultural and other uses [1,2]. CST processes can employ the entire solar spectrum, reaching a higher theoretical solar-to-fuel efficiency. A promising technology is to produce H2/CO via a solar-driven redox cycle based on metal oxides [3]. To approach this, two step cycles of reduction and oxidation are considered as shown in Equations (1)–(3) [4,5].
where, δr and δo represent the nonstoichiometric numbers of reduced and oxidized states, respectively, and Δδ = δr − δo > 0 is the change in the oxygen nonstoichiometry in the metal oxide. For the first step (Equation (1)), the metal oxide is reduced at a relatively high temperature (Thigh), usually above 1473 K, driven by concentrated solar energy. In the second step (Equations (2) and (3)), the reduced oxide is cooled down to a low temperature (Tlow) to produce H2/CO [6,7]. Common redox pairs include metal oxidizes such as Zinc oxide (ZnO) [8,9,10], Tin oxide (SnO) [11], Ferrite (Fe3O4) [12,13,14], Ceria (CeO2) [15,16,17] and Perovskite [18,19].
Nonstoichiometric cerium oxidize (ceria) is of high interest due to its attractive characteristics including high melting point [20], crystallographic stability over a wide temperature range [16] and fast oxidation rate [20,21]. Typically, ceria-based redox is favored at Thigh > 1773 K and Tlow < 1273 K [16,22,23,24]. A solar dish concentrator with a high concentration ratio C~3000 with a coupled cavity receiver can achieve a high temperature atmosphere [25]. There are two main reactor concepts for achieving a temperature swing of Thigh and Tlow: (i) a fluidized-bed reactor concept using particle (or liquid) flows of reaction media [24] and (ii) a packed-bed reactor concept using a rotary monolithic reaction material [16]. The first concept requires a robust high temperature pump which is not easy to realize in real-world conditions. The second concept is more feasible, but still requires a mechanical operation for shifting reactant between different surroundings (reduction/oxidation zone). Considering that a reactor should preferably have a minimum number of moving parts to avoid potential machine failures in such a high-temperature condition [26], a novel concept of TSD with a rotatory SM is proposed here for achieving successive water/CO2 splitting processes.
Flexible structure and mechanical operation make TSD a good candidate for CST applications, especially for two step thermochemical water/CO2 splitting [27]. Different types of TSD have been developed. Rabl et al. [28] tested the performance of CPC as the second stage concentrator for a conventional parabolic or Fresnel reflector and found significant advantages. A Cassegrainian two-stage concentrator concept (parabolic & hyperbolic) was investigated by Mauk et al. [29] for a solar chemical system. Zhang et al. [30] discussed five different types of two-stage reflectors based on a primary parabolic mirror. Mora and Jaramillo [31] used porous silicon photonic mirrors as secondary reflectors. Five different types of SMs can be identified: (i) Flat mirrors [32], (ii) ellipsoidal mirrors [33], (iii) hyperboloidal mirrors with upper sheet [34] and (iv) lower sheet [35], and (v) paraboloidal mirrors [36]. Based on (iii), a novel TSD with a unique hollow structure was presented to improve optical performance for CST dish systems [37,38].
The rotating operation concept was initially proven by [27], in which a flat reflector was used as the SM In this paper, we introduce an improved concept of a TSD prototype with a rotatory hyperboloid SM and evaluate its optical performance, including optical efficiency and concentration ratio, with respect to different geometric parameters including rim angle of primary mirror (PM) and SM and inclination angle of SM. The results can guide research for designing a novel solar dish cavity receiver–reactor (CRR) system.
2. Optical Model
2.1. Prototype of TSD Concentrator
A TSD concentrator mainly includes a primary paraboloidal mirror and a secondary hyperboloidal mirror as shown in Figure 1 and Figure 2. Since the present work only focuses on the optical analysis, mechanical parts such as truss, brace and tracking device are ignored. Figure 1 shows 2D sketches corresponding to on-axis and off-axis cases, respectively. The PM is laid on the center of an XY plane in the direction. Incident sunlight is concentrated toward the first focal point, F1, by the PM, reconcentrated by the SM before approaching F1, and finally reaches the second focal point, F2. Point C is the origin point of the hyperboloidal function of the PM. Figure 2 shows 3D models of three representative geometries of the TSD with on/off-axis SMs, which includes all cases. The on-axis condition has been illustrated in previous studies [37,38]. The relevant results are used here to derive the general expression of off-axis TSD concentrator models. As shown in Figure 1b, the surface function of the PM is identical to the on-axis condition (Figure 1a), and the function of the SM can be obtained by rotating it along F1 from the on-axis position. Similarly, the new function of the receiving plane could also be obtained. The necessary functions of the concentrator are given by Equations (4)–(6).
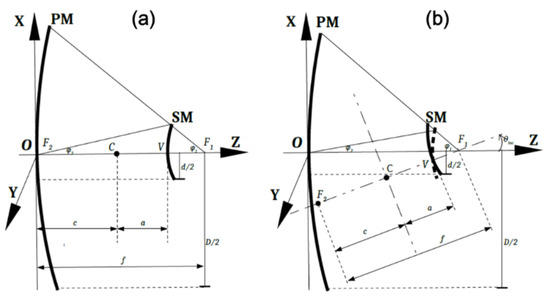
Figure 1.
Sketches of two stage dish (TSD) concentrators in on/off axis conditions: Paraboloidal dish combined with (a) an on-axis hyperboloidal mirror, (b) an off-axis hyperboloidal mirror. (Not to scale).
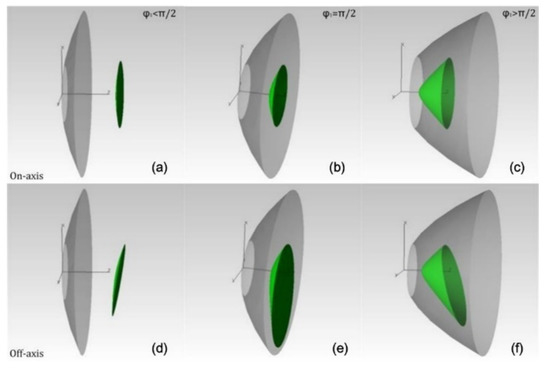
Figure 2.
3D models of three representative geometries correspond to on/off-axis conditions, respectively. On-axis: (a) φ1 < π/2 (b) φ1 = π/2 (c) φ1 > π/2 Off-axis: (d) φ1 < π/2 (e) φ1 = π/2 (f) φ1 > π/2.
PM’s function:
SM’s function:
Function of receiving plane:
where parameters of focal length, f = 2 c, major axis a, minor axis b, related to the paraboloid and/or hyperboloid could be calculated by the half field angles (φ1 for PM, φ2 for SM) and diameter of PM (D). e represents the distance from flat target to O which sets to 0 in this paper. θinc represents the inclination of off-axis SM. The dimensions are discussed in the ranges of 4400 mm < D < 10,000 mm, −arcsin0.6 < φ1 < arcsin0.8, and 0 < θinc < 0.25.
2.2. Prototype of Reactor
Four cylindrical cavity reactors of the same size were fixed on a circle symmetrically as shown in Figure 3. Reactor A underwent reduction which is marked in blue color, and reactors B, C and D underwent oxidation and a recuperating process marked in yellow color. The SM was rotated to shift the concentrated solar spot into different CRRs, in turn, as required. Evaluation of the optical performance of the system with multiple CRRs was not included in this study since it requires detailed information on the geometry, thermal design, and operation of the reactor array.
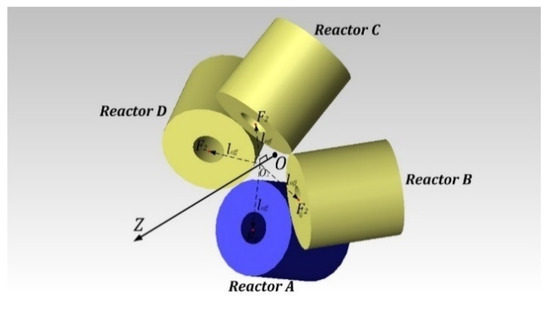
Figure 3.
Sketch of multi-cavity receiver-reactor array. Mechanical configuration is neglected here.
The radius and inclination of the CRR determine its off-axis deviation. The CRR’s height, diameter and inclination, were represented as L, dreactor and θinc, and the minimum of off-axis length, loff = |O⟘F2|, was calculated by Equation (7). In this condition, the configuration had a compact structure with four reactors next to each other. On the other side, the CRRs’ body cannot exceed the boundary of SM’s shadow area (Figure 4), and the maximum of loff was found in the extreme condition Equation (8). Therefore, the constraint was loff,max > loff > loff,min.
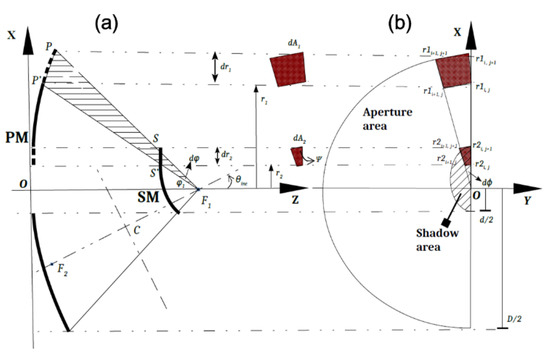
Figure 4.
Geometric model of optical projection of TSD combination in the (a) lateral view and the (b) front view. In (b), the left half side is neglected due to symmetry. (Not to scale).
2.3. Truncated SM
The SM of the TSD is usually designed under the following constraint: the incident sunlight concentrated by the PM should all be reflected by the SM and finally intercepted by the flat target at the focal plane. The SM is initially truncated by the PM cone, which is formed by the outer circle and focal point of the PM. The above constraint is straightforward and can easily be neglected. For a majority of conditions, the optimal shape of the SM can be obtained based on the constraint. However, for some special conditions, especially for the off-axis conditions, the SM needs to be further truncated to improve the optical efficiency.
Figure 4 shows the initial SM, designed under the above constraint, in lateral and front views. Under the ideal condition, beams which strike into point P at the PM’s edge are reflected along the PF1 direction and reach point S at the SM’s edge, as shown in Figure 4a. Figure 4b shows the shadow area of the initial SM. The hyperboloidal function of the SM is given by Equation (5) and the initial boundary is determined by the following equations:
In Equation (9) indicates that all light from the PM reach the SM’s surface. The distance from the SM’s edge curve to z-axis (r2m) depends on the field angle (φ1) and the azimuthal angle (ϕ). The shadow area in Figure 4b, the projection of SM on the OXY plane, is solved by combining Equation (5) and Equation (9). The edge function of the shadow area can be written as r2(φ, ϕ) where φ is the zenithal angle and C1, C2, C3 are three derived coefficients as in Equations (11)–(14). Similarly, r1(φ, ϕ) represents the coordinate in the aperture area of the PM and the edge curve corresponds to r1m = r1(φ1, ϕ) as in Equation (10). The SM is tailored along the value of r2m(ϕ) which equals r2(φ1, ϕ) in the range of 0 ≤ ϕ ≤ 2π. The PM is hollowed, with a circle in the middle, and the diameter (d) equals the minimum of r2m in the whole range of ϕ. Then, the initial design of SM is modeled.
As mentioned above, the initial SM design may not correspond to the optimal solution in some conditions. For instance, as shown in Figure 2e,f, the shadow area of the SM has become too large, which leads to a reduction in optical efficiency. To avoid this detrimental effect, the SM needs to be further truncated to allow more sunlight to reach the PM. A trade-off between the yield, by reducing shadows, and the loss, by generating spillages, is considered here.
In the OXZ plane (Figure 4a), the edge point of the PM moves from P to P’ by rotating SF1 about F1 with a differential dφ, to S’F1. In the OXY plane (Figure 4b), another differential, dϕ, as well as area elements dA1 and dA2, which correspond to the projections of dS1 and dS2, the interfaces between the infinitesimal cone and the PM and the SM (Figure 5), are also shown. dA2 represents the differential increment of the available aperture area of the PM, and dA1 represents the differential decrement of available projection area of the SM. Therefore, the trade-off is regarded as a quantitative comparison between dA1 and dA2 in different zenithal and azimuthal angles. κ is defined as the ratio of dA1 to dA2. Here we use a 3D figure (Figure 5) to illustrate the relationships between different parameters. dr1, dr2, dA1, dA2 and the interior angle of dA2 (ψ), can be all expressed as functions of φ and ϕ as shown in Equations (15)–(20). Note that dr is not equal to the differential of r strictly. The differential of r is defined as ( ), but here dr only represents the partial differential in the direction of φ.
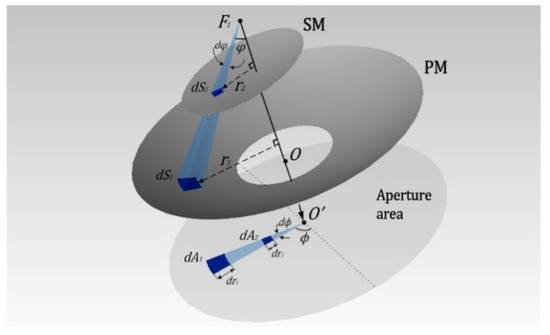
Figure 5.
3D sketch of optical projection of TSD combination.
With given ϕ = ϕo varying from 0 to 2π, the value of κ calculated by Equation (20) was above 1 initially and then decreased gradually when increasing φ. For the majority of cases, κ was over 1 and the initial SM design corresponded to the optimal solution. But for a few cases of κ < 1, the SM needed to be further truncated and we focused on a critical point: κ = 1, as φ = φo (namely r2 = r2o), where the optimal solution was found.
Numerical solutions were obtained using a Matlab© platform. As shown in Figure 4b, the shadow area of the SM was meshed into Nϕ × Nφ blocks along φ and ϕ directions. Nϕ and Nφ was set to 1000 here after balancing between computational accuracy and time cost.
3. Validation
The in-house code used in this paper was updated from [38] considering off-axis SM designs. Buie’s model was used to describe the sun-shape (circumsolar ratio, CSR = 0.05) [39]. Mirror reflectivity was assumed to be 0.935 and the slope error to be 1.3 mrad, according to testing data published by the Australian National University [40]. Tracking and specularity errors were neglected here. After balancing between accuracy and time requirement, 107–108 beams (2, 3 and 8 × 10⁷ rays for D = 4400, 6000, 10,000 mm) were chosen for a Monte-Carlo rays tracing simulation. A flat target with 100% absorbance was used to intercept the concentrated solar irradiation. Validation of the in-house code was conducted against commercial optics software, TracePro®, which is widely used in the area of optical research and applications [41]. Figure 6 shows that the shapes of the focal spots were very similar. An excellent agreement of the local radiant density distributions of two spots was also found in Figure 7. The average relative error was only ~3.73%. Thus, the validity of this in-house code was proven.
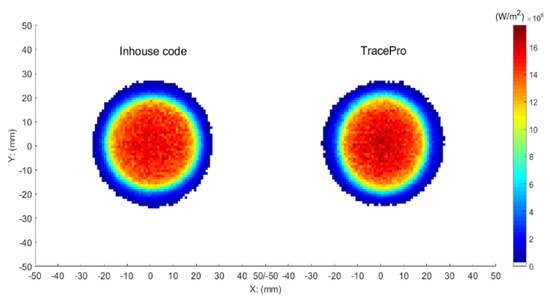
Figure 6.
Focal spot simulated by in-house code in Matlab and by TracePro®.
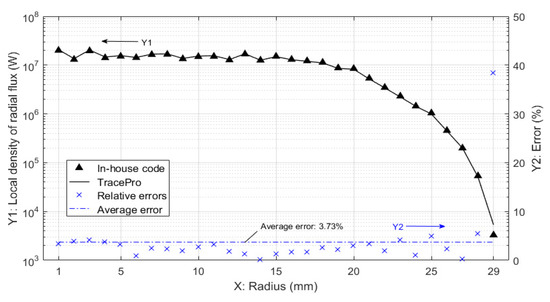
Figure 7.
Comparison of local density distributions of spots simulated by TracePro® and in-house code.
4. Results and Discussion
Two main cases are of interest in this study. Firstly, the parametric optimization of the TSD is considered over the whole region. Secondly, main performance parameters including intercepted radiant flux (Q), concentration ratio (C) and efficiency (η) are discussed in different scales of the TSD and different off-axis degrees of the SM.
Figure 8a–e illustrates results of optical efficiency (η) vs. independent variable NA2 = sin φ2, with respect to five different φ1s when D = 6000 mm, C = 3000. η is defined as the percentage of intercepted radiant flux on the receiving target over the total incident flux, and C is the ratio of average intercepted radiation density to the direct normal irradiation (DNI). Solid lines in different colors represent results regarding the original SM design with respect to different θincs varying from 0 to 0.25 rads, and dotted lines represent results regarding the optimal truncated SM design. There was no difference between optimal and original cases for φ1 < π/2 rad as shown in Figure 8a,b. For φ1 ≥ π/2 (Figure 8c–e), differences were found when θinc and NA2 increase to a certain level. The optical efficiencies of optimal cases (ηopm) were improved compared to the original cases (ηorg) in the range of arcsin 0.6 ≤ φ1 ≤ (π−arcsin 0.6) rads. For different φ1s, the peak values of η appeared in the range of 0.4 ≤ NA2 ≤ 0.6. The maximum η of 73.3% was obtained when φ1 = π−arcsin 0.8 rad, NA2 = 0.5, and θinc = 0. Optimal η in different inclination levels were found at φ1 = π/2 rad, NA2 = 0.5 for θinc > 0.1 (Figure 8c) and at φ1 = π−arcsin 0.8 rad, NA2 = 0.5 for θinc < 0.1 (Figure 8d). Figure 8f shows the off-axis length (loff) vs. the field angle of PM (φ1) and inclination angle of SM (θinc). loff increased linearly when increasing φ1 or θinc.
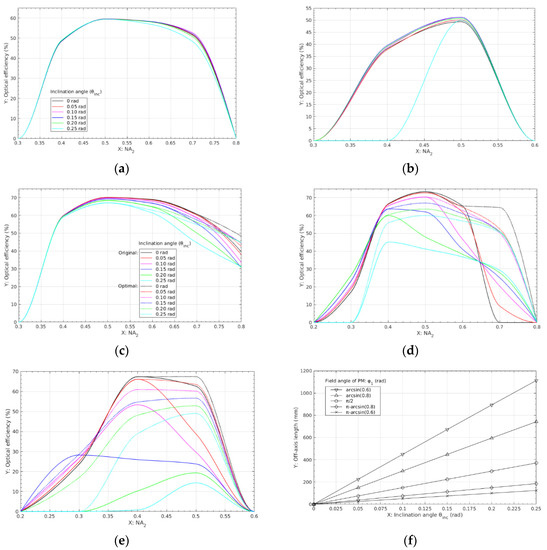
Figure 8.
(a–e) Results of optical efficiency vs. the field angle of the PM (=arcsin 0.6, arcsin 0.8, π/2, π-arcsin 0.8, π-arcsin 0.6 rads) corresponding to original and optimal designs, with C = 3000, D = 6000 mm; (f) Off-axis length vs. inclination angle in different field angle of PM with D = 6000 mm.
The concentrating ratio (C), and corresponding optical efficiency (η), are discussed under the same condition of intercept factor IF = 0.9 with D = 6000 mm, as shown in Figure 9a–c and Figure 9d–f, respectively. Here IF is defined as the ratio of the rays eventually utilized to those reaching the flat target. Similar to Figure 8a–e and Figure 9b,c,e,f show that the results of C and η regarding the optimal design can be above the original design when φ1 ≥ π/2 rad and the advantage is also enhanced as θinc increases. Overall, C increase to a peak value and then dropped down when increasing NA2. For the original cases, Figure 9a–c shows that the peak values of C = 2645, 3362 and 3376, were obtained at NA2/θinc = 0.7/0.2 rad, 0.6/0, and 0.6/0, corresponding to three patterns: φ1 = arcsin 0.8, π/2, π−arcsin 0.8 rads, respectively. A similar trend was found in the curves of η vs. NA2 (Figure 9d–f) where all peak values of η were obtained at NA2 = 0.4 and θinc = 0. The maxima for the three patterns were 69.5%, 74.0%, 75.0%. The peak values of C and η both declined when increasing θinc, especially for φ1 ≥ π−arcsin 0.8 rad. By contrast for the optimal cases, they remained at relatively high level as θinc increased, which were ~3300 and ≥53.9% for φ1 = π/2 rad (Figure 9b,e) and 3000–4300 and ≥50.3% for φ1 = π−arcsin 0.8 rad (Figure 9c,f), in the whole range of 0 < θinc < 0.25 rads. The peak values of C and η were found at NA2 = 0.7 and 0.4, respectively. This is advantageous to achieve a good optical performance when a large θinc is required. Parametric settings mainly depended on the requirement of C and θinc in real conditions. For example, the optimal parameters of φ1 and NA2 should be set to π−arcsin 0.8 rad and 0.7 for a large C (≥3500) and a small θinc (≤0.05 rad). The optimal φ1 would change to π/2 rad if large C and θinc were required at the same time.
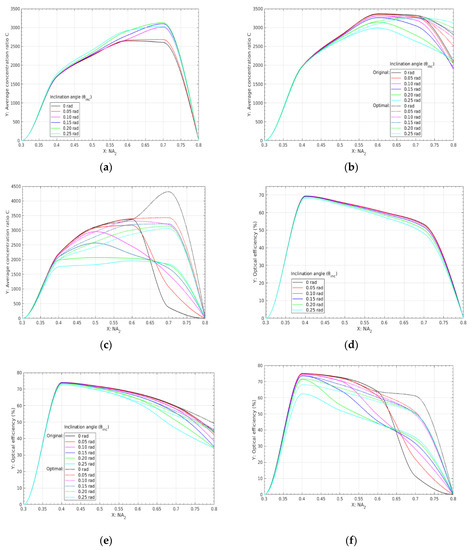
Figure 9.
Results of concentration ratio (C) (a–c) and optical efficiency (η) (d–f) vs. the field angle of the primary mirror (PM) (=arcsin 0.8, π/2, π−arcsin 0.8 rads) corresponding to original and optimal designs, with IF = 0.9, D = 6000 mm.
For different thermochemical applications, different levels of C are required. Figure 10 illustrates η as function of C when θinc = (a) 0.05, (b) 0.1, (c) 0.15 and (d) 0.2 rads, respectively. According to the above results, for achieving the largest η the best solutions are found between pattern one: φ1 = π/2 rad and pattern two: φ1 = π−arcsin 0.8 rad, in the range of 0.4 ≤ NA2 ≤ 0.6. For the same θinc, η drops gradually down when increasing C, and the pattern of the best solution depends on the range of C. For instance, as shown in Figure 10b, the best solutions of θinc = 0.1 were obtained by pattern two at NA2 = 0.4 when C ≤ 2170 (Region 1), pattern two at NA2 = 0.5 when 2170 < C ≤ 4080 (Region 2) and pattern one at NA2 = 0.5 when C > 4080 (Region 3), respectively. The whole range of C can, therefore, be separated into three regions. For different θinc values, the regions are different. For θinc = 0.05 rad as an example (Figure 10a), the three regions are C ≤ 1900, 1900 < C ≤ 4770, and C > 4770, and the three best solutions correspond to pattern two at NA2 = 0.4, pattern two at NA2 = 0.5, and pattern one at NA2 = 0.6. As θinc increased to 0.15 rad (Figure 10c), the three best solutions and regions changed to pattern two at NA2 = 0.4, pattern one at NA2 = 0.5, pattern one at NA2 = 0.6, and C ≤ 1940, 1940 < C ≤ 3690, C > 3690.
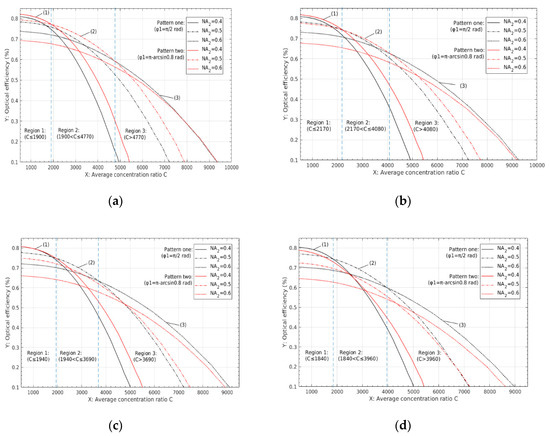
Figure 10.
Results of optimal efficiency (ηopm) vs. variable of average concentration ratio (C) with respect to optimal patterns: φ1 = π−arcsin 0.8 rad and π/2 rad, when 0.4 ≤ NA2 ≤ 0.6. (a–d) show four cases of different inclination angles (θinc) respective to 0.05, 0.1, 0.15, 0.2 rads. In each figure, (1), (2), (3) represent the best solutions for region 1, region 2, region 3, respectively.
The scale of the configuration mainly effect spots’ sizes (R) and intercepted radiant fluxes (Q). For each D, the total amount of irradiation incident is fixed. Thus, maximum Q can be obtained with the best solutions. Figure 11 shows Q as a function of C for three scales, D = 4400, 6000, 10,000 mms. Four cases of θinc = 0.05, 0.1, 0.15, 0.2 rads are considered. This can be used to guide design and scale the up/down processes. For example, to build a full-scale configuration with the conditions C~2500, Q~55 kW, loff > 120 mm, key parameters such as θinc, D, should be fixed first. According to the relationship given by Figure 8f and Figure 11, θinc and D are set to 0.1 rad and 10,000 mm, respectively. Meanwhile, the best solution is found at φ1 = π−arcsin 0.8 rad, NA2 = 0.5 (Figure 10b). Finally, the results were assessed in Figure 11b: C = 2500, Q = 56.8 kW, η = 73.0%.
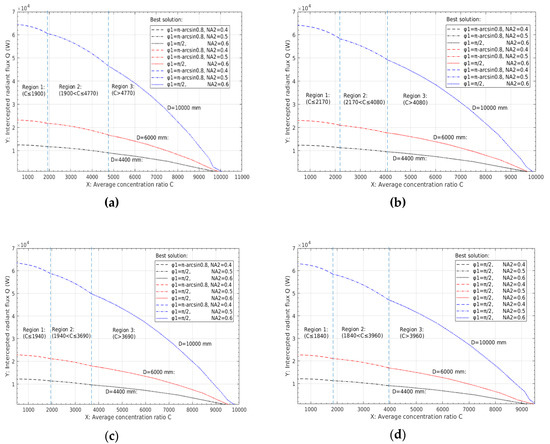
Figure 11.
Results of intercepted radiant flux (Q) vs. variable of average concentration ratio (C) based on the best solutions in scales of D = 4400, 6000, 10,000 mms when θinc = (a) 0.05, (b) 0.1, (c) 0.15, and (d) 0.2 rads.
5. Conclusions
A novel concept of a paraboloidal dish combined with an off-axis hyperboloidal reflector was proposed for two-step thermochemical reactions. It consisted of a fixed primary mirror (PM) and a rotary secondary mirror (SM). An in-house code based on the Monte Carlo rays tracing method was developed for simulating the optical system. A mathematical model was developed to find optimal parameters of the optical configurations for different off-axis conditions. Optimizations of the design were conducted, and the main results in different conditions were discussed. The key conclusions are as follows:
- (1)
- A new concept of a two stage dish concentrator is proposed to achieve successive thermochemical solar fuel production, consisting of a conventional paraboloid dish and a unique off-axis rotary secondary hyperboloid reflector;
- (2)
- The shape of the SM is optimized by a new mathematical model. Compared to the original design, the optical performance can further be improved by using an optimal truncated SM in off-axis conditions. This helps to achieve a good optical performance, when a large inclination angle is required;
- (3)
- The best solutions corresponding to the largest optical efficiencies fall in the ranges of π/2 ≤ φ1 ≤ (π − arcsin 0.8) rads, and 0.4 ≤ NA2 ≤ 0.6, which may vary with the concentration ratio and inclination angle. The scale of the configurations had no effect on the results except for the intercepted radiant flux. This characteristic makes the scale up/down calculation much easier.
The novelty of the rotatory SM is promising and not limited to the dish system. Using it in a beam-down system would be worthy for further research. The content of the reactor design not considered in this paper will be considered in future work.
Author Contributions
Writing—original draft, S.Y.; Supervision—review & editing, J.W.; Supervision—review, P.D.L. All authors have read and agreed to the published version of the manuscript.
Funding
This work was funded by the National Science Foundation of China (No. 51736006) as well as the Scientific Research Foundation of Graduate School of Southeast University.
Acknowledgments
The authors gratefully acknowledge the fruitful discussions and advice from Wojciech Lipiński.
Conflicts of Interest
The authors declare no conflict of interest.
References
- Blanco, M.; Santigosa, L.R. Advances in Concentrating Solar Thermal Research and Technology; Woodhead: Cambridge, UK, 2016. [Google Scholar] [CrossRef]
- Lipiński, W.; Davidson, J.; Haussener, S.; Klausner, J.; Mehdizadeh, A.; Petrasch, J.; Steinfeld, A.; Venstrom, L. Review of heat transfer research for solar thermochemical applications. J. Therm. Sci. Eng. Appl. 2013, 5, 021005. [Google Scholar] [CrossRef]
- Meier, A.; Steinfeld, A. Solar thermochemical production of fuels, Advances in Science and Technology. Adv. Sci. Technol. 2010. [Google Scholar] [CrossRef]
- Kodama, T.; Gokon, N. Thermochemical cycles for high-temperature solar hydrogen production. Chem. Rev. 2007, 107, 4048–4077. [Google Scholar] [CrossRef] [PubMed]
- Romero, M.; Steinfeld, A. Concentrating solar thermal power and thermochemical fuels. Energy Environ. Sci. 2012, 5, 9234–9245. [Google Scholar] [CrossRef]
- Scheffe, J.R.; Steinfeld, A. Oxygen exchange materials for solar thermochemical splitting of H2O and CO2: A review. Mater. Today 2014, 17, 341–348. [Google Scholar] [CrossRef]
- Bader, R.; Chandran, R.B.; Venstrom, L.J.; Sedler, S.J.; Krenzke, P.T.; De Smith, R.M.; Banerjee, A.; Chase, T.R.; Davidson, J.H.; Lipiński, W. Design of a solar reactor to split CO2 via isothermal redox cycling of ceria. J. Sol. Energy Eng. 2015, 137, 031007. [Google Scholar] [CrossRef]
- Steinfeld, A. Solar hydrogen production via a two-step water-splitting thermochemical cycle based on Zn/ZnO redox reactions. Int. J. Hydrogen Energy 2002, 27, 611–619. [Google Scholar] [CrossRef]
- Perkins, C.; Lichty, P.R.; Weimer, A.W. Thermal ZnO dissociation in a rapid aerosol reactor as part of a solar hydrogen production cycle. Int. J. Hydrogen Energy 2008, 33, 499–510. [Google Scholar] [CrossRef]
- Loutzenhiser, P.G.; Meier, A.; Steinfeld, A. Review of the two-step H2O/CO2-splitting solar thermochemical cycle based on Zn/ZnO redox reactions. Materials 2010, 3, 4922–4938. [Google Scholar] [CrossRef]
- Abanades, S.; Charvin, P.; Lemont, F.; Flamant, G. Novel two-step SnO2/SnO water-splitting cycle for solar thermochemical production of hydrogen. Int. J. Hydrogen Energy 2008, 33, 6021–6030. [Google Scholar] [CrossRef]
- Kodama, T.; Kondoh, Y.; Yamamoto, R.; Andou, H.; Satou, N. Thermochemical hydrogen production by a redox system of ZrO2-supported Co (II)-ferrite. Sol. Energy 2005, 78, 623–631. [Google Scholar] [CrossRef]
- Scheffe, J.R.; McDaniel, A.H.; Allendorf, M.D.; Weimer, A.W. Kinetics and mechanism of solar-thermochemical H2 production by oxidation of a cobalt ferrite–zirconia composite. Energy Environ. Sci. 2013, 6, 963–973. [Google Scholar] [CrossRef]
- Allendorf, M.D.; Diver, R.B.; Siegel, N.P.; Miller, J.E. Two-step water splitting using mixed-metal ferrites: Thermodynamic analysis and characterization of synthesized materials. Energy Fuels 2008, 22, 4115–4124. [Google Scholar] [CrossRef]
- Chueh, W.C.; Haile, S.M. A thermochemical study of ceria: Exploiting an old material for new modes of energy conversion and CO2 mitigation. Philos. Trans. R. Soc. Lond. A Math. Phys. Eng. Sci. 2010, 368, 3269–3294. [Google Scholar] [CrossRef] [PubMed]
- Furler, P.; Scheffe, J.; Gorbar, M.; Moes, L.; Vogt, U.; Steinfeld, A. Solar thermochemical CO2 splitting utilizing a reticulated porous ceria redox system. Energy Fuels 2012, 26, 7051–7059. [Google Scholar] [CrossRef]
- Hao, Y.; Yang, C.-K.; Haile, S.M. High-temperature isothermal chemical cycling for solar-driven fuel production. Phys. Chem. Chem. Phys. 2013, 15, 17084–17092. [Google Scholar] [CrossRef]
- McDaniel, A.H.; Miller, E.C.; Arifin, D.; Ambrosini, A.; Coker, E.N.; O’Hayre, R.; Chueh, W.C.; Tong, J. Sr-and Mn-doped LaAlO 3−δ for solar thermochemical H2 and CO production. Energy Environ. Sci. 2013, 6, 2424–2428. [Google Scholar] [CrossRef]
- Scheffe, J.R.; Weibel, D.; Steinfeld, A. Lanthanum–strontium–manganese perovskites as redox materials for solar thermochemical splitting of H2O and CO2. Energy Fuels 2013, 27, 4250–4257. [Google Scholar] [CrossRef]
- Mogensen, M.; Sammes, N.M.; Tompsett, G.A. Physical, chemical and electrochemical properties of pure and doped ceria. Solid State Ionics 2000, 129, 63–94. [Google Scholar] [CrossRef]
- Coker, E.N.; Ohlhausen, J.A.; Ambrosini, A.; Miller, J.E. Oxygen transport and isotopic exchange in iron oxide/YSZ thermochemically-active materials via splitting of C (18O)2 at high temperature studied by thermogravimetric analysis and secondary ion mass spectrometry. J. Mater. Chem. 2012, 22, 6726–6732. [Google Scholar] [CrossRef]
- Diver, R.B.; Miller, J.E.; Siegel, N.P.; Moss, T.A. Testing of a CR5 solar thermochemical heat engine prototype. ASME Paper 2010. [Google Scholar] [CrossRef]
- Furler, P.; Scheffe, J.R.; Steinfeld, A. Syngas production by simultaneous splitting of H2O and CO2 via ceria redox reactions in a high-temperature solar reactor. Energy Environ. Sci. 2012, 5, 6098–6103. [Google Scholar] [CrossRef]
- Ermanoski, I.; Siegel, N.P.; Stechel, E.B. A new reactor concept for efficient solar-thermochemical fuel production. J. Sol. Energy Eng. 2013, 135, 031002. [Google Scholar] [CrossRef]
- Lapp, J.; Davidson, J.H.; LipiĹ, W. Heat transfer analysis of a solid-solid heat recuperation system for solar-driven nonstoichiometric redox cycles. J. Sol. Energy Eng. 2013, 135, 031004. [Google Scholar] [CrossRef]
- Muhich, C.L.; Ehrhart, B.D.; Al-Shankiti, I.; Ward, B.J.; Musgrave, C.B.; Weimer, A.W. A review and perspective of efficient hydrogen generation via solar thermal water splitting. Wiley Interdiscip. Rev. Energy Environ. 2016, 5, 261–287. [Google Scholar] [CrossRef]
- Dähler, F.; Wild, M.; Schäppi, R.; Haueter, P.; Cooper, T.; Furler, P.; Steinfeld, A. A High-Flux Solar Parabolic Dish System for Continuous Thermochemical Fuel Production. Optics for Solar Energy; Optical Society of America: Boulder, CO, USA, 2017. [Google Scholar] [CrossRef]
- Rabl, A. Comparison of solar concentrators. Sol. Energy 1976, 18, 93–111. [Google Scholar] [CrossRef]
- Mauk, C.E.; Prengle, H.W.; Sun, E.C.-H. Optical and thermal analysis of a Cassegrainian solar concentrator. Sol. Energy 1979, 23, 157–167. [Google Scholar] [CrossRef]
- Zhang, Y.; Xiao, G.; Luo, Z.; Ni, M.; Yang, T.; Xu, W. Comparison of different types of secondary mirrors for solar application. Opt. Int. J. Light Electron Opt. 2014, 125, 1106–1112. [Google Scholar] [CrossRef]
- De la Mora, M.; Jaramillo, O.; Nava, R.; Tagüeña-Martínez, J.; del Río, J. Viability study of porous silicon photonic mirrors as secondary reflectors for solar concentration systems. Sol. Energy Mater. Sol. Cells 2009, 93, 1218–1224. [Google Scholar] [CrossRef]
- Feuermann, D.; Gordon, J.M. High-concentration photovoltaic designs based on miniature parabolic dishes. Sol. Energy 2001, 70, 423–430. [Google Scholar] [CrossRef]
- Segal, A.; Epstein, M. The optics of the solar tower reflector. Sol. Energy 2001, 69, 229–241. [Google Scholar] [CrossRef]
- Kribus, A.; Zaibel, R.; Segal, A. Extension of the hermite expansion method for cassegrainian solar central receiver systems. Sol. Energy 1998, 63, 337–343. [Google Scholar] [CrossRef]
- Feuermann, D.; Gordon, J.; Ries, H. High-flux solar concentration with imaging designs. Sol. Energy 1999, 65, 83–89. [Google Scholar] [CrossRef]
- Jiang, S.; Hu, P.; Mo, S.; Chen, Z. Optical modeling for a two-stage parabolic trough concentrating photovoltaic/thermal system using spectral beam splitting technology. Sol. Energy Mater. Sol. Cells 2010, 94, 1686–1696. [Google Scholar] [CrossRef]
- Wang, J.; Yang, S.; Jiang, C.; Yan, Q.; Lund, P.D. A novel 2-stage dish concentrator with improved optical performance for concentrating solar power plants. Renew. Energy 2017, 108, 92–97. [Google Scholar] [CrossRef]
- Yang, S.; Wang, J.; Lund, P.D.; Jiang, C. Assessing the impact of optical errors in a novel 2-stage dish concentrator using Monte-Carlo ray-tracing simulation. Renew. Energy 2018. [Google Scholar] [CrossRef]
- Buie, D.; Monger, A.; Dey, C. Sunshape distributions for terrestrial solar simulations. Sol. Energy 2003, 74, 113–122. [Google Scholar] [CrossRef]
- Lovegrove, K.; Burgess, G.; Pye, J. A new 500 m2 paraboloidal dish solar concentrator. Sol. Energy 2011, 85, 620–626. [Google Scholar] [CrossRef]
- Paitoonsurikarn, S.; Lovegrove, K. A new correlation for predicting the free convection loss from solar dish concentrating receivers. In Proceedings of the 44th Conference of the Australia and New Zealand Solar Energy Society, Canberra, Australia, 9–10 September 2006; Available online: http://hdl.handle.net/1885/38632 (accessed on 6 July 2020).


© 2020 by the authors. Licensee MDPI, Basel, Switzerland. This article is an open access article distributed under the terms and conditions of the Creative Commons Attribution (CC BY) license (http://creativecommons.org/licenses/by/4.0/).