Dynamic Simulation and Thermoeconomic Analysis of a Trigeneration System in a Hospital Application

 , , ,
, , ,
Abstract
:1. Introduction
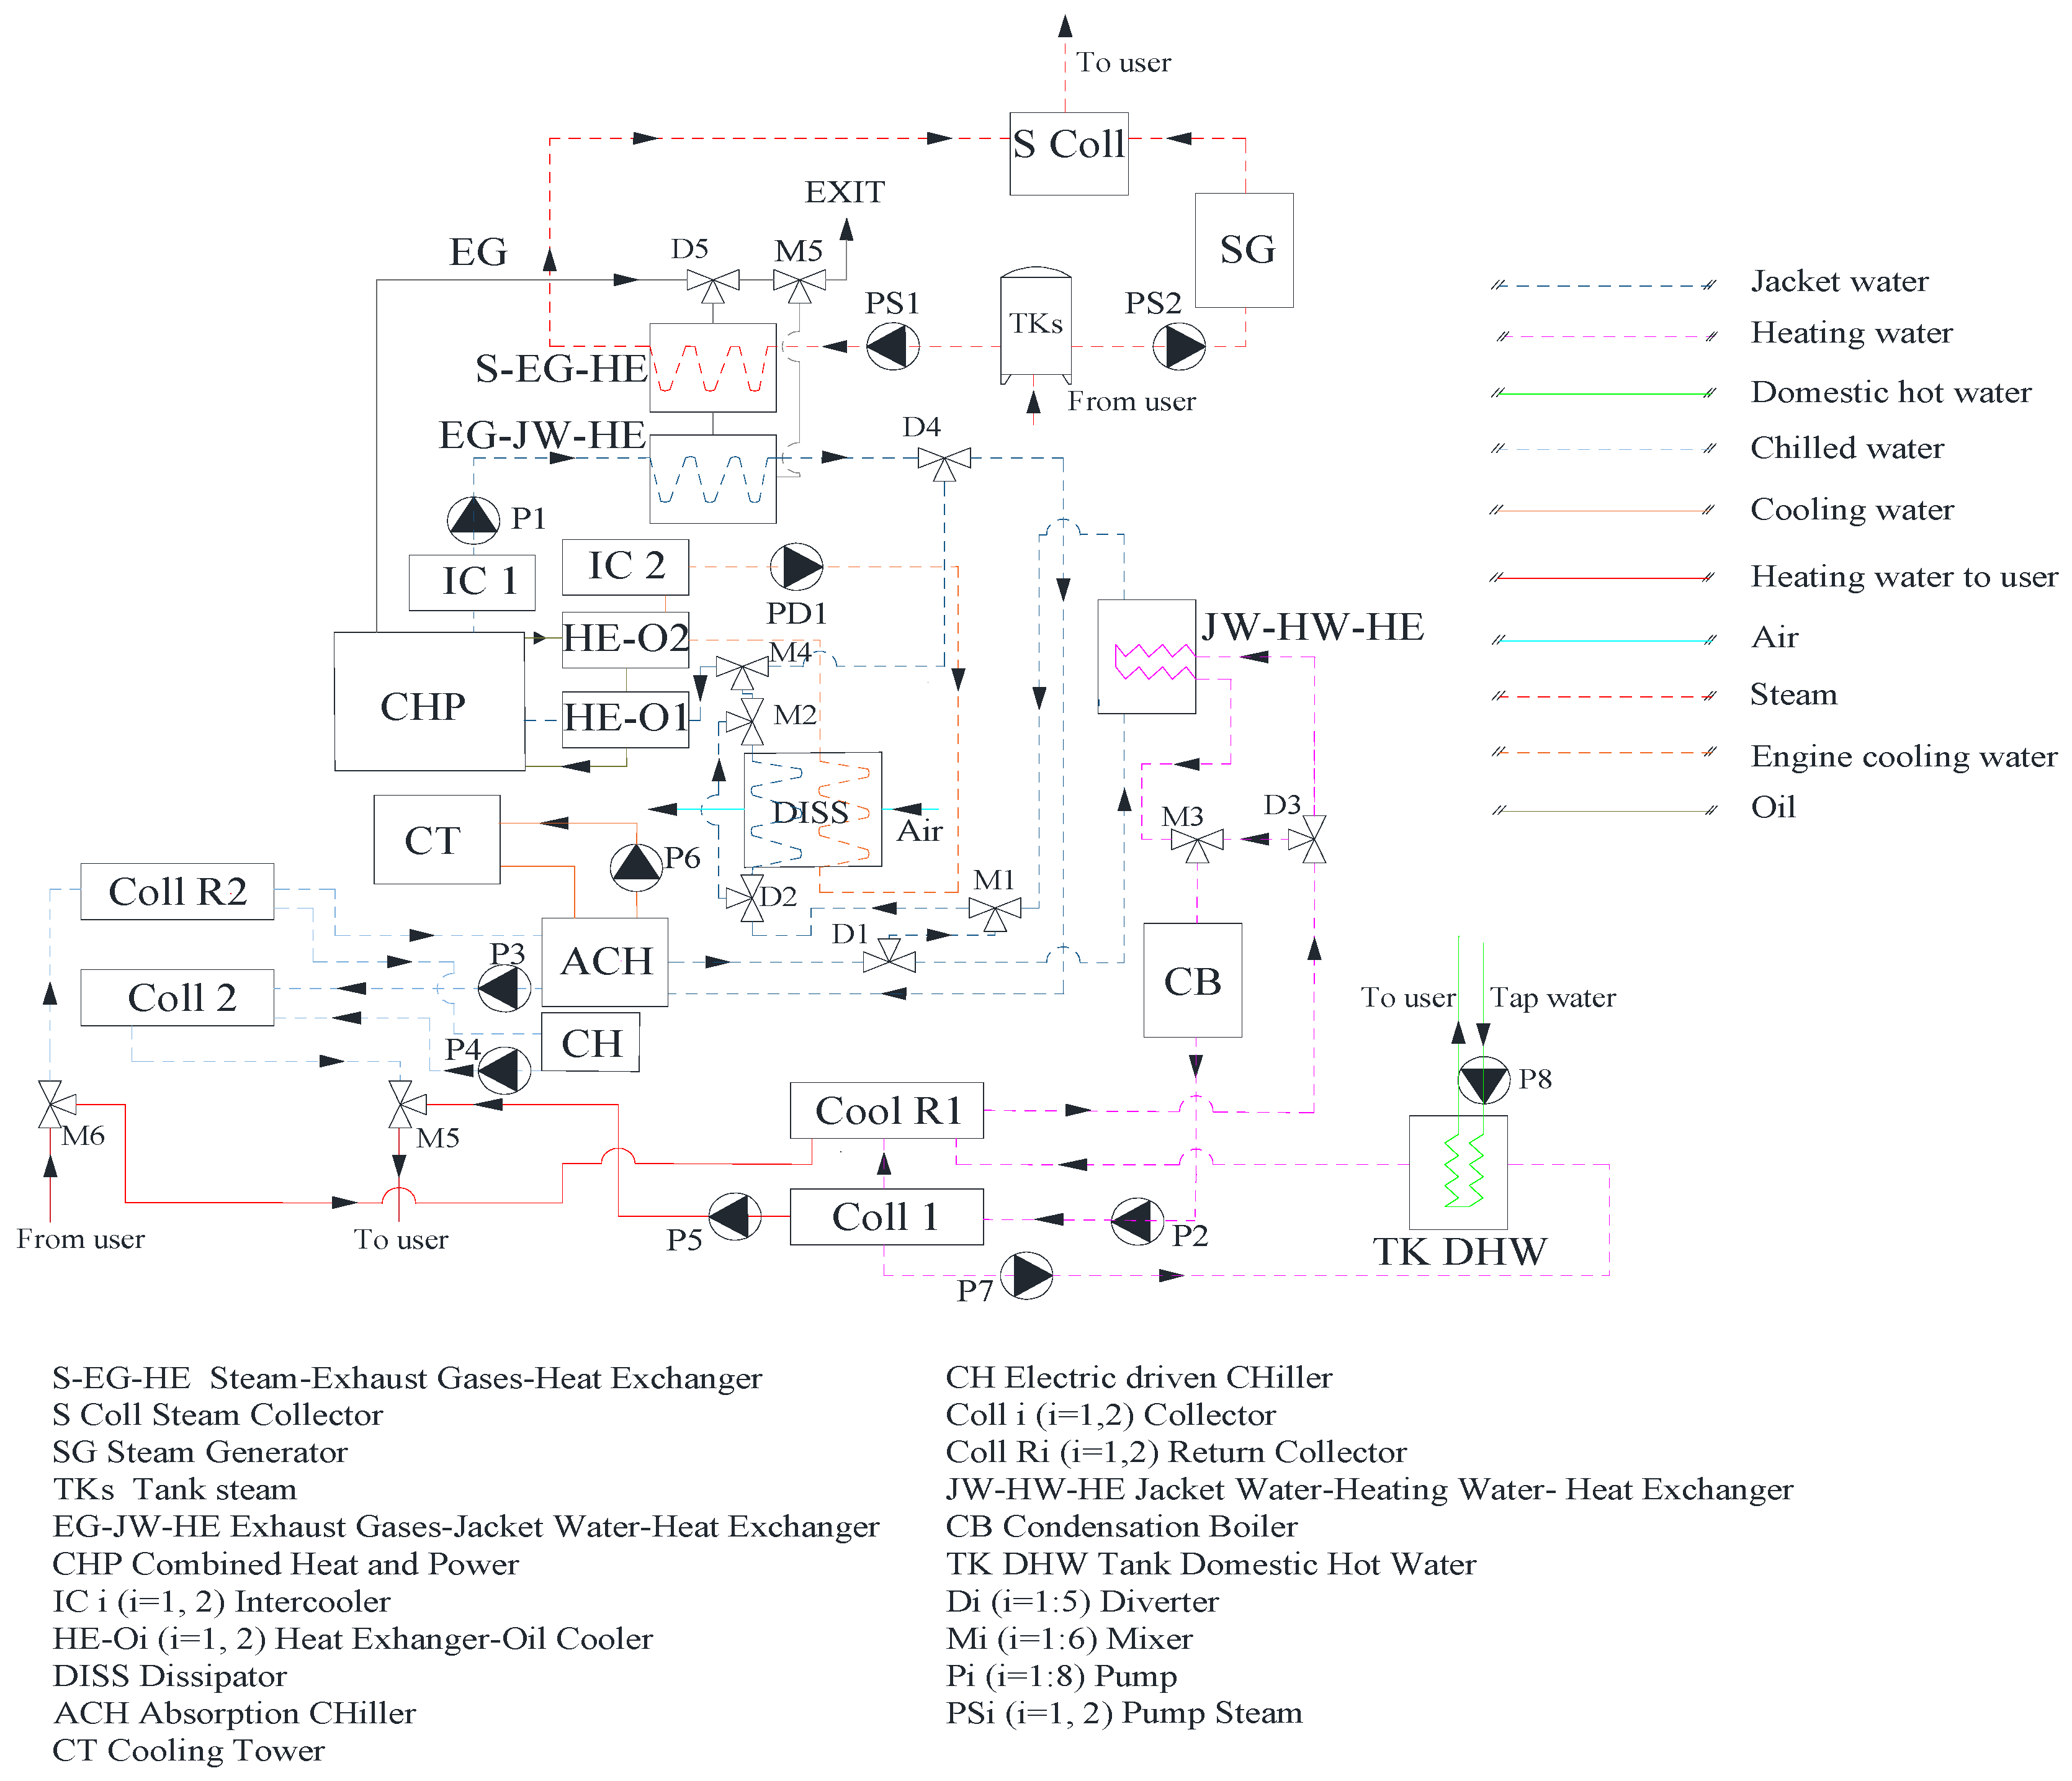
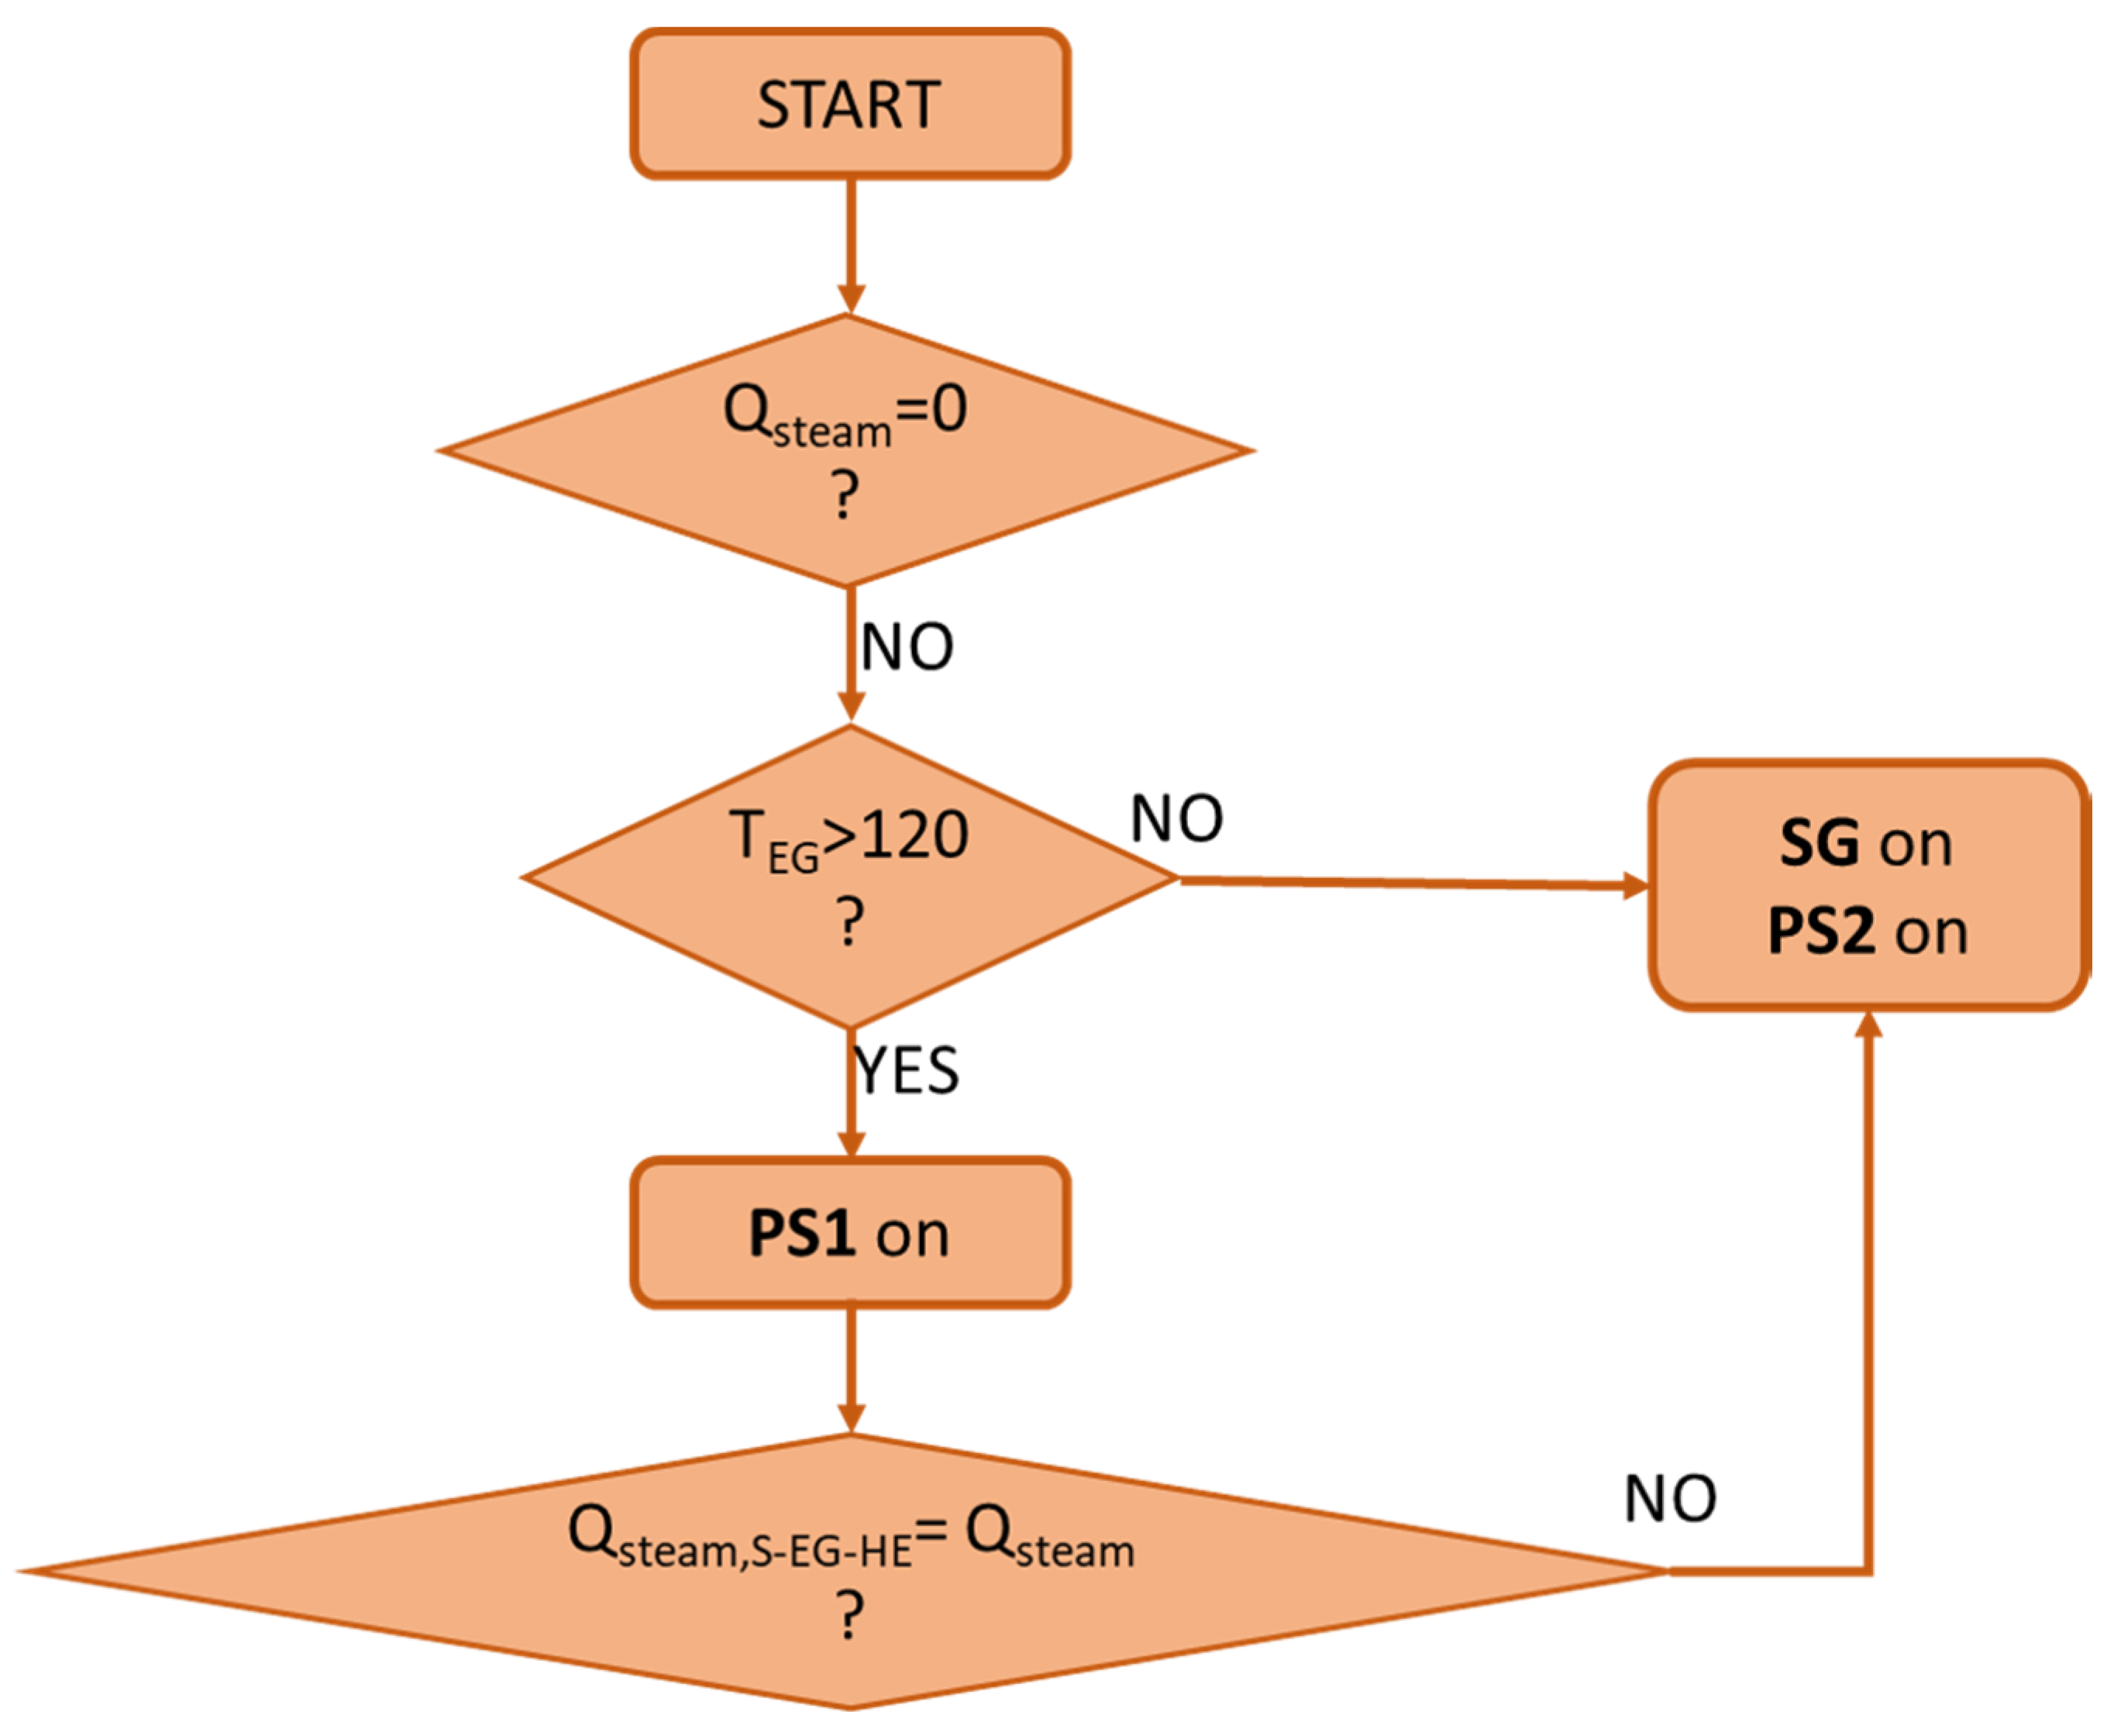
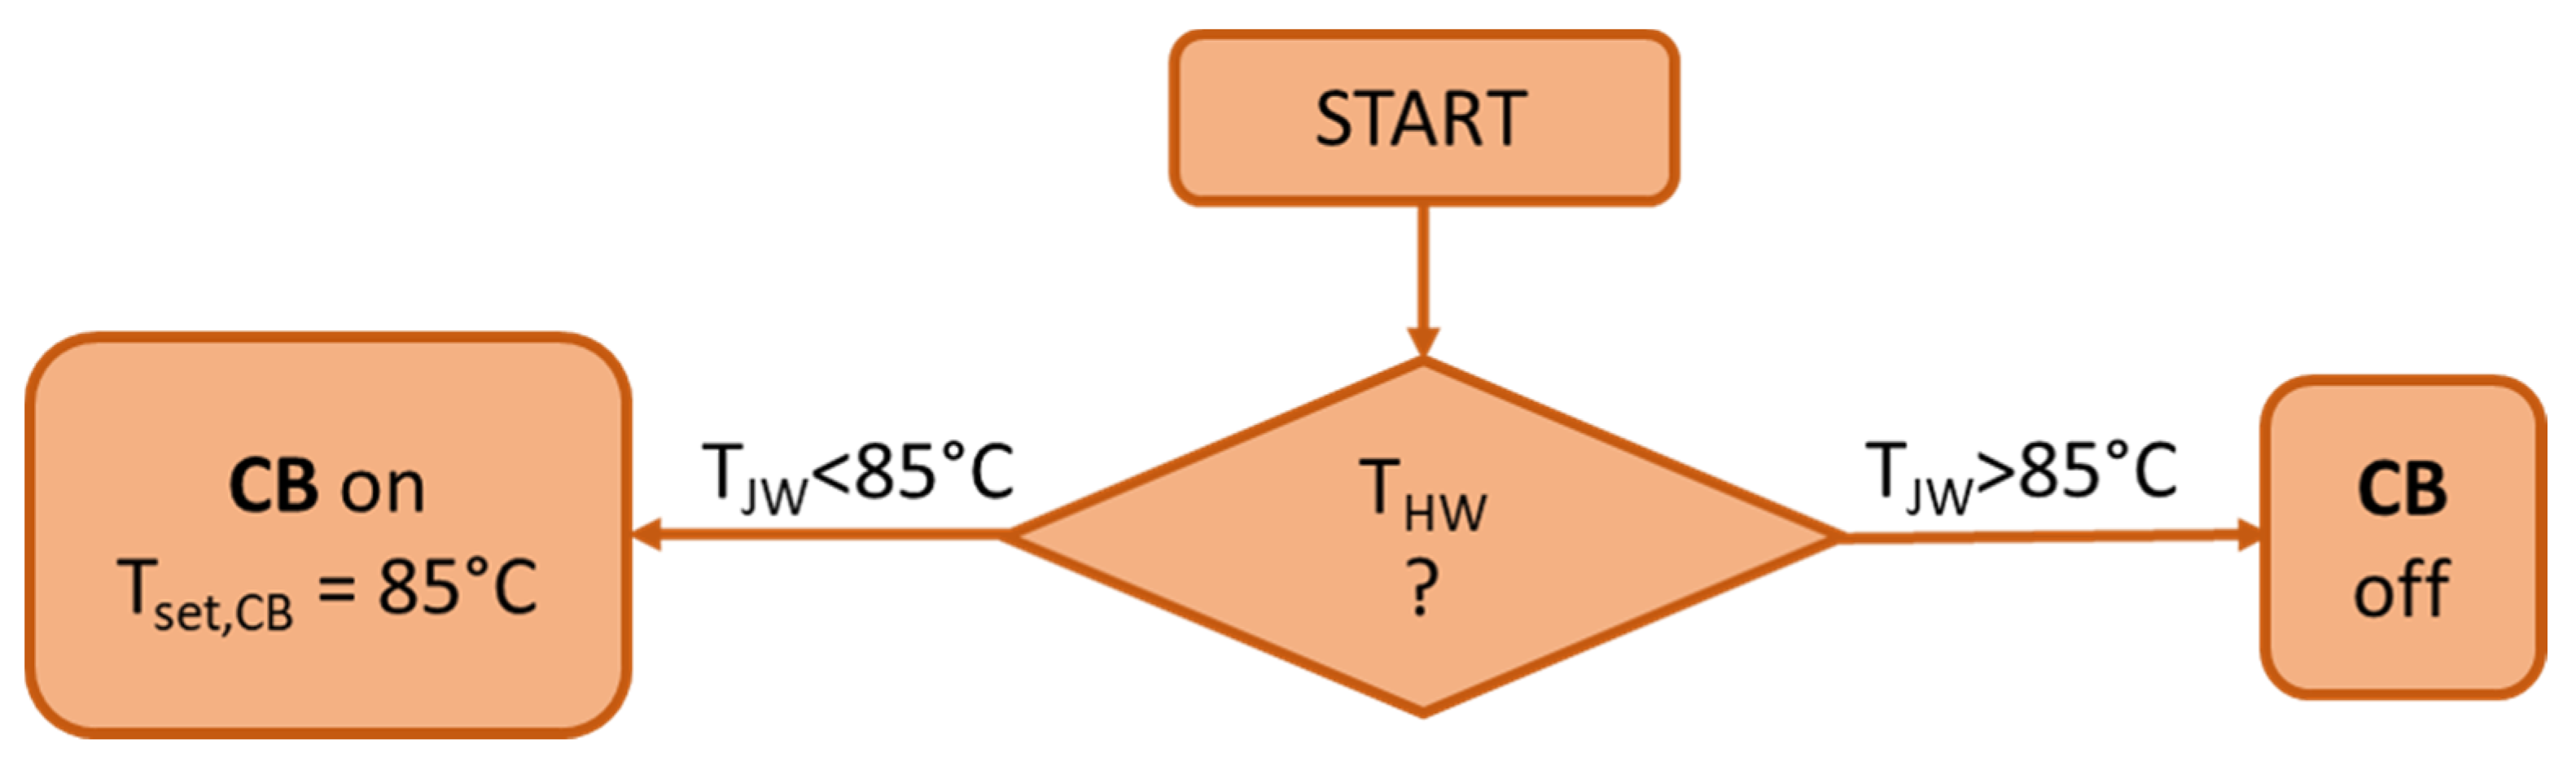
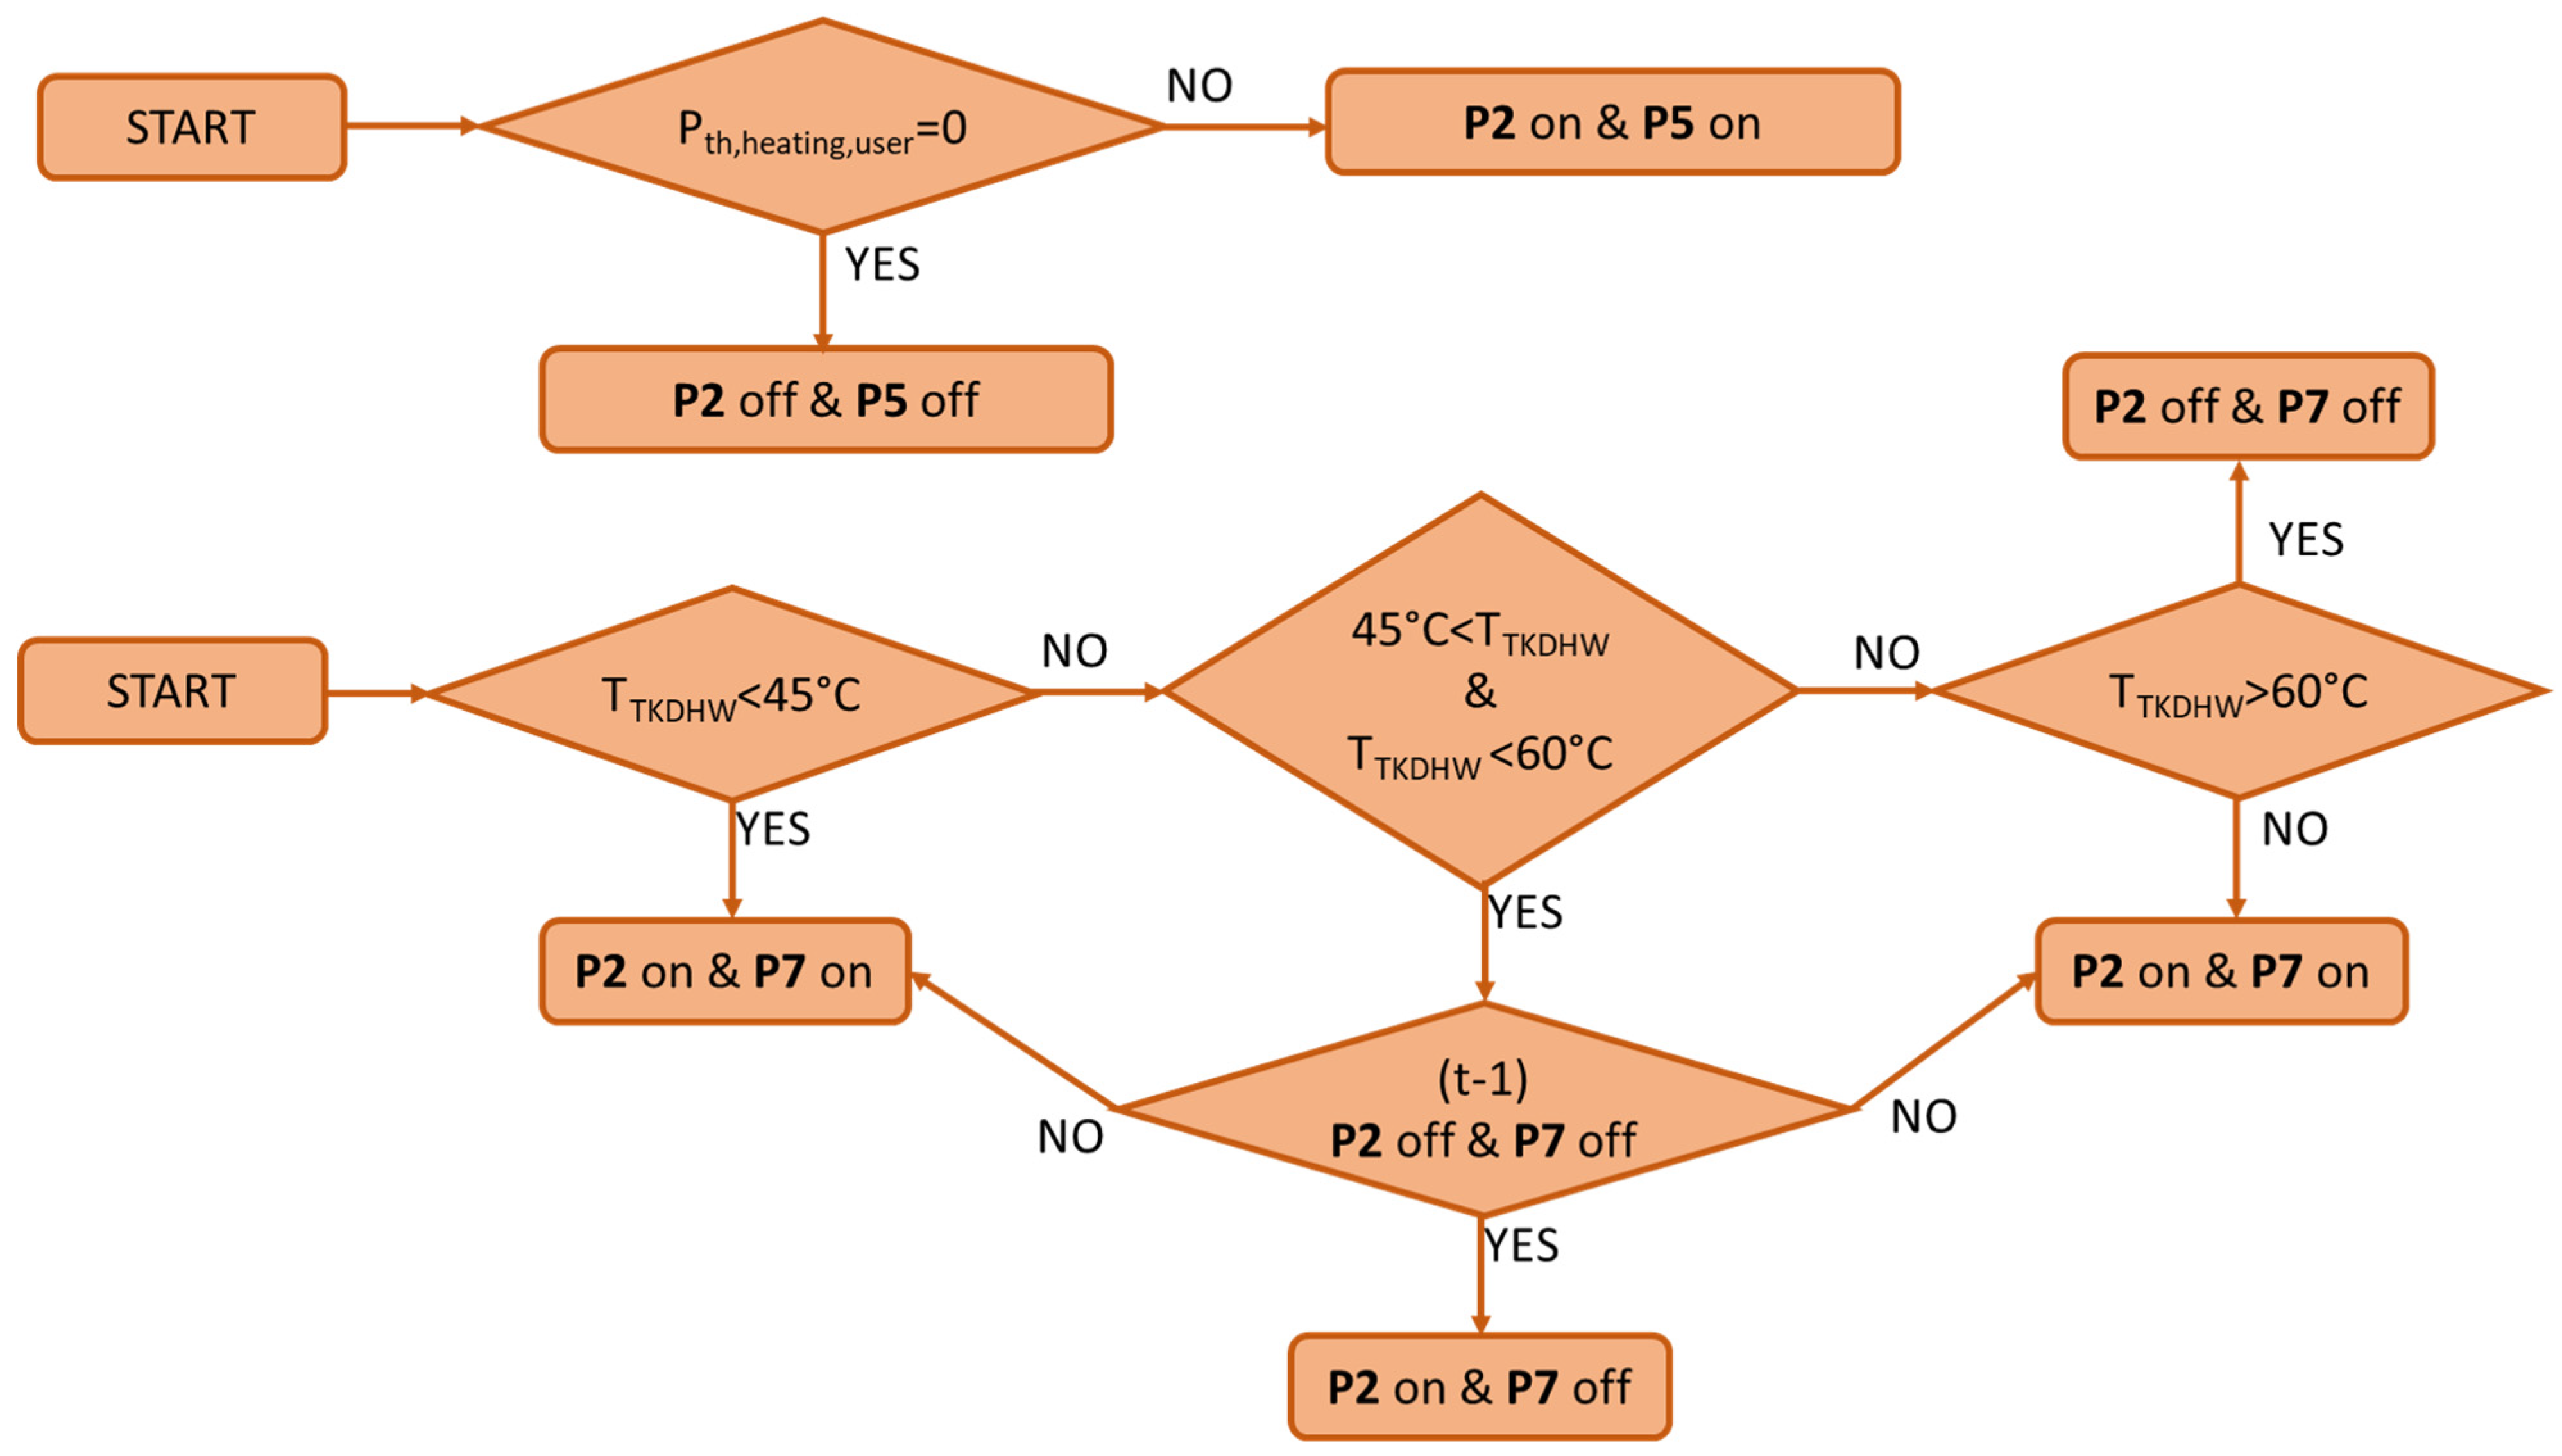
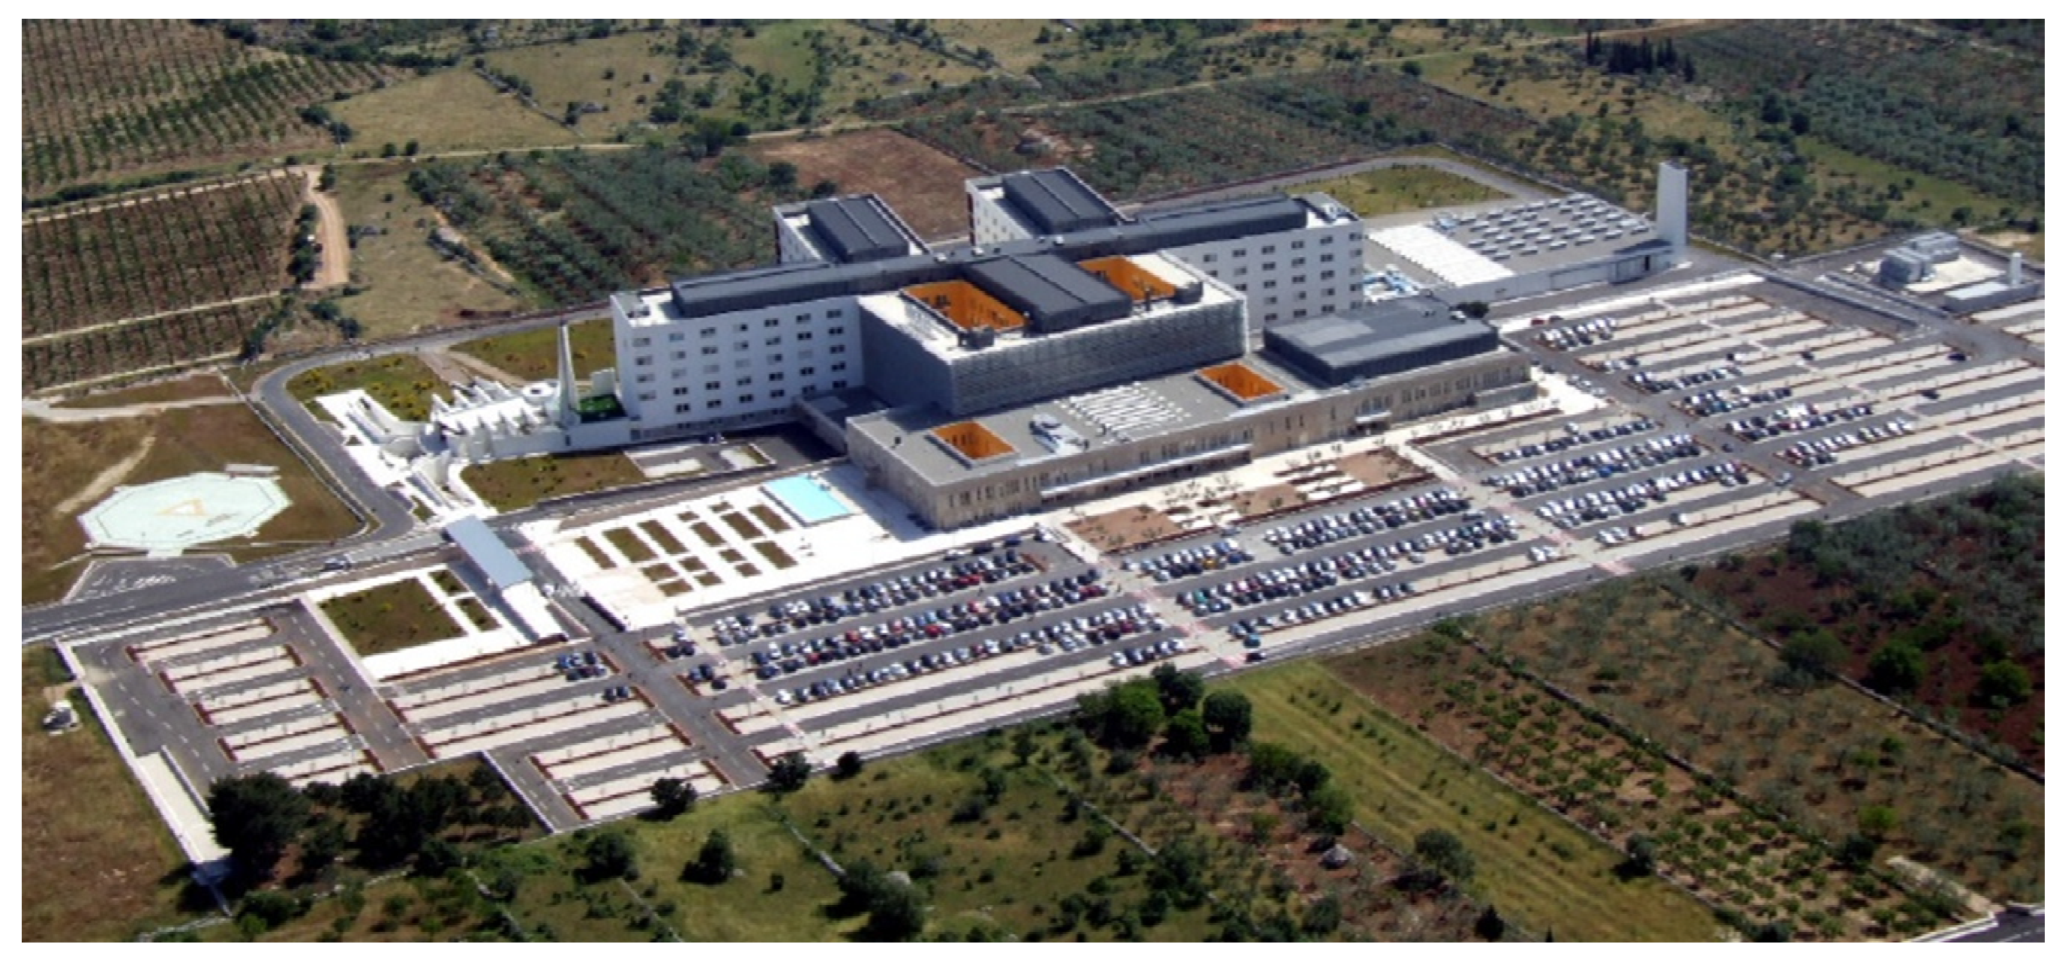
2. Plant Layout
3. Simulation Model
- Type 56: this library dynamically models the energy performance of the building considering its 3D geometry, thermophysical proprieties of the envelope, dynamic weather conditions (i.e., solar radiation, ambient temperature, wind velocity, relative humidity, etc.); further details are available in Ref. [21].
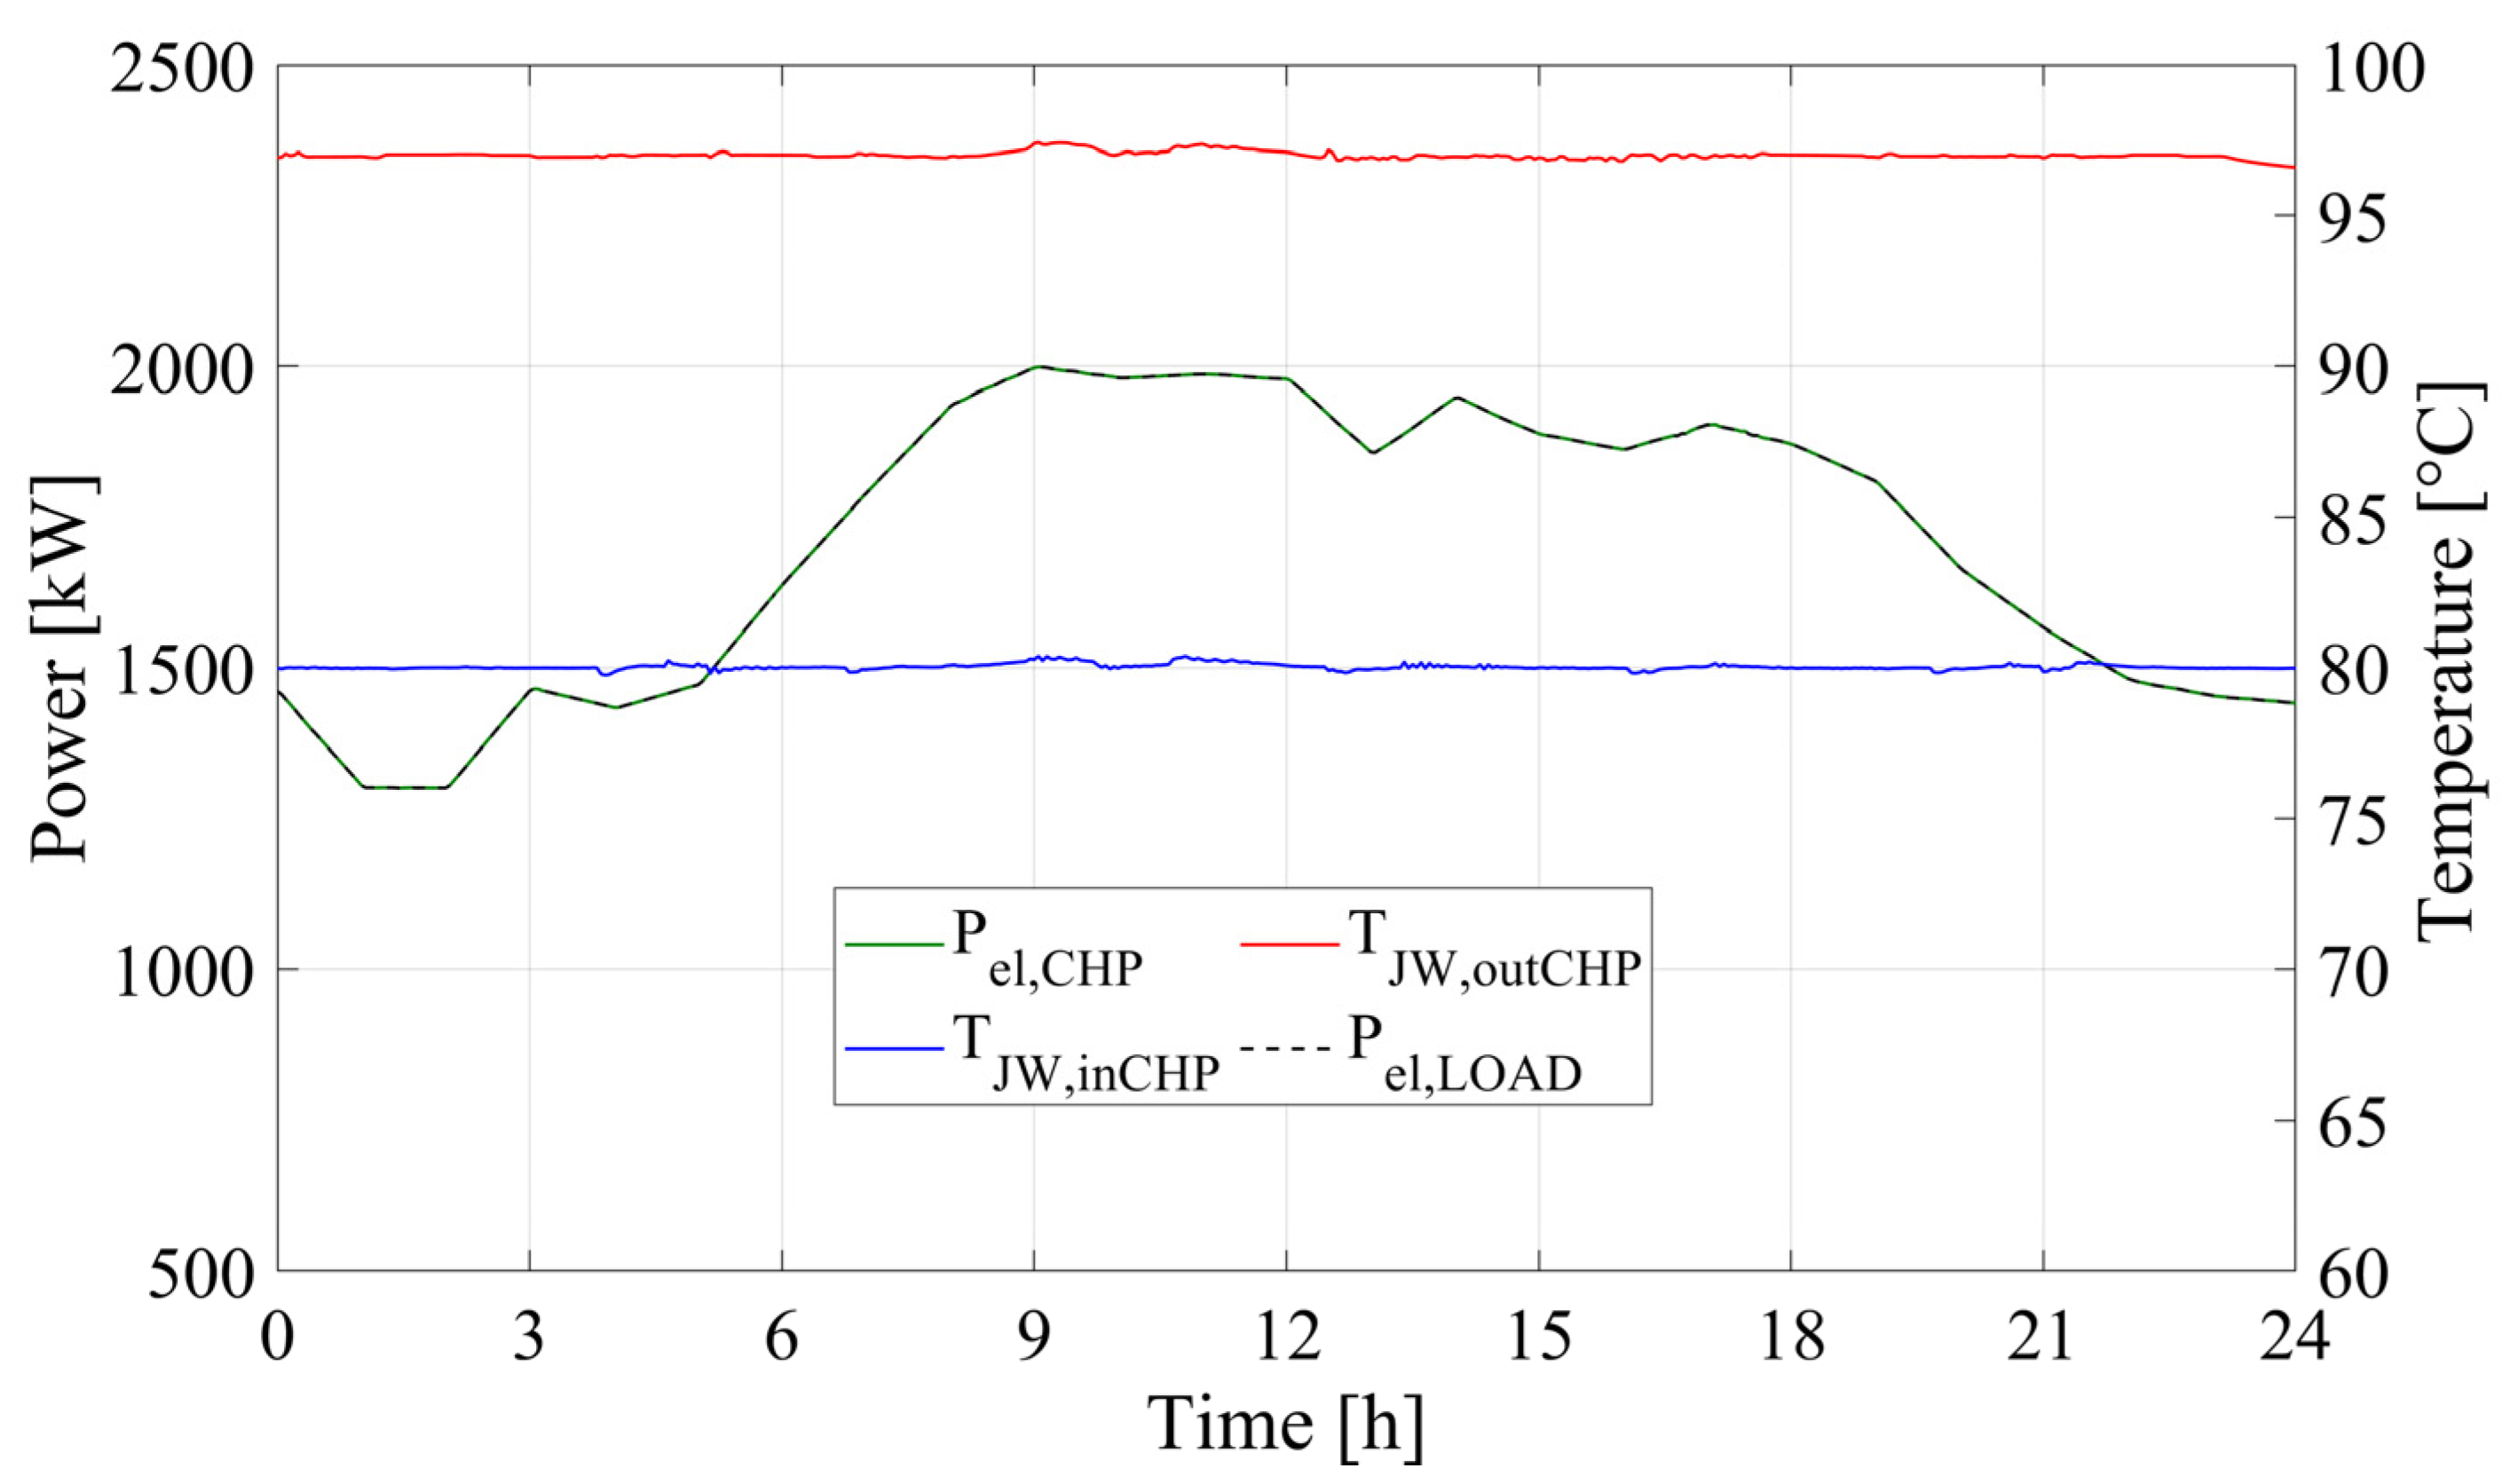
- Type 907: this library describes the performance of internal combustion engines, considering oil cooling water, after-cooling water, jacket water, and using inlet air temperature as a parameter. The mass and thermal balance performed by this library are based on manufactured data [18]. For the sake of brevity, the equations of this model not are described here, but a detailed description is available in Ref. [1].
- Type 107: this library models the performance of a single-effect LiBr-H2O absorption chiller. The library adopts a normalized catalogue data look-up principle [22]. Thus, the performance of ACH is evaluated by using an operating map provided by manufacturers [23]. Further details are reported in Ref. [1].
3.1. Energy Analysis
3.2. Economic Analysis
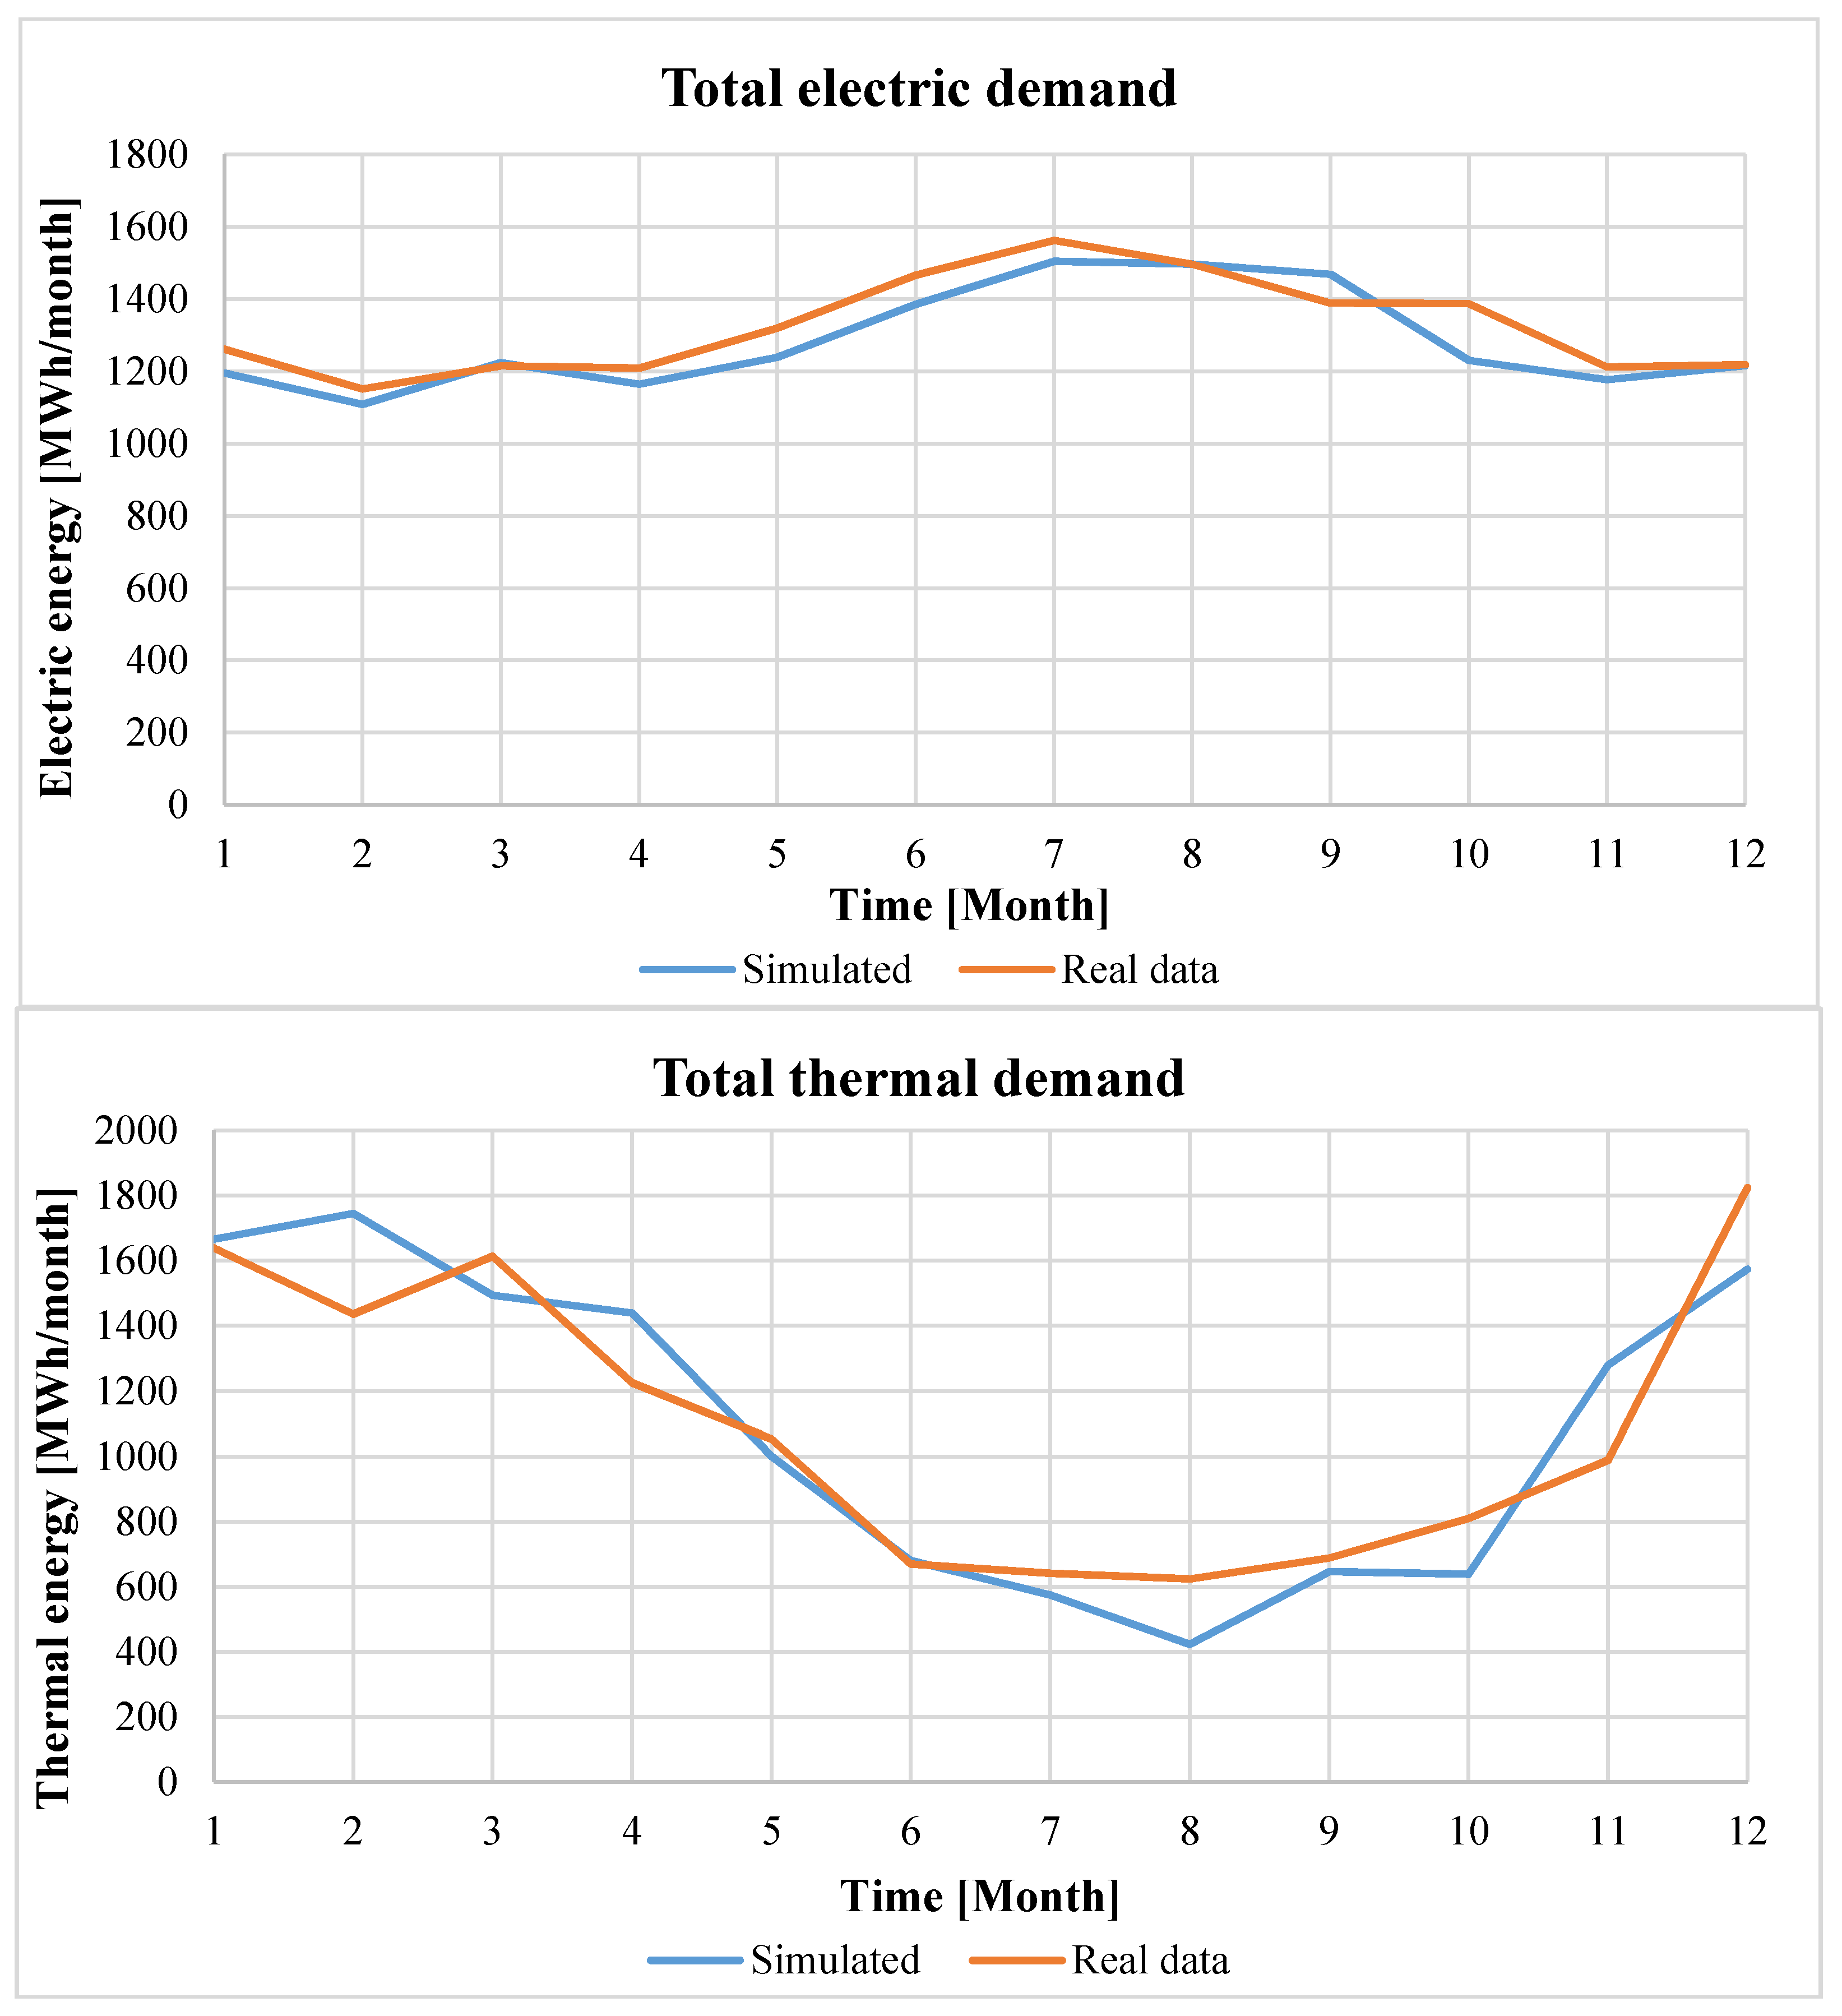
4. Hospital Energy Loads
5. Results
5.1. Daily Results
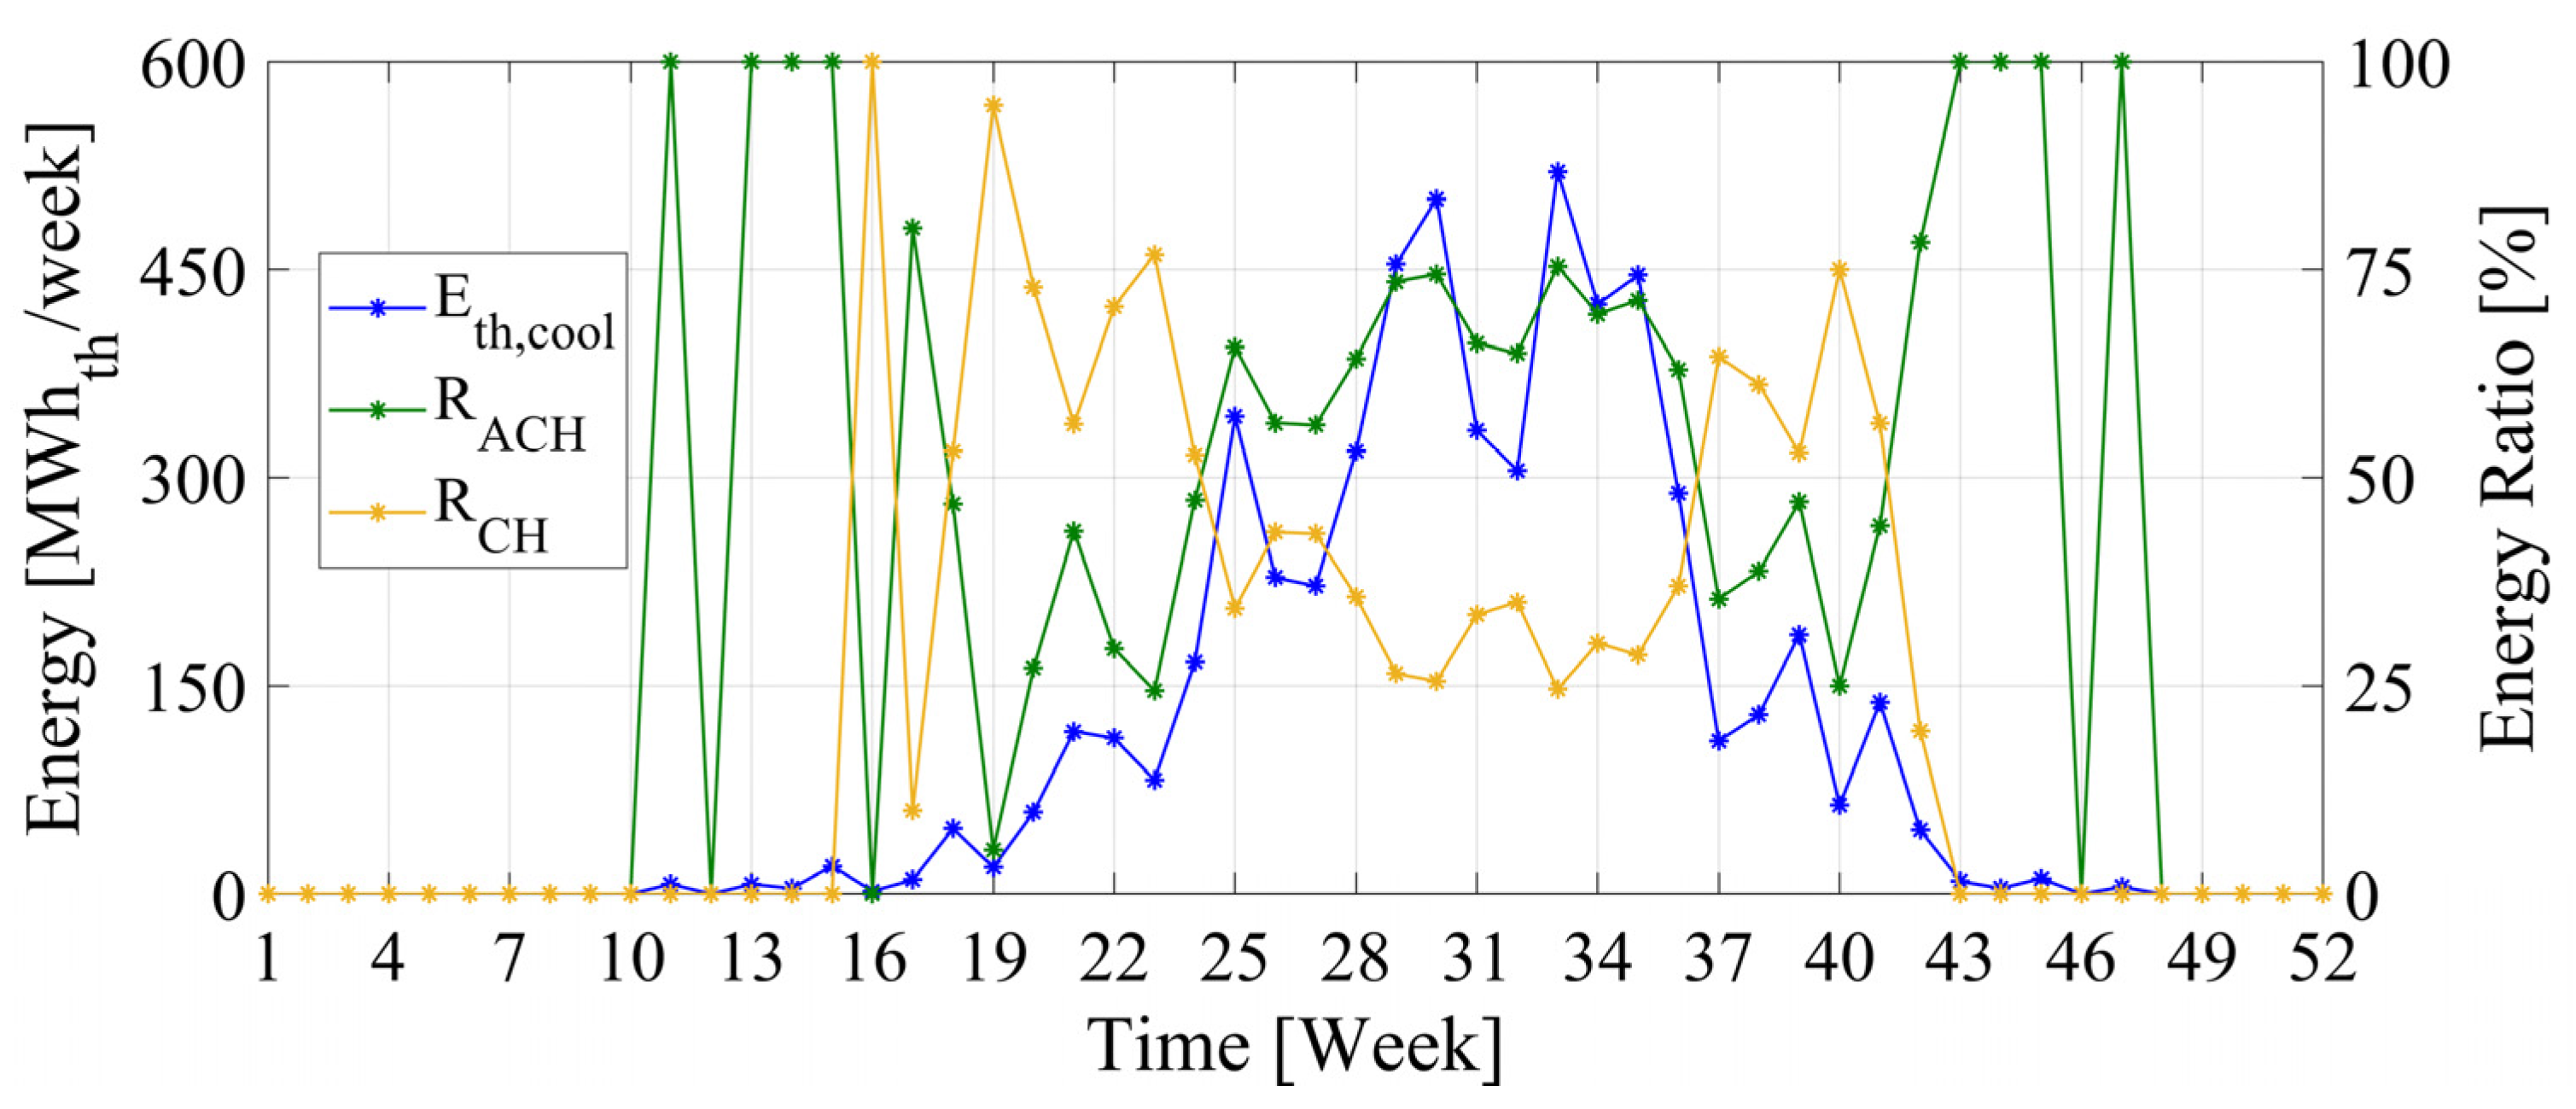
5.2. Weekly Results
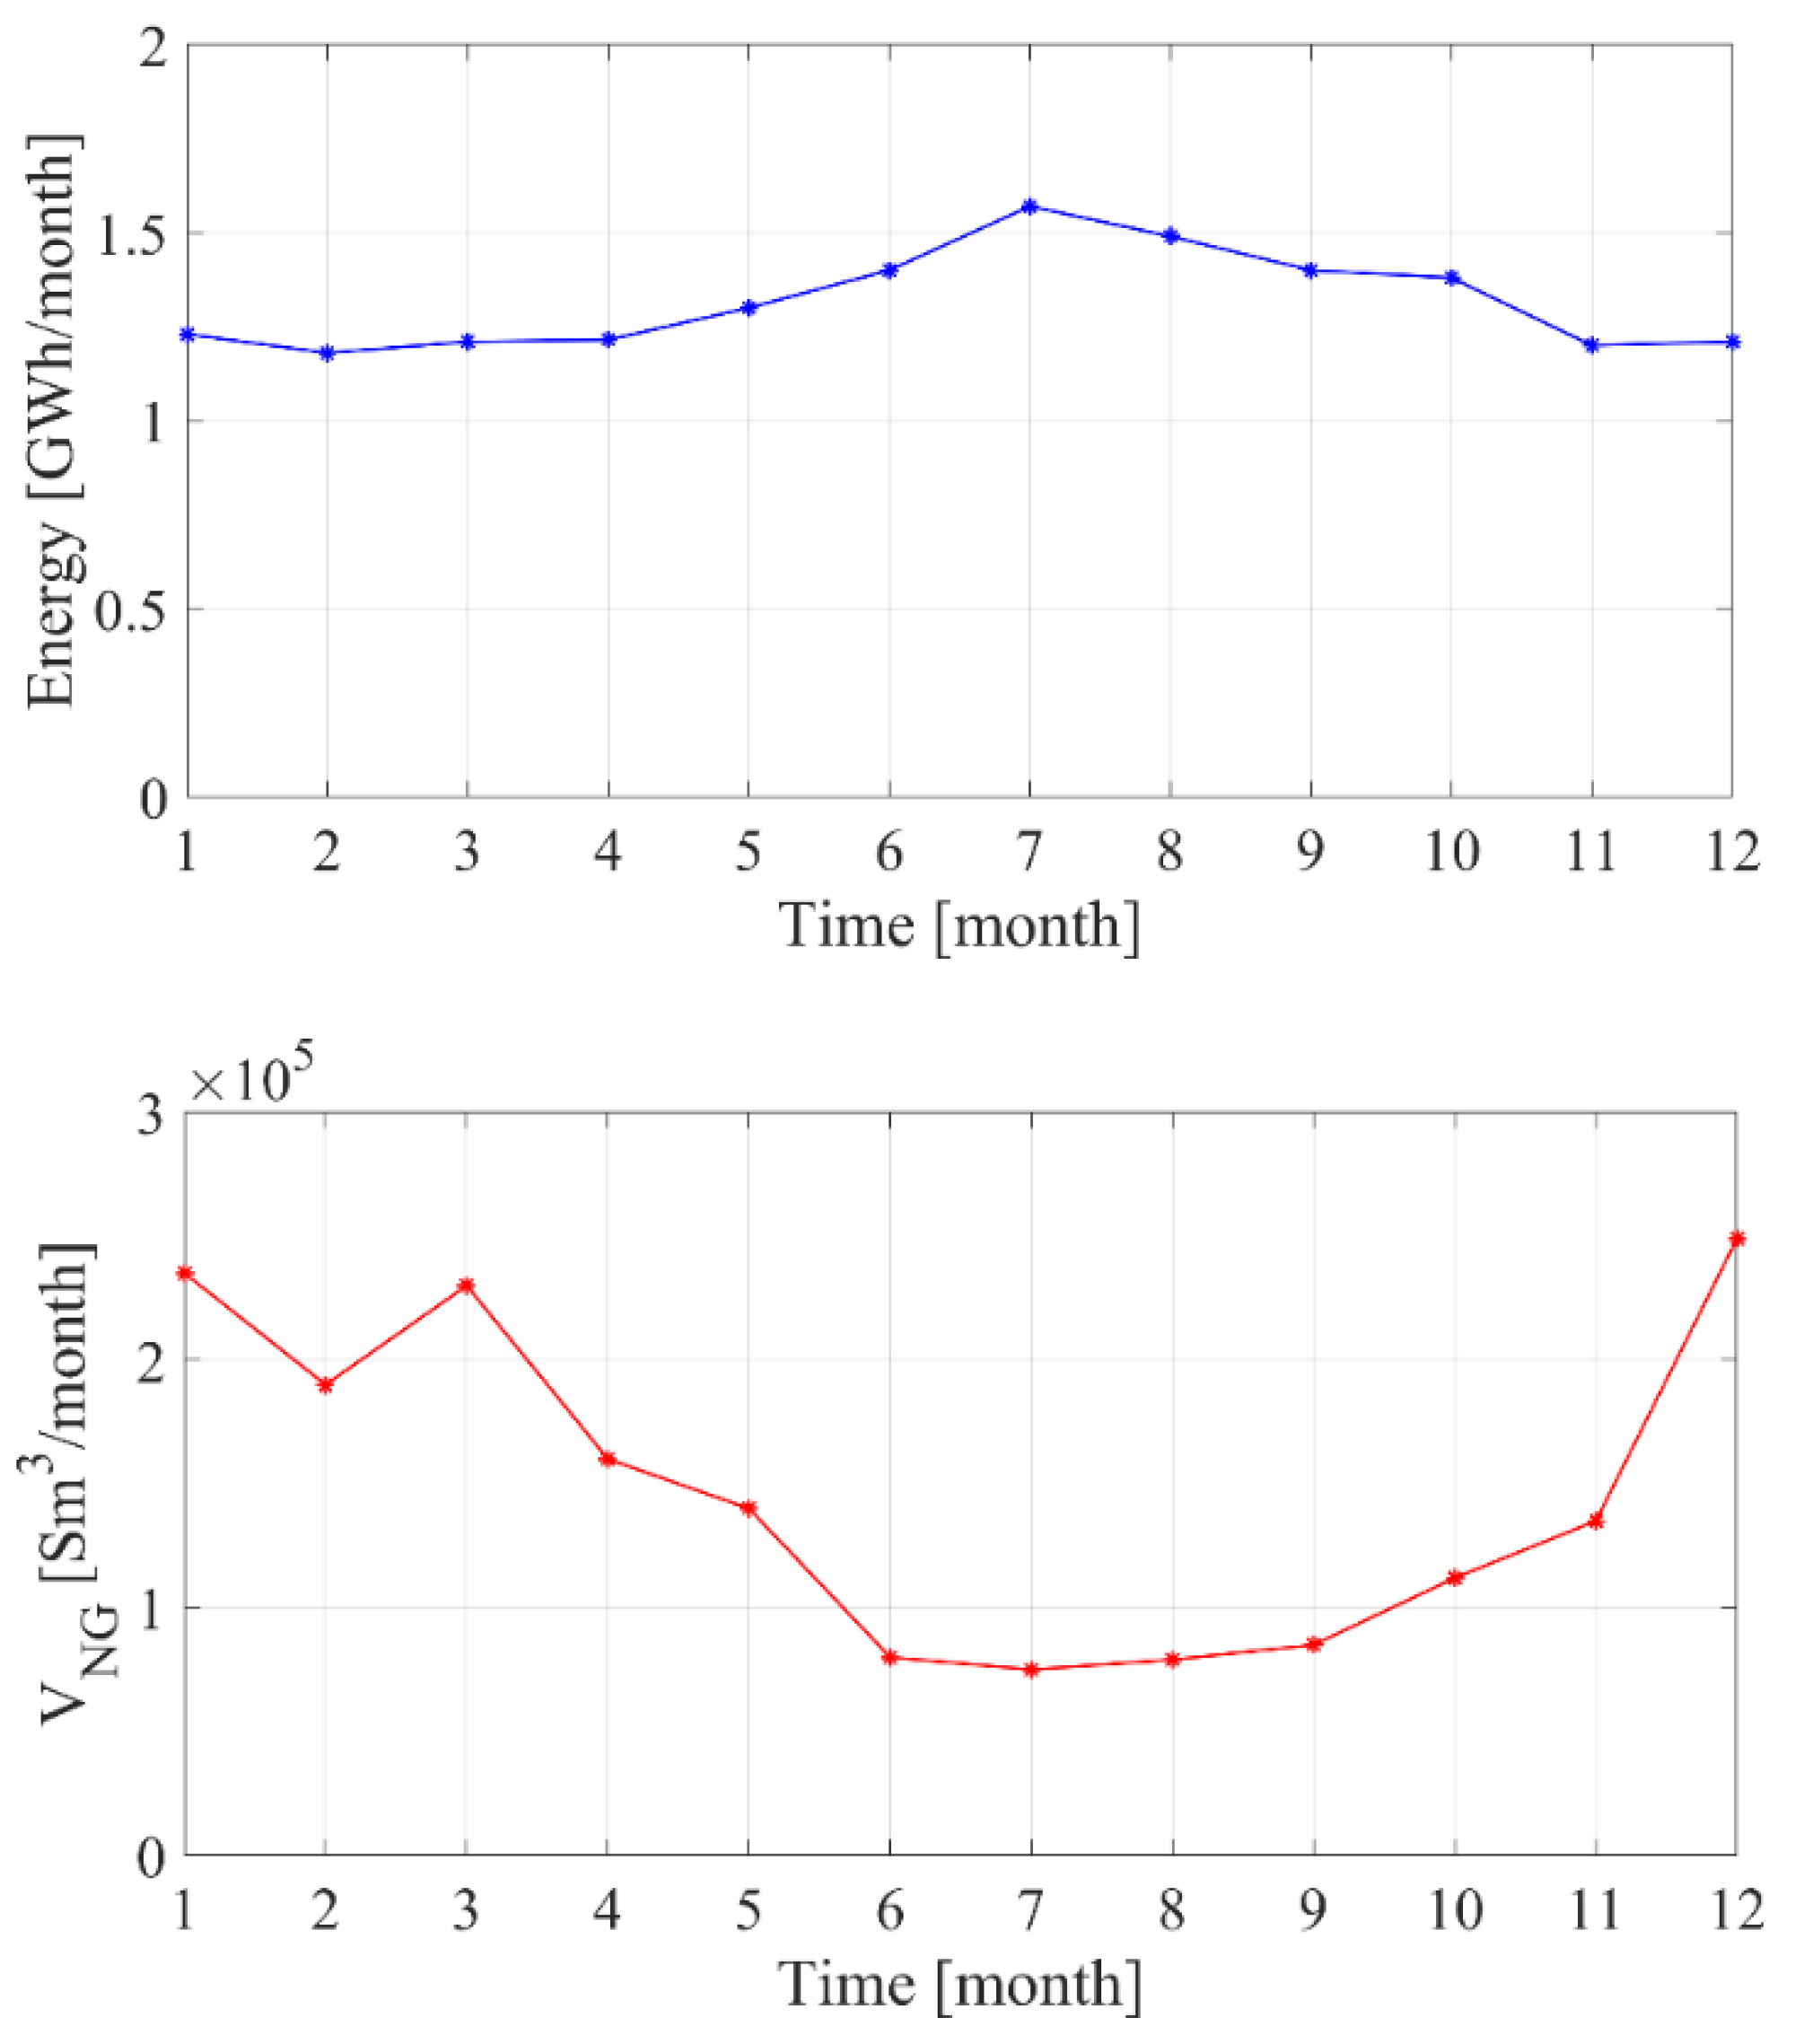
5.3. Yearly Results
6. Conclusions
- the trigeneration system produces about 13.74 GWh/year of electric energy with an electric efficiency of 42%; in particular, 92% of the electric energy demand of the hospital is met by the system;
- a limited share of the overall thermal energy demand of the hospital is matched by the cogeneration unit (41%); this is due to the fact that the size of the system was mainly selected on the basis of the power demand of the hospital (much lower than the thermal one), to avoid: (i) the production of excess electric energy (in case of full-load operation or thermal load tracking); (ii) the need for continuous part-load operation, in case of electric load tracking (this latter represents the option actually selected for the system under consideration);
- in spite of a limited primary energy savings index (about 9%), mainly due to the limited share of thermal energy covered by the cogeneration system, excellent economic performance was highlighted by the simulations (payback period equal to 1.5 years, profitability index of 3.88), also due to the significant contribution of the subsidies provided by the current Italian regulation for CHP systems (energy savings certificates, with a market value of 0.207 M€/years).
Author Contributions
Funding
Conflicts of Interest
Nomenclature
| E | energy (kWh/MWh/GWh) |
| ESC | energy savings certificates (-) |
| J | capital cost (€) |
| NPV | net present value (€) electric power (kW) |
| P | electric power (kW) |
| PE | primary energy per year (GWh/year) |
| PES | primary energy saving index (-) |
| PI | profitability index (-) |
| SPB | simple payback period (years) |
| T | temperature (°C) |
| U | overall heat transfer coefficient (W m−2 K−1) |
| V | volume of natural gas (Sm3) |
Greek Symbols
| Δ | difference (-) |
| η | efficiency (-) |
| ρ | density (kg m−3) |
| ρs | solar reflectance (-) |
Subscripts
| ACH | absorption chiller |
| CB | condensing boiler |
| CH | electric chiller |
| CHP | combined heat and power system |
| CCHP | combined cooling, heat and power system |
| cool | cooling |
| EHW | domestic hot water |
| el | electric |
| LOAD | the electric energy demand of the user |
| from GRID | electric energy withdrawn from the public grid |
| heat | heating |
| HT | the high temperature thermal energy |
| MT | the medium temperature thermal energy |
| NG | natural gas |
| PS | proposed system |
| RS | reference system |
| t | referred to a generic time step |
| th | thermal |
| SG | steam generator |
| Steam | steam |
References
- Calise, F.; Dentice d’Accadia, M.; Libertini, L.; Quiriti, E.; Vanoli, R.; Vicidomini, M. Optimal operating strategies of combined cooling, heating and power systems: A case study for an engine manufacturing facility. Energy Convers. Manag. 2017, 149, 1066–1084. [Google Scholar] [CrossRef]
- Faramarzi, G.R.; Khodakarami, M.; Shabani, A.; Saen, R.F.; Azad, F. New network data envelopment analysis approaches: An application in measuring sustainable operation of combined cycle power plants. J. Clean. Prod. 2015, 108, 232–246. [Google Scholar] [CrossRef]
- Jiang, J.; Gao, W.; Wei, X.; Li, Y.; Kuroki, S. Reliability and cost analysis of the redundant design of a combined cooling, heating and power (CCHP) system. Energy Convers. Manag. 2019, 199, 111988. [Google Scholar] [CrossRef]
- Murugan, S.; Horák, B. Tri and polygeneration systems - A review. Renew. Sustain. Energy Rev. 2016, 60, 1032–1051. [Google Scholar] [CrossRef]
- Al Moussawi, H.; Fardoun, F.; Louahlia-Gualous, H. Review of tri-generation technologies: Design evaluation, optimization, decision-making, and selection approach. Energy Convers. Manag. 2016, 120, 157–196. [Google Scholar] [CrossRef]
- Chicco, G.; Mancarella, P. From cogeneration to trigeneration: Profitable alternatives in a competitive market. Ieee Trans. Energy Convers. 2006, 21, 265–272. [Google Scholar] [CrossRef]
- Gonzales Palomino, R.; Nebra, S.A. The potential of natural gas use including cogeneration in large-sized industry and commercial sector in Peru. Energy Policy 2012, 50, 192–206. [Google Scholar] [CrossRef]
- Szklo, A.S.; Soares, J.B.; Tolmasquim, M.c.T. Economic potential of natural gas-fired cogeneration—Analysis of Brazil’s chemical industry. Energy Policy 2004, 32, 1415–1428. [Google Scholar] [CrossRef]
- Gimelli, A.; Muccillo, M.; Sannino, R. Optimal design of modular cogeneration plants for hospital facilities and robustness evaluation of the results. Energy Convers. Manag. 2017, 134, 20–31. [Google Scholar] [CrossRef]
- Bianco, V.; De Rosa, M.; Scarpa, F.; Tagliafico, L.A. Implementation of a cogeneration plant for a food processing facility. A case study. Appl. Therm. Eng. 2016, 102, 500–512. [Google Scholar] [CrossRef] [Green Version]
- Shabbir, I.; Mirzaeian, M. Feasibility analysis of different cogeneration systems for a paper mill to improve its energy efficiency. Int. J. Hydrog. Energy 2016, 41, 16535–16548. [Google Scholar] [CrossRef]
- Calise, F.; Dentice d’Accadia, M.; Libertini, L.; Quiriti, E.; Vicidomini, M. A novel tool for thermoeconomic analysis and optimization of trigeneration systems: A case study for a hospital building in Italy. Energy 2017, 126, 64–87. [Google Scholar] [CrossRef]
- do Espirito Santo, D.B. An energy and exergy analysis of a high-efficiency engine trigeneration system for a hospital: A case study methodology based on annual energy demand profiles. Energy Build. 2014, 76, 185–198. [Google Scholar] [CrossRef]
- Espirito Santo, D.B. Energy and exergy efficiency of a building internal combustion engine trigeneration system under two different operational strategies. Energy Build. 2012, 53, 28–38. [Google Scholar] [CrossRef]
- Bracco, S.; Delfino, F. A mathematical model for the dynamic simulation of low size cogeneration gas turbines within smart microgrids. Energy 2017, 119, 710–723. [Google Scholar] [CrossRef]
- Zheng, L.; Furimsky, E. ASPEN simulation of cogeneration plants. Energy Convers. Manag. 2003, 44, 1845–1851. [Google Scholar] [CrossRef]
- Piacentino, A.; Gallea, R.; Cardona, F.; Lo Brano, V.; Ciulla, G.; Catrini, P. Optimization of trigeneration systems by Mathematical Programming: Influence of plant scheme and boundary conditions. Energy Convers. Manag. 2015, 104, 100–114. [Google Scholar] [CrossRef]
- Available online: https://www.gruppoab.com/it/ (accessed on 12 January 2019).
- Klein, S.A. TRNSYS-A Transient System Simulation Program; Engineering Experiment Station Report; University of Wisconsin-Madison: Madison, WI, USA, 1988; pp. 12–38. [Google Scholar]
- Murray, M.C.; Finlayson, N.; Kummert, M.; Macbeth, J. Live Energy Trnsys—Trnsys Simulation within Google Sketchup. In Proceedings of the 475 Eleventh International IBPSA Conference, Glasgow, Scotland, 27–30 July 2009. [Google Scholar]
- Buonomano, A.; Calise, F.; Palombo, A.; Vicidomini, M. BIPVT systems for residential applications: An energy and economic analysis for European climates. Appl. Energy 2016, 184, 1411–1431. [Google Scholar] [CrossRef]
- Handbook, A. HVAC Systems and Equipment; American Society of Heating, Refrigerating, and Air Conditioning Engineers: Atlanta, GA, USA, 1996; pp. 1–10. [Google Scholar]
- Available online: http://www.enea.it/it (accessed on 22 December 2019).


| Parameter | Description | Value | Unit |
|---|---|---|---|
| Jel,fromGRID | Grid electric energy unit cost | 180 | €/MWh |
| JNG | Average Natural gas unit cost for boilers and steam generators | 29.5 | €/MWhPE |
| JNG,CHP | Average Natural gas unit cost for CHP | 27.5 | €/MWhPE |
| JESC | Economic value of ESC | 180 | €/ESC |
| LHVNG | Natural gas lower heating value | 9.59 | kWh/Sm3 |
| ηel | Conventional thermo-electric power plant efficiency | 46 | % |
| ηCB | Natural gas condensing boiler efficiency | 95 | % |
| ηSG | Natural gas steam generator efficiency | 75 | % |
| AF | Annuity factor | 8 | years |
| - | A | B | C | D |
|---|---|---|---|---|
| Geometric Features: Volume (m3) | 9249.81 | 41624.2 | 44,787.2 | 19,655.9 |
| Ventilation (vol/h) | 15 | 3 | 3 | 1 |
| Tset,winter(°C) | 20 ± 1 | 22 ± 2 | 21 ± 1 | 19 ± 1 |
| Tset,summer(°C) | 23 ± 1 | 24 ± 2 | 26 ± 1 | 26 ± 1 |
| DHW set point temperature (°C) | 45 | |||
| Heating and cooling season (1.610-degree day) | 15th November–31st March 1st May–30th September | |||
| Occupancy schedule | 00:00–24:00 | 00:00–24:00 | 08:00–18:00 | 00:00–24:00 |
| Simulation Time step (h) | 0.05 | |||
| Building Element | Zones A & B & C & D | |||
|---|---|---|---|---|
| U-Value (W/m2K) | Thickness (m) | ρs (–) | ε (–) | |
| Roof | 0.600 | 0.235 | 0.4 | 0.9 |
| Façades | 0.492 | 0.280 | ||
| Ground floor | 0.608 | 0.560 | ||
| Adjacent ceiling | 1.111 | 0.400 | ||
| Windows glass | 2.89 | 0.004/0.016/0.004 | 0.13 | 0.18 |
| Component | Parameter | Value | Unit |
|---|---|---|---|
| CHP system | Model | Ecomax 20 HE | |
| Manufacturer | AB | ||
| Rated thermal capacity | 1882 | kW | |
| Rated electrical capacity | 2004 | ||
| Rated fuel input | 4544 | ||
| Rated electrical efficiency | 44.1 | % | |
| Rated thermal efficiency | 43.0 | ||
| Global rated efficiency | 87.1 | ||
| Heat exchanger exhaust gas-condensed vapor | Rated thermal capacity | 750 | kW |
| Condensed water flow rate | 1284 | kg/h | |
| Exhaust gas flow rate | 10,753 | ||
| Dissipator (DISS) | Rated thermal capacity | 1300 | kW |
| DHW heat exchanger (DHWHE) | Efficiency | 50 | % |
| Average DHW flow rate demand (P8) | 1360 | kg/h | |
| Heating water flow rate (P7) | 40,480 | ||
| Auxiliary boiler (heating loop CB) | Rated thermal capacity | 10,500 | kWth |
| Auxiliary boiler (vapor loop CBVap) | Rated thermal capacity | 4000 | kWth |
| Electrical auxiliary chiller | Rated thermal capacity | 9000 | kWth |
| COP | 5.95 | - | |
| Absorption chiller | Rated cooling capacity | 769 | kW |
| Setpoint temperature for the chilled water | 7 | °C | |
| Cooling tower | Rated thermal capacity | 1794 | kW |
| Eth,CHP | Eel,CHP | ∆PE | PES | η el | η th | η | ESC | SPB | ∆C | PI | NPV |
|---|---|---|---|---|---|---|---|---|---|---|---|
| (GWhth/year) | (GWh/year) | (GWh/year) | (%) | (M€/year) | (years) | (M€/year) | (-) | (M€) | |||
| 13.19 | 13.74 | 3.27 | 8.9 | 42.1 | 39.42 | 72.54 | 0.207 | 1.5 | 1.22 | 3.88 | 7.10 |
| Eel,fromGRID/Eel,LOAD | Eel,CHP/Eel,LOAD | Eth,CHP,usefull/Eth,demand | Eth,ACH/Eth,cool |
|---|---|---|---|
| (%) | |||
| 7.9 | 92.1 | 40.65 | 28.00 |
© 2020 by the authors. Licensee MDPI, Basel, Switzerland. This article is an open access article distributed under the terms and conditions of the Creative Commons Attribution (CC BY) license (http://creativecommons.org/licenses/by/4.0/).
Share and Cite
Calise, F.; Cappiello, F.L.; Dentice d’Accadia, M.; Libertini, L.; Vicidomini, M. Dynamic Simulation and Thermoeconomic Analysis of a Trigeneration System in a Hospital Application. Energies 2020, 13, 3558. https://doi.org/10.3390/en13143558
Calise F, Cappiello FL, Dentice d’Accadia M, Libertini L, Vicidomini M. Dynamic Simulation and Thermoeconomic Analysis of a Trigeneration System in a Hospital Application. Energies. 2020; 13(14):3558. https://doi.org/10.3390/en13143558
Chicago/Turabian StyleCalise, Francesco, Francesco Liberato Cappiello, Massimo Dentice d’Accadia, Luigi Libertini, and Maria Vicidomini. 2020. "Dynamic Simulation and Thermoeconomic Analysis of a Trigeneration System in a Hospital Application" Energies 13, no. 14: 3558. https://doi.org/10.3390/en13143558