Fluidised Bed Gasification of Diverse Biomass Feedstocks and Blends—An Overall Performance Study

Abstract
:1. Introduction
2. Materials and Methods
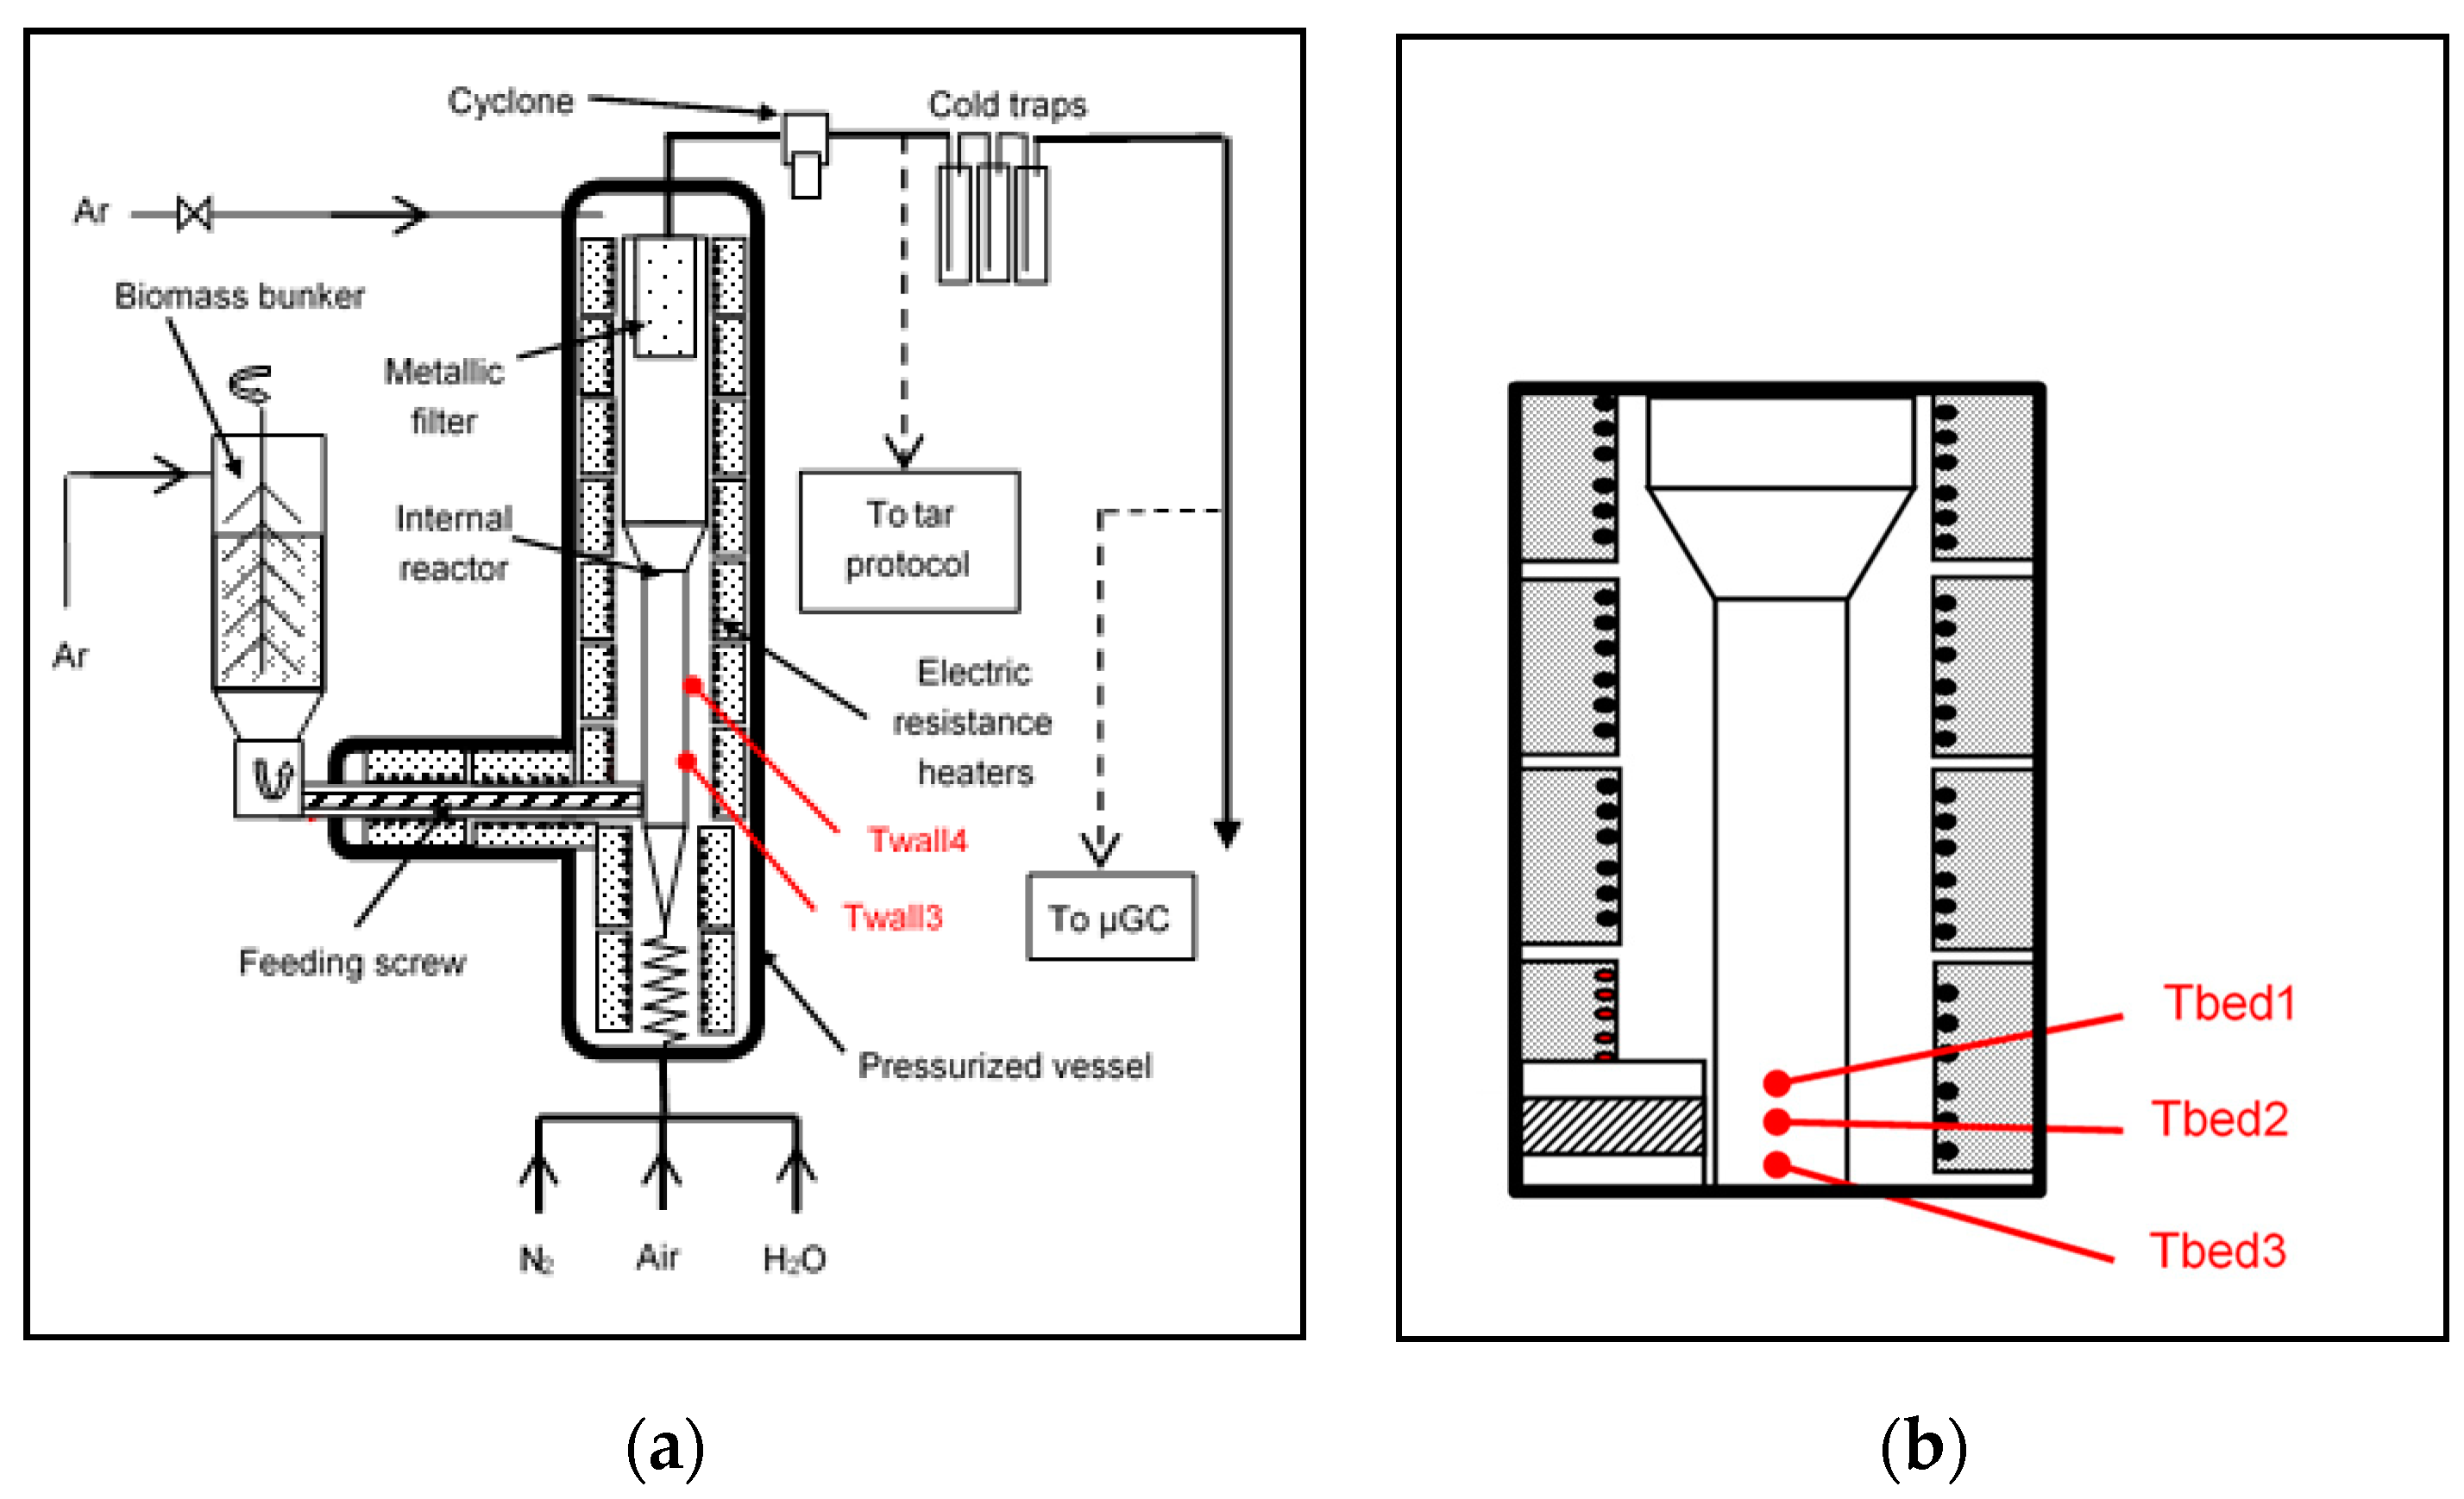
2.1. Description of the Facility
2.2. Biomass Characterization
2.3. Analyses of the Solid and Liquid Products
- Measurement of ash content at 815 °C (on the solids recovered after gasification);
- Powder X-ray diffraction (P-XRD) analysis was used to identify the presence of liquid and crystalline phases on a D8 Bruker Advance with Cu Kα radiation (40 kV, 30 mA), equipped with a fast Lynxeye detector. The Bruker DIFFRAC.EVA software together with the PDF-4 reference database were used for the phase identification;
- Scanning electron microscopy (SEM): microstructures were also observed on a Philips XL30 SEM coupled with an Oxford Instruments EDX system (INCA software) to obtain semi-quantification of the chemical composition of each phase. The residues to be studied were embedded under vacuum in epoxy resin and polished with water-free lubricants. The samples were coated with graphite to make them conductive allowing SEM analysis.
2.4. Method and Operating Conditions of the Fluidised Bed Experiments
2.5. Thermodynamic Calculations
- FactPS (stoichiometric solid, liquid and gas compounds).
- FTSalt (pure salts and solutions).
- GTOX5.1 (solid and liquid solutions) especially developed for oxide biomass ash systems [19].
3. Results and Discussion
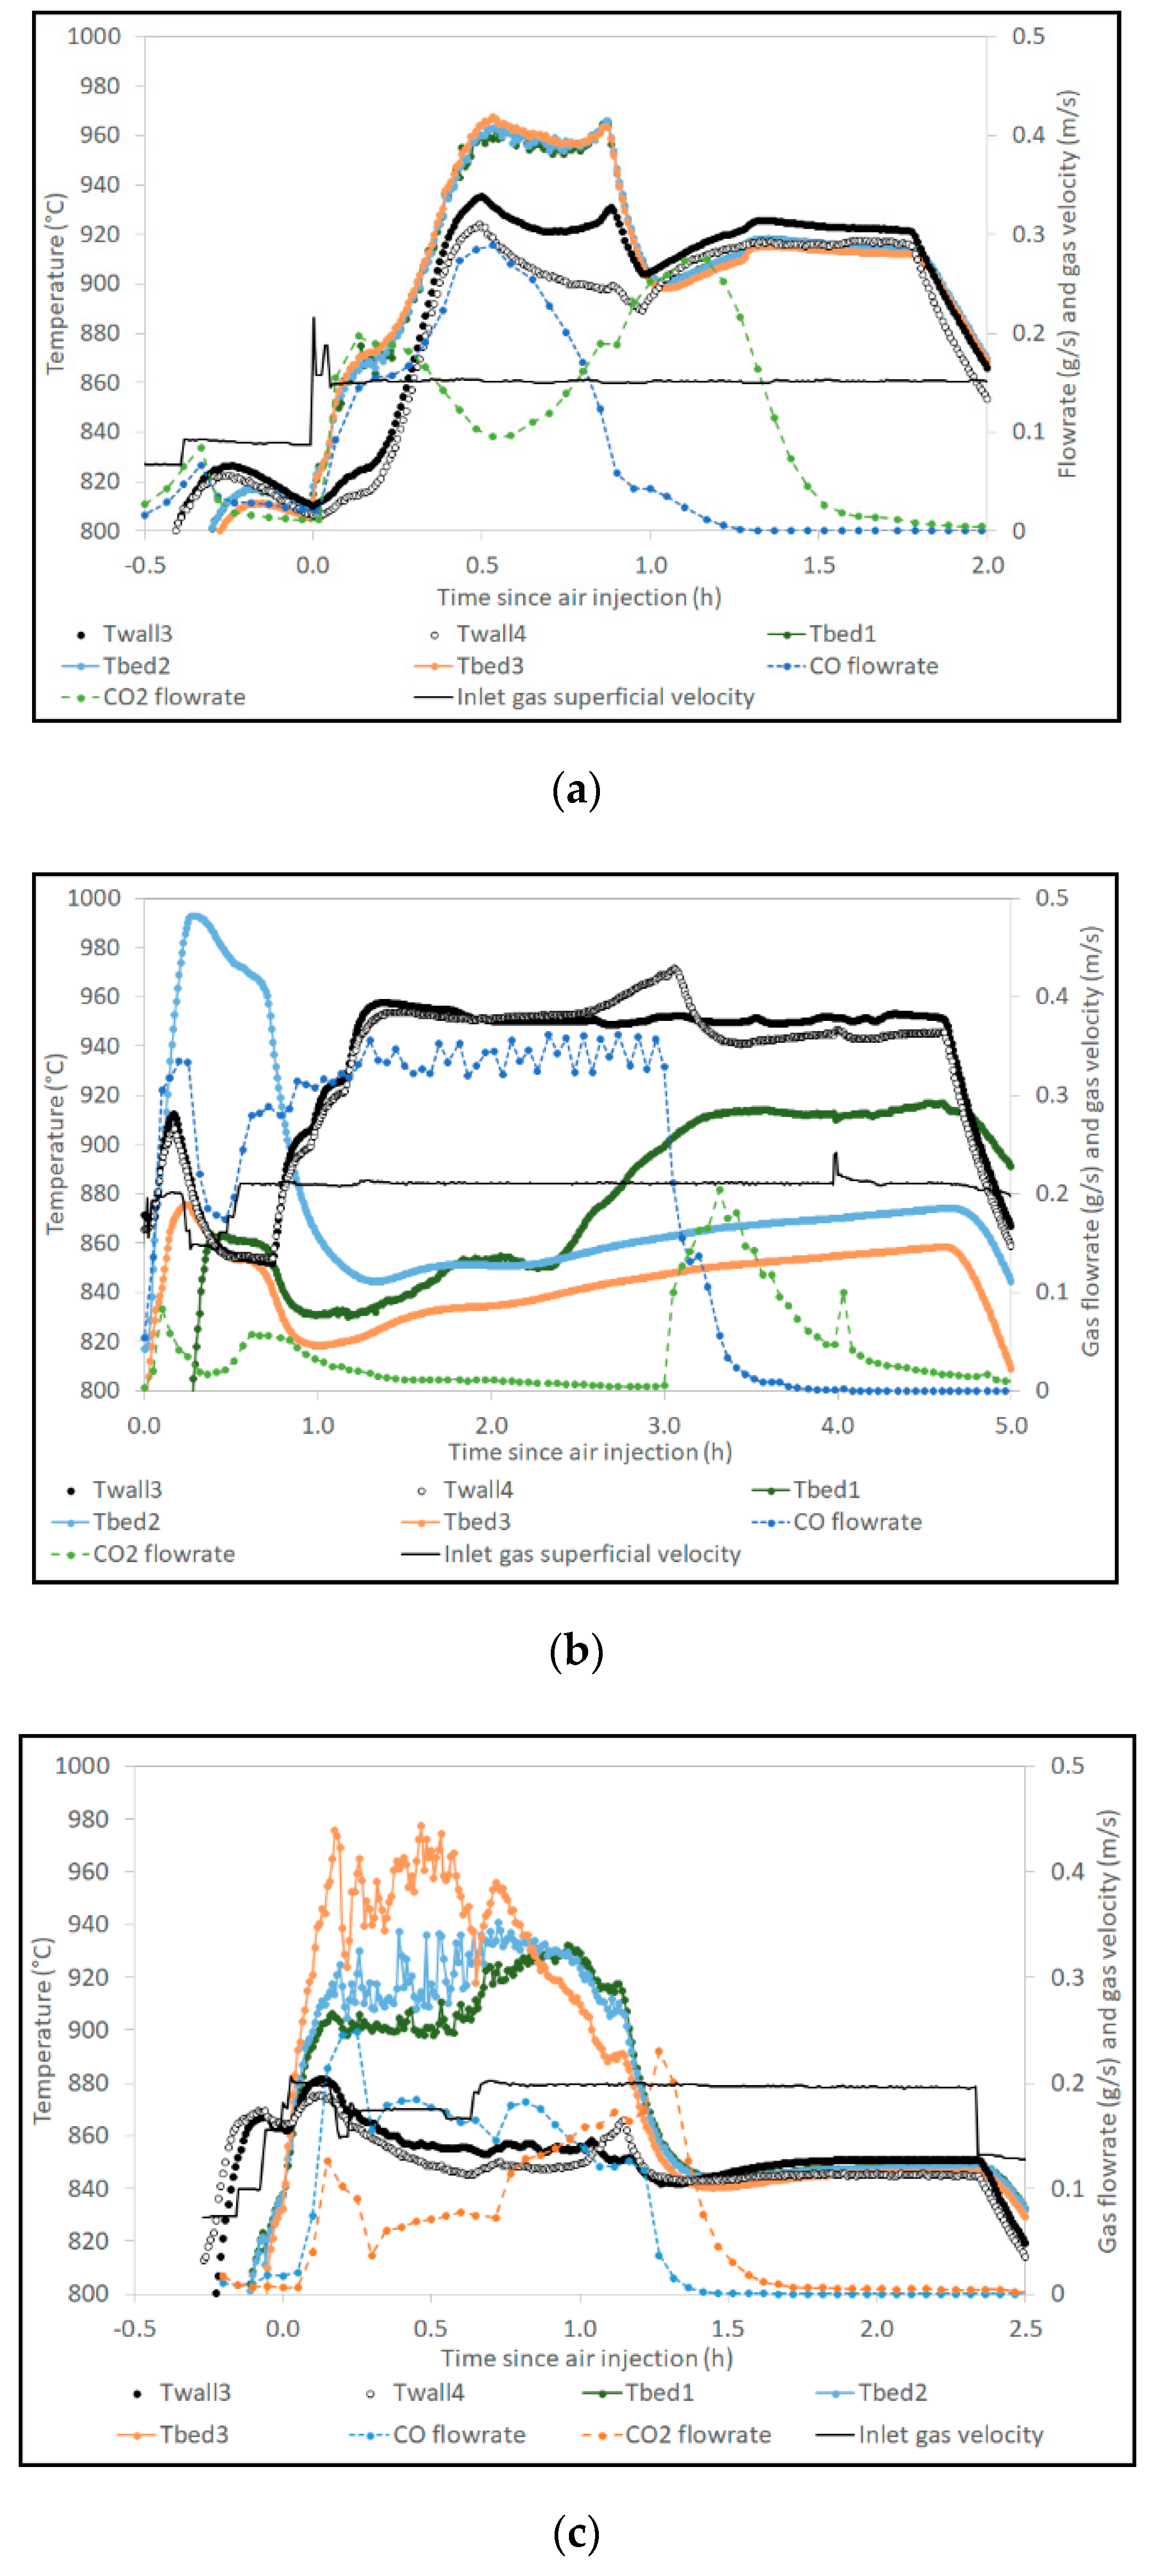
3.1. Temperature Measurements
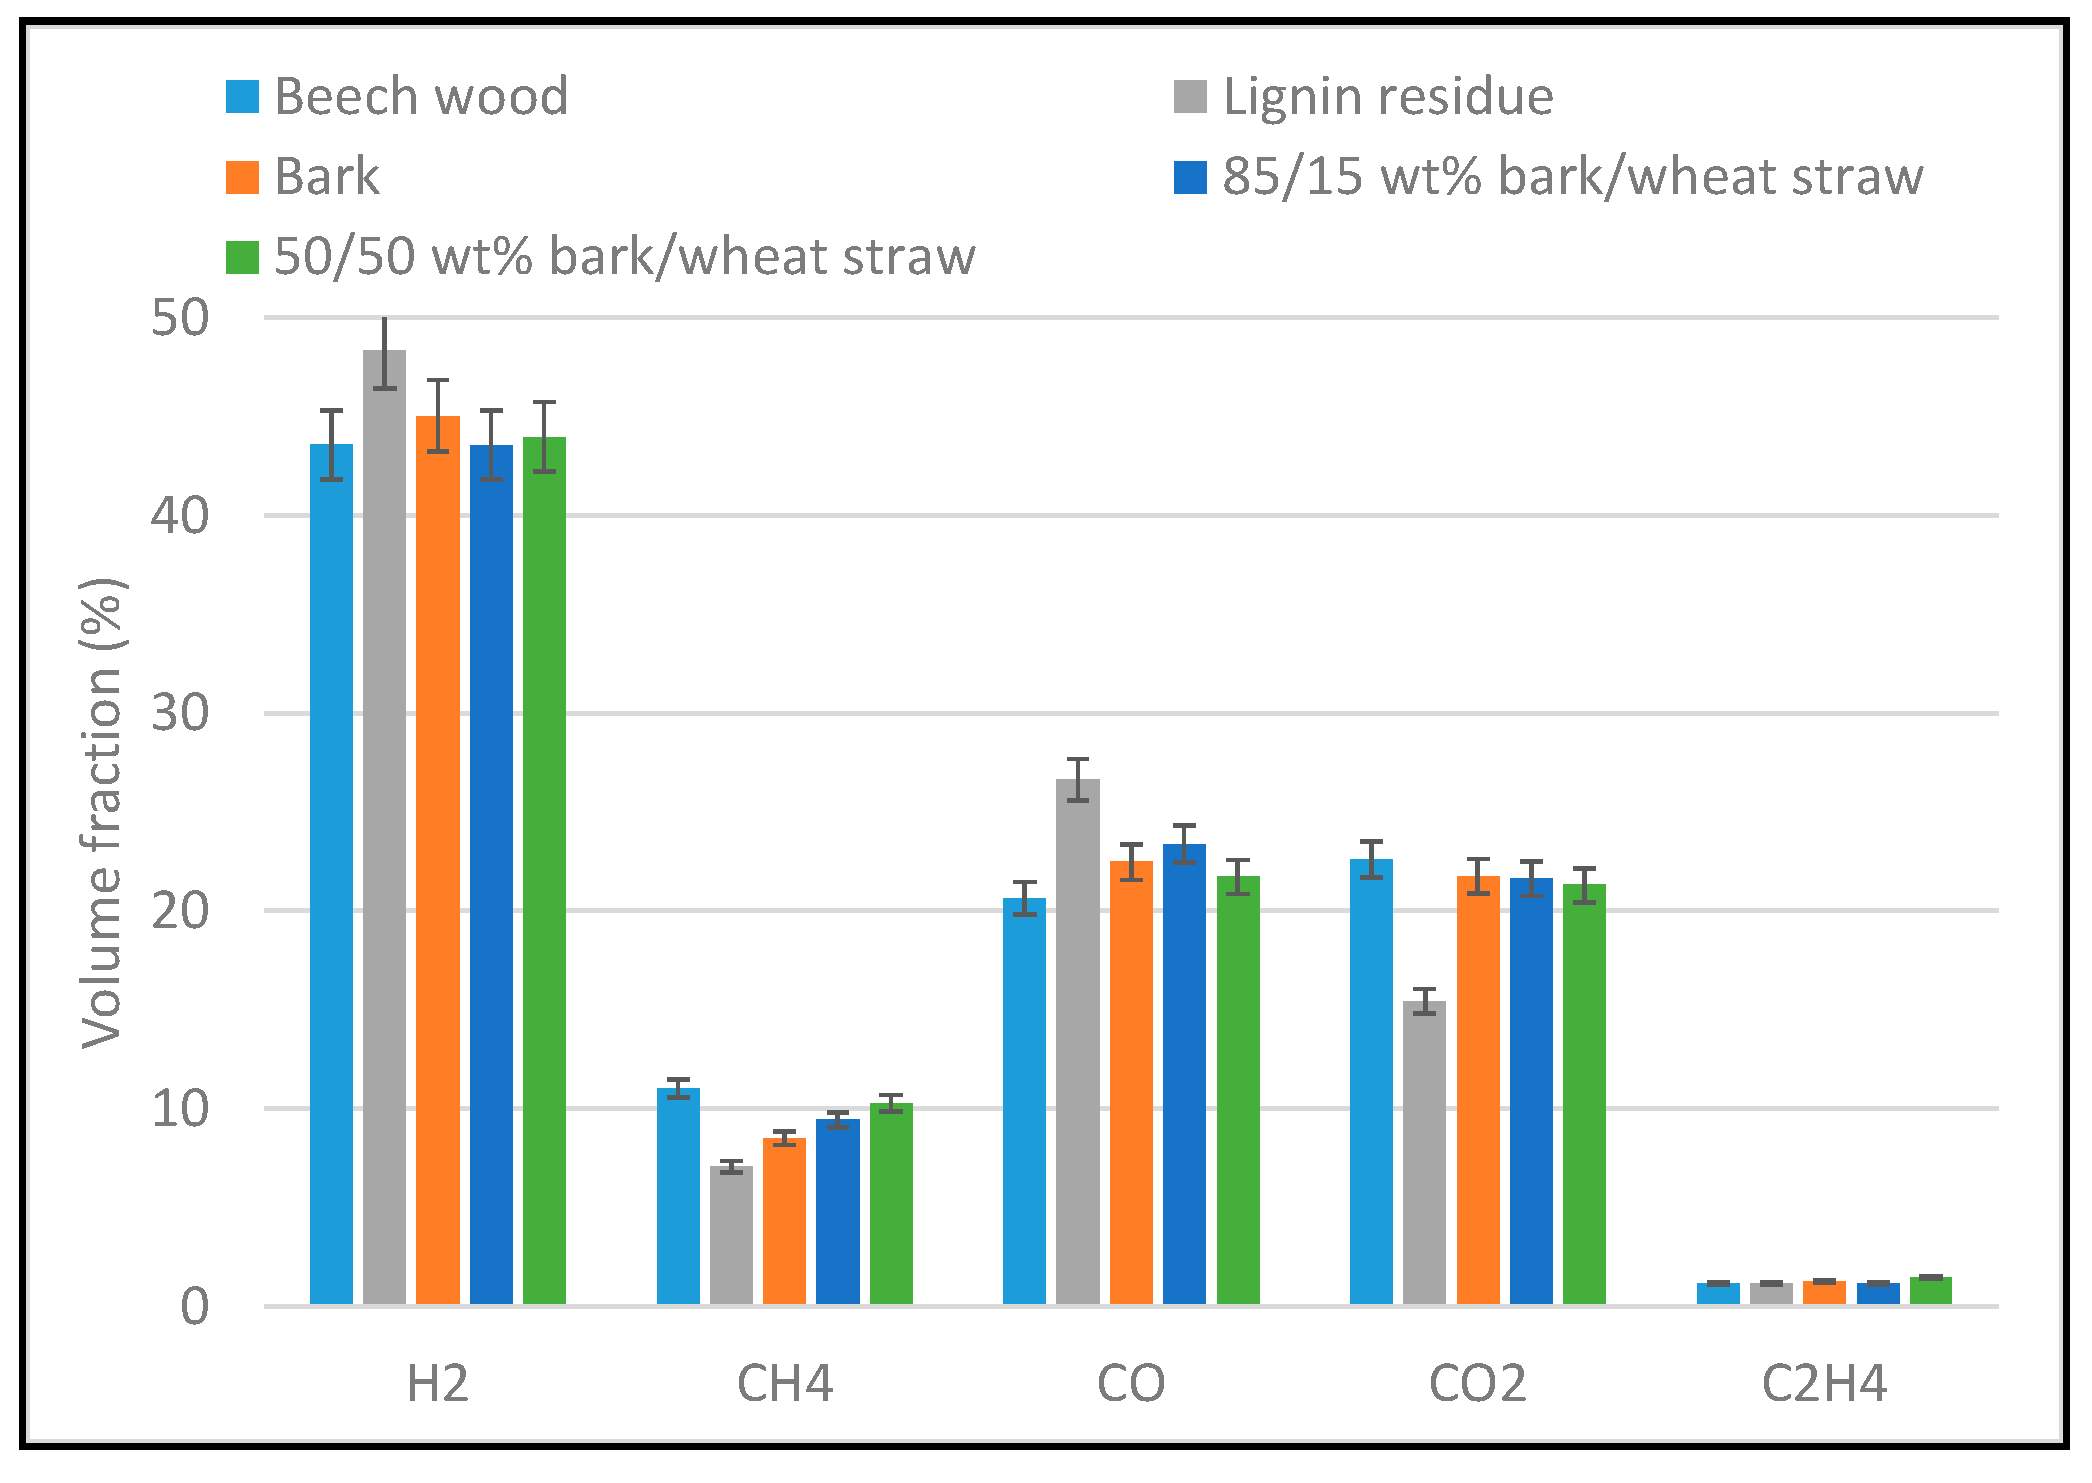
3.2. Product Gas Yield and Composition in Gasification Experiments
- The mass of dry gas obtained by integration over the whole gasification experiment (composition analysed by µGC, flowrate obtained with tracer gas method),
- The mass of water trapped in condensers,
- The mass and composition of condensable tar trapped in ‘tar protocol’,
- The mass of fly residue on filters and cyclone recovered after gasification (this residue was supposed to be composed of carbon and ash only, and the ash content was measured on samples),
- The mass of solid remaining in the bed determined with the combustion experiment, by quantifying the CO/CO2 released then (µGC analysis and tracer gas method).
3.3. Tar Content and Composition
3.4. Characterisation of the Solid Residue
3.5. Prediction of Defluidisation and Comparison with Experimental Results
- τL,c: critical liquid volume fraction (vol% of bed material)
- Ug: superficial gas velocity (m/s)
- Umf: minimum fluidisation velocity (m/s).
- tdef: time before complete defluidisation (h)
- ms: mass of bed material (kg)
- ρL(T): density of the molten ash at operating temperature T (kg/m3)
- ρs: density of the bed material (kg/m3)
- Qbio: dry biomass feeding rate (kg/h)
- τash: biomass ash content (wt% on dry basis)
- XL(T): molten ash fraction at operating temperature T (wt% of total ash)
- mbio: mass of dry biomass fed in bed (kg).
4. Conclusions
Author Contributions
Funding
Acknowledgments
Conflicts of Interest
References
- Karl, J.; Pröll, T. Steam gasification of biomass in dual fluidized bed gasifiers: A review. Renew. Sustain. Energy Rev. 2018, 98, 64–78. [Google Scholar] [CrossRef]
- Guo, S.; Wei, X.; Li, J.; Che, D.; Liu, H.; Sun, B.; Wang, Q. Experimental Study on Product Gas and Tar Removal in Air−Steam Gasification of Corn Straw in a Bench-Scale Internally Circulating Fluidized Bed. Energy Fuels 2020, 34, 1908–1917. [Google Scholar] [CrossRef]
- Chianese, S.; Fail, S.; Binder, M.; Rauch, R.; Hofbauer, H.; Molino, A.; Blasi, A.; Musmarra, D. Experimental investigations of hydrogen production from CO catalytic conversion of tar rich syngas by biomass gasification. Catal. Today 2016, 277, 182–191. [Google Scholar] [CrossRef]
- Morris, J.D.; Daood, S.S.; Chilton, S.; Nimmo, W. Mechanisms and mitigation of agglomeration during fluidized bed combustion of biomass: A review. Fuel 2018, 230, 452–473. [Google Scholar] [CrossRef]
- Visser, H.J.; van Lith, S.C.; Kiel, J.H. Biomass Ash-Bed Material Interactions Leading to Agglomeration in FBC. J. Energy Resour. Technol. 2008, 130, 011801. [Google Scholar] [CrossRef]
- Bartels, M.; Lin, W.; Nijenhuis, J.; Kapteijn, F.; van Ommen, J.R. Agglomeration in fluidized beds at high temperatures: Mechanisms, detection and prevention. Prog. Energy Combust. Sci. 2008, 34, 633–666. [Google Scholar] [CrossRef]
- Siddiqui, H.; Thengane, S.K.; Sharma, S.; Mahajani, S.M. Revamping downdraft gasifier to minimize clinker formation for high-ash garden waste as feedstock. Bioresour. Technol. 2018, 266, 220–231. [Google Scholar] [CrossRef]
- George, J.; Arun, P.; Muraleedharan, C. Experimental investigation on co-gasification of coffee husk and sawdust in a bubbling fluidised bed gasifier. J. Energy Inst. 2019, 92, 1977–1986. [Google Scholar] [CrossRef]
- Kittivech, T.; Fukuda, S. Investigating Agglomeration Tendency of Co-Gasification between High Alkali Biomass and Woody Biomass in a Bubbling Fluidized Bed System. Energies 2019, 13, 56. [Google Scholar] [CrossRef] [Green Version]
- Fryda, L.E.; Panopoulos, K.D.; Kakaras, E. Agglomeration in fluidised bed gasification of biomass. Powder Technol. 2008, 181, 307–320. [Google Scholar] [CrossRef]
- Schmid, J.C.; Wolfesberger, U.; Koppatz, S.; Pfeifer, C.; Hofbauer, H. Variation of feedstock in a dual fluidized bed steam gasifier—Influence on product gas, tar content, and composition. Environ. Prog. Sustain. Energy 2012, 31, 205–215. [Google Scholar] [CrossRef]
- Wolfesberger-Schwabl, U.; Aigner, I.; Hofbauer, H. Mechanism of Tar Generation during Fluidized Bed Gasification and Low Temperature Pyrolysis. Ind. Eng. Chem. Res. 2012, 51, 13001–13007. [Google Scholar] [CrossRef]
- Valin, S.; Ravel, S.; Guillaudeau, J.; Thiery, S. Comprehensive study of the influence of total pressure on products yields in fluidized bed gasification of wood sawdust. Fuel Process. Technol. 2010, 91, 1222–1228. [Google Scholar] [CrossRef]
- Good, J.; Ventress, L.; Knoef, H.; Zielke, U.; Lyck Hansen, P.; van de Kamp, W.; de Wild, P.; Coda, B.; van Paasen, S.; Kiel, J.; et al. Sampling and Analysis of Tar and Particles in Biomass Producer Gases; Technical Report prepared under CEN BT/TF 143 “Organic contaminants (“tar”) in biomass producer gases”; July 2005. Available online: www.eeci.net/results/pdf/Technical-Report-version-3_8-final.pdf (accessed on 9 December 2009).
- Defoort, F.; Campargue, M.; Ratel, G.; Miller, H.; Dupont, C. Physicochemical Approach to Blend Biomass. Energy Fuels 2019, 33, 5820–5828. [Google Scholar] [CrossRef]
- Ergudenler, A.; Ghaly, A.E. Agglomeration of silica sand in a fluidized bed gasifier operating on wheat straw. Biomass Bioenergy 1993, 4, 135–147. [Google Scholar] [CrossRef]
- Koppatz, S.; Schmid, J.C.; Pfeifer, C.; Hofbauer, H. The Effect of Bed Particle Inventories with Different Particle Sizes in a Dual Fluidized Bed Pilot Plant for Biomass Steam Gasification. Ind. Eng. Chem. Res. 2012, 51, 10492–10502. [Google Scholar] [CrossRef]
- Bale, C.W.; Bélisle, E.; Chartrand, P.; Decterov, S.A.; Eriksson, G.; Gheribi, A.E.; Hack, K.; Jung, I.H.; Kang, Y.B.; Melançon, J.; et al. FactSage thermochemical software and databases, 2010–2016. Calphad 2016, 54, 35–53. [Google Scholar] [CrossRef] [Green Version]
- Hack, K.; Jantzen, T.; Müller, M.; Yazhenskikh, E.; Wu, G. A novel thermodynamic database for slag systems and refractory materials. In Proceedings of the 5th International Congress on the Science and Technology of Steelmaking, Dresden, Germany, 1–3 October 2012. [Google Scholar]
- Zhou, C.; Rosén, C.; Engvall, K. Biomass oxygen/steam gasification in a pressurized bubbling fluidized bed: Agglomeration behavior. Appl. Energy 2016, 172, 230–250. [Google Scholar] [CrossRef]
- Tian, T.; Li, Q.; He, R.; Tan, Z.; Zhang, Y. Effects of biochemical composition on hydrogen production by biomass gasification. Int. J. Hydrog. Energy 2017, 42, 19723–19732. [Google Scholar] [CrossRef]
- Di Blasi, C. Modeling chemical and physical processes of wood and biomass pyrolysis. Prog. Energy Combust. Sci. 2008, 34, 47–90. [Google Scholar] [CrossRef]
- Carpenter, D.L.; Bain, R.L.; Davis, R.E.; Dutta, A.; Feik, C.J.; Gaston, K.R.; Jablonski, W.; Phillips, S.D.; Nimlos, M.R. Pilot-Scale Gasification of Corn Stover, Switchgrass, Wheat Straw, and Wood: 1. Parametric Study and Comparison with Literature. Ind. Eng. Chem. Res. 2010, 49, 1859–1871. [Google Scholar] [CrossRef]
- Hanaoka, T.; Inoue, S.; Uno, S.; Ogi, T.; Minowa, T. Effect of woody biomass components on air-steam gasification. Biomass Bioenergy 2005, 28, 69–76. [Google Scholar] [CrossRef]
- Mauerhofer, A.M.; Müller, S.; Benedikt, F.; Fuchs, J.; Bartik, A.; Hofbauer, H. CO2 gasification of biogenic fuels in a dual fluidized bed reactor system. Biomass Convers. Biorefin. 2019. [Google Scholar] [CrossRef] [Green Version]
- Balland, M.; Froment, K.; Ratel, G.; Valin, S.; Roussely, J.; Michel, R.; Poirier, J.; Kara, Y.; Galnares, A. Biomass Ash Fluidised-Bed Agglomeration: Hydrodynamic Investigations. Waste Biomass Valor 2017, 8, 2823–2841. [Google Scholar] [CrossRef]
- Balland, M. Gazéification de Biomasse en lit Fluidisé: Etude Phénoménologique de L’agglomération liée à la Fusion des Cendres. Ph.D. Thesis, Université d’Orléans, Orléans, France, 2016. [Google Scholar]


| Content or Characteristic | Beech Wood | Lignin Residue | Bark | Wheat Straw | Bark/Wheat Straw (85/15 wt%) | Bark/Wheat Straw (50/50 wt%) |
|---|---|---|---|---|---|---|
| Moisture content | 8.30% | 7.40% | 5.70% | 4.0% | 4.1% | |
| Ash at 550 °C | 0.7% | 4.36% | 11.68% | 8.0% | 11.6% | 10.5% |
| Ash at 815 °C | n.d. | 3.45% | 8.33% | n.d. | 8.98% | 8.49% |
| C | 49.6% | 55.0% | 46.8% | 46.7% | 45.7% | 45.1% |
| H | 5.7% | 5.4% | 5.2% | 5.3% | 4.9% | 5.2% |
| N | <0.3% | 1.34% | 0.57% | 0.72% | 0.6% | 0.6% |
| S | 0.041% | 0.15% | 0.10% | 0.10% | 0.1% (*) | 0.1% (*) |
| Cl | 0.03% | 0.262% | 0.0055% | 0.33% | 0.054% (*) | 0.17% (*) |
| O | n.d. | 37.3% | 41.3% | n.d. | 42.2% | 43.5% |
| Al | 36 ppm | 720 ppm | 1651 ppm | 110 ppm | 1574 ppm | 710 ppm |
| Ca | 1300 ppm | 2390 ppm | 29517 ppm | 4419 ppm | 27664 ppm | 20181 ppm |
| Fe | 59 ppm | 434 ppm | 1208 ppm | 117 ppm | 1275 ppm | 1163 ppm |
| Mg | 300 ppm | 575 ppm | 623 ppm | 873 ppm | 665 ppm | 691 ppm |
| Mn | 180 ppm | 13 ppm | n.d. | 76 ppm | 323 ppm | 243 ppm |
| P | 74 ppm | 1002 ppm | 267 ppm | 858 ppm | 344 ppm | 534 ppm |
| K | 730 ppm | 3244 ppm | 2806 ppm | 16404 ppm | 4421 ppm | 8120 ppm |
| Si | 380 ppm | 2468 ppm | 12090 ppm | 18134 ppm | 14702 ppm | 17144 ppm |
| Na | 71 ppm | 9022 ppm | 278 ppm | 48 ppm | 257 ppm | 185 ppm |
| Lower Heating Value (MJ/kg) | 18.1 | 21.14 | 16.78 | 16.51 | 16.74 (*) | 16.65 (*) |
| Parameter | Beech Wood | Lignin Residue | Bark | Bark/Wheat Straw (85/15 wt%) | Bark/Wheat Straw (50/50 wt%) |
|---|---|---|---|---|---|
| Biomass mean feeding rate (g/h) | 3618 | 3380 | 4017 | 3860 | 3693 |
| Steam/C (g/g) | 0.95 | 0.91 | 0.88 | 0.92 | 0.98 |
| Fluidisation ratio | 2.5 | 2.6 | 2.8 | 2.5 | 2.9 |
| Test duration (h) | 3.8 | 4.0 | 1.5 | 1.5 | 1.5 |
| Mass of ash theoretically accumulated (g) | 88 | 432 | 473 | 499 | 451 |
| Performance Indicator | Lignin Residue | Bark | Bark/Wheat Straw (85/15 wt%) | Bark/Wheat Straw (50/50 wt%) |
|---|---|---|---|---|
| Cold gas efficiency | 71 (±3.6)% | 81 (±4.1)% | 80 (±4.1)% | 77 (±3.9)% |
| Cold gas efficiency (without benzene and toluene) | 66 (±3.4)% | 78 (±4.0)% | 77 (±3.9)% | 73 (±3.7)% |
| Product gas LHV (MJ/Nm3) | 12.9 (±0.5) | 12.2 (±0.5) | 12.4 (±0.5) | 12.9 (±0.5) |
| Product gas yield (Nm3/kgdaf) | 1.21 (±0.07) | 1.22 (±0.07) | 1.19 (±0.07) | 1.09 (±0.06) |
| Hydrocarbon Class | Beech | Lignin Residue | Bark | Bark/Wheat Straw (85/15 wt%) | Bark/Wheat Straw (50/50 wt%) |
|---|---|---|---|---|---|
| Condensable Tar | 1.8 | 9.1 | 2.3 | 0.9 | 2.2 |
| BTX | 8.5 | 12.9 | 7.3 | 6.5 | 9.6 |
| Particle Size Range | Beech | Bark | Bark/Wheat Straw (85/15 wt%) | Bark/Wheat Straw (50/50 wt%) | Lignin Residue |
|---|---|---|---|---|---|
| 2.5–4.5 mm | 38% | 41% | 40% | 17% | |
| 0.9–2.5 mm | 62% | 43% | 41% | 39% | 15% |
| 0.63–0.9 mm | 6% | 43% | 43% | 37% | 19% |
| 0.5–0.63 mm | 5% | 43% | 47% | 38% | 31% |
| 0.2–0.5 mm | 97% (0.315–0.5 mm) | 98% | 99% | 99% | 93% |
| <0.2 mm | Not available | 56% | 57% | 68% | 62% |
| Filters | 28% | 51% | 49% | 42% | 27% |
| Cyclone | 31% | 36% | 38% | 34% | 24% |
© 2020 by the authors. Licensee MDPI, Basel, Switzerland. This article is an open access article distributed under the terms and conditions of the Creative Commons Attribution (CC BY) license (http://creativecommons.org/licenses/by/4.0/).
Share and Cite
Valin, S.; Ravel, S.; Pons de Vincent, P.; Thiery, S.; Miller, H.; Defoort, F.; Grateau, M. Fluidised Bed Gasification of Diverse Biomass Feedstocks and Blends—An Overall Performance Study. Energies 2020, 13, 3706. https://doi.org/10.3390/en13143706
Valin S, Ravel S, Pons de Vincent P, Thiery S, Miller H, Defoort F, Grateau M. Fluidised Bed Gasification of Diverse Biomass Feedstocks and Blends—An Overall Performance Study. Energies. 2020; 13(14):3706. https://doi.org/10.3390/en13143706
Chicago/Turabian StyleValin, Sylvie, Serge Ravel, Philippe Pons de Vincent, Sébastien Thiery, Hélène Miller, Françoise Defoort, and Maguelone Grateau. 2020. "Fluidised Bed Gasification of Diverse Biomass Feedstocks and Blends—An Overall Performance Study" Energies 13, no. 14: 3706. https://doi.org/10.3390/en13143706
APA StyleValin, S., Ravel, S., Pons de Vincent, P., Thiery, S., Miller, H., Defoort, F., & Grateau, M. (2020). Fluidised Bed Gasification of Diverse Biomass Feedstocks and Blends—An Overall Performance Study. Energies, 13(14), 3706. https://doi.org/10.3390/en13143706