Article

Method of Averaging the Effective Thermal Conductivity Based on Thermal Response Tests of Borehole Heat Exchangers

Laboratory of Geoenergetics, Faculty of Drilling, Oil and Gas, AGH University of Science and Technology, Al. Mickiewicza 30, 30-059 Krakow, Poland
*
Author to whom correspondence should be addressed.
Energies 2020, 13(14), 3737; https://doi.org/10.3390/en13143737
Submission received: 12 May 2020 / Revised: 14 July 2020 / Accepted: 15 July 2020 / Published: 20 July 2020
(This article belongs to the Special Issue Thermal Response Tests for Shallow Geothermal Systems)

Abstract

:
This work concerns borehole heat exchangers and their testing using apparatus for thermal response tests. In the theoretical part of the article, an equation was derived from the known equation of heat flow, on which the interpretation of the thermal response test was based. The practical part presents the results of several measurements taken in the AGH Laboratory of Geoenergetics. They were aimed at examining the potential heat exchange capacity between the heat carrier and rock mass. Measurement results in the form of graphs are shown in relation to the examined, briefly described wells. Result analysis made it possible to draw conclusions regarding the interpretation of the thermal response test. The method of averaging the measurement results was subjected to further study. The measuring apparatus recorded data at a frequency of one second, however such accuracy was too large to be analyzed efficiently. Therefore, an average of every 1 min, every 10 min, and every 60 min was proposed. The conclusions stemming from the differences in the values of effective thermal conductivity in the borehole heat exchanger, resulting from different data averaging, were described. In the case of three borehole heat exchangers, ground properties were identical. The effective thermal conductivity λeff was shown to depend on various borehole heat exchanger (BHE) designs, heat carrier flow geometry, and grout parameters. It is important to consider the position of the pipes relative to each other. As shown in the charts, the best (the highest) effective thermal conductivity λeff occurred in BHE-1 with a coaxial construction. At the same time, this value was closest to the theoretical value of thermal conductivity of rocks λ, determined on the basis of literature. The standard deviation and the coefficient of variation confirmed that the effective thermal conductivity λeff, calculated for different time intervals, showed little variation in value. The values of effective thermal conductivity λeff for each time interval for the same borehole exchanger were similar in value. The lowest values of effective thermal conductivity λeff most often appeared for analysis with averaging every 60 min, and the highest—for analysis with averaging every 1 min. For safety reasons, when designing (number of BHEs), safer values should be taken for analysis, i.e., lower, averaging every 60 min.

Graphical Abstract

1. Introduction

In the era of depleting conventional energy sources and increasingly pro-ecological policies, e.g., those of the European Union, it became natural to focus the attention on alternative energy sources. Among them are not only those safe for the environment, but also those with renewable resources. New solutions in the field of heating and air conditioning were developed [1]. Due to the rapid growth of geothermal energy development, individual users gaining independency in acquisition and distribution of geothermal energy became common. Geothermal energy based on heat pumps can support traditional installations, or, in favourable conditions, entirely replace them on quite a large scale [2].
An example of such solutions are borehole heat exchangers (BHEs) [3]. This article concerns research conducted in the Laboratory of Geoenergetics, Department of Drilling, Oil and Gas AGH UST [4,5], which aimed to analyze thermal response tests (TRTs). Based on the tests performed, the potential for heat exchange in the BHE [6] could be estimated. As a result, rational design of an underground thermal energy storage (UTES) became possible, particularly the determination of the number of boreholes required [7].
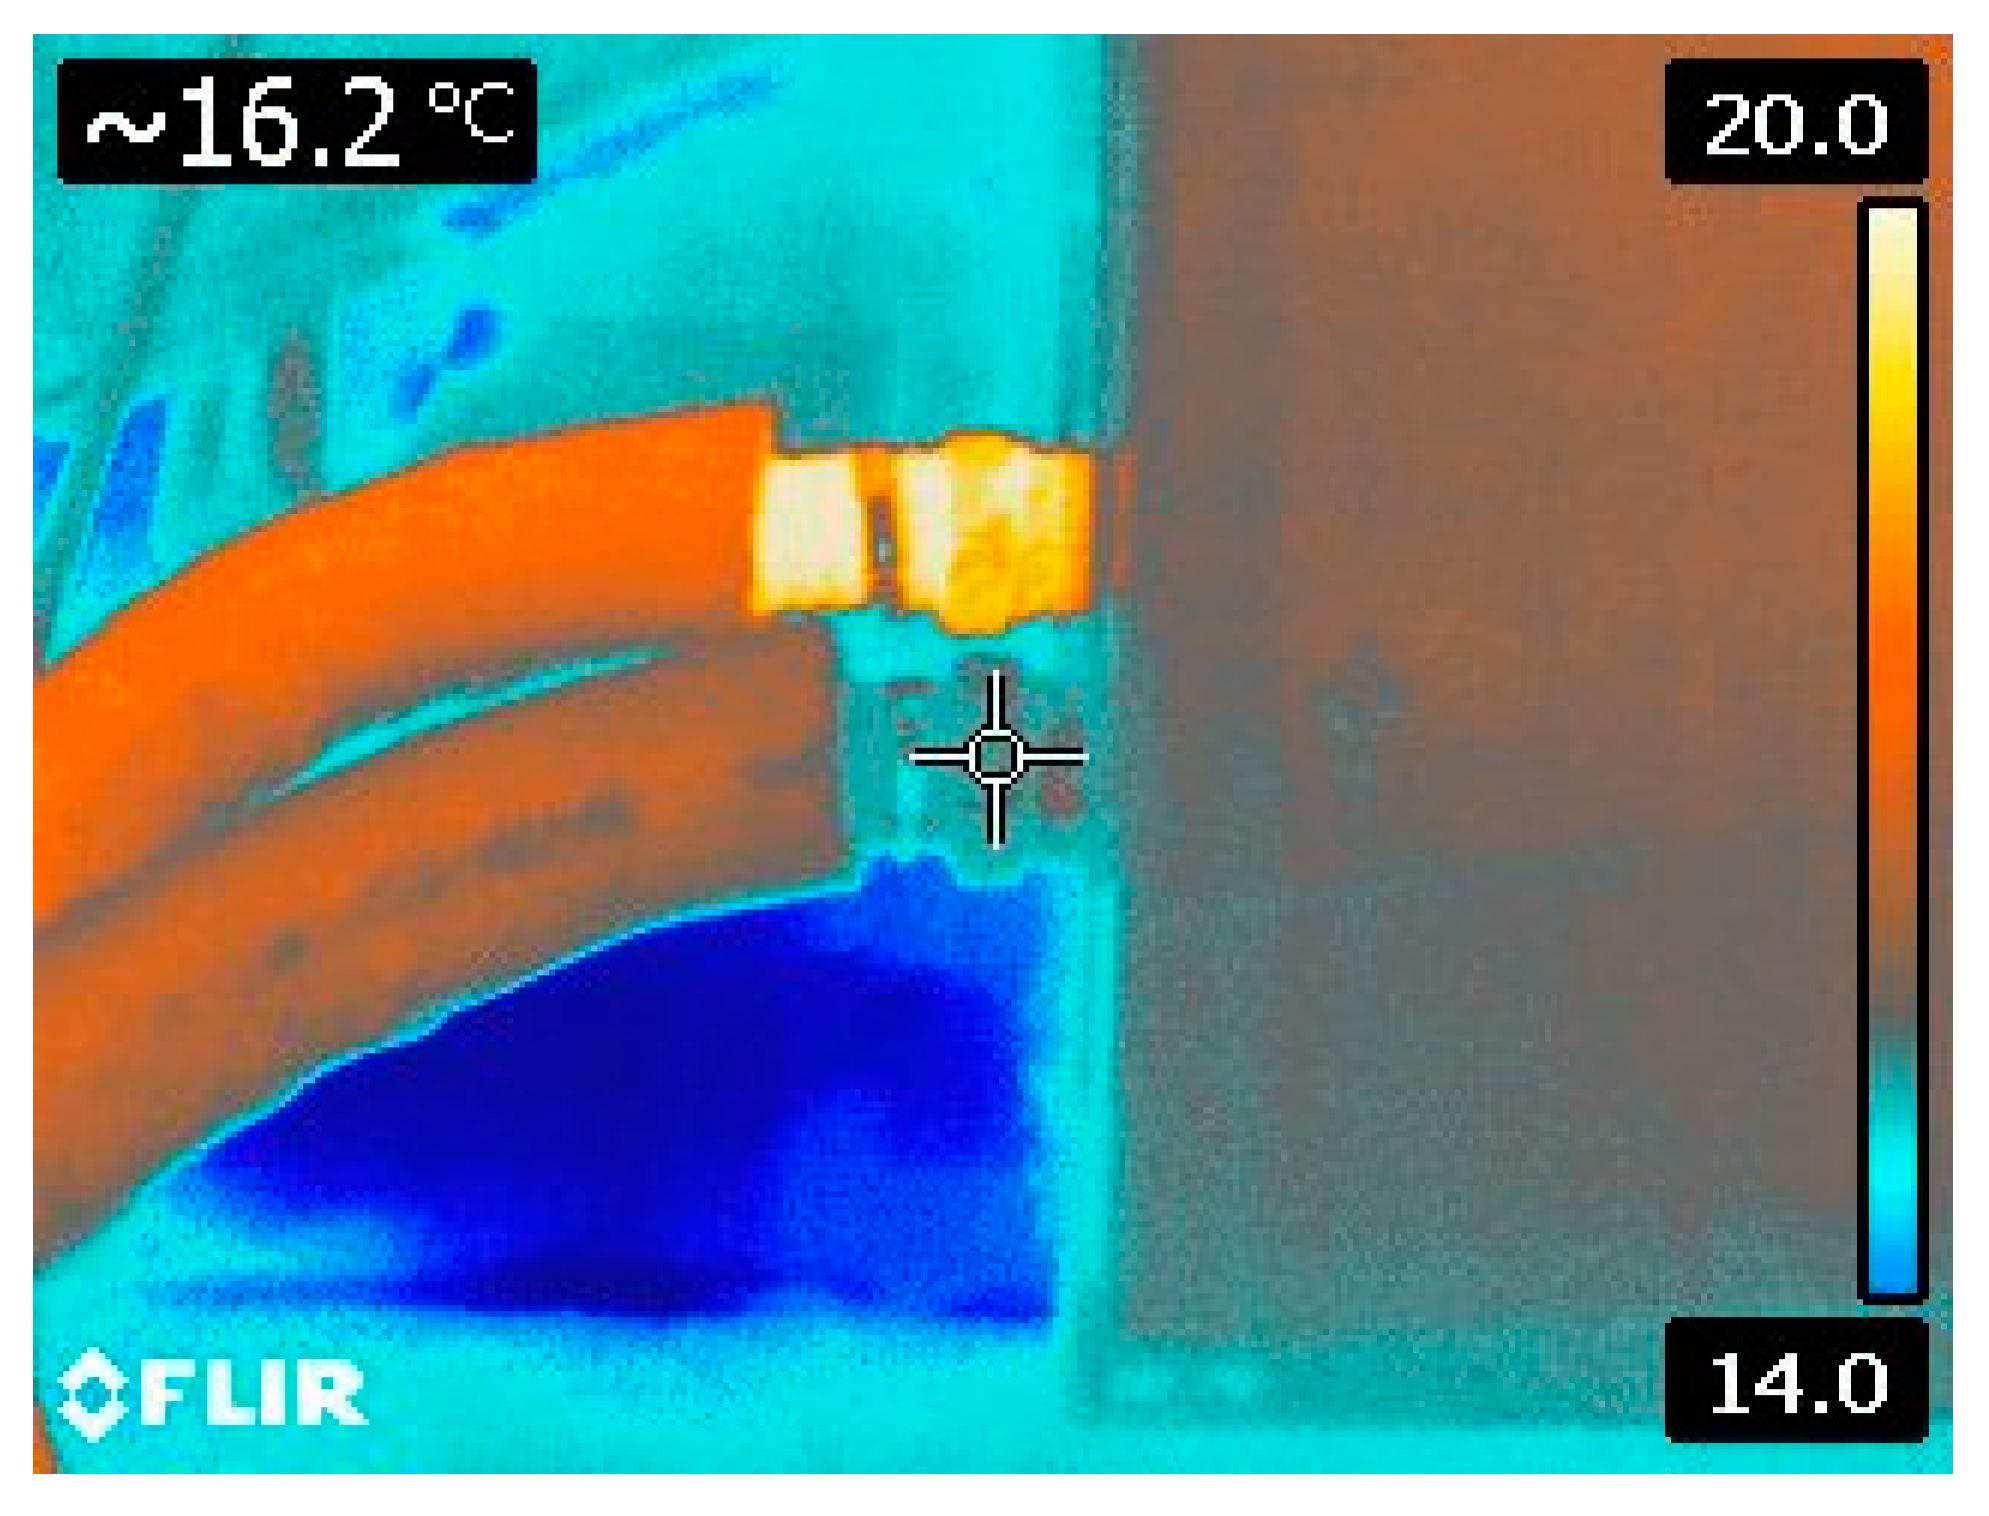
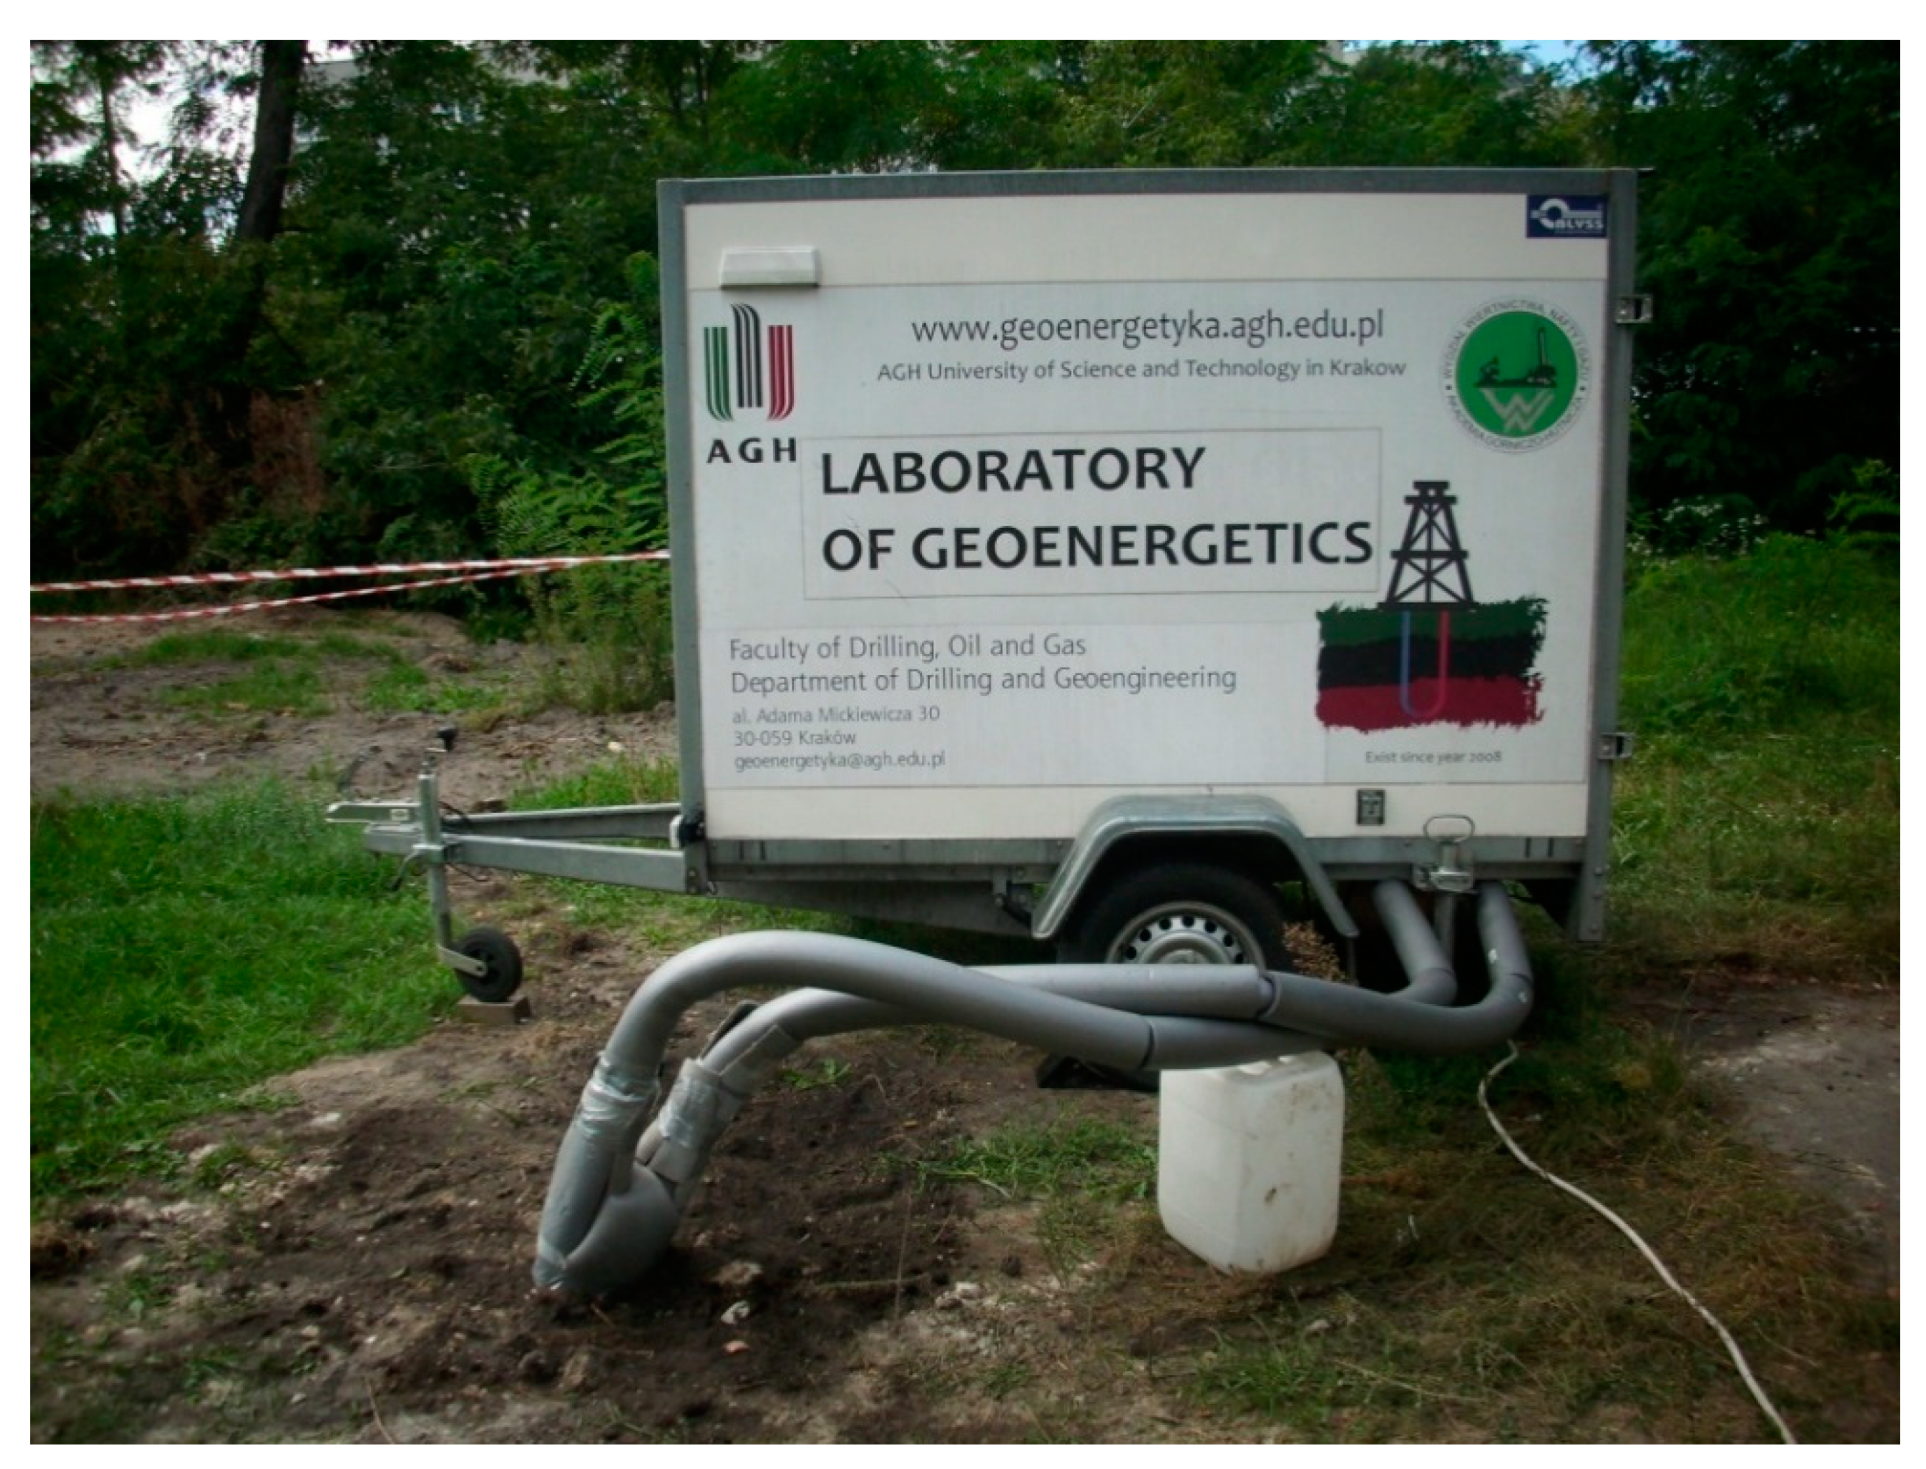
Correct and most accurate determination of the ground parameters is a key element when designing the installation of the so-called shallow geothermal energy [8]. One of the methods of temperature change determination in the BHE is to introduce a thermometer [9] based on fiber optic links into the exchanger. Sensors measure the flowing medium at a fixed depth [10]. In a classic thermal response test (Figure 1), the working fluid is heated on the surface and injected into the borehole heat exchanger. Based on the temperature changes obtained over time, further parameters are determined. A slightly different method is to use heating cables directly in the borehole and then monitor the heat flow after heating the rock mass [11]. In many cases of using vertical exchangers, thermal parameters of the ground are also influenced by subsurface waters [12]. In the event of their intensive occurrence, BHEs may interact with one another in a way that impairs or improves the parameters of the system (depending on their distribution), which should be especially considered in the process of system design [13]. Currently, this interaction becomes an increasingly considered parameter when determining the thermal parameters of the ground. Measuring circulation parameters of the heat carrier is conducted by using appropriate temperature and flow sensors (Figure 1) on the BHE [14]. Such solution ensures the measurement of a fluid’s temperature changes depending on the flow. The effect of the atmospheric environment in which the borehole heat exchanger is located is also worth noting (Figure 2). Temperature difference between the heat carrier in the connection pipes and atmospheric air can be significant. Depending on the method of averaging the results, the value of calculated effective thermal conductivity λeff in BHE may vary up to 10% from the value determined from tests [15]. The influence of atmospheric air on the TRT results depends on the length of the BHE’s connection to the apparatus and its thermal insulation (Figure 3).
TRT was developed mostly in Sweden [16]. A TRT is an indirect (in-situ) measurement method, which is the simplest and most exact way to determine precise thermal properties [17]. Thermal response tests were first suggested at an international conference in Stockholm [18]. A simple system was suggested, in which thermal energy at constant heating power was injected into a BHE while the BHE temperature was measured. Thermal response tests with mobile measurement equipment were first introduced in Sweden and USA in 1995. Since then, the method has developed and spread to several other countries in North America and Europe [17].
Until now, several studies regarding TRT have been conducted, e.g., [19,20,21,22,23]. Multiple modifications have been proposed, e.g., [24,25,26,27,28]. Traditional TRT applies a constant heating power to the pumped heat carrier [29]. The newer method, which holds the outflow heat carrier at a constant temperature, was shown to have many benefits, including shortening the test time and improving the operating constance and test exactness [30]. TRT can also be conducted numerically by simulating it in mathematical models [3,31,32].
Increasingly, the literature mentions the use of old, decommissioned boreholes, mainly oil wells [33,34]. The development of deep BHE installations reduces the cost of internal, heat insulating pipe column [35]. So far, there is no information in the literature about the implementation of TRT in a deep borehole.
The purpose of this article is to determine the effect of temperature measurement frequency during the TRT on its results. Temperature measurements, as well as the measurement of other parameters during the test, e.g., differential pressure [36], can be recorded at different frequencies (averaged). The article analyzes how it affects the calculated value of effective thermal conductivity λeff in BHE, which is a basic parameter determined during TRT.
Effective thermal conductivity λeff in BHE is not the same value like weighted average thermal conductivity of geological layers λ. Difference between λeff and λ is due to method imperfections. Basic TRT operational parameters are heating power and heat carrier flow rate. That values determine effective thermal conductivity λeff in BHE.
Different values of λeff are also observed in various BHE constructions when the geological condition is the same. Not only borehole thermal resistance Rb changes with various BHE constructions. One of the most important reasons are heat exchange area and velocity of heat carrier.
In the paper, only values of λeff in the function of measurement frequency are analyzed. Additional results are the comparison of values of λeff in different BHEs of Geoenergetics Laboratory.
The paper includes mathematical background of TRT. The described method is a classical/traditional method of effective thermal conductivity λeff in the BHE calculation. Next is the description of three different BHEs of Laboratory of Geoenergetics located at the Department of Drilling, Oil and Gas AGH UST. Next paragraph shows the results of TRT made on the BHEs. Interpretation of the results by different temperature measurement frequency during the TRT is described.
Many different commercial TRTs results are shown. On the basis of TRT data, the effect of frequency averaging of TRT results was determined. The paper finishes with conclusions and references.

2. Thermal Response Test

Thermal response test is based on Fourier’s generally known differential heat conduction equation, which in cylindrical coordinates is as follows [37]:
2 T r 2 + 1 r T r = ρ C p λ T t
where:
  • ρ—density of the medium, kg/m3,
  • cp—specific heat of the ground, J/(kgK),
  • λ—thermal conductivity of the ground, W/(mK),
  • T—temperature, K,
  • t—time, s,
  • r—radius, m.
Using the method proposed for the Theis equation in hydrogeology [38] to solve this type of differential equation, the substitution was used:
u = r 2 ρ C p 4 t λ
and
ρ C p = λ α
which is
u = r 2 4 α t
After appropriate transformations, Equation (1) takes the form of:
u 2 T u 2 + ( 1 + u ) T u = 0
After a series of transformations, a mathematical relationship is obtained:
T ( r , t ) = T 0 + q k π λ r 2 4 α t e x x dx
where:
  • q—unit heat transfer coefficient of the BHE, W/m,
  • T0—initial temperature in the BHE, K.
Formula 6 is the basic equation on which the interpretation of the thermal response tests of the borehole heat exchangers is based. For a long time period further solution is possible. In the evaluations made of German TRTs, the minimum duration criterion as noted by [39] proved helpful:
t min = 5 · r b 2 α
with tmin—lower time limit of data to be used for analysis and rb—borehole radius.
Considering the integral of the exponential function further:
u e x x dx
it can be represented using the additive property of the integral relative to the integration interval and the integral function as follows:
u e x x dx = [ 0 1 ( 1 e x ) dx x 1 e x x dx + 1 u dx x 0 u ( 1 e x ) dx x ]
By replacing the values of the integral with its approximate value, a relation is eventually obtained:
T ( r , t ) T 0 + q 4 π λ [ ln ( 4 α t r 2 ) γ ]
Test results show the relation between the heat carrier temperature and time. This allows for calculation of the effective thermal conductivity λeff according to the formula [29]:
λ ef = P 4 · π · k · H
where:
  • P—mean heating power during the TRT, W,
  • H—depth of the borehole heat exchanger, m,
  • k—the slope of the trend line—a straight line determined as the ratio of the mean temperature to the logarithm of the natural test time.
According to the mathematical model, effective thermal conductivity is identical to the thermal conductivity of the medium (rock mass). In reality, this value also depends on:
  • the design of the borehole heat exchanger,
  • TRT parameters, and
  • how the measurement results are averaged, as shown in this article. Its aim is to show the diversity of the final measurement results, which can be regarded as a manifestation of their uncertainty.

3. The Scope of the Conducted Research

Laboratory of Geoenergetics located at the Department of Drilling, Oil and Gas AGH UST contains borehole heat exchangers of different designs [4]. Three of them were subjected to the described research, short characteristics of which are given in Table 1. The location of aforementioned BHEs is shown in Figure 4. Similar studies for various BHE designs have already been described in literature [1,12,26].
The study consisted of determining the effective thermal conductivity λeff in the borehole, which depended primarily on the thermal conductivity of the rocks in the lithological profile. Drilled lithological profile is presented in Table 2 [40].
Values of the thermal conductivity of rocks were determined based on literature data [12,41,42].
The measuring apparatus (Figure 3) consisted of two modules together with a computer controlling and recording data (Figure 5). It corresponds to the schematic of thermal response test devices and operation from Figure 1. The first module included electric heaters and a circulation pump, the second consisted of flow meters and thermometers. The computer program recorded all data necessary to calculate subsequent parameters. These data included the exact date and time from the start of the measurement, the temperature of the heating agent at the inflow and outflow of the borehole heat exchanger, the outside temperature, the difference in pressure at the inflow and outflow of the borehole heat exchanger, and the accumulated electricity.
Measurement results were recorded every second with time stabilization provided by the computer processor. The precision of the measurement time recording was high and equaled 0.2 milliseconds. Temperature measurements were performed with thermometers with an accuracy class of 1%. Flow meters had an average accuracy of 5%, up to 2% in an optimal operating range.
Data from TRT were obtained by summing all the records from every second and dividing by their number every 1 min, 10 min, and 1 h, which is a classic arithmetic mean. It was originally assumed that the median was an average value, but such averaging was more time consuming. Due to the very small differences between the median and the arithmetic mean, and a significantly shorter time of determining the latter estimator, it was decided to calculate the arithmetic mean. Data recording on the disc was carried out with precision to two decimal places.

4. Measurement Results

Presented results include measurements for three boreholes of the Laboratory of Geoenergetics (number 1, 3, and 5). Each time, the test was preceded by a 24-h rinsing period without heating the heat carrier in order to effectively vent the system and equalize the temperature in the rock mass. In the next stage, heaters were started with a set power and worked for 100 h. This time ensured the stabilization of the effective thermal conductivity value, which is a basic parameter in the BHE measurements. On this basis, the ability of the rock mass to dissipate/store heat could be determined. The assumed heating power with which the heaters heated the working fluid was 2.8 kW. The heat carrier flow capacity was 20 dm3/min.
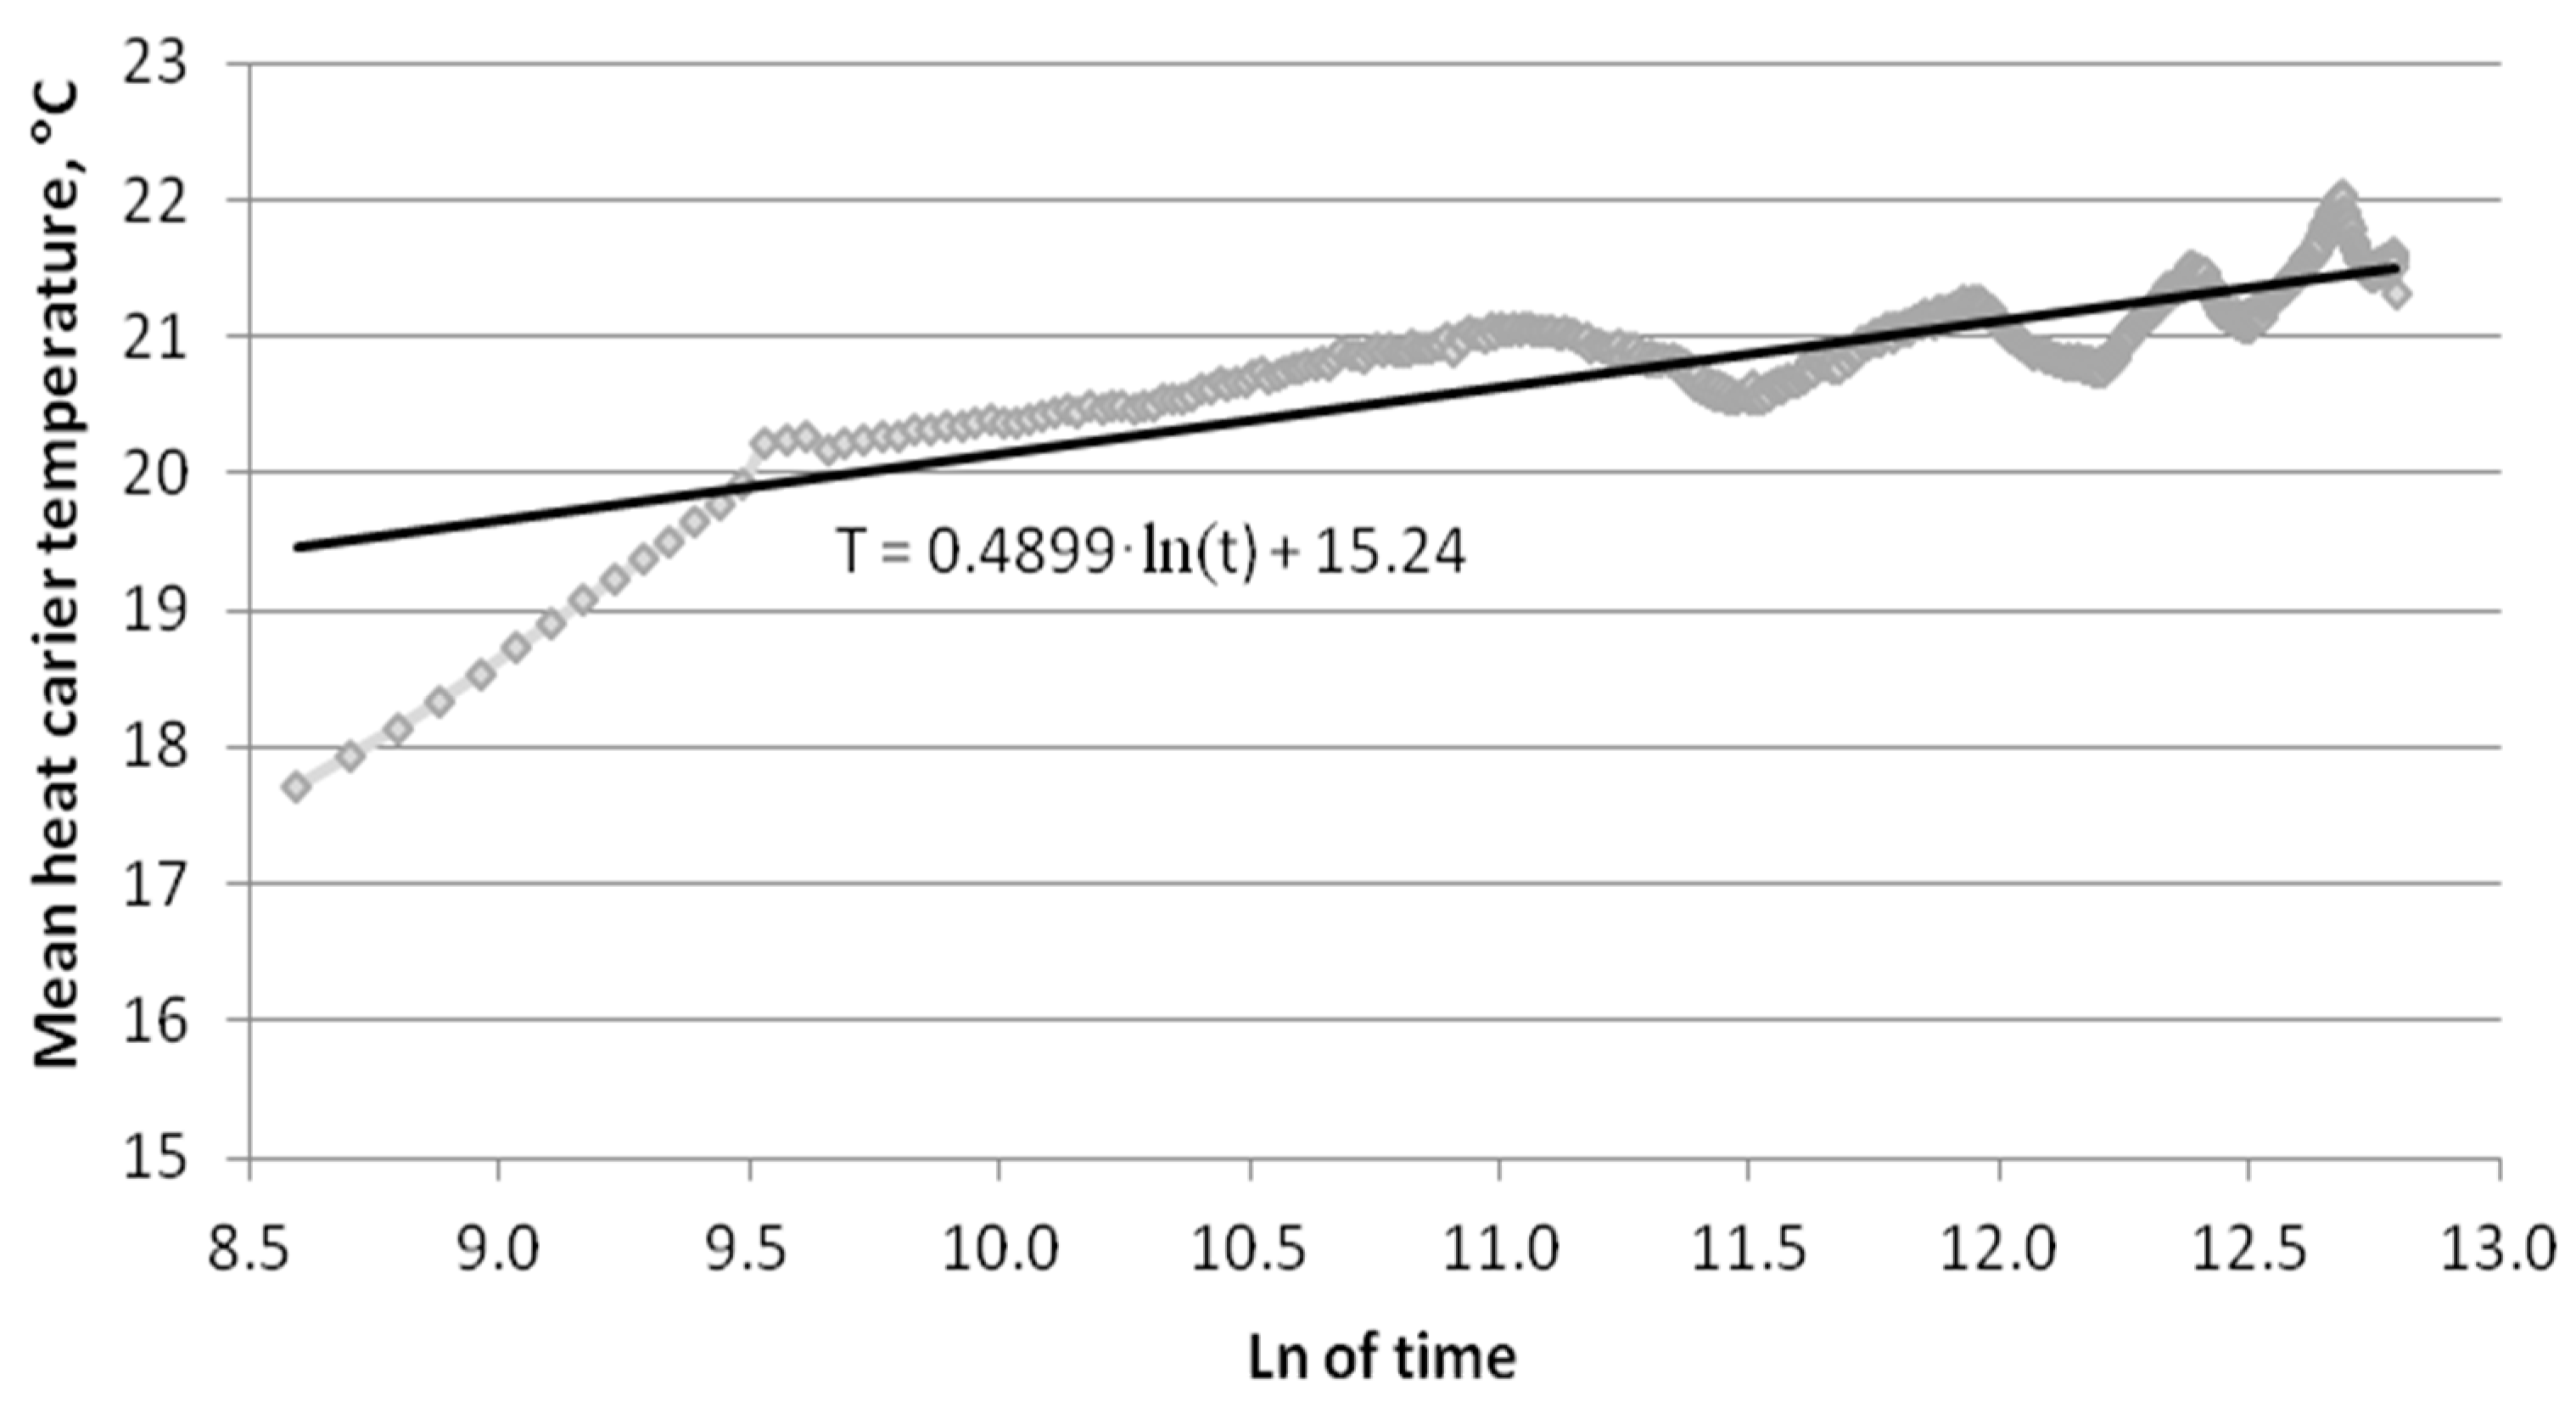
Effective thermal conductivity was calculated from Formula 10. The slope factor of the straight line k was determined with Microsoft Excel using the REGLINP function. It uses the least squares method.
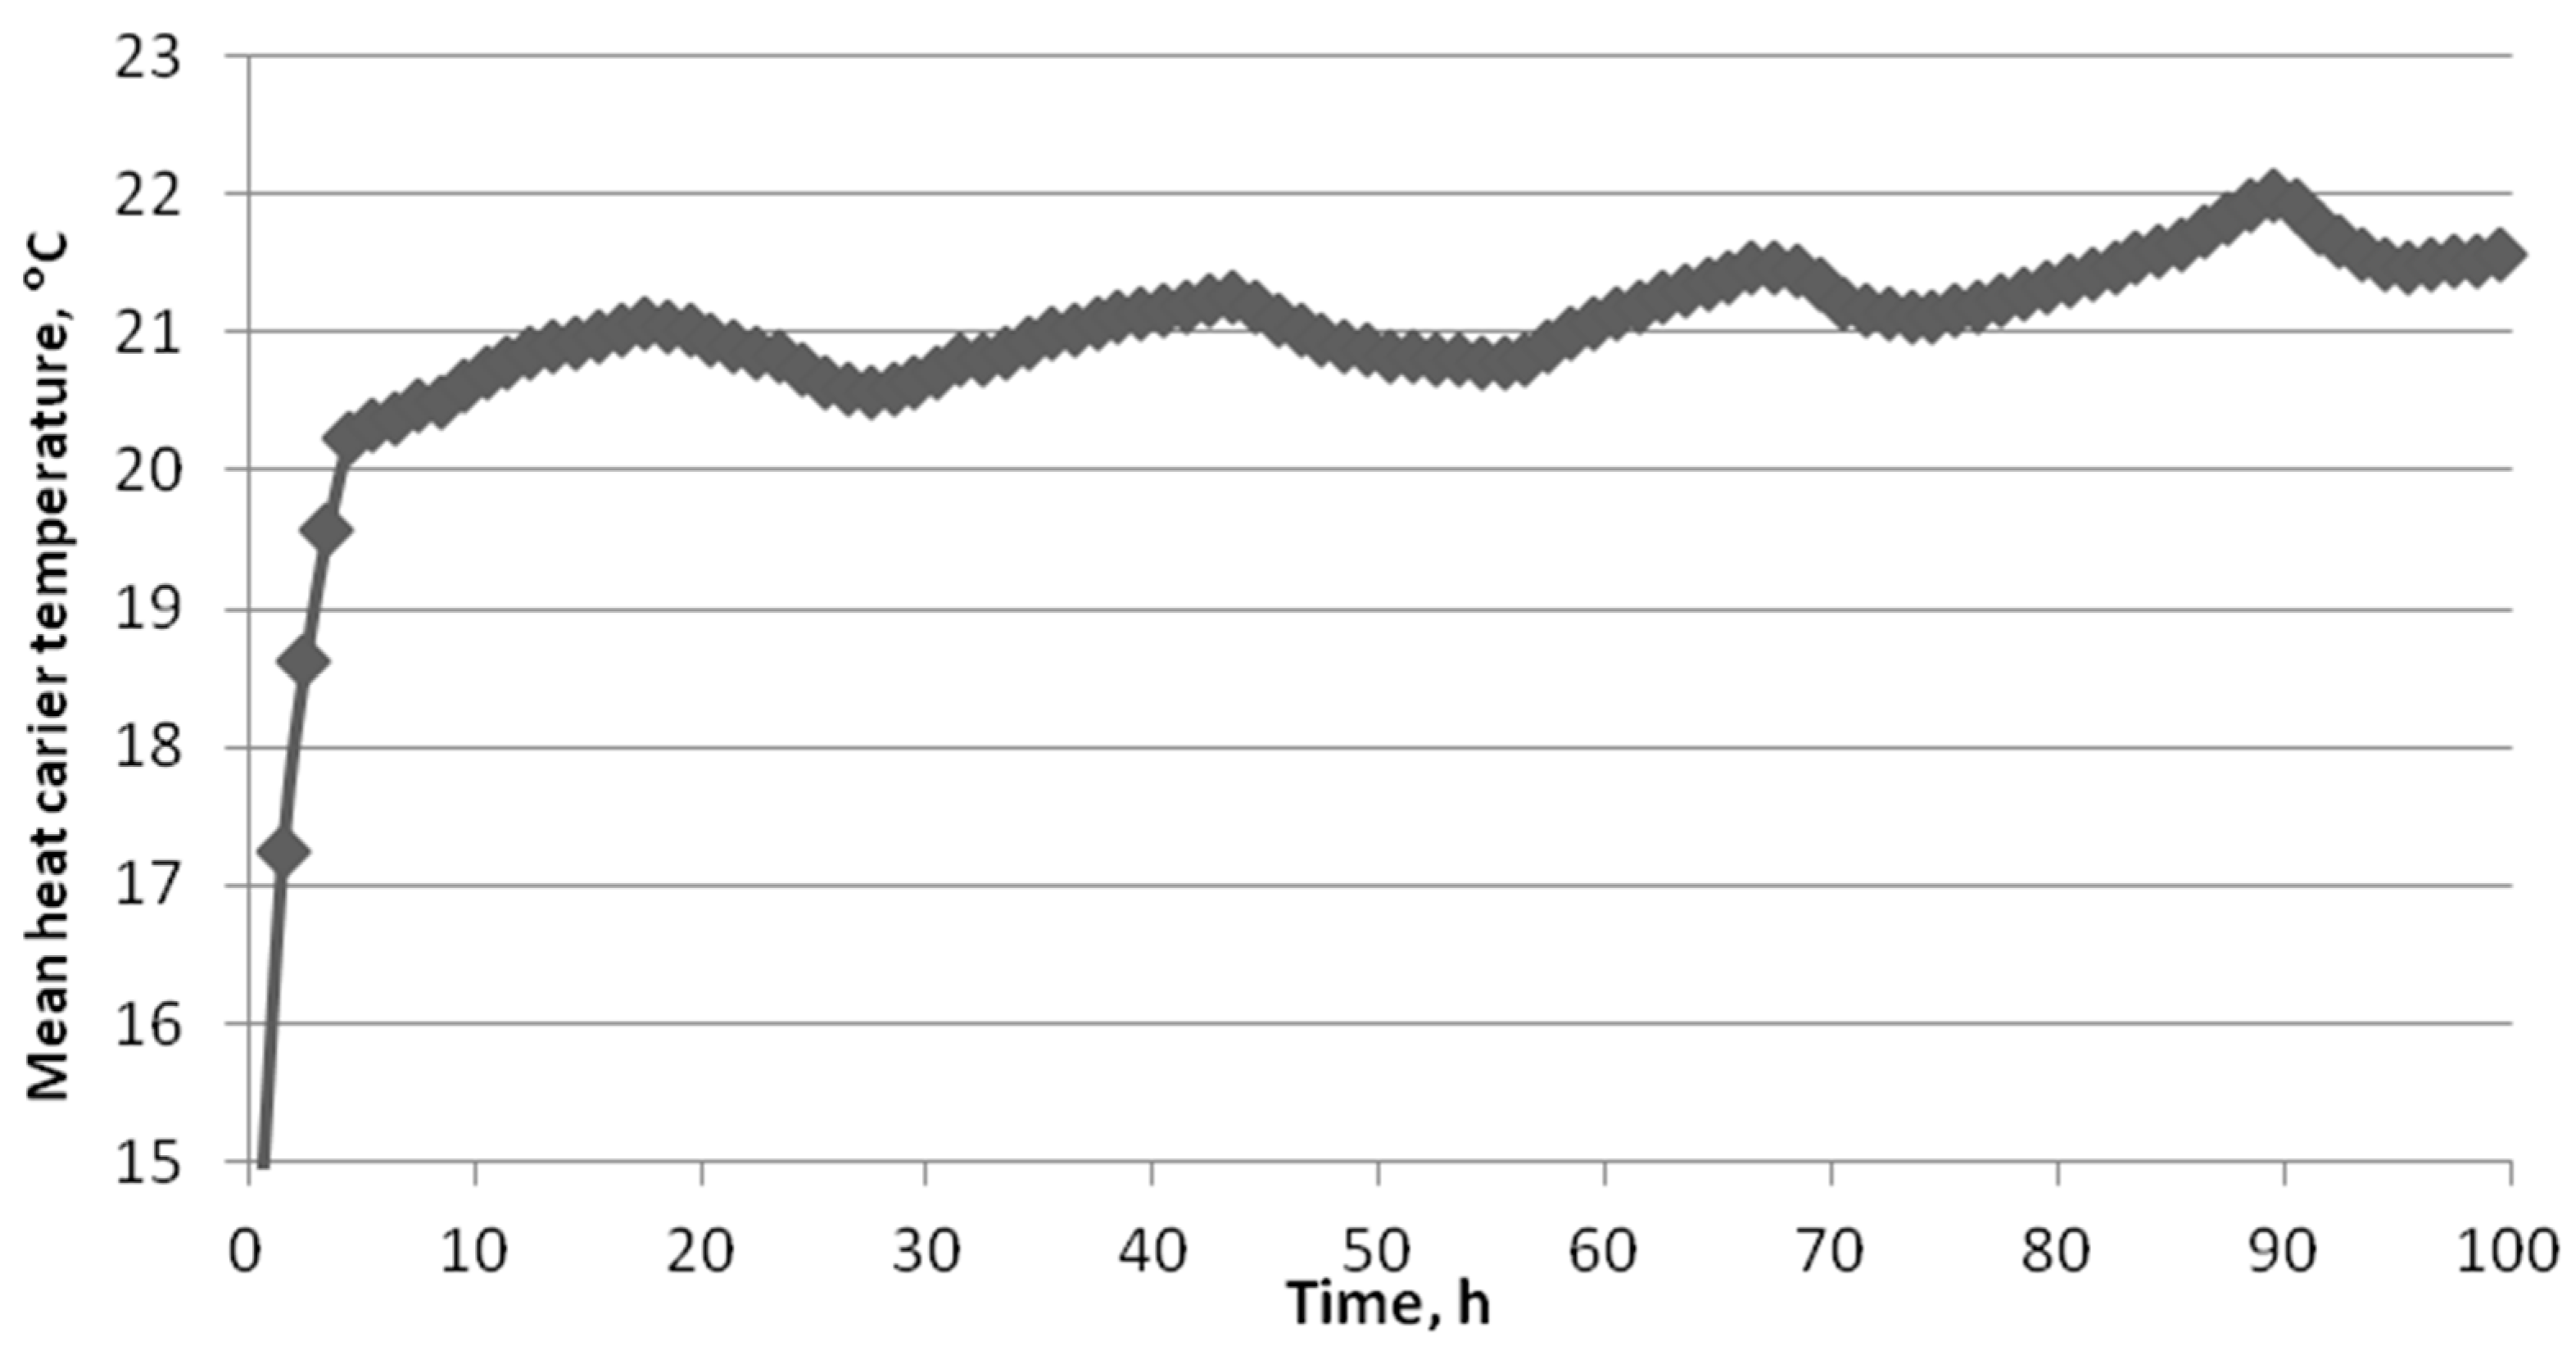
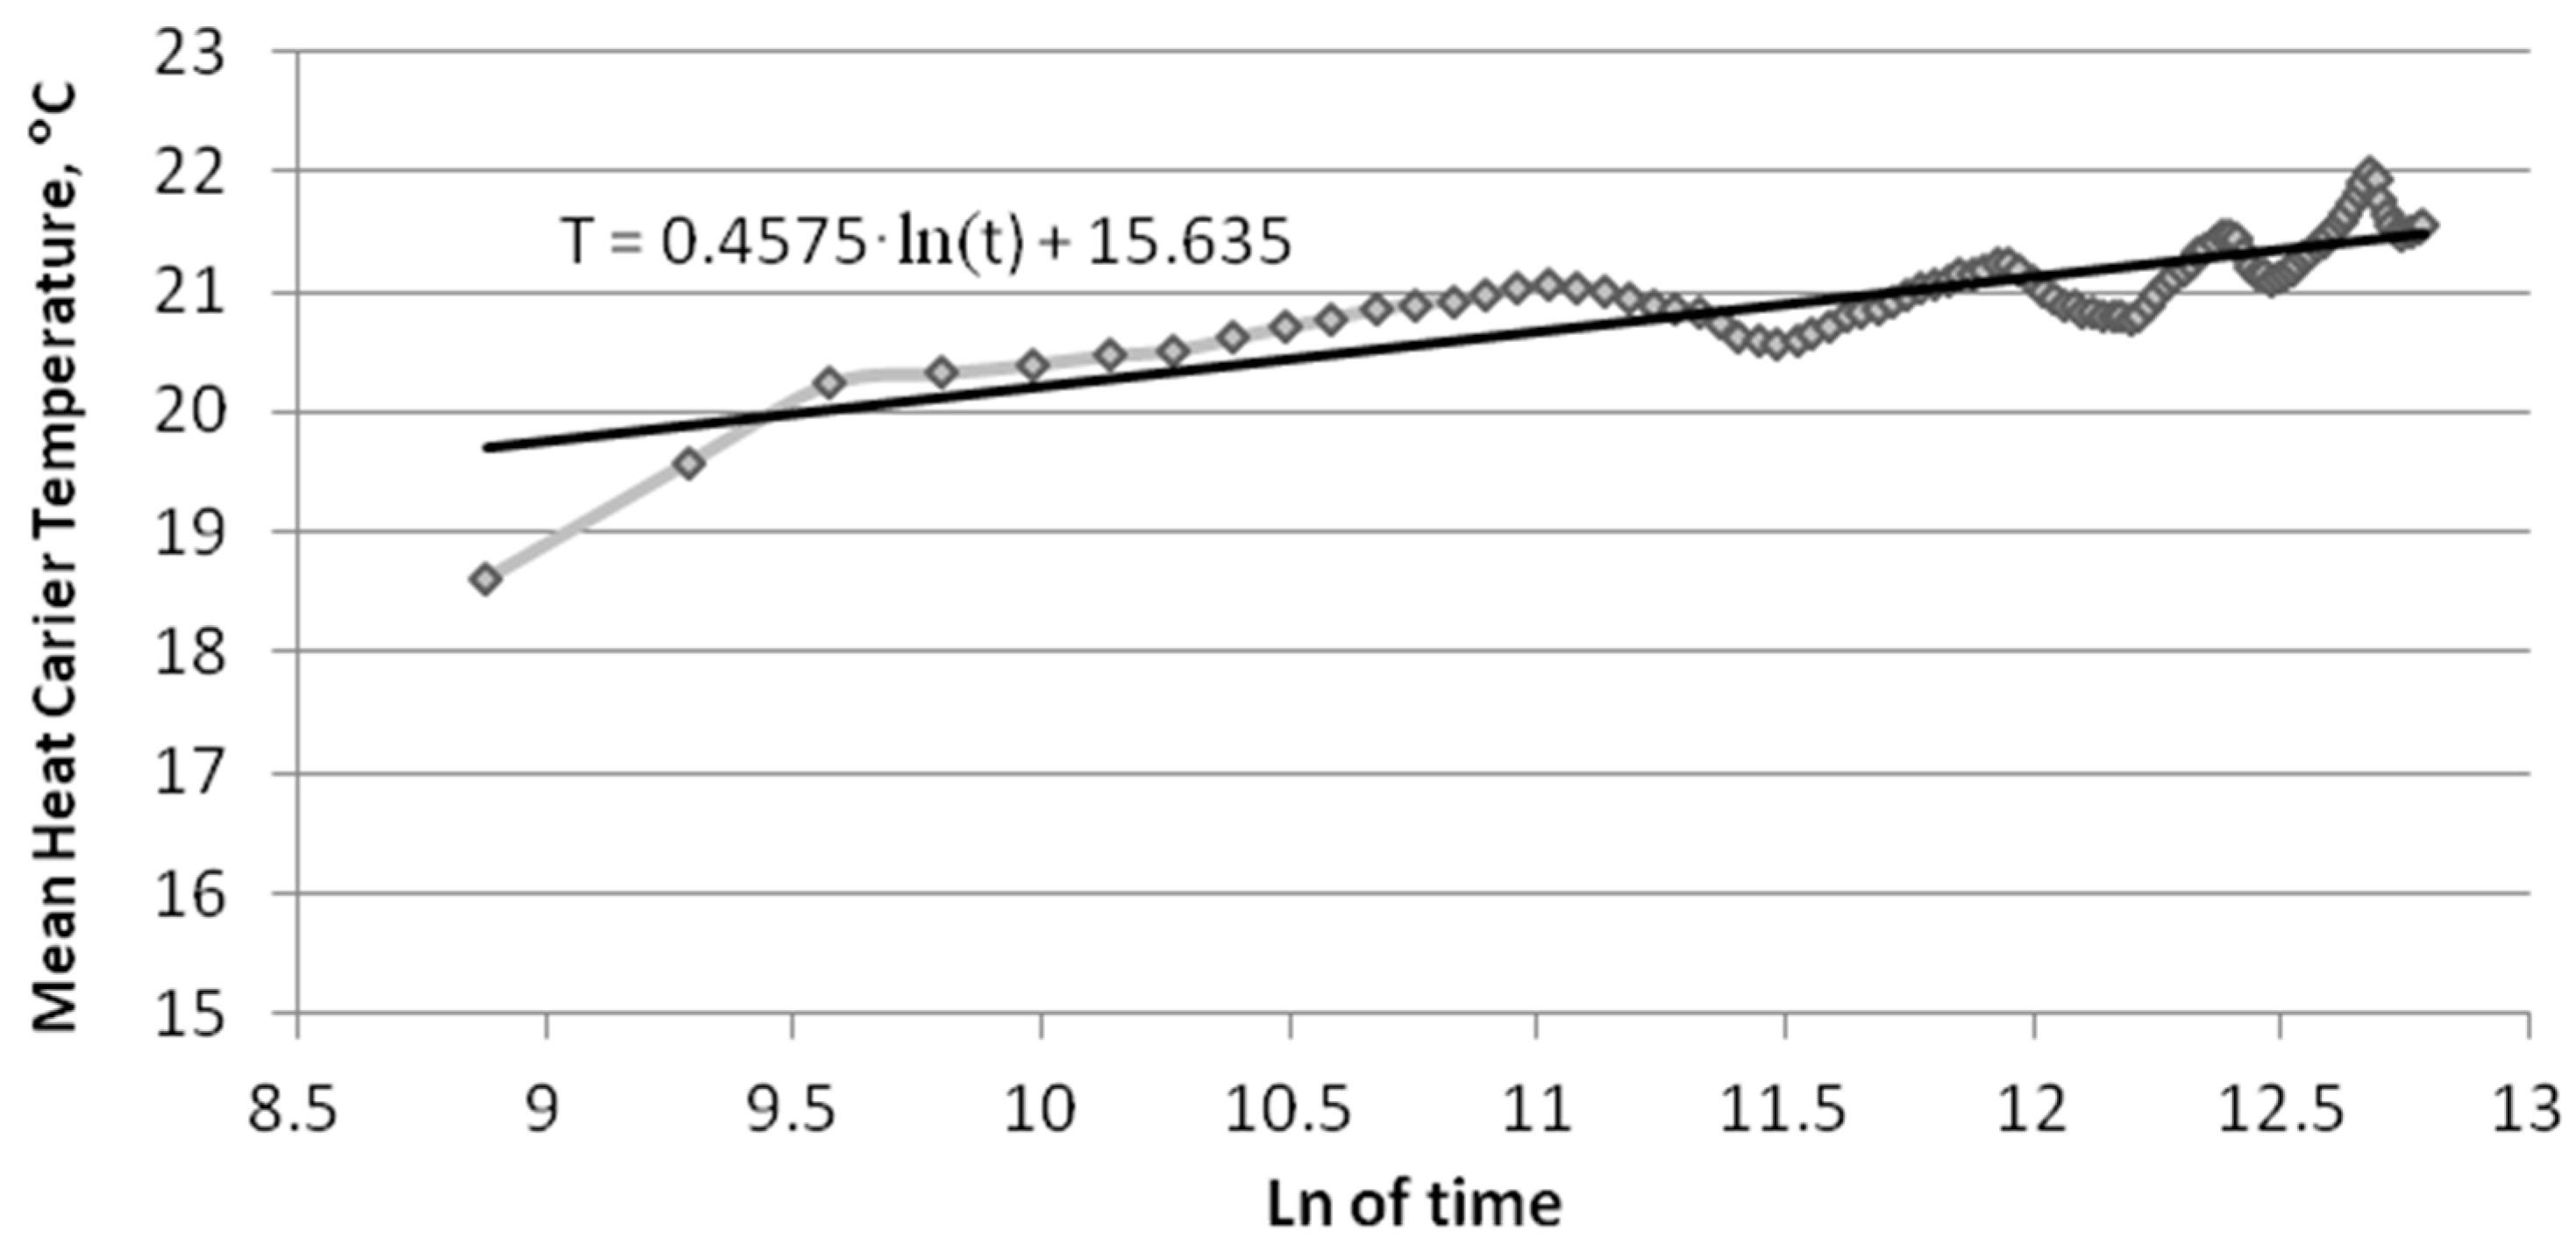
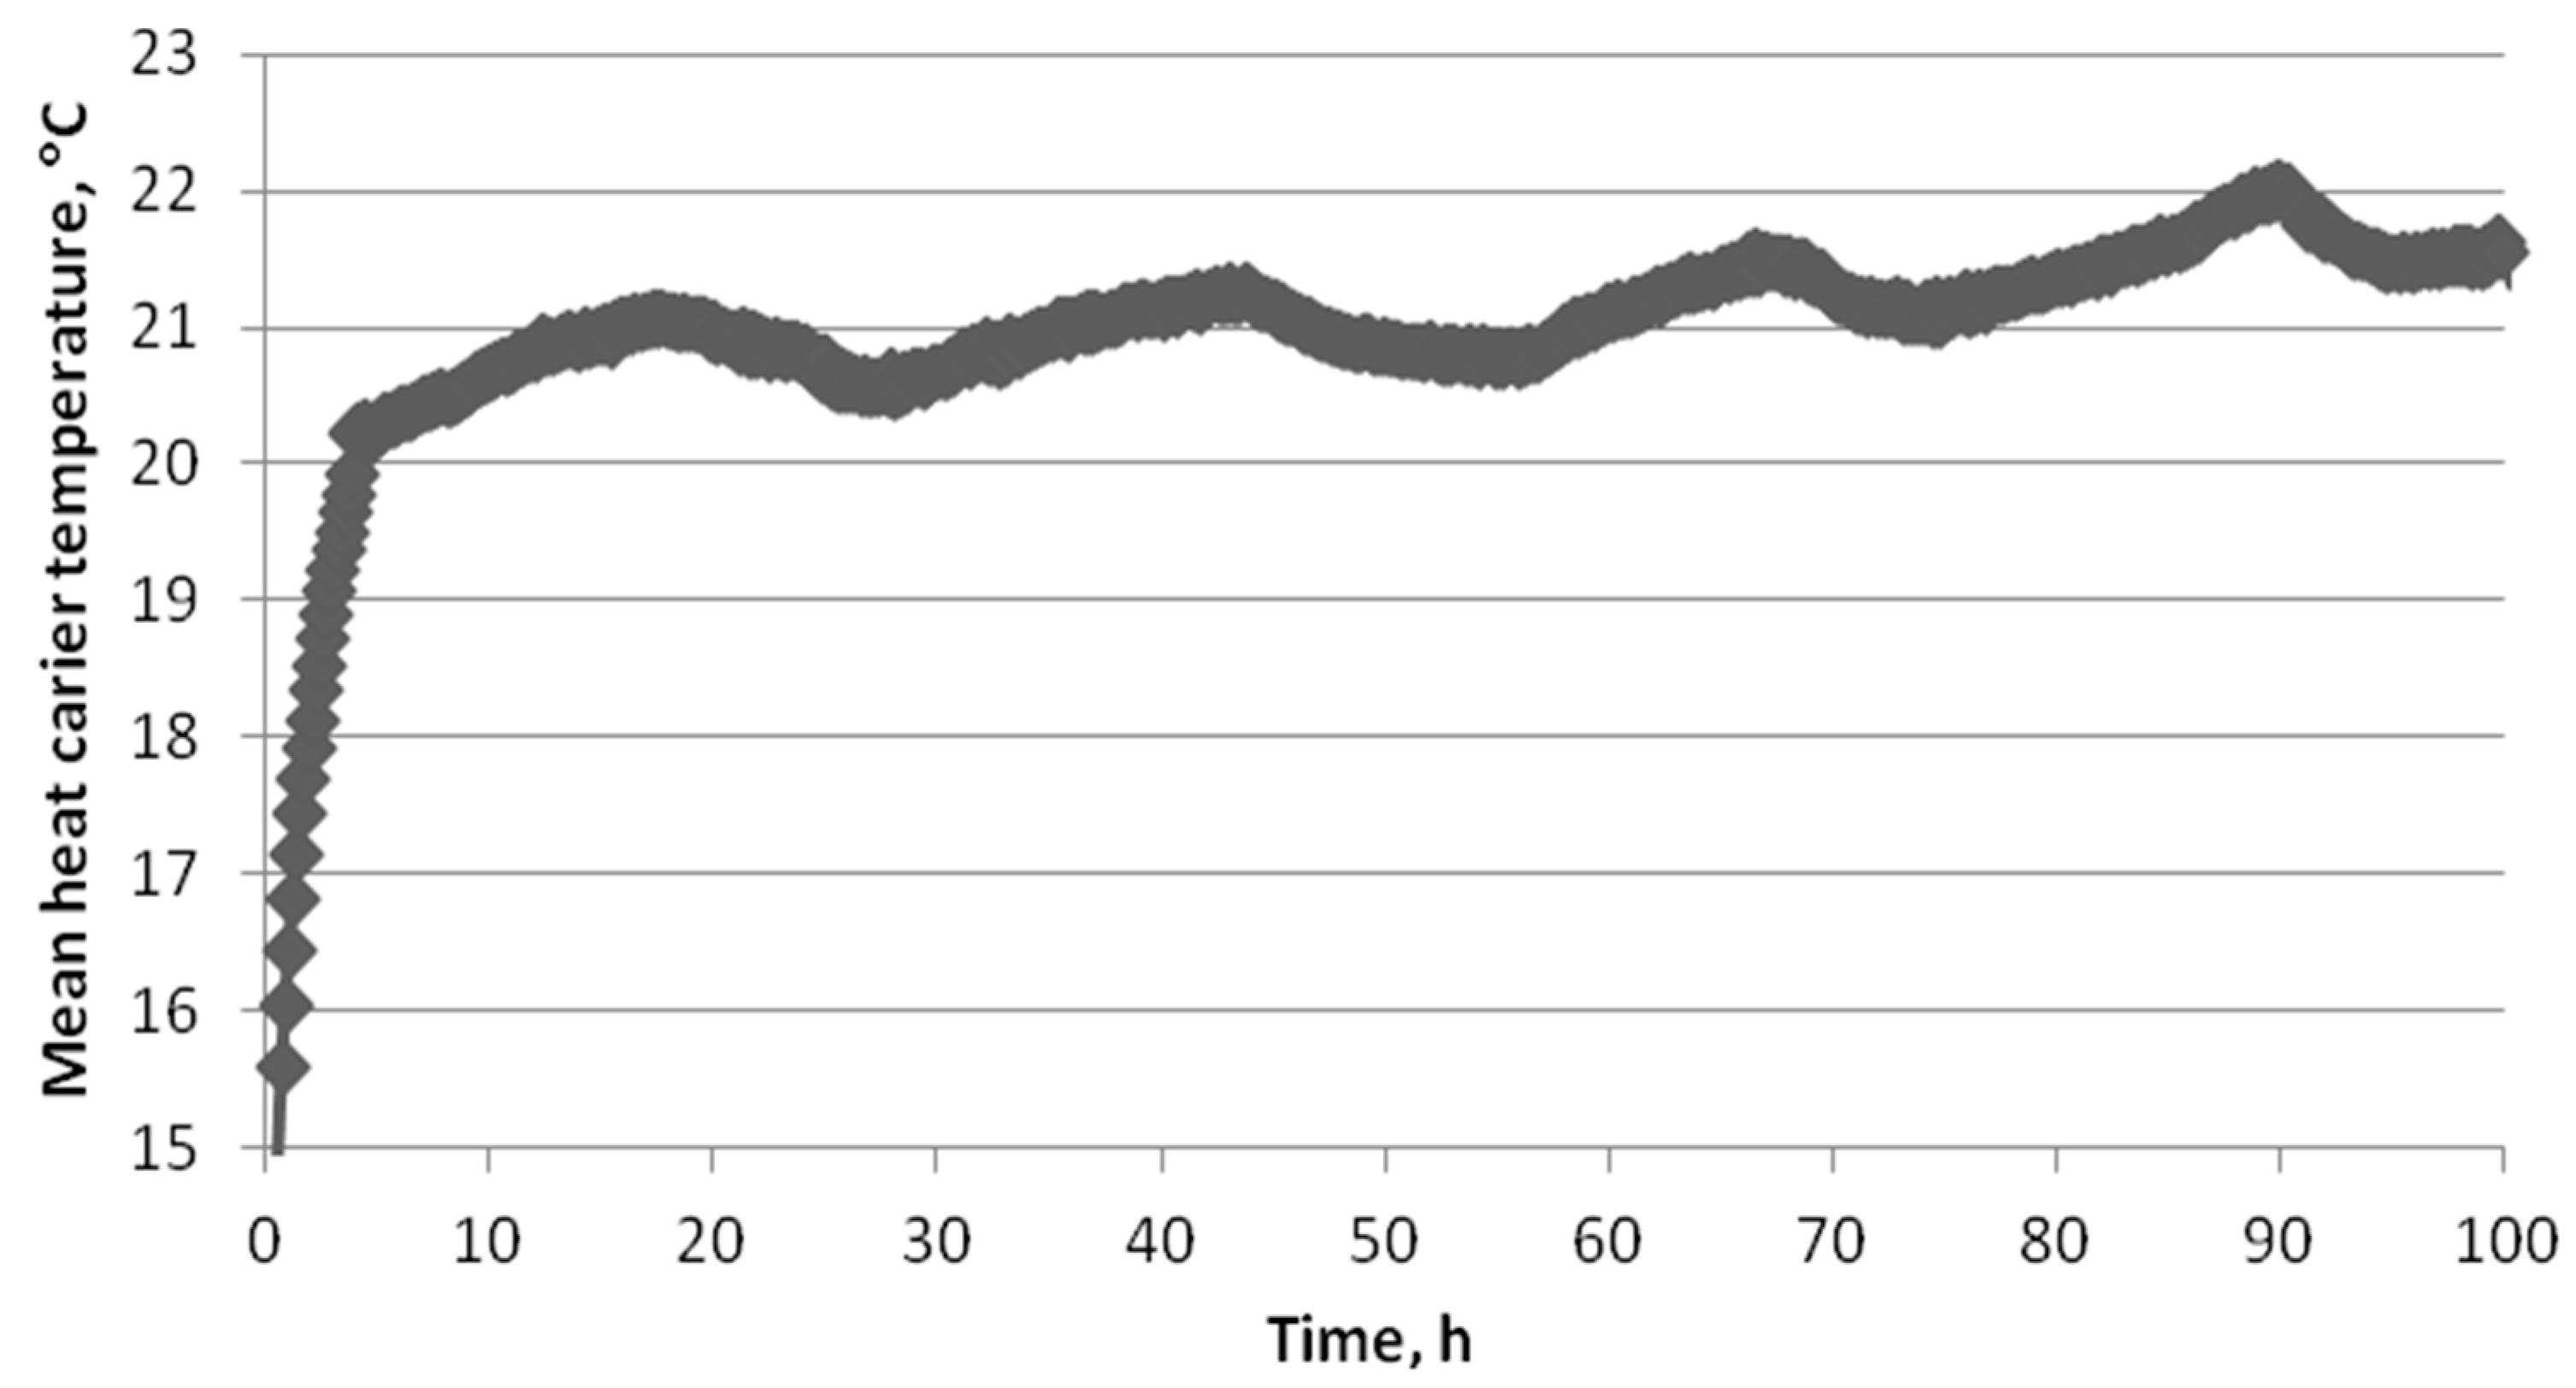
The distribution of the average temperature in the graphs according to the time intervals of data averaging (every 1 min, 10 min, and 1 h) are shown in Figure 6, Figure 7, Figure 8, Figure 9, Figure 10 and Figure 11. Figure 6 shows the measurement results for the borehole No. 1, with the measurement data averaging every 1 h. Figure 7 shows the same relationship but in a semi-logarithmic plot. Figure 8 shows the measurement results for borehole No. 3, with the measurement data averaging every 10 min. Figure 9 shows the same relationship but in a semi-logarithmic plot. Figure 10 shows the measurement results for borehole No. 5 with the measurement data averaging every 1 min. Figure 11 shows the same relationship but in a semi-logarithmic plot.
The curves are so wobbly (identically wobbly) because of no ideal thermal insulation. As shown in Figure 5, thermal insulation of pipes is used. Figure 2 (thermogram) shows the need for even better thermal insulation.
Every graph (Figure 6, Figure 7, Figure 8, Figure 9, Figure 10 and Figure 11) was based on the same TRT. The precision of the temperature time recording with the use was the current computer science standard, equal to 0.2 milliseconds. Different results were based only on different averaging intervals.

5. Interpretation of TRT Results

Values of the effective thermal conductivity λeff based on the conducted thermal response tests are presented in Table 3. Start time of calculation of λeff corresponded with Equation (7). End time corresponded with the end of heating time (end of TRT). The highest values are marked in red and the lowest in green. There is no correlation to be seen from the presented results.
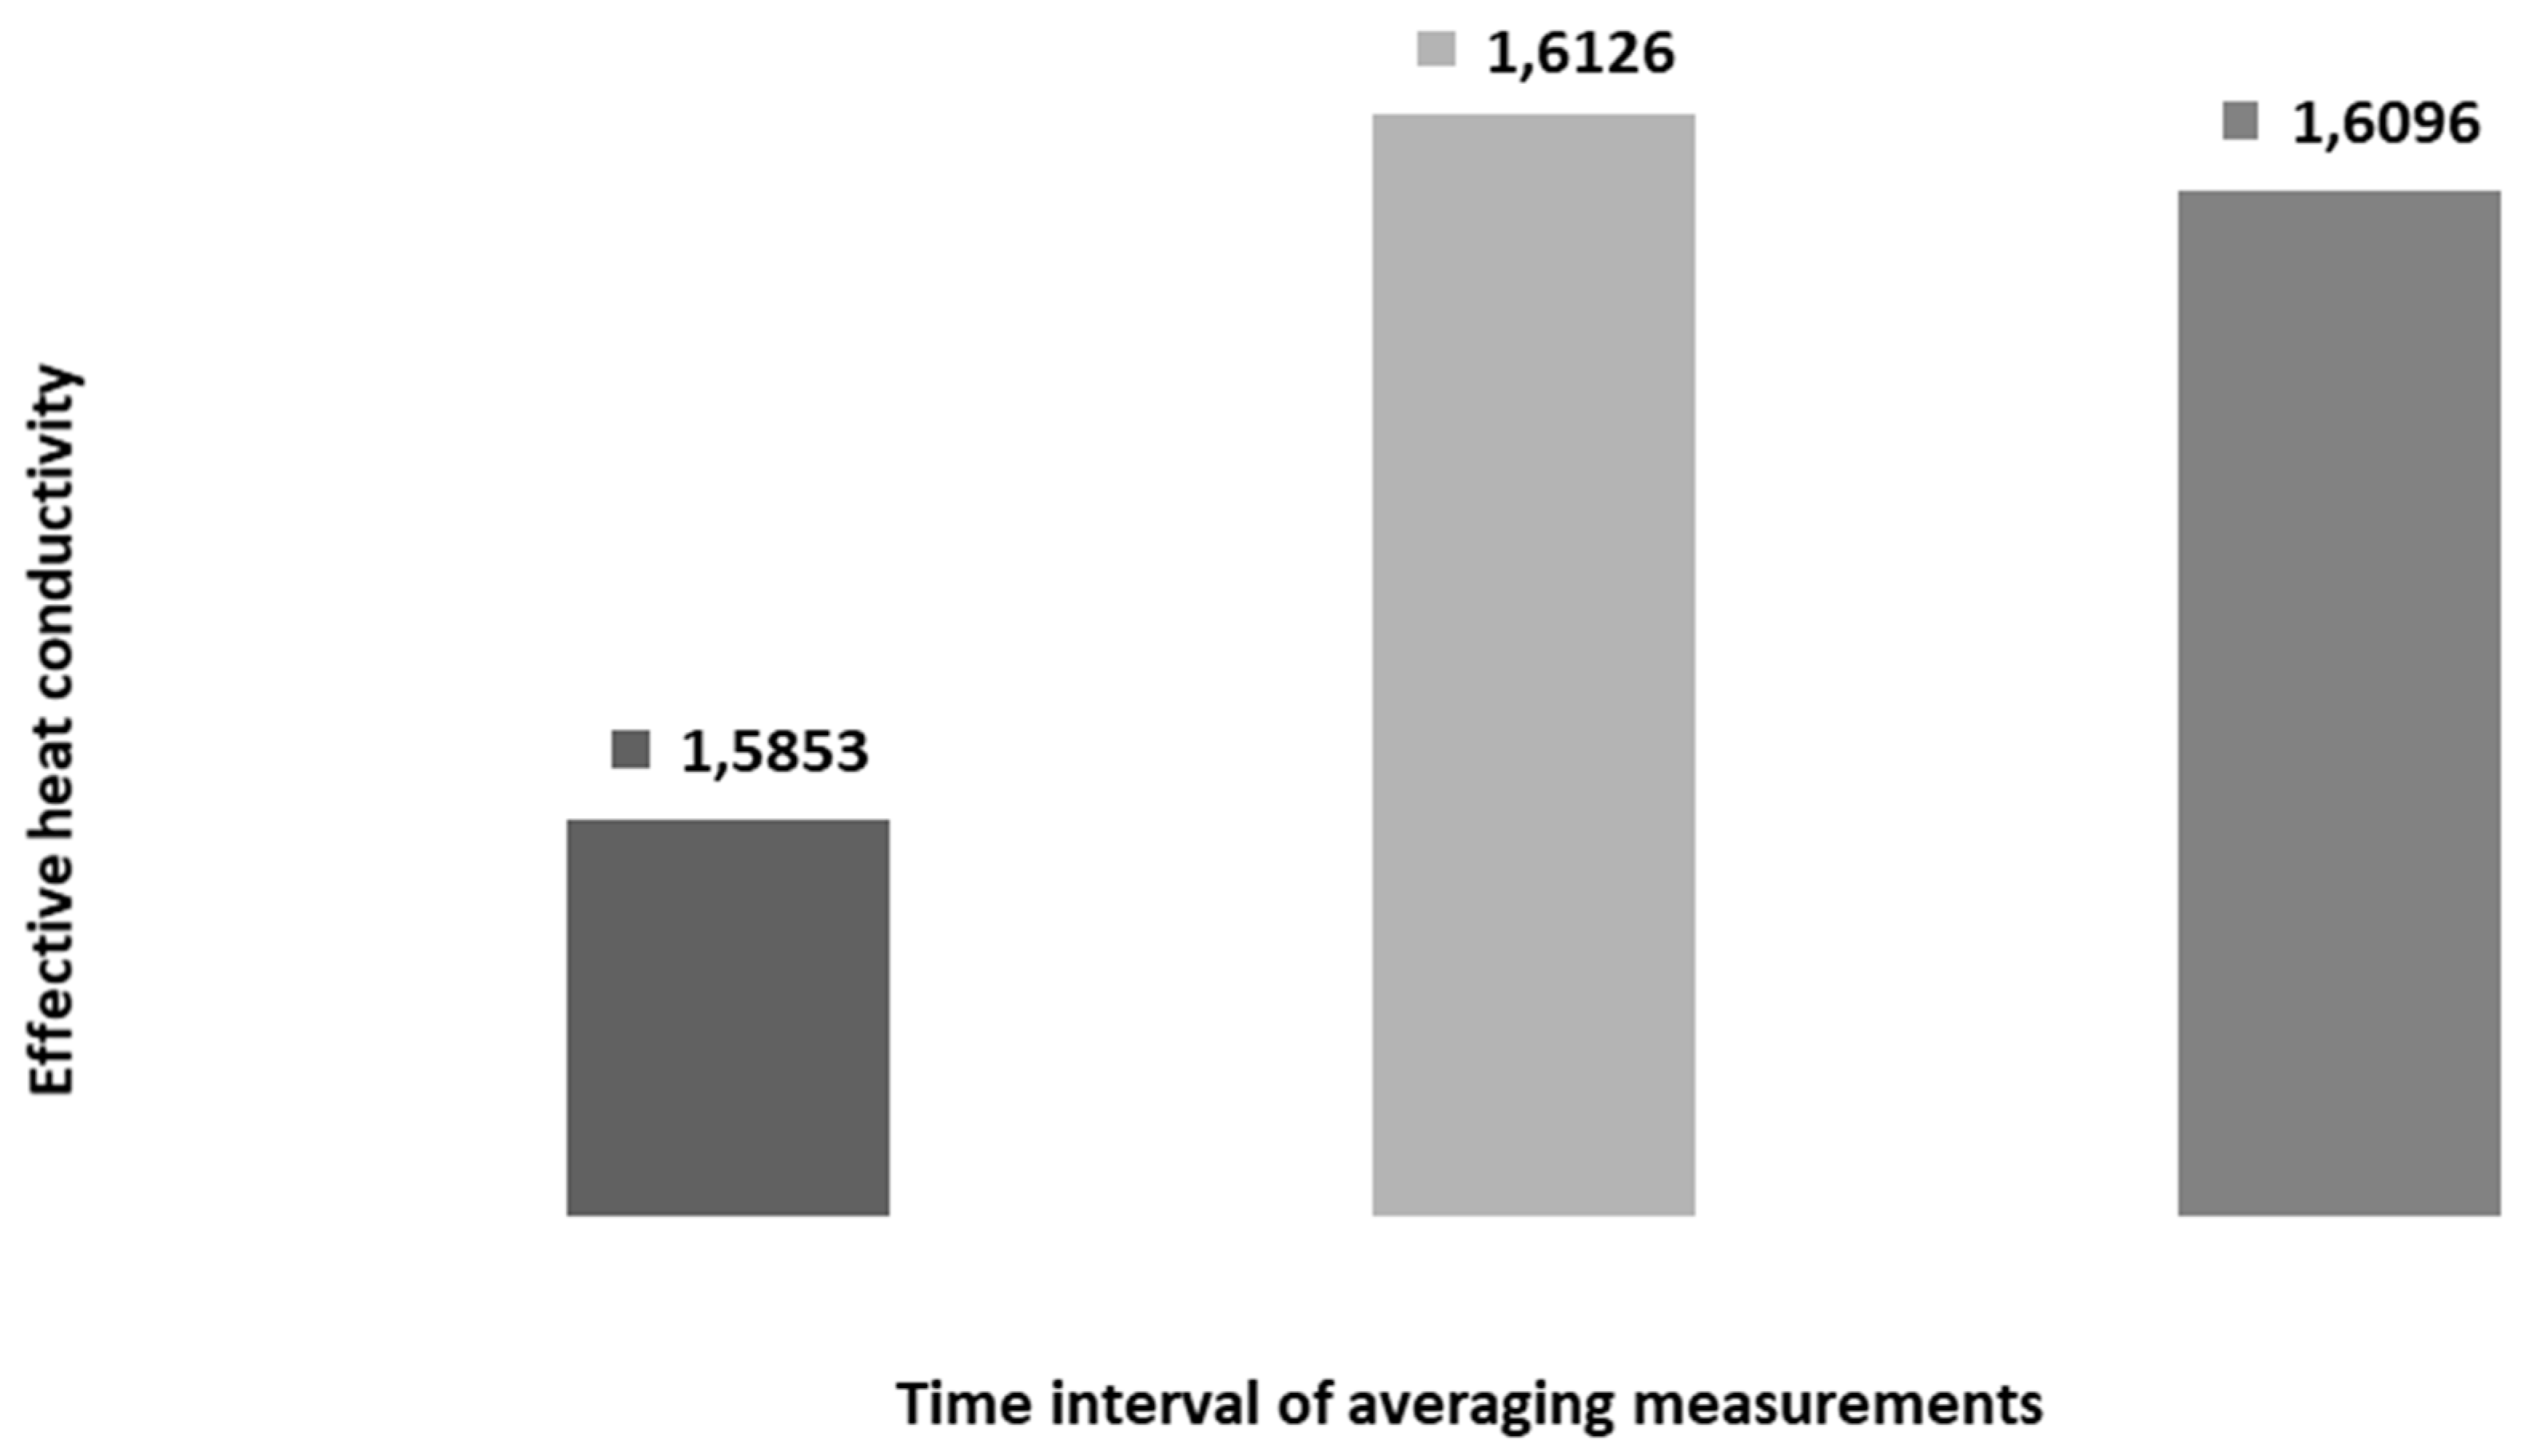
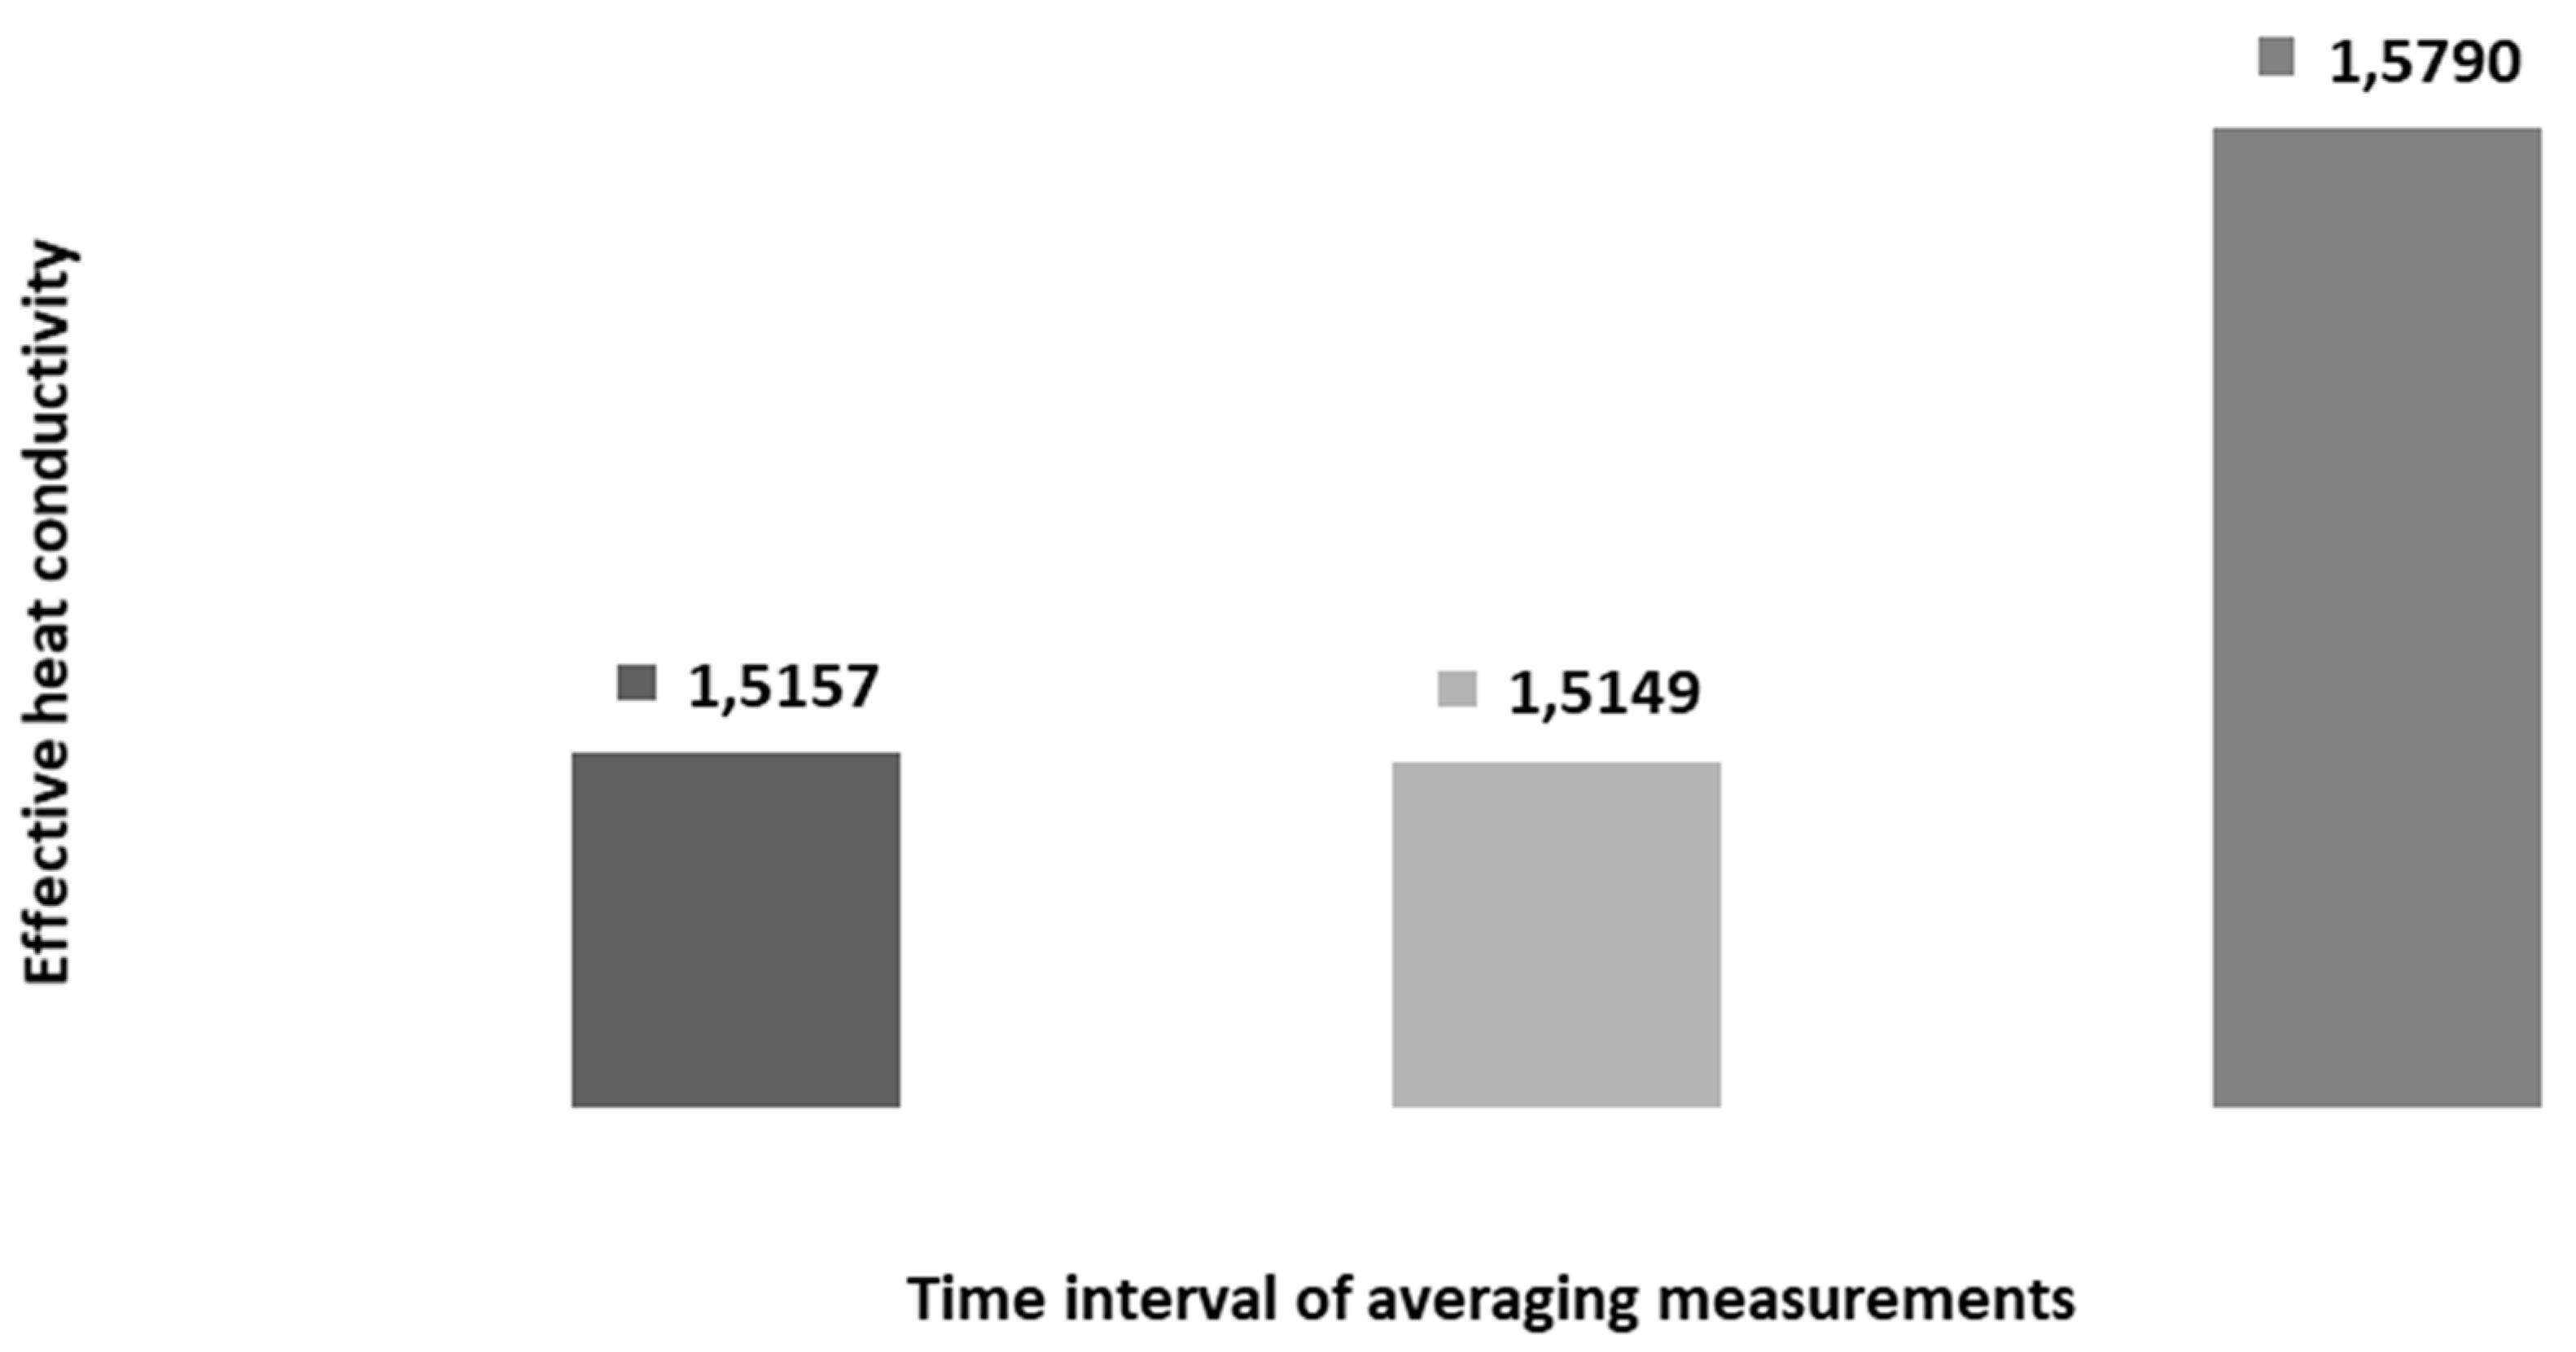
The variability of the heat conduction value for borehole No. 1 is 0.028 Wm−1K−1, for borehole No. 3 it is 0.011 Wm−1K−1, and for borehole No. 5 it is 0.064 Wm−1K−1. The relative error resulting from the method of averaging equals 1.74%, 0.71%, and 4.05%, respectively.
Table 4 shows different statistics. As presented, the volatility factor is less than 2.5%. With the same geology (the distance between the boreholes is shown in Figure 4), the value of this factor is quite high. This is due to the fact that the effective thermal conductivity λeff is not the same as the average thermal conductivity of the rock mass λ, which, according to Table 2, equals 2.039 Wm−1K−1, which is the weighted average conductivity according to literature data. The accuracy results from averaging. Literature data is based mostly on the measuring dry samples. Is-situ measurements are not applicable in the presented research, because coring is too expensive. Real values of rocks heat conductivity in rock mass varies in high range. The reason is, for example, saturation, underground water filtration, and conductivity anisotropy.
Table 4 shows that the most advantageous design is the coaxial BHE, while single and double U-pipe exchangers are identical. The basic indicator that shows BHE quality is borehole thermal resistance Rb. It will be described in a separate paper. The same influence on BHE quality also shows effective thermal conductivity λeff. This value depends to some extent on the heat transfer from the carrier to the pipes. The heat penetration, however, also depends on the heat carrier’s flow velocity. Heat penetration through the inner pipe and outer pipe is also of a different nature with U-pipe BHEs constructions.
For the latter case, the highest value of the coefficient of variation can be observed for different methods of the measurement results averaging. The value closest to the theoretical λ = 2.039 was measured in BHE-1, but it is not necessary that the effective thermal conductivity λeff measured will match an average textbook rock mass thermal conductivity λ.
The same values are shown on below diagrams. For BHE-1 in Figure 12, for BHE-3 in Figure 13 and for BHE-5 in Figure 14. The number of significant digits results from averaging. One digit less gives the same averages in one case.
The diagrams of effective thermal conductivity λeff for individual heat exchangers depending on the time interval of measurement averaging, illustrate the differences between the values obtained for different boreholes with the same parameters, such as the flow rate of the heat carrier and the set heating power. For the sake of a more thorough statistical analysis on the impact of measurement averaging on TRT results, data from commercial thermal response tests were used [43]. Borehole and test data, as well as the interpretation results, are presented in Table 5, Table 6, Table 7, Table 8 and Table 9.
In Table 9, the lowest values are marked in green and the highest values in red. It can be seen that most often the lowest values occur for analysis with averaging every 60 min, and the highest for averaging every 1 min. For design safety reasons (designing the number of BHEs), averaging every 60 min should be used for analysis.
Due to the analysis of the commercial thermal response tests data, the effective thermal conductivity λeff for borehole heat exchangers located throughout Poland was determined. Calculations were made for three time intervals of measurement results averaging: 1 min, 10 min, 60 min, in each individual case.
An important element for the analysis of the measurements was the rejection of the results recorded before and after conducting the test, as well as any anomalies, which could have been affected by external factors such as voltage drops, start-up and stabilization periods of the circulation pump operation, or the influence of atmospheric air temperature.
The output data of the conducted and analyzed tests were spreadsheets with a summary of all the parameters of the heat carrier flowing in the circulating system, recorded by the TRT device. For further analysis, additional calculations in the form of an average heat carrier temperature and the time from the beginning of the test and its natural logarithm were necessary.
By obtaining such data, it was possible to create appropriate graphs showing the relationship between the average temperature of the heat carrier, time, and the logarithm of time. A graph depicting the relationship between heating power, flow rate, and time was presented in order to determine their possible impact on the measurement process.
Slope factors were determined based on regression equations. The average heating power was calculated by summing the values recorded for each measurement and dividing it by the number of measurements. The depth of the exchanger, originating from the technical documentation, was given as additional information for each test.
The presented values of the effective thermal conductivity coefficient λeff for each exchanger are similar and show no significant differences between each other. Only in four cases a discrepancy in results of more than 5% can be noticed, which may have been caused by external factors.
The calculated standard deviation and coefficient of variation values confirmed that the set heating power showed constancy and that any deviations from the average were small (less than 10%). The same is true for the effective thermal conductivity factor (the variability of this parameter is only a few percent), which indicates small differences in conductivity depending on the sampling rate of the test. The heating power shows a small dispersion of values over the measurement process.
It has been confirmed that the directional coefficient of the regression line affects the value of effective thermal conductivity, but these are not very large discrepancies. This is due to the number of results making up the graph of the average temperature dependency on the logarithm of time. More data allow for more accurate determination of the parameters, however it makes it is easier to disrupt the correctness of the measurement process, affecting the final result.

6. Conclusions

The thermal response tests were performed for 100 h in BHEs of different design and identical lithology. TRT data averaging intervals of every 1 min, 10 min, and 60 min were analyzed. Heat carrier temperature changes in time were recorded. The program used for the conversion of data from TRT apparatus were calculating the averages by an arithmetic mean method. It can be concluded that the most reliable (accurate) result would be reflected by a measurement with a time interval of every 1 min. Such data will be the largest in quantity. Rock mass properties were identical. The effective thermal conductivity λeff is dependent on various BHEs designs, heat carrier flow geometry, as well as sealing slurry parameters. The position of the pipes in relation to each other also seems important to consider. As shown on the graphs, the best effective thermal conductivity λeff has occurred in BHE-1 with a coaxial design. At the same time, this value is closest to the theoretical value of thermal conductivity of the drilled rocks λ.
By analyzing the results of the thermal response tests, the value of effective thermal conductivity can be easily determined. For this purpose, it is necessary to create a graph of the relation between the average temperature of the heat carrier and the logarithm of the working time of the TRT apparatus. Then, a regression line of this function and its directional factor should be determined.
The directional factor of the regression line shows different values, depending on the time interval for the considered BHE. As a result, the final value of the effective thermal conductivity coefficient λeff for this BHE is slightly different. It is influenced by the method of averaging the obtained results during the thermal response test. In the majority of described cases, these differences are not very significant, and the values are comparable. In two cases, they are slightly larger, possibly because it is easier to miss the moment of the ground thermal saturation and the temperature graph smoothing at intervals of 60 min. It therefore appears that the interval of 1 min is more accurate for correct determination of the thermal parameters of the rock mass.
The results of the conducted analysis of the thermal response tests for the borehole heat exchangers located in Poland allowed to determine the directional coefficient of a regression line, and its influence on the effective thermal conductivity for individual exchangers, which was presented in Table 9.
Standard deviation and coefficient of variation values have confirmed that there were no significant deviations from the set value of heating power. They also showed that the effective thermal conductivity calculated for different time intervals shows little value variability.
Thermal conductivity values for each time interval, for the same exchanger, were similar in value. Investigated media have shown good potential for extensive installations acquiring heat from low temperature sources.
As shown in Table 9, the lowest values most commonly appear for analysis averaging every 60 min, and the highest—for analysis averaging every 1 min. For design safety reasons (designing the number of BHEs), safer values can be taken for analysis, i.e., averaging every 60 min. A better way is to use the most accurate estimate (1 min averaging) and then simply include a safety margin for design safety reasons. Adding safety should be a quantifiable adjustment, which can be based on the lowest (safer) value of averaging, sensors uncertainty, and the impact of ambient temperature.

Author Contributions

Conceptualization, A.S.-Ś. and T.S.; methodology, T.S. and K.S.; software, K.S.; validation, A.G.; formal analysis, A.S.-Ś.; investigation, K.S. and P.Ż.; resources, K.T.; data curation, K.T.; writing—original draft preparation, T.S. and K.S.; writing—review and editing, A.G.; visualization, K.S.; supervision, T.S.; project administration, A.S.-Ś.; funding acquisition, T.S. All authors have read and agreed to the published version of the manuscript.

Funding

This research was funded by Polish Ministry of Science and Higher Education, grant number 16.16.190.779.

Conflicts of Interest

The authors declare no conflicts of interest.

References

  1. Yoon, A.-Y.; Kang, H.-K.; Moon, S.-I. Optimal Price Based Demand Response of HVAC Systems in Commercial Buildings Considering Peak Load Reduction. Energies 2020, 13, 862. [Google Scholar] [CrossRef] [Green Version]
  2. Zhou, W.; Pei, P.; Hao, D.; Wang, C. A Numerical Study on the Performance of Ground Heat Exchanger Buried in Fractured Rock Bodies. Energies 2020, 13, 1647. [Google Scholar] [CrossRef] [Green Version]
  3. Sliwa, T.; Gonet, A. Otworowe wymienniki ciepła jako źródło ciepła lub chłodu na przykładzie Laboratorium Geoenergetyki WWNiG AGH (Borehole heat exchangers as heat or cool source on the basis of Laboratory of Geothermics of Drilling, Oil and Gas Faculty in AGH University of Science and Technology). Wiert. Naft. Gaz 2011, 28, 419–430. Available online: http://journals.bg.agh.edu.pl/WIERTNICTWO/2011-1-2/W_2011_1-2_36.pdf (accessed on 10 April 2020). (In Polish).
  4. Sliwa, T.; Knez, D.; Gonet, A.; Sapińska-Śliwa, A.; Szłapa, B. Research and Teaching Capacities of the Geoenergetics Laboratory at Drilling, Oil and Gas Faculty AGH University of Science and Technology in Kraków (Poland). In Proceedings of the World Geothermal Congress 2015, Melbourne, Australia, 19–25 April 2015; Paper No. 09012. pp. 1–14. Available online: https://www.geothermal-energy.org/pdf/IGAstandard/WGC/2015/09012.pdf (accessed on 10 April 2020).
  5. Sliwa, T.; Gołaś, A.; Wołoszyn, J.; Gonet, A. Numerical model of borehole heat exchanger in ANSYS CFX software. Arch. Min. Sci. 2012, 57, 375–390. [Google Scholar]
  6. Acuña, J.; Palm, B. Distributed thermal response tests on pipe-in-pipe borehole heat exchangers. Appl. Energy 2013, 109, 312–320. [Google Scholar] [CrossRef]
  7. Gultekin, A.; Aydin, M.; Sisman, A. Thermal performance analysis of multiple borehole heat exchangers. Energy Convers. Manag. 2016, 122, 544–551. [Google Scholar] [CrossRef]
  8. Li, M.; Lai, A.C. Review of analytical models for heat transfer by vertical ground heat exchangers (GHEs): A perspective of time and space scales. Appl. Energy 2015, 151, 178–191. [Google Scholar] [CrossRef]
  9. Sliwa, T.; Sojczyńska, A.; Rosen, M.A.; Kowalski, T. Evaluation of temperature profiling quality in determining energy efficiencies of borehole heat exchangers. Geothermics 2019, 78, 129–137. [Google Scholar] [CrossRef]
  10. Fujii, H.; Okubo, H.; Nishi, K.; Itoi, R.; Ohyama, K.; Shibata, K. An improved thermal response test for U-tube ground heat exchanger based on optical fiber thermometers. Geothermics 2009, 38, 199–406. [Google Scholar] [CrossRef]
  11. Raymond, J.; Therrien, R.; Gosselin, L. Borehole temperature evolution during thermal response tests. Geothermics 2011, 40, 69–78. [Google Scholar] [CrossRef]
  12. Wagner, V.; Blum, P.; Kubert, M.; Bayer, P. Analytical approach to groundwater-influenced thermal response tests of grouted borehole heat exchangers. Geothermics 2013, 46, 22–31. [Google Scholar] [CrossRef]
  13. Liuzzo-Scorpo, A.; Nordell, B.; Gehlin, S. Influence of regional groundwater flow on ground temperature around heat extraction boreholes. Geothermics 2015, 56, 119–127. [Google Scholar] [CrossRef]
  14. Rouleau, J.; Gosselin, L.; Raymond, J. New concept of combined hydro-thermal response tests (H/TRTS) for ground heat exchangers. Geothermics 2016, 62, 103–114. [Google Scholar] [CrossRef]
  15. Bandos, T.V.; Montero, A.; Fernandez de Cordoba, P.; Urchueguía, J.F. Improving parameter estimates obtained from thermal response tests: Effect of ambient air temperature variations. Geothermics 2011, 40, 136–143. [Google Scholar] [CrossRef] [Green Version]
  16. Spitler, J.D.; Gehlin, S.E.A. Thermal response testing for ground source heat pump systems—An historical review. Renew. Sustain. Energy Rev. 2015, 50, 1125–1137. [Google Scholar] [CrossRef]
  17. Gehlin, S. Thermal Response Test: Method Development and Evaluation. Ph.D. Thesis, Luleå University of Technology, Luleå, Sweden, 2002. Available online: http://ltu.diva-portal.org/smash/get/diva2:991442/FULLTEXT01.pdf (accessed on 30 April 2020).
  18. Mogensen, P. Fluid to Duct Wall Heat Transfer in Duct System Heat Storage. In Proceedings of the Int. Conf. On Subsurface Heat Storage in Theory and Practice, Stockholm, Sweden, 1983; pp. 652–657. [Google Scholar]
  19. Nejad, P.E.; Badache, M.; Corcoran, A.; Bernier, M. Calibration of thermal response test (TRT) units with a virtual borehole. Geothermics 2019, 79, 105–113. [Google Scholar]
  20. Sun Chang, K.; Jun Kim, M. Thermal performance evaluation of vertical U-loop ground heat exchanger using in-situ thermal response test. Renew. Energy 2019, 87, 585–591. [Google Scholar] [CrossRef]
  21. Choi, W.; Kikumoto, H.; Choudhary, R.; Ooka, R. Bayesian inference for thermal response test parameter estimation and uncertainty assessment. Appl. Energy 2018, 209, 306–321. [Google Scholar] [CrossRef]
  22. Beier, R.A.; Smith, M.D.; Spitler, J.D. Reference data sets for vertical borehole ground heat exchanger models and thermal response test analysis. Geothermics 2011, 40, 79–85. [Google Scholar] [CrossRef]
  23. Zhang, C.; Guo, Z.; Liu, Y. A review on thermal response test of ground-coupled heat pump systems. Renew. Sustain. Energy Rev. 2014, 40, 851–867. [Google Scholar] [CrossRef]
  24. Raymond, J.; Lamarche, L.; Malo, M. Field demonstration of a first thermal response test with low power source. Appl. Energy 2015, 147, 30–39. [Google Scholar] [CrossRef]
  25. Franco, A.; Moffat, R.; Toledo, M.; Herrera, P. Numerical sensitivity analysis of thermal response tests (TRT) in energy piles. Renew. Energy 2016, 86, 985–992. [Google Scholar] [CrossRef]
  26. Zarrella, A.; Emmi, G.; Graci, S.; De Carli, M.; Cultrera, M.; Santa, G.D.; Galgaro, A.; Bertermann, D.; Müller, J.; Pockelé, L.; et al. Thermal Response Testing Results of Different Types of Borehole Heat Exchangers: An Analysis and Comparison of Interpretation Methods. Energies 2017, 10, 801. [Google Scholar] [CrossRef] [Green Version]
  27. Gustafsson, A.-M.; Westerlund, L. Multi-injection rate thermal response test in groundwater filled borehole heat exchanger. Renew. Energy 2010, 35, 1061–1070. [Google Scholar] [CrossRef]
  28. Zhang, C.; Chen, P.; Liu, Y. An improved evaluation method for thermal performance of borehole heat exchanger. Renew. Energy 2015, 77, 142–151. [Google Scholar] [CrossRef]
  29. Loveridge, F.; Powire, W.; Nicholson, D. Comparison of two different models for pile thermal response test interpretation. Geothermics 2014, 9, 367–384. [Google Scholar] [CrossRef] [Green Version]
  30. Yu, X.; Zhang, Y.; Deng, N.; Ma, H.; Dong, S. Thermal response test for ground source heat pump based on constant temperature and heat-flux methods. Appl. Therm. Eng. 2016, 93, 678–682. [Google Scholar] [CrossRef]
  31. Sliwa, T.; Gonet, A. Theoretical model of borehole heat exchanger. J. Energy Resour. Technol. 2005, 127, 142–148. [Google Scholar] [CrossRef]
  32. Signorelli, S.; Basetti, S.; Pahud, D.; Kohl, T. Numerical evaluation of thermal response tests. Geothermics 2007, 36, 141–166. Available online: 10.1016/j.geothermics.2006.10.006 (accessed on 10 April 2020). [CrossRef]
  33. Sliwa, T.; Kotyza, J. Application of existing wells as ground heat source for heat pumps in Poland. Appl. Energy 2003, 74, 3–8. [Google Scholar] [CrossRef]
  34. Sliwa, T.; Rosen, M.A.; Jezuit, Z. Use of Oil Boreholes in the Carpathians in Geoenergetic Systems: Historical and Conceptual Review. Res. J. Environ. Sci. 2014, 8, 231–242. [Google Scholar] [CrossRef] [Green Version]
  35. Sliwa, T.; Kruszewski, M.; Zare, A.; Assadi, M.; Sapińska-Śliwa, A. Potential application of vacuum insulated tubing for deep borehole heat exchangers. Geothermics 2018, 75, 58–67. [Google Scholar] [CrossRef]
  36. Sapińska-Śliwa, A.; Rosen, M.A.; Gonet, A.; Kowalczyk, J.; Sliwa, T. A new method based on thermal response tests for determining effective thermal conductivity and borehole resistivity for borehole heat exchangers. Energies 2019, 12, 1072. Available online: https://www.mdpi.com/1996-1073/12/6/1072/pdf (accessed on 10 April 2020).
  37. Sliwa, T.; Rosen, M.A. Natural and artificial methods for regeneration of heat resources for borehole heat exchangers to enhance the sustainability of underground thermal storages: A review. Sustainability 2015, 7, 13104–13125. [Google Scholar] [CrossRef] [Green Version]
  38. Perina, T. Derivation of the Theis (1935) Equation by Substitution. Ground Water 2010, 48, 6–7. [Google Scholar] [CrossRef] [PubMed]
  39. Eklöf, C.; Gehlin, S. TED—A Mobile Equipment for Thermal Response Test. Master’s Thesis, Lund University, Lund, Sweden, 1996. [Google Scholar]
  40. Gonet, A.; Sliwa, T.; Stryczek, S.; Sapińska-Śliwa, A.; Jaszczur, M.; Pająk, L.; Złotkowski, A. Metodyka Identyfikacji Potencjału Cieplnego Górotworu Wraz z Technologią Wykonywania i Eksploatacji Otworowych Wymienników Ciepła (Methodology for the Identification of Potential Heat of the Rock Mass Along with Technology Implementation and Operation of the Borehole Heat Exchangers), 1st ed.; Gonet, A., Ed.; Wydawnictwa AGH: Krakow, Poland, 2011; p. 439. (In Polish) [Google Scholar]
  41. Somerton, W.H. Thermal Properties and Temperature-Related Behavior of Rock/Fluid Systems, 1st ed.; Elsevier: Amsterdam, The Netherlands, 1992; p. 256. [Google Scholar]
  42. Plewa, S. Rozkład Parametrów Geotermalnych na Obszarze Polski, 1st ed.; Wydawnictwo CPPGSMiE PAN: Krakow, Poland, 1994; p. 138. (In Polish) [Google Scholar]
  43. Sapińska-Śliwa, A. Efektywność Pozyskiwania Ciepła z Górotworu w Aspekcie Sposobu Udostępniania Otworami Wiertniczymi (Effectiveness of Heat Recovery from Rock Mass in the Context of the Production Method by Means of Boreholes), 1st ed.; Wydawnictwa AGH: Krakow, Poland, 2019; p. 319. (In Polish) [Google Scholar]
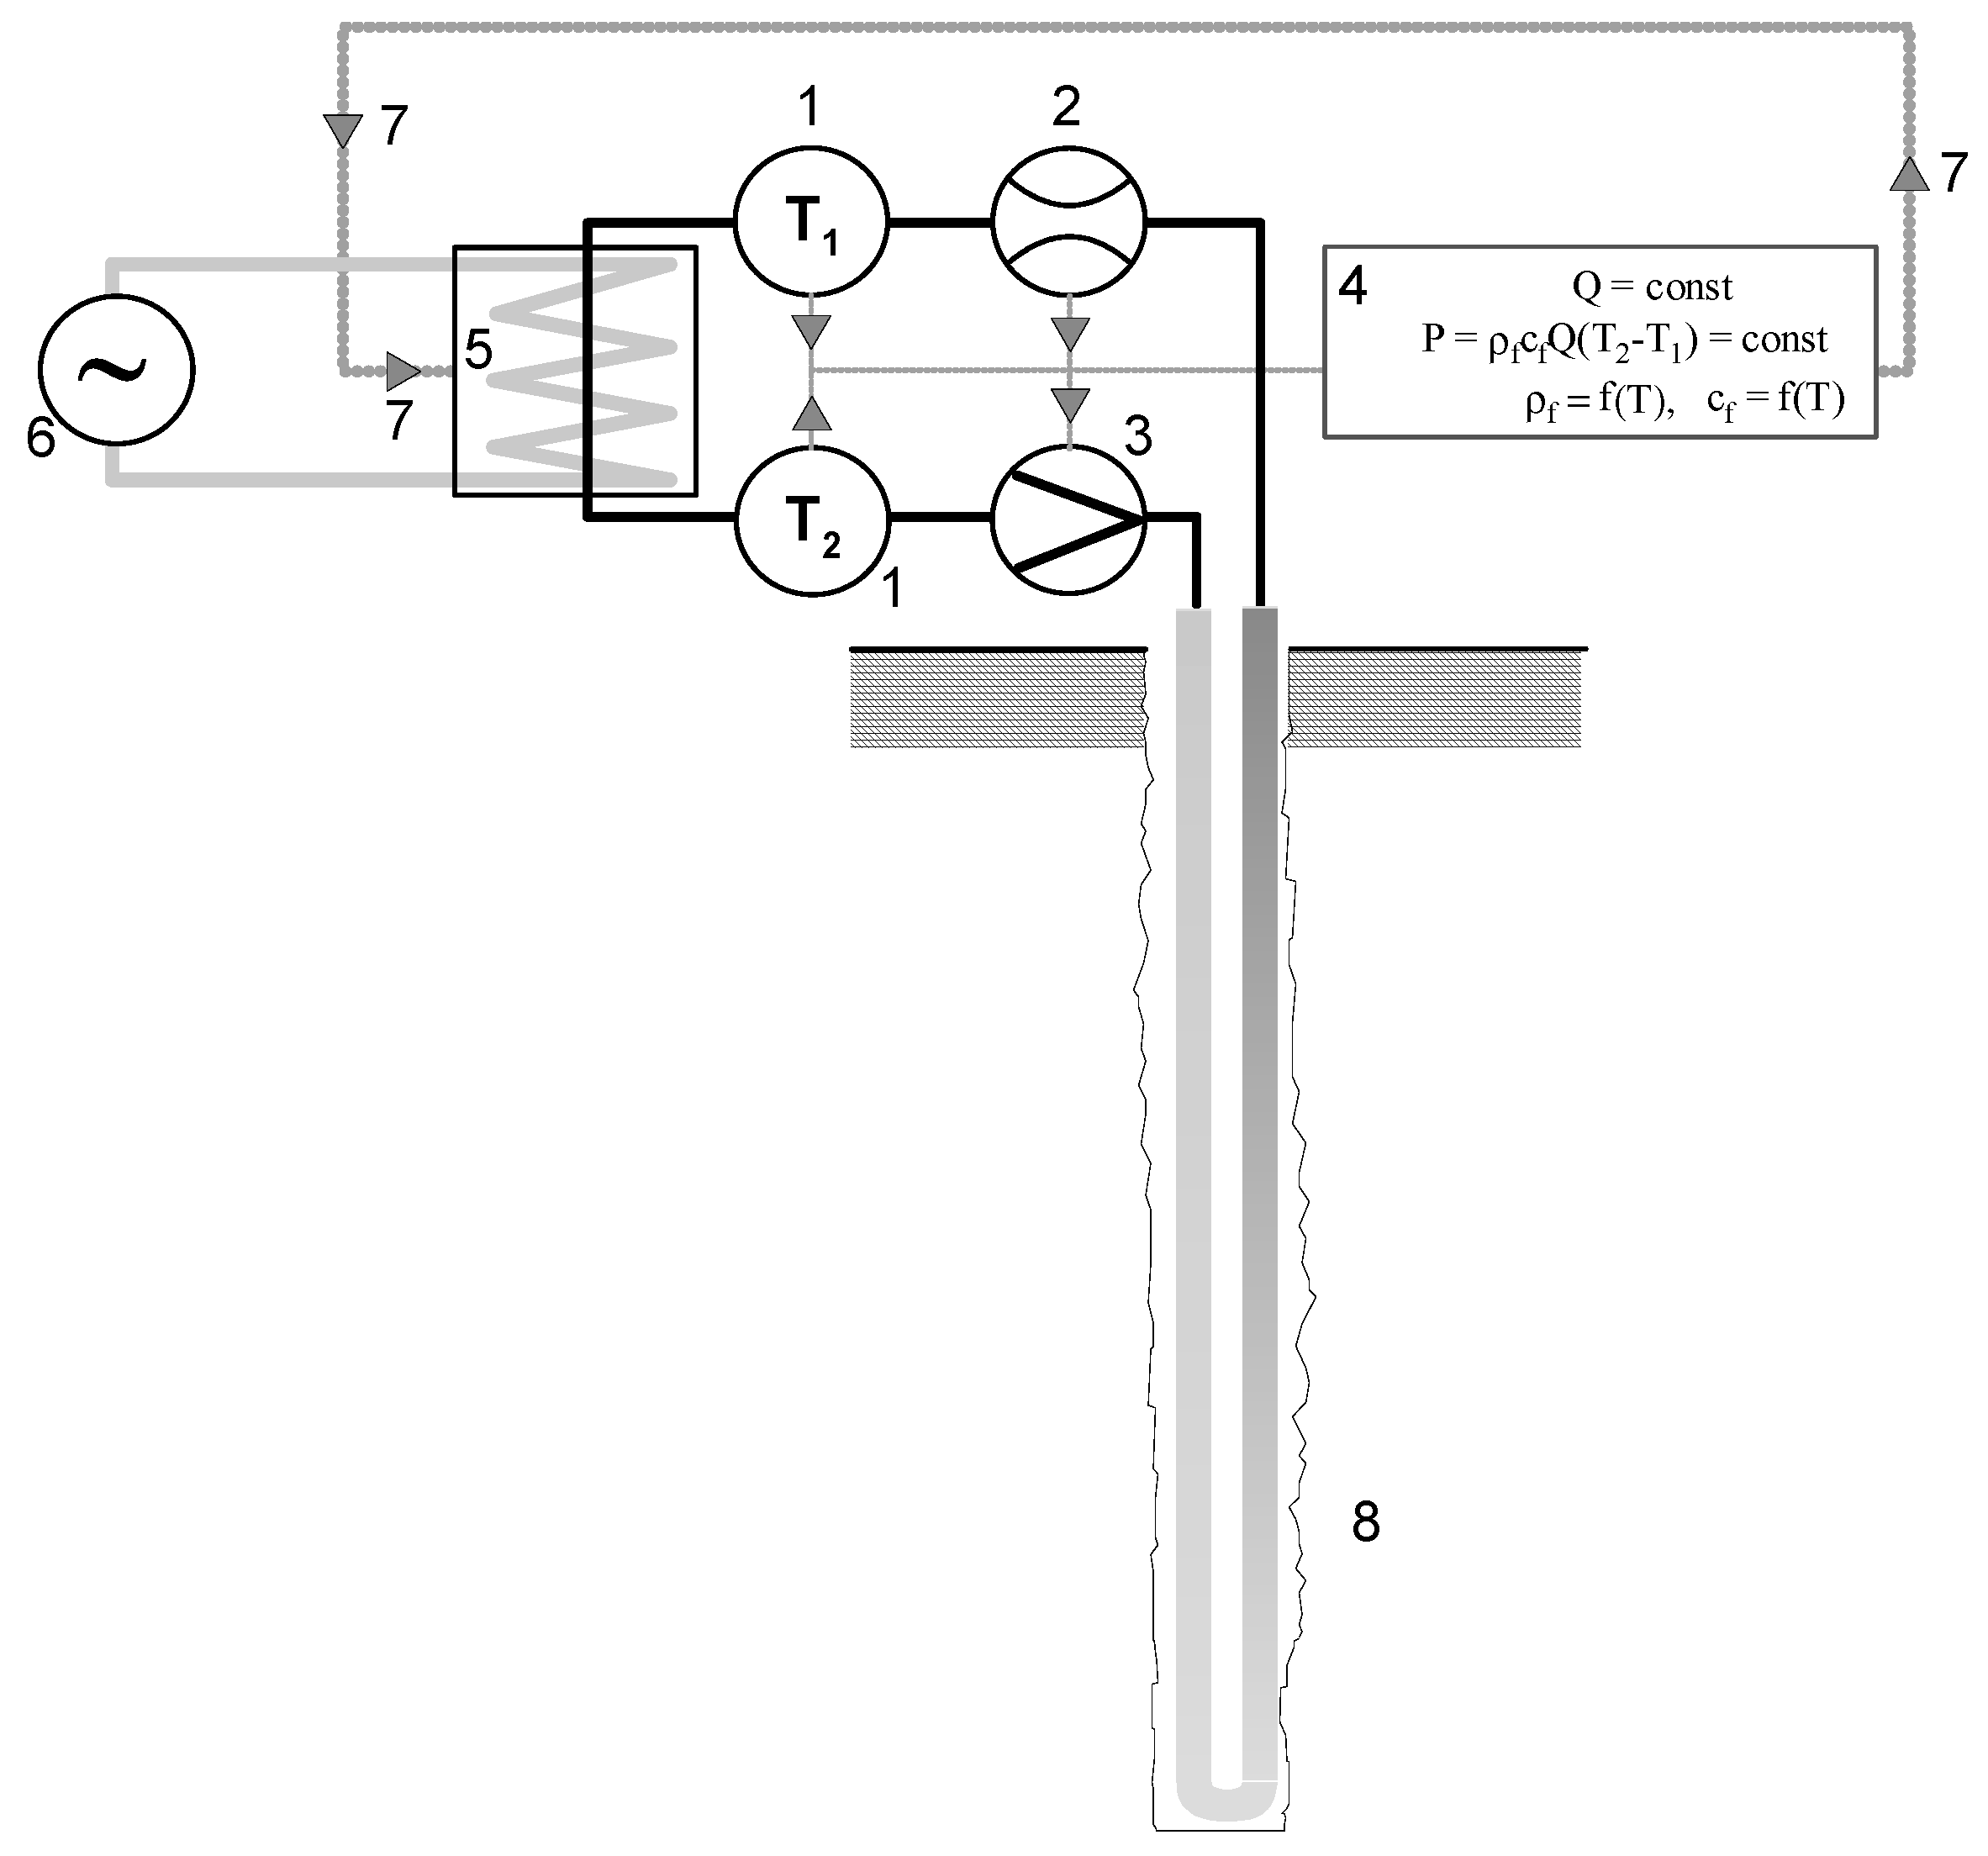
Figure 1. Schematic of thermal response test devices and operation. Legend: 1—thermometer with absolute error 0.1 °C, 2—flowmeter, 3—pump, 4—control computer (stabilization of thermal power and record the data), 5—set of heaters, 6—current source, 7—heater control signal, 8—borehole heat exchanger, Q—flow rate of heat carrier, P—heat flow rate (power), T1—temperature of heat carrier (outflow from BHE), T1—temperature of heat carrier (inflow to BHE), ρf = f(T)—density of heat carrier as a function of temperature, cf = f(T)—specific heat of heat carrier as a function of temperature.
Energies 13 03737 g001
Figure 2. Thermogram of the borehole heat exchanger (BHE) connection to the thermal response tests (TRT) apparatus.
Energies 13 03737 g002
Figure 3. Thermal response test apparatus and its connection to the BHE.
Energies 13 03737 g003
Figure 4. Layout of the borehole heat exchanger field in the Laboratory of Geoenergetics, Department of Drilling, Oil and Gas AGH UST. BHE-1 is a coaxial system, BHE-2, BHE-3, and BHE-4 are boreholes with a single U-pipe design and various sealing, BHE-5 has a double U-tube design [3].
Energies 13 03737 g004
Figure 5. Modules of the TRT apparatus together with a power generator (corresponds to Figure 1).
Energies 13 03737 g005
Figure 6. TRT results with the measurement data averaging every 1 h.
Energies 13 03737 g006
Figure 7. TRT results with the measurement data averaging every 1 h in a semi-logarithmic plot, together with the linear regression equation.
Energies 13 03737 g007
Figure 8. TRT results with the measurement data averaging every 10 min.
Energies 13 03737 g008
Figure 9. TRT results with the measurement data averaging every 10 min in a semi-logarithmic plot, together with the linear regression equation.
Energies 13 03737 g009
Figure 10. TRT results with the measurement data averaging every 1 min.
Energies 13 03737 g010
Figure 11. TRT results with the measurement data averaging every 1 min in a semi-logarithmic plot, together with the linear regression equation.
Energies 13 03737 g011
Figure 12. Effective thermal conductivity λeff depending on time interval for BHE-1 (coaxial).
Energies 13 03737 g012
Figure 13. Effective thermal conductivity λeff depending on time interval for BHE-3 (single U-pipe).
Energies 13 03737 g013
Figure 14. Effective thermal conductivity λeff depending on time interval for BHE-5 (double U-pipe).
Energies 13 03737 g014
Table 1. Characteristics of the researched borehole heat exchangers belonging to the Laboratory of Geoenergetics, Department of Drilling, Oil and Gas AGH UST [40].
BHE No.Characteristics of the BHE ConstructionSymbol
BHE-1Depth 76.4 m, coaxial design (pipe in pipe). Outer diameter of the outer pipe equals 90 mm, wall thickness 5.4 mm. Outer diameter of the inner pipe is 40 mm, with wall thickness 2.4 mm Energies 13 03737 i001
BHE-3Depth 76.4 m, design consisting of a single U-tube. Distance between pipe axes equals 80 mm. Outer diameter of the exchanger pipes is 40 mm. Wall thickness 2.4 mm. Heat-improved sealing material (thermocem) with heat conduction λ = 2.0 W/(mK) Energies 13 03737 i002
BHE-5Depth 76.4 m, system with double U-tube. Distance between the pipe axes is 70 mm. Outer diameter of the pipes equals 32 mm, wall thickness 2.4 mm Energies 13 03737 i003
Table 2. Stratigraphic lithological profile of the LG-2a borehole together with selected thermal parameters of rocks [40].
No. of LayerTop of the Layer,
m
Bottom of the Layer,
m
Thicness of the Layer,
m
LithologyStratigraphyThermal Conductivity, λ,
W⋅m−1K−1
Volumetric Heat Capacity, cv,
MJ⋅m−3K−1
10.02.22.2Anthropogenic soil (dark gray bank with debris)Quaternary (Pleistocene, Holocene)1.6002.000
22.22.60.4Silt (gray soil)1.6002.200
32.64.01.4Fine and dusty sand, slightly argillaceous1.0002.000
44.06.02.0Fine sand1.2002.500
56.015.09.0All-in aggregate and gravel1.8002.400
615.030.015.0Gray loamTertiary (Miocene)2.2002.300
730.078.048.0Gray shale2.1002.300
Weighted average2.0392.309
Table 3. Effective thermal conductivity values in BHEs (highest values in red, lowest in green), taking into consideration sensors uncertainty the values of λeff has uncertainty equals ± Δλeff = 0.032 Wm−1K−1.
BHE No.Value of λeff with Interval of 1 min,
Wm−1K−1
Value of λeff with Interval of 10 min,
Wm−1K−1
Value of λeff with Interval of 1 h,
Wm−1K−1
Volatility * of the λeff Value,
Wm−1K−1
BHE-11.5851.6131.6100.028
BHE-31.5401.5391.5290.011
BHE-51.5161.5151.5790.064
* Maximum value (red) minus minimum one (green).
Table 4. Statistics of effective thermal conductivity λeff values in BHEs.
BHE No.Average λeff,
Wm−1K−1
Standard Deviation λeff,Wm−1K−1Coefficient of Variation,%
BHE-11.6030.0150.94
BHE-31.5360.0060.39
BHE-51.5370.0372.40
Table 5. Parameters of the tested exchangers, with the interval of every 1 min.
Location of the ExchangerAverage Heating Power during TRT, WStandard Deviation of Heating Power, WCoefficient of Variation, %Borehole Depth, mAverage Unit Heating Power, W/mSlope of the Regression Line in a Semi-Logarithmic Plot
Łódź6645127.361.9212055.381.8632
Szczecin10,00860.240.6019152.401.5816
Polkowice780024.520.3115350.981.8542
Rawa Mazowiecka250926.031.044852.271.7100
700956.610.8114050.061.4352
Kraków I7823383.324.9015052.151.9694
Wolsztyn952386.990.9120047.622.1722
Gola Dzierżoniowska7014226.903.2315046.761.2513
Żarów600079.971.3312050.001.5873
5997124.742.0812049.981.4193
Białystok4390245.755.6010043.901.4745
Wrocław4072141.123.4713330.621.4139
Kraków II4813154.053.2015032.091.2354
Niepołomice4007100.272.5014028.620.8564
Kraków III8892288.363.2420044.461.8384
Table 6. Parameters of the tested exchangers, with the interval of every 10 min.
Location of the ExchangerAverage Heating Power during TRT, WStandard Deviation of Heating Power, WCoefficient of Variation, %Borehole Depth, mAverage Unit Heating Power, W/mSlope of the Regression Line in a Semi-Logarithmic Plot
Łódź664828.280.4312055.401.8463
Szczecin10,00814.870.1519152.401.4713
Polkowice779938.830.515350.971.8620
Rawa Mazowiecka250912.130.484852.271.4534
700824.280.3514050.061.8801
Kraków I782468.320.8715052.162.0785
Wolsztyn952354.650.5720047.622.134
Gola Dzierżoniowska701439.130.5615046.761.2995
Żarów600039.060.6512050.001.4714
599873.581.2312049.981.4543
Białystok4387137.963.1510043.871.3974
Wrocław4071176.864.3413330.611.4834
Kraków II4813121.382.5215032.091.2582
Niepołomice4007158.253.9514028.620.8629
Kraków III8890273.583.0820044.451.9976
Table 7. Parameters of the tested exchangers, with the interval of every 60 min.
Location of the ExchangerAverage Heating Power during TRT, WStandard Deviation of Heating Power, WCoefficient of Variation, %Borehole Depth, mAverage Unit Heating Power, W/mSlope of the Regression Line in a Semi-Logarithmic Plot
Łódź6636106.701.6112055.301.8421
Szczecin10,0094.010.0419152.401.8276
Polkowice78002.180.0315350.981.8430
Rawa Mazowiecka250810.420.424852.251.4979
70095.380.0814050.062.0205
Kraków I779414.710.1915051.962.2584
Wolsztyn952328.450.3020047.622.1623
Gola Dzierżoniowska701414.190.2015046.761.4956
Żarów600017.290.2912050.001.593
599633.780.5612049.971.4702
Białystok439099.772.2710043.901.3912
Wrocław4077227.825.5913330.651.484
Kraków II4810102.542.1315032.071.3227
Niepołomice4008130.543.2614028.630.9115
Kraków III8889242.482.7320044.452.0555
Table 8. Summary of the heating power of borehole exchangers for which a thermal reaction test was performed.
BHE LocationHeating Power for an Interval of 1 min, WHeating Power for an Interval of 10 min, WHeating Power for an Interval of 60 min, WAverage Heating Power, WStandard Deviation of Heating Power, WCoefficient of Variation, %
Łódź66456648663666435.100.077
Szczecin10,00810,00810,0091008.330.470.005
Polkowice7800779978007799.670.470.006
Rawa Mazowiecka2509250925082508.670.470.019
7009700870097008.670.470.007
Kraków I7823782477947813.6713.910.178
Wolsztyn95239523952395230.000.000
Gola Dzierżoniowska70147014701470140.000.000
Żarów60006000600060000.000.000
59975998599659970.820.014
Białystok43904387439043891.410.032
Wrocław4072407140774073.332.620.064
Kraków II48134813481048121.410.029
Niepołomice3998400740084007.330.470.012
Kraków III8892889088898890.331.250.014
Table 9. Summary of the effective thermal conductivity λeff of the borehole heat exchangers for which the thermal reaction test was performed (green—the lowest, red—the highest value of λeff).
BHE LocationBHE Designλeff for an Interval of 1 min, Wm−1K−1λeff for an Interval of 10 min, Wm−1K−1λeff for an Interval of 60 min, Wm−1K−1Average λeff, Wm−1K−1Standard Deviation of λeff, Wm−1K−1Coefficient of Varition, %
Łódź2-U-tube2.372.392.392.380.0100.42
Szczecin1-U-tube2.632.832.282.580.2308.91
Polkowice1-U-tube2.192.182.202.190.0100.46
Rawa Mazowiecka1-U-tube2.332.121.972.140.1507.01
1-U-tube2.902.862.772.840.0501.76
Kraków I1-U-tube2.112.001.831.980.1206.06
Wolsztyn1-U-tube1.741.781.751.760.0201.14
Gola Dzierżoniowska1-U-tube2.972.862.502.780.2007.19
Żarów1-U-tube2.502.702.502.570.0903.50
1-U-tube2.802.742.702.750.0401.45
Białystok1-U-tube2.532.502.392.470.0602.43
Wrocław1-U-tube1.721.641.641.670.0402.40
Kraków II2-U-tube2.072.031.932.010.0602.99
Niepołomice1-U-tube2.662.642.502.600.0702.69
Kraków III2-U-tube1.921.771.721.800.0804.44