1. Introduction
Transportation has a high impact on issues of air pollution, energy security, and global warming. According to [
1], combustion engine vehicles produce 25% of greenhouse gas emissions. Especially, this impact is even higher in the city where there is a high density of vehicles. This has spiked interest in research to develop electric vehicles (EVs) to alter the traditional means of transportation. In particular, electric bicycles (e-bikes) have many advantages compared to others. An e-bike is a traditional bicycle integrated with a battery unit and an electric motor to assist the cyclist while pedaling. With lightweight and small footprint characteristics, e-bikes are the greenest vehicles among EVs. According to [
2], e-bikes are less energy consuming and carbon-dioxide producing than other types of vehicles. With the power-assisted pedal, riding an e-bike can reduce physical effort yet still improve the health of the rider, thus attracting people of every age to the physical activity of e-bike cycling.
Despite the advantages, it generally takes more than two hours to fully charge a battery. Such a long waiting time may be unbearable for impatient users. In addition, the current limited battery capacity limits the travel range of an e-bike with one single charge. Therefore, range anxiety is a big issue reducing the wide use of e-bikes. To alleviate the range anxiety, a human–machine interface (HMI), which states the battery status (such as remaining capacity, state of health) and the estimated range autonomy, is an indispensable component of e-bikes. However, due to low computing capacity and poor connectivity characteristics of the electronic system of e-bikes, the information shown on the HMI is generally inaccurate and not useful for inexperienced cyclists. Consequently, existing works have developed systems using smartphones to connect with e-bikes to provide assistance to cyclists, such as speed advisor [
3], route guidance, range prediction [
4], etc. In addition, the data collected from monitoring the e-bike battery in the real-world operating conditions can be used to improve the accuracy of battery status prediction [
5]. Therefore, the interface device, which can be called the gateway connecting the smartphone with the e-bike, plays an important role. However, previous gateways were seldom designed for e-bikes equipped with electronic devices using a standardized communication.
Each e-bike manufacturer has his own hardware design, resulting in a high maintenance cost. It is also hard to build public charger stations suitable for various types of e-bike batteries. To address this issue, EnergyBus and CAN in Automation (CiA) organizations have proposed a standard for the electronic components of e-bikes, called EnergyBus standard [
6,
7,
8], which is based on CANopen protocol [
9] and specified in CiA454 document named ‘CANopen application profile for energy management systems’ [
10]. CiA454 defines communication protocols, device profiles, and a unified connector for e-bike electronic devices connected by a CAN network. However, the standard gateway profile of the EnergyBus application is still under development. Although CiA has specified a standard for the gateway [
11], designing an efficient gateway with low cost and ensuring system safety is still a big challenge.
In this paper, an energy monitoring system (EMS) for e-bikes based on EnergyBus is proposed. The system allows cyclists to use a smart device to obtain information about battery status, rider efforts, and other related information such as distance and speed from their e-bike. In addition, the rider’s trip is also tracked using the built-in GPS of the smart device. Moreover, all the information is saved in the smart device’s storage for the riders to review their physical activities. The EMS consists of an EMS App installed on a smart device and a CANopen-based gateway connected to the e-bike’s EnergyBus. The EMS App communicates with the gateway through Bluetooth. The gateway works on both data link layer and application layer of the data transmission model, providing CAN bus monitoring and CANopen device data access services to the smart device, respectively. The design of the gateway is proposed to ensure the performance of data monitoring and the transparency of data access for the smart device while keeping the e-bike electronic system safe. A system prototype is implemented to prove the feasibility and performance of the system. Experimental results show that the proposed gateway based on a low-cost microcontroller can monitor data in real-time without losing data and ensure safety of the monitored system. The rest of this paper is organized as follows:
Section 2 discusses existing works.
Section 3 defines the problem of EMS and proposes our design to solve the problem. System implementation and prototype are demonstrated in
Section 4. Experimental results are discussed in
Section 5. Finally,
Section 6 concludes the paper.
2. Related Work
Severa
l smartphone-based systems have been developed for riders to improve the cycling experience. In these systems, an interface device between e-bike and smartphone is required. In [
3], the authors proposed a wind-aware speed advisory system for e-bikes. The system continuously monitors e-bike speed. When e-bikes are approaching a signaled intersection, the system communicates with the traffic light controller via the infrastructure-to-vehicle communications to receive the current traffic light state and wind information. Based on the information received, the system recommends the optimal speed for cyclists to avoid high-power consumption scenarios (i.e., having to stop and start at the intersections due to red traffic light signals), thus reducing the energy consumption of the e-bike. In [
4], a mobile cockpit system is presented to provide useful information to cyclists such as the battery state of charge (SoC), battery state of health (SoH), range prediction, and route guidance. The system collects information about the battery state, cyclist’s efforts (cadence and torque), route, and weather to build cyclist’s profile. The range autonomy prediction is calculated based on the current battery state, route taken, weather, and cyclist’s profile. In order to allow smartphones to be able to monitor the e-bike’s devices, interface devices are needed. However, the aforementioned works did not take into account the importance of designing interface devices.
Several studies have considered the design and implementation of interface devices. In [
12], the authors introduced an analysis of e-bike data usage collected through the WeBike project to identify riders’ behavior. The data include e-bike trips and battery status, which are collected by smartphone in real-time and are uploaded to the server whenever the smartphone is connected to the Internet. For the smartphone to be able to obtain the battery status, an interface device, a phidget board [
13], is used for communication between the smartphone and the battery monitoring sensors. Song et al. [
14] designed a novel system to monitor e-bike battery using smartphones. The system consists of a battery control unit and an Android client. The battery control unit monitors the battery status (temperature, voltage, current, SoC, SoH) and controls battery charging and discharging processes. The Android client can receive the battery status and send control commands to the battery control unit via Wi-Fi. In [
15], the authors proposed a smart e-bike monitoring system to monitor the data about power assistance level and location. The system includes an interface board, a smartphone, and a server. The interface board directly monitors the assistance level and sends it to the smartphone via the universal serial bus. The smartphone uploads the data to the server for data analysis. However, these studies may have only limited applications since they can only work with the manufacturers’ hardware and communication protocols.
In [
16], an Internet of Thing (IoT)-based cycling training solution is proposed. A trainer can monitor information about cyclist’s activities (such as speed, cadence, and power generated by the cyclist) online through a Web application. This information is published by hardware installed on the traditional bicycle. The hardware including sensors (speed, cadence, and force) and an interface device between sensors and server was designed. The interface device is responsible for collecting and processing data from sensors, which it then sends to the server via the internet. In this system, the interface device can be applied to regular bicycles, however, it is not suitable for e-bikes which already have those appropriate sensors installed.
In [
17], an architecture for e-bikes control is proposed. The system includes e-bike electronic devices, a gateway, and a smartphone. The e-bike devices are connected by CAN bus. The gateway acts as a central device and has CAN bus and Bluetooth interfaces for communication between the e-bike devices and the smartphone or joystick. The gateway periodically transmits messages which carry the data about battery SoC, motor temperature, e-bike speed, etc. to the application installed on the smartphone. The smartphone application presents the information received from the gateway to the rider.
Table 1 shows the feature comparison of prior works described above for e-bike monitoring with our system. For monitored data, the prior works only collect limited kinds of data, such as speed, battery state, assistance level, cyclist effort, and temperature but our system can access any data from the e-bike electronic system, such as the status of the energy sources to the users. For communication protocols, the above systems are based on IEEE 802.11p, Bluetooth, USB, WiFi, UART, MQTT, and CAN [
3,
14,
15,
16,
17], but our system is based on both Enerygybus/CANopen/CAN and Bluetooth. Our design ensures that the gateway can be used for a smart device to monitor any CANopen system in real-time without affecting the functionality of the monitored system.
On the other hand, CANopen communication protocol complements the application layer for CAN bus. CANopen specifications are provided by CiA301 [
9] and CiA302 [
18]. A CANopen device is modeled into three components, including communication units, object dictionary (OD), and application program. Communication units provide communication service objects, such as network management (NMT), process data object (PDO), service data object (SDO), synchronization (SYNC), emergency (EMCY), and heartbeat (HB). Each communication object is identified by a CAN-ID. The OD is the interface between the application and the communication services. The OD stores information about the configuration of services for communication units and variables of the node. Each object in the OD is addressed by a 16-bit index and an 8-bit sub-index. Based on the CANopen core defined in CiA301 and CiA302, some CiA draft standards define additional services for CANopen, such as CiA305 [
19] for node-ID assigning services and CiA320 [
20] for sleep/wake-up services. CiA also defines standards for CANopen application profiles such as CiA454 [
10] for energy management system of EnergyBus. The CANopen gateway can be developed based on specifications CiA309 [
11], CiA302-7 [
18], CiA315 [
21], and CiA457 [
22].
3. Energy Monitoring System
The proposed EMS for EnergyBus-based e-bikes is discussed in this section.
Section 3.1 presents overview of the EMS.
Section 3.2 shows the EMS architecture in which the system is divided by layers, such as data link, CANopen services, OD, and EMS App. The details of layers are then specified in
Section 3.3,
Section 3.4,
Section 3.5 and
Section 3.6.
3.1. System Overview
This section presents an overview of the proposed EMS for e-bikes is in
Figure 1. The EMS consists of an e-bike with its currently installed EnergyBus-based electronic system, a gateway connected to the EnergyBus, and an EMS application installed on a smart device, which connects to the gateway via Bluetooth. The aim of EMS is to obtain energy data from the EnergyBus devices of the e-bike as well as the current location from the GPS sensor in the smart device and provide useful energy-related information to the user. The energy data, location, and timestamp are then combined into tracking logs that may be useful for further trip analysis.
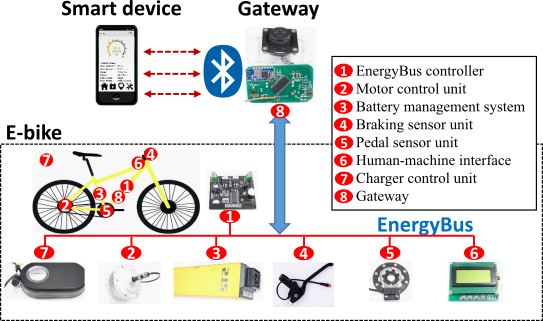
The electronic system of an EnergyBus-based e-bike [
23] includes a motor control unit (MCU), a battery management system (BMS), a braking sensor unit (BSU), a pedal sensor unit (PSU), a human-machine interface unit (HMI), and an EnergyBus controller (EBC). These devices use the EnergyBus protocol to communicate and can be called nodes of the network. When the system is running, nodes use the PDO services to transmit/receive process data to/from other nodes. The PDOs are synchronously transmitted after each SYNC message that is broadcasted by the EBC. In addition, the EBC uses the NMT services to manage the network and uses the SDO services to access data in the OD of nodes. The EBC also is an SDO manager that provides the SDO channels to other nodes, allowing them to access each other’s OD.
In our EMS, the energy-related information, including the battery status and the cyclist’s effort, is provided by the BMS and PSU, transferred through the CANopen network by means of the PDOs, and forwarded to the EMS application by the gateway. Due to incomplete energy information in the process data, the EMS application needs to access the OD of the nodes (i.e., BMS) for further energy information. The process is completed with the help of the gateway.
The heart of the proposed EMS is the communication gateway, which enables message exchange between the e-bike and the smart device. The gateway is installed on the e-bike and has two interfaces: the CANopen interface, connected to the EnergyBus of e-bike and the Bluetooth interface, enabling wireless connection with the smart device. The gateway forwards the PDO messages which transfer energy-related data from the CAN bus to EMS App. In addition, the gateway provides the SDO services for the EMS App to access data from the OD of any CANopen node. This data access process increases bus load of the CAN bus. If bus load is increased too high, it will increase the message latency causing the loss of messages which affects the correct functionality of the e-bike electronic system. Therefore, the design of gateway must not only ensure data exchange performance but also ensure that the CAN bus load does not increase excessively.
The gateway is an embedded device, including a controller which can efficiently communicate with the CAN bus and RS232, and a Bluetooth module interfacing with the controller through RS232.
Figure 2 shows the hardware block diagram of the gateway.
3.2. EMS Architecture
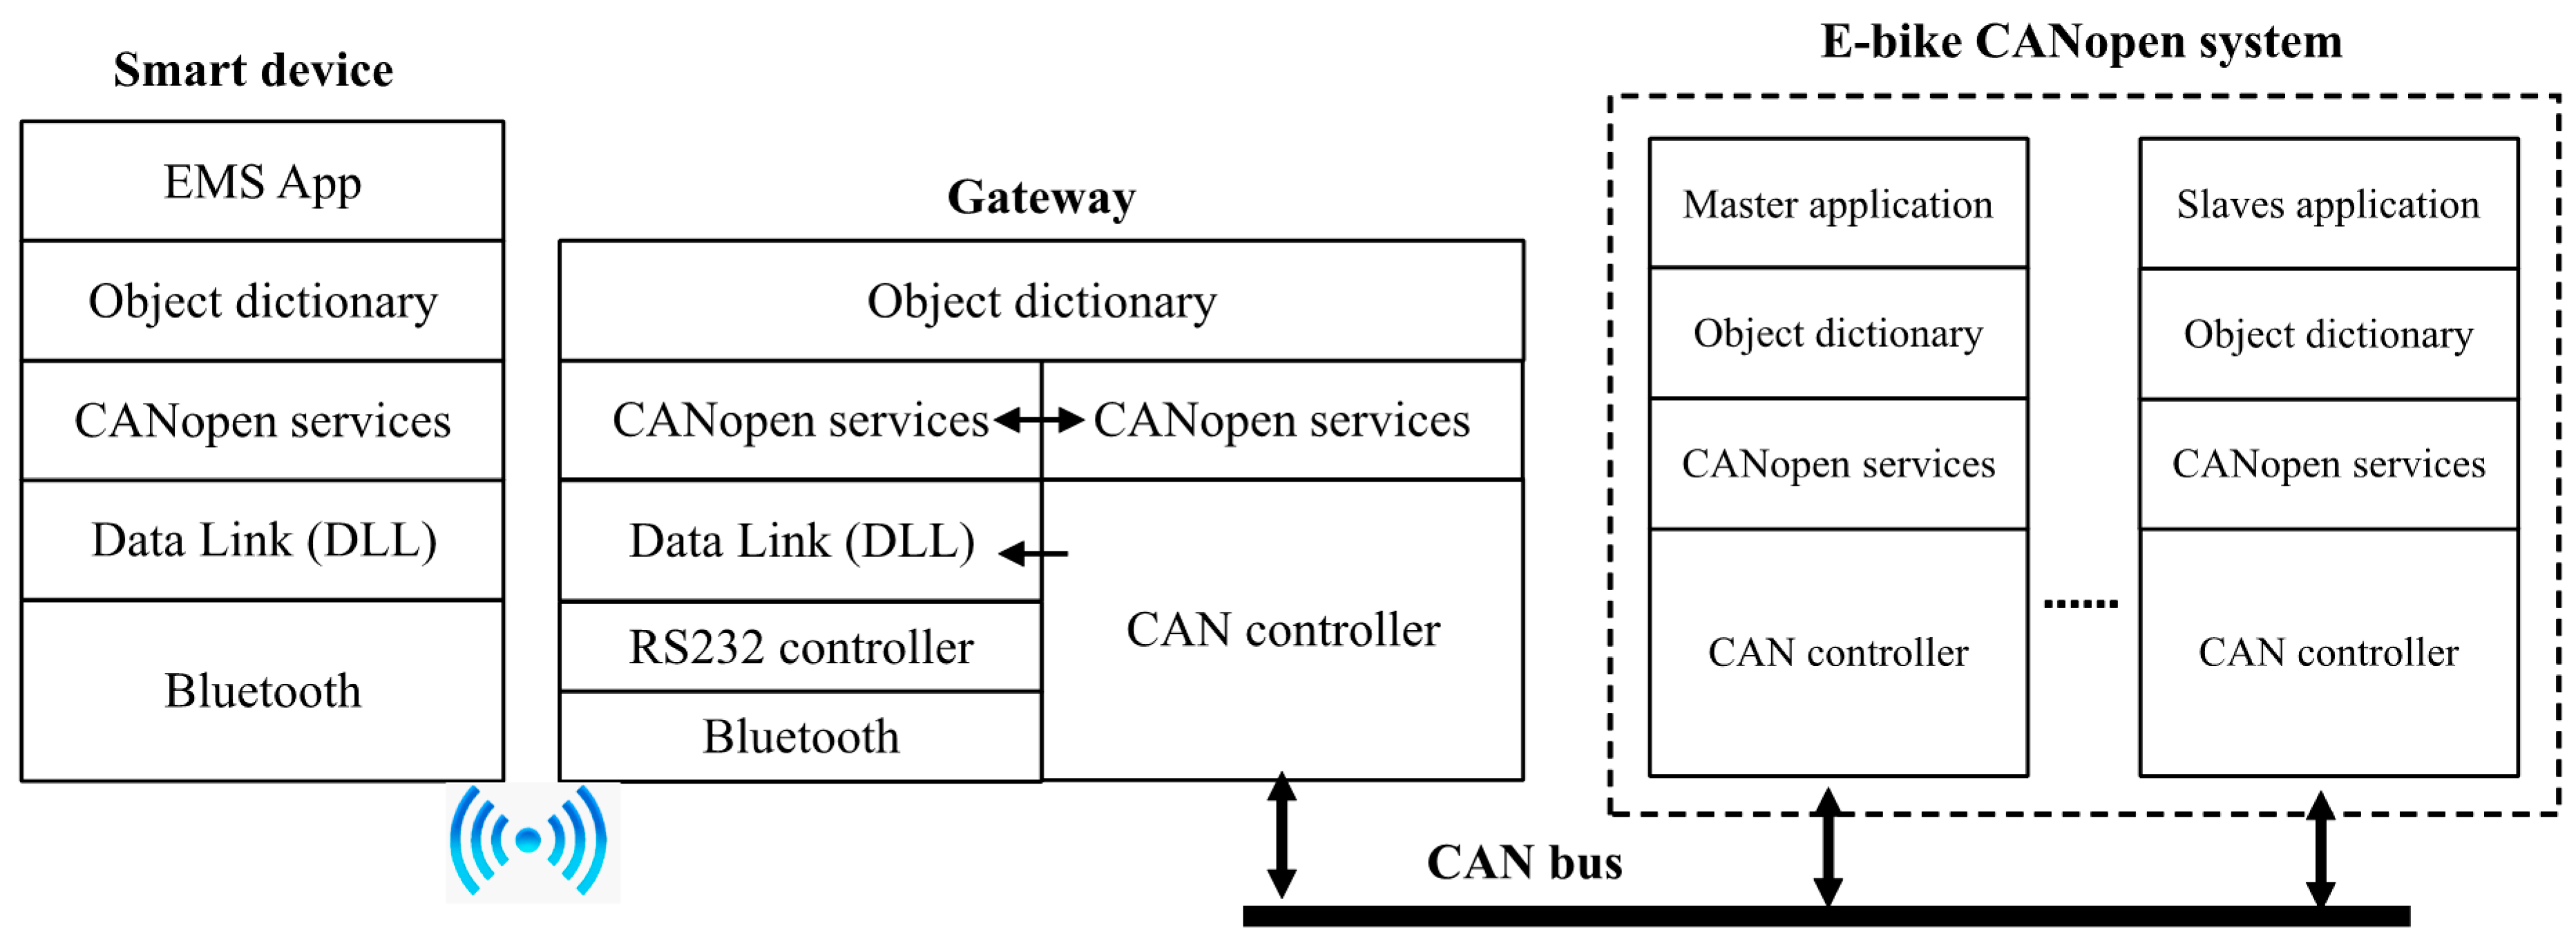
Figure 3 shows the system architecture of the EMS. At the Bluetooth side, the CANopen is also employed for communication between the smart device and gateway at application layer. Due to the Bluetooth/RS232 working at physical layer, a data link layer (DLL) is added between these two layers. Thus, the model of all devices in the EMS is the model of CANopen devices that includes the CAN message transmitter, CANopen stack, object dictionary, and application program.
The gateway enables data exchange between a CANopen system and a smart device via Bluetooth. As introduced in
Section 3.1, the gateway provides for the PDO forwarding and OD accessing services. Because the gateway must not understand the process data objects of the monitored system, the first service is done at DLL where the performance is higher than at the application layer. In this service, one-way messages coming from the CAN bus are monitored, filtered, and forwarded to the RS232 for smart devices. The filter ignores the unwanted CAN messages which affect the performance of smart device. Therefore, a smart device can receive any CAN message it needs. Then, the messages are processed at its CANopen layer. For example, smart device can use the PDO services to receive real-time process data from nodes. Thus, the PDO forwarding service is changed into a CAN messages forwarding service. The second service is done at the CANopen layer. The smart device uses the SDO services to access the OD of any node (including gateway). With this design, the gateway can limit the influence of smart device to an e-bike electronic system, and the gateway can be used for the smart device to monitor any CANopen system.
3.3. Data Link Layer
The main function of the DLL is the framing function for transmitting the CAN messages between smartphone and gateway. To transmit CAN messages through the Bluetooth/RS232, CAN-UART frames are used. Each CAN-UART frame carries a CAN message. The DLL encapsulates the CAN message into a CAN-UART frame and vice versa. Each CAN message contains an 11-bit message identifier (ID) (8 low bits IDL and 3 high bits IDH), a 4-bit message length (DLC) and up to 8 data bytes [
24]. The format of the CAN-UART frame, as shown in
Figure 4, consists of a header, a CAN message, and 1-byte checksum. The length of the header will be discussed in
Section 3.5.
Figure 5 shows the data flows in the DLL of the gateway. There is one flow for CAN message forwarding service and one flow between the DLL and CANopen layer for the SDO services. For the first flow, the DLL receives every CAN RX message from the CAN bus. Each message then goes to the filter; only messages with an allowed ID (i.e., PDO messages) can pass to queue up in the receive (RX) queue. Next, each message is de-queued from the RX queue and packed into the CAN-UART frame. Each byte of the CAN-UART frame is then sent to UART transmit (TX) buffer to wait to be transmitted. Finally, each CAN message is transmitted to the EMS App’s DLL and then is passed to the CANopen layer. In short, data of the CANopen devices on the CAN bus side have been transmitted to the EMS App.
For the second flow, first, the request message is sent from the smart device and enters the gateway via Bluetooth. Request messages are queued in the TX queue before going to the CANopen services layer. The CANopen layer then completes the SDO services on the CAN bus side with the target device. Finally, the response message returned from the CANopen layer is queued up in the RX queue to wait to be transmitted to the smart device.
The gateway must control the throughput of the second flow to keep the CAN bus load in a safe value. Therefore, the CAN bus load is a feedback value of the CANopen layer. A bus-load-monitoring module is added to collate statistics of all messages coming from the CAN bus to calculate the immediate CAN bus load.
Since many devices on the e-bike can concurrently send messages to the CAN bus, we designed a message-acceptance filter based on the message ID for letting only messages with specific allowed IDs to go through the gateway. Based on our monitoring purpose, in the configuration phase, we defined an array containing IDs of messages that we wanted to monitor (e.g., battery status messages, cyclist effort messages). This filter mechanism restricts the flood of data from multiple unwanted devices which cause an overflow in gateway.
An object, the RXFilter, is defined in the gateway’s OD to store filter configuration. As shown in
Figure 6, the RXFilter is an array with 64 elements. Since an expedited SDO can transfer up to 4 bytes of data, we defined each element of the RXFilter as 32 bits. Hence, the filter can handle a system with 2048 specific CAN-IDs (all possible cases of 11-bit message IDs). For configuration, if the
ith bit in the RXFilter is set to 1, the CAN messages with ID
i can go through the filter, as defined in
Table 2. When the gateway receives a CAN message that has ID
i, the indexes of
ith bit in the RXFilter are located at [
row][
column], where
row = i div 32 and
column= i mod 32. For example, for message ID
i = 35, the filter bit is located at the RXFilter[1],[3]. This conversion allows a fast response of the filter.
3.4. CAN Message Forwarding Service Model
As discussed in
Section 3.3, there are parameters for the gateway, namely, CAN bus load, header length of CAN-UART frame, and RX queue length. To determine these parameters and to evaluate the performance of the message forwarding service, the MM1 model [
25] is used to model the CAN message forwarding service in case the filter accepts all CAN messages. The arrival rate
λ is the number of CAN messages arriving at the CAN port of the gateway per second. The service rate
µ is the number of CAN messages departing to the Bluetooth port per second.
It is noted that we distinguish the concept of CAN message and CAN frame. Each CAN message contains 11-bit message ID, 4-bit message length, and up to 8 data bytes, whereas each CAN frame is a packet of a CAN message used to transmit the message through physical layer.
Assume that the monitored CANopen system uses
n different CAN message IDs to transmit data between nodes. Let
fi be the rate of message
mi (1 ≤
i ≤
n). The arrival rate
λ can be calculated by
Let
Li (bits),
LDi (0 ≤
LDi ≤ 8 bytes), and
RI be the length of CAN frame
mi, the data length of CAN message
mi, and the baud rate of CAN bus, respectively. The bus load
α can be calculated by
where
Li can be calculated by the worst case length of CAN frame
mi [
26].
Let
(bits) and
(0 ≤
LDi ≤ 8 bytes) be the average length of a CAN frame and the average data length of a CAN message, respectively.
By combining calculations in Equation (4) for Equation (1), we have:
The service process includes dequeuing, packaging, and transmitting. The dequeuing and packaging are processed for the next CAN-UART frame while each byte of the current CAN-UART frame is transmitted at the UART controller, assuming that the time for dequeuing and packaging processes is less than that for the CAN-UART frame transmitting process. Therefore, the service rate
µ can be calculated by
where
is the average time required to transmit a CAN-UART frame.
where
is the baud rate of UART,
l is the length of a UART frame (e.g.,
l = 10 bits for 1 start bit, 8 data bits, and 1 stop bit), and
is the average length of a CAN-UART frame. As the CAN-UART frame structure described in
Section 3.3,
The stability condition of the MM1 queue is
λ ≤ µ. Thus,
The average length of the RX queue is
In short, the bus-load-monitoring module can use Equations (2) and (3) to calculate the CAN bus load α. In the design phase, header length of CAN-UART frame and length of RX queue are required. For the header length, must be determined first by satisfying Equation (11), then, is found by Equation (9). The RX queue length is estimated by Equation (12).
3.5. CANopen Layer
In this section, we discuss the CANopen services for the smart device.
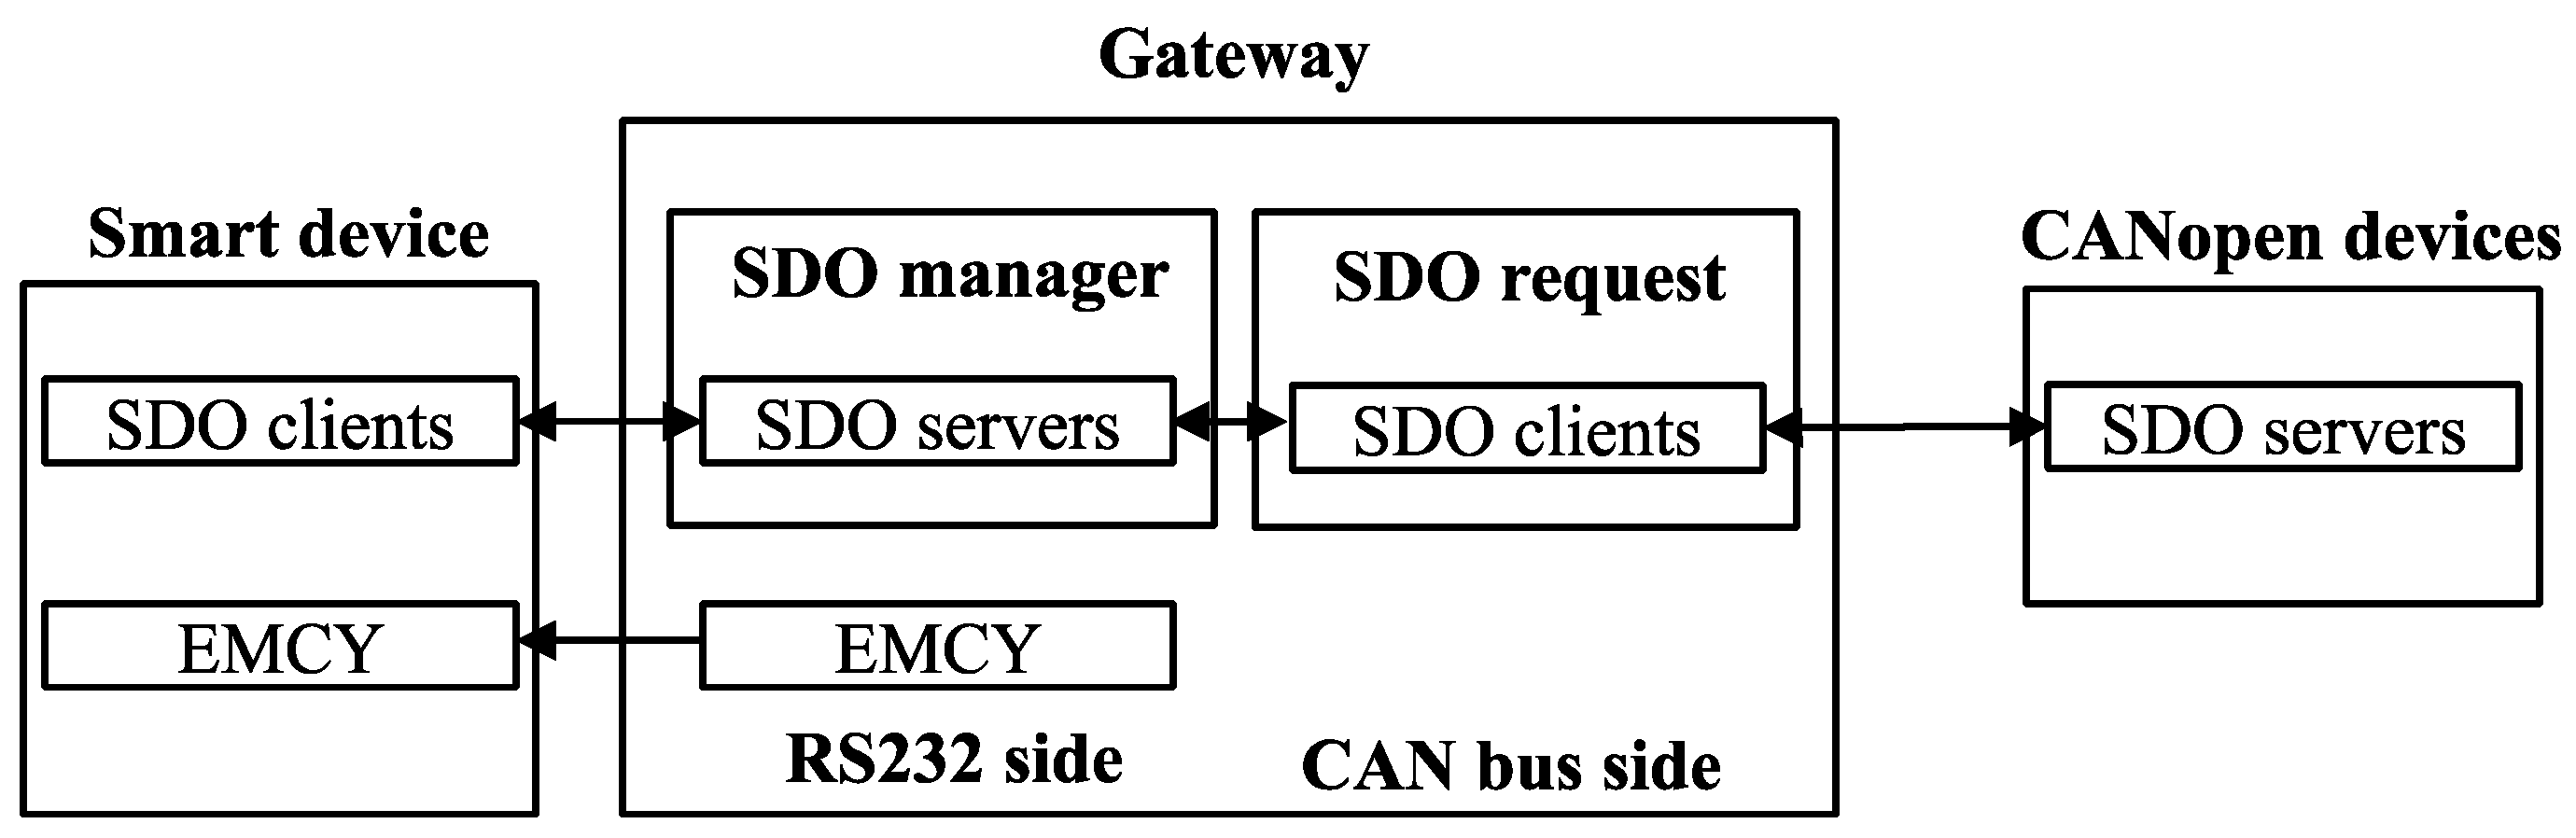
Figure 7 highlights two main CANopen services of EMS: SDO and EMCY. The EMCY producer service is used for the gateway to report its errors, if any, such as TX queue/RX queue overflow.
The SDO services of the gateway include couples of the SDO server and SDO client to adapt requests from the SDO clients of the smart device. Each couple works as a relay to serve an SDO client. It may have a maximum of 127 nodes in a CANopen network. Therefore, the gateway needs to provide 127 couples. The default channels are used for the SDO communication between the smart device and gateway. In particular, the smart device can use the default SDO channel to communicate with the desired node. The channels used for SDO communication between the gateway and nodes on the CAN bus side are provided by dynamic SDO request service [
18,
27]. In the configuration phase, the 127 couples are initialized as follows: the SDO server channels are assigned to default channels of node IDs from 1 to 127 and the SDO client channels are assigned to invalid values. Each SDO client channel of the gateway will be updated when the gateway serves an SDO client of the smart device for the first time. There are not enough valid channels for all SDO clients of the gateway at the same time, therefore, the gateway can use SDO release processes to release an SDO channel if it cannot request a new channel.
These SDO services increase the CAN bus load
α introduced in
Section 3.4. The worst case is that every CANopen node on the CAN bus side has only one default SDO channel, meaning that the SDO clients of gateway can only access nodes through the CANopen master (EBC). Then, if
F is the throughput of SDO commands sent from SDO clients of the smart device, the CAN bus load changes from
α to
α′ as follows:
where
is the maximum length of an
SDO message.
In fact, we have the constraint that new CAN bus load should be less than
M (maximum value for bus load), that is,
During the operation, the gateway periodically checks for and executes the SDO services if an SDO request from the smart device is available. F is used to determine the SDO cycle 1/F at which the gateway can send an SDO command to the system.
3.6. System Operation Flow
Figure 8 shows the operation flow of our EMS. First, the Bluetooth connection between the smart device and gateway needs to be established. Then, at the first run time, the EMS App will configure the filter of the gateway DLL. To configure the filter, the EMS App uses SDO services to update the RXFilter object in the gateway’s OD. Finally, the EMS App can monitor, present, and record energy data taken from the e-bike. The real-time energy information, including the battery status (such as the remaining capacity, voltage, current, and temperature) and rider effort (such as the torque and pedal speed), is located in the OD of the EMS App and updated automatically by the PDO service. Further energy information about the detailed battery status (such as the state of health and cell voltage) is not transmitted by the PDOs in the EnergyBus; therefore, the EMS App uses the SDO services to obtain this information.
In the task of data presentation, the battery remaining time, instant range, and rider energy consumption are also considered. Let
Erm,
Pcs be the battery remaining energy and the power consumption, respectively.
Erm and
Pcs can be calculated as follows:
where SoC (state of charge) is the battery remaining capacity in percentages, SoH is the state of health of the battery in percentages,
Er is the full energy capacity of the battery when it is manufactured,
V is the battery voltage, and
I is the battery current. The remaining time
Tr, of the battery can be calculated as follows:
The instant range
d, based on the current e-bike speed
v and battery remaining time
Tr, can be calculated as follows:
Let
Prd be the rider power and ∆
t be the sampling period. The rider energy consumption
Erd can be given as follows:
Let
Trd,
ꞷpd be the torque and pedal speed, respectively. The rider power
Prd can be given as follows:
4. System Implementation and Prototype
We implemented a gateway and an EMS App to realize the proposed EMS. The gateway prototype includes a peripheral interface controller (PIC) 18F2680 40-MHz low-cost microcontroller and HM10 Bluetooth module, as shown in
Figure 9. The PIC microcontroller is programed by a MPLAB X IDE [
28] with the C18 compiler [
29]. The CANopenNode v1.10 [
30], which is a CANopen open source program for microcontrollers, is adopted to program the PIC18F2680. The HM10 Bluetooth module [
31] is a Bluetooth low energy module interfacing with the microcontroller and smartphone through the UART serial communication and Bluetooth, respectively. The EMS App is implemented by an Android Studio IDE. The EMS App prototype, as shown in
Figure 10, includes aggregate monitor, battery monitor, and history data report interfaces. The aggregate monitor interface is the main interface. The battery monitor interface shows battery status in detail, and the history data report interface presents the rider’s past physical activities. Riders can use the EMS for EnergyBus devices such as the battery (
Figure 11a), the battery and charger (in charging process) (
Figure 11b), or the e-bike (
Figure 11c).
To demonstrate the monitoring functions of the EMS, we conducted two scenarios for battery charging and battery discharging. In the charging monitoring scenario, we used an ST2 battery and a charger manufactured by TD HiTech Energy Inc. The ST2 battery is a 48 V, 17 Ah, 814 Wh lithium-ion battery. In the discharging monitoring scenario, we used a real e-bike equipped with the ST2 battery. To evaluate the gateway, we simulated an EnergyBus e-bike system [
23] that consists of nodes, such as EBC, BMS, MCU, HMI, BSU, PSU, a light control unit, and a security unit, as shown in
Figure 12. We used Micorchip EVM boards APP001 and CANopenNode v1.10 to implement the nodes of the CANopen system. The configuration of transmit-PDOs (TPDOs) in an EnergyBus system for each node is described in
Table 3. Each node has a heartbeat producer that produces a heartbeat message per second. The EBC is the master node that manages the network and produces the SYNC for synchronous TPDOs. The TPDOs are transmitted with every SYNC. Every byte in the data field of every TPDO is 0. The CAN baud rate is 250 k baud.


