Article

Assessing Exergy-Based Economic and Sustainability Analyses of a Military Gas Turbine Engine Fueled with Various Fuels

1
Department of Mechanical Engineering, Ege University, Bornova, Izmir 35100, Turkey
2
Department of Energy Engineering, Yasar University, Bornova, Izmir 35100, Turkey
*
Author to whom correspondence should be addressed.
Energies 2020, 13(15), 3823; https://doi.org/10.3390/en13153823
Submission received: 7 July 2020 / Revised: 23 July 2020 / Accepted: 24 July 2020 / Published: 25 July 2020

Abstract

:
This research put forth exergy-based economic and sustainability analyses of a (J85-GE-5H) military turbojet engine (TJE). Firstly, sustainability, conventional exergoeconomic and advanced exergoeconomic cost analyses were executed utilizing kerosene fuel according to real engine working circumstances. The engine was likewise investigated parametrically, considering H2 fuel utilization. The sustainable economic analysis assessment of the TJE was finally actualized by comparing the acquired outcomes for both fuels. The entire engine’s unit exergy cost of product ( c Pr ) with kerosene was determined 76.45 $/GJ for the military (MIL) process mode (PM), whereas it was computed 94.97 $/GJ for the afterburner (AB) PM. Given the use of H2, the c Pr increased to 179 and 288 $/GJ for the aforementioned two modes, seriatim. While the sustainability cost index (SCI) values were obtained 52.86 and 78.84 $/GJ for the MIL and AB PM, seriatim, they became 128 and 244 $/GJ when considering H2. Consequently, the higher exergy demolitions occurring in the afterburner exhaust duct (ABED) and combustion chamber (CC) sections led to higher exergy destruction costs in the TJE. However, the engine worked less cost efficient with H2 fuel rather than JP-8 fuel because of the higher cost value of fuel.

Graphical Abstract

1. Introduction

Energy is an underlying phenomenon in thermodynamics and the production phase of energy is based on the notable applications of engineering examination. The systems which generate power are designed simple in order to convert energy into another. Regardless of energy, type and mode of production, it takes place in every aspect of life as a parameter that constitutes the most important agenda of our near future. The increase in energy demand is directly proportional to technological development, population and economic growth. In this context, the increase in global warming and air pollution has become the focus of energy analysis because of post-combustion products released into the atmosphere [1,2,3,4]. Aviation, standing out as the sector that creates the most energy consumption and the most pollution, is the main field of international research [5,6,7,8,9,10,11]. In order to provide the basis for sustainable environment-friendly policies, the road map provided in the 2018 report predicts that fossil energy resources will provide a significant share in energy production by the 2040s [12]. Energy engineers must deal with the reduction of oil reserves in the world by taking into account the increase in oil prices and environmental concerns by that time. This then draws the attention of researchers as an important issue, waiting to be resolved. Therefore, the importance of using alternative energy sources after exhaustion of fossil fuels stands out at this point. In this regard, hydrogen fuel, as a least-contaminant and eco-friendly resource, has been considered in research to alter these challenges. Fuel cell systems have become prominent in these studies with feasible results [13,14,15,16,17,18,19,20,21,22,23,24]. However, as time goes by, it has been determined that hydrogen has its disadvantages as well as its advantages [25,26,27,28,29,30]. The difficulties in obtaining and storing the hydrogen have become the serious challenges to be solved in aviation sector [31,32,33].
As is well-known, thermodynamic principles, on which the aircraft propulsion systems are based, are regarded as potent methods to assess systems in terms of efficiency and sustainability aspects. However, the performance analysis is the simultaneous evaluation of the energy efficiency obtained from energy sources and the cost effectiveness. Therefore, researchers aim to minimize the cost formation and environmental effects of aircraft engines in order to get maximum efficiency from the system by implementing design improvements and configuration changes [34,35,36,37,38,39,40]. This sustainable target can be achieved by using the highest quality fuel with the lowest fuel rate, reducing the exergy consumptions and minimizing the cost of investment regardless of the type of fuel utilized. Therefore, from an integrated viewpoint, aircraft engines have been considered and evaluated in scientific research not only with thermodynamic analysis but also with economic analysis. In accordance with the thermodynamic rules, exergy analysis is carried out to put forth the irreversible processes leading to exergy destructions in the system [41,42,43,44,45,46,47]. However, the interpretation of the irreversible processes will be completed by the implementation of the economic analysis. Economic analysis ensures cost values for investment, operating and maintenance and exergy flows. Exergoeconomic analysis, which integrates exergy and economic analyses, has been carried out in the gas turbine system to highlight the significant sections to be improved [37,48,49,50,51,52,53]. Researchers can perform a more comprehensive analysis by examining the interactions of sections with each other in terms of the value of exergy destructions as well as the value of investment costs in a gas turbine engine. Although the cost value of inefficiencies as a result of thermodynamic irreversible processes can be examined by conventional exergoeconomic analysis, further evaluation can only be attained via advanced exergoeconomic analysis by examining the provenance of the irreversible processes and recovery capacity in terms of cost to get accurate results [54,55,56,57,58,59,60,61,62].
In contrast to prior research, the J85-GE-5H turbojet engine’s (TJE) comparative cost analyses, taking into account advanced exergoeconomic analyses by using hydrogen fuel, have not been perceived in the course of the literature review. The main significance and the individuality of this research can be summarized by numerically analyzing the mentioned analyses as follows:
  • Reckon the exergy destruction costs of the entire engine and sections;
  • Investigate the exergy, exergoeconomic and sustainability performance parameters for the military (MIL) and afterburner (AB) process modes (PM) for both kerosene and hydrogen fuel utilizations;
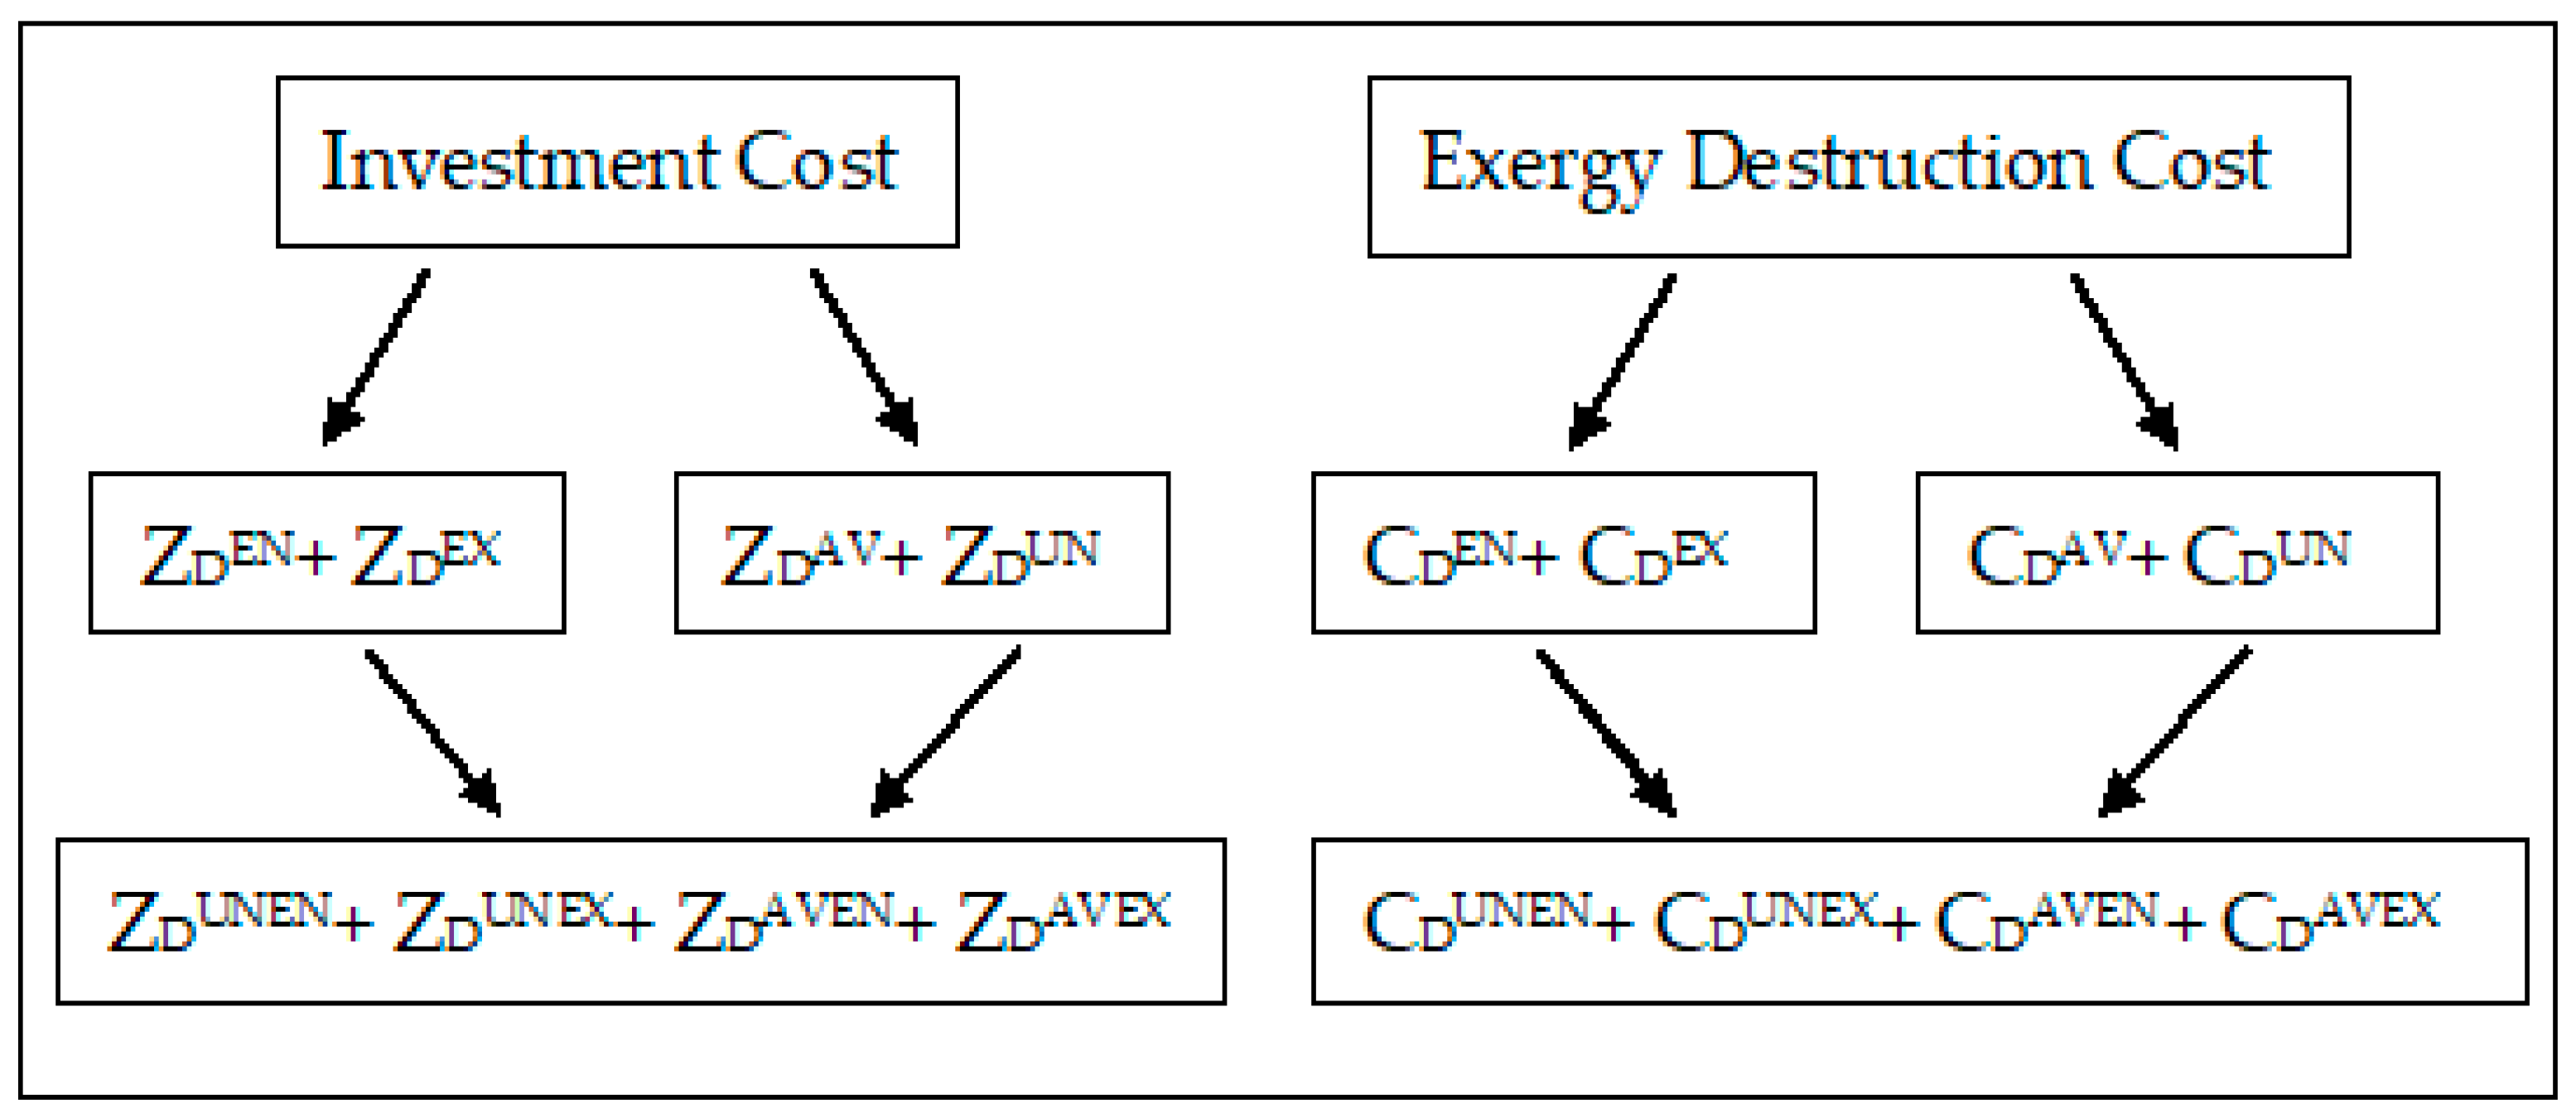
  • Assign advanced exergoeconomic cost rates of the entire engine and sections by breaking them down to unavoidable/avoidable and exogenous/endogenous portions;
  • Check the advanced exergoeconomic cost rates for both kerosene and hydrogen fuel utilizations;
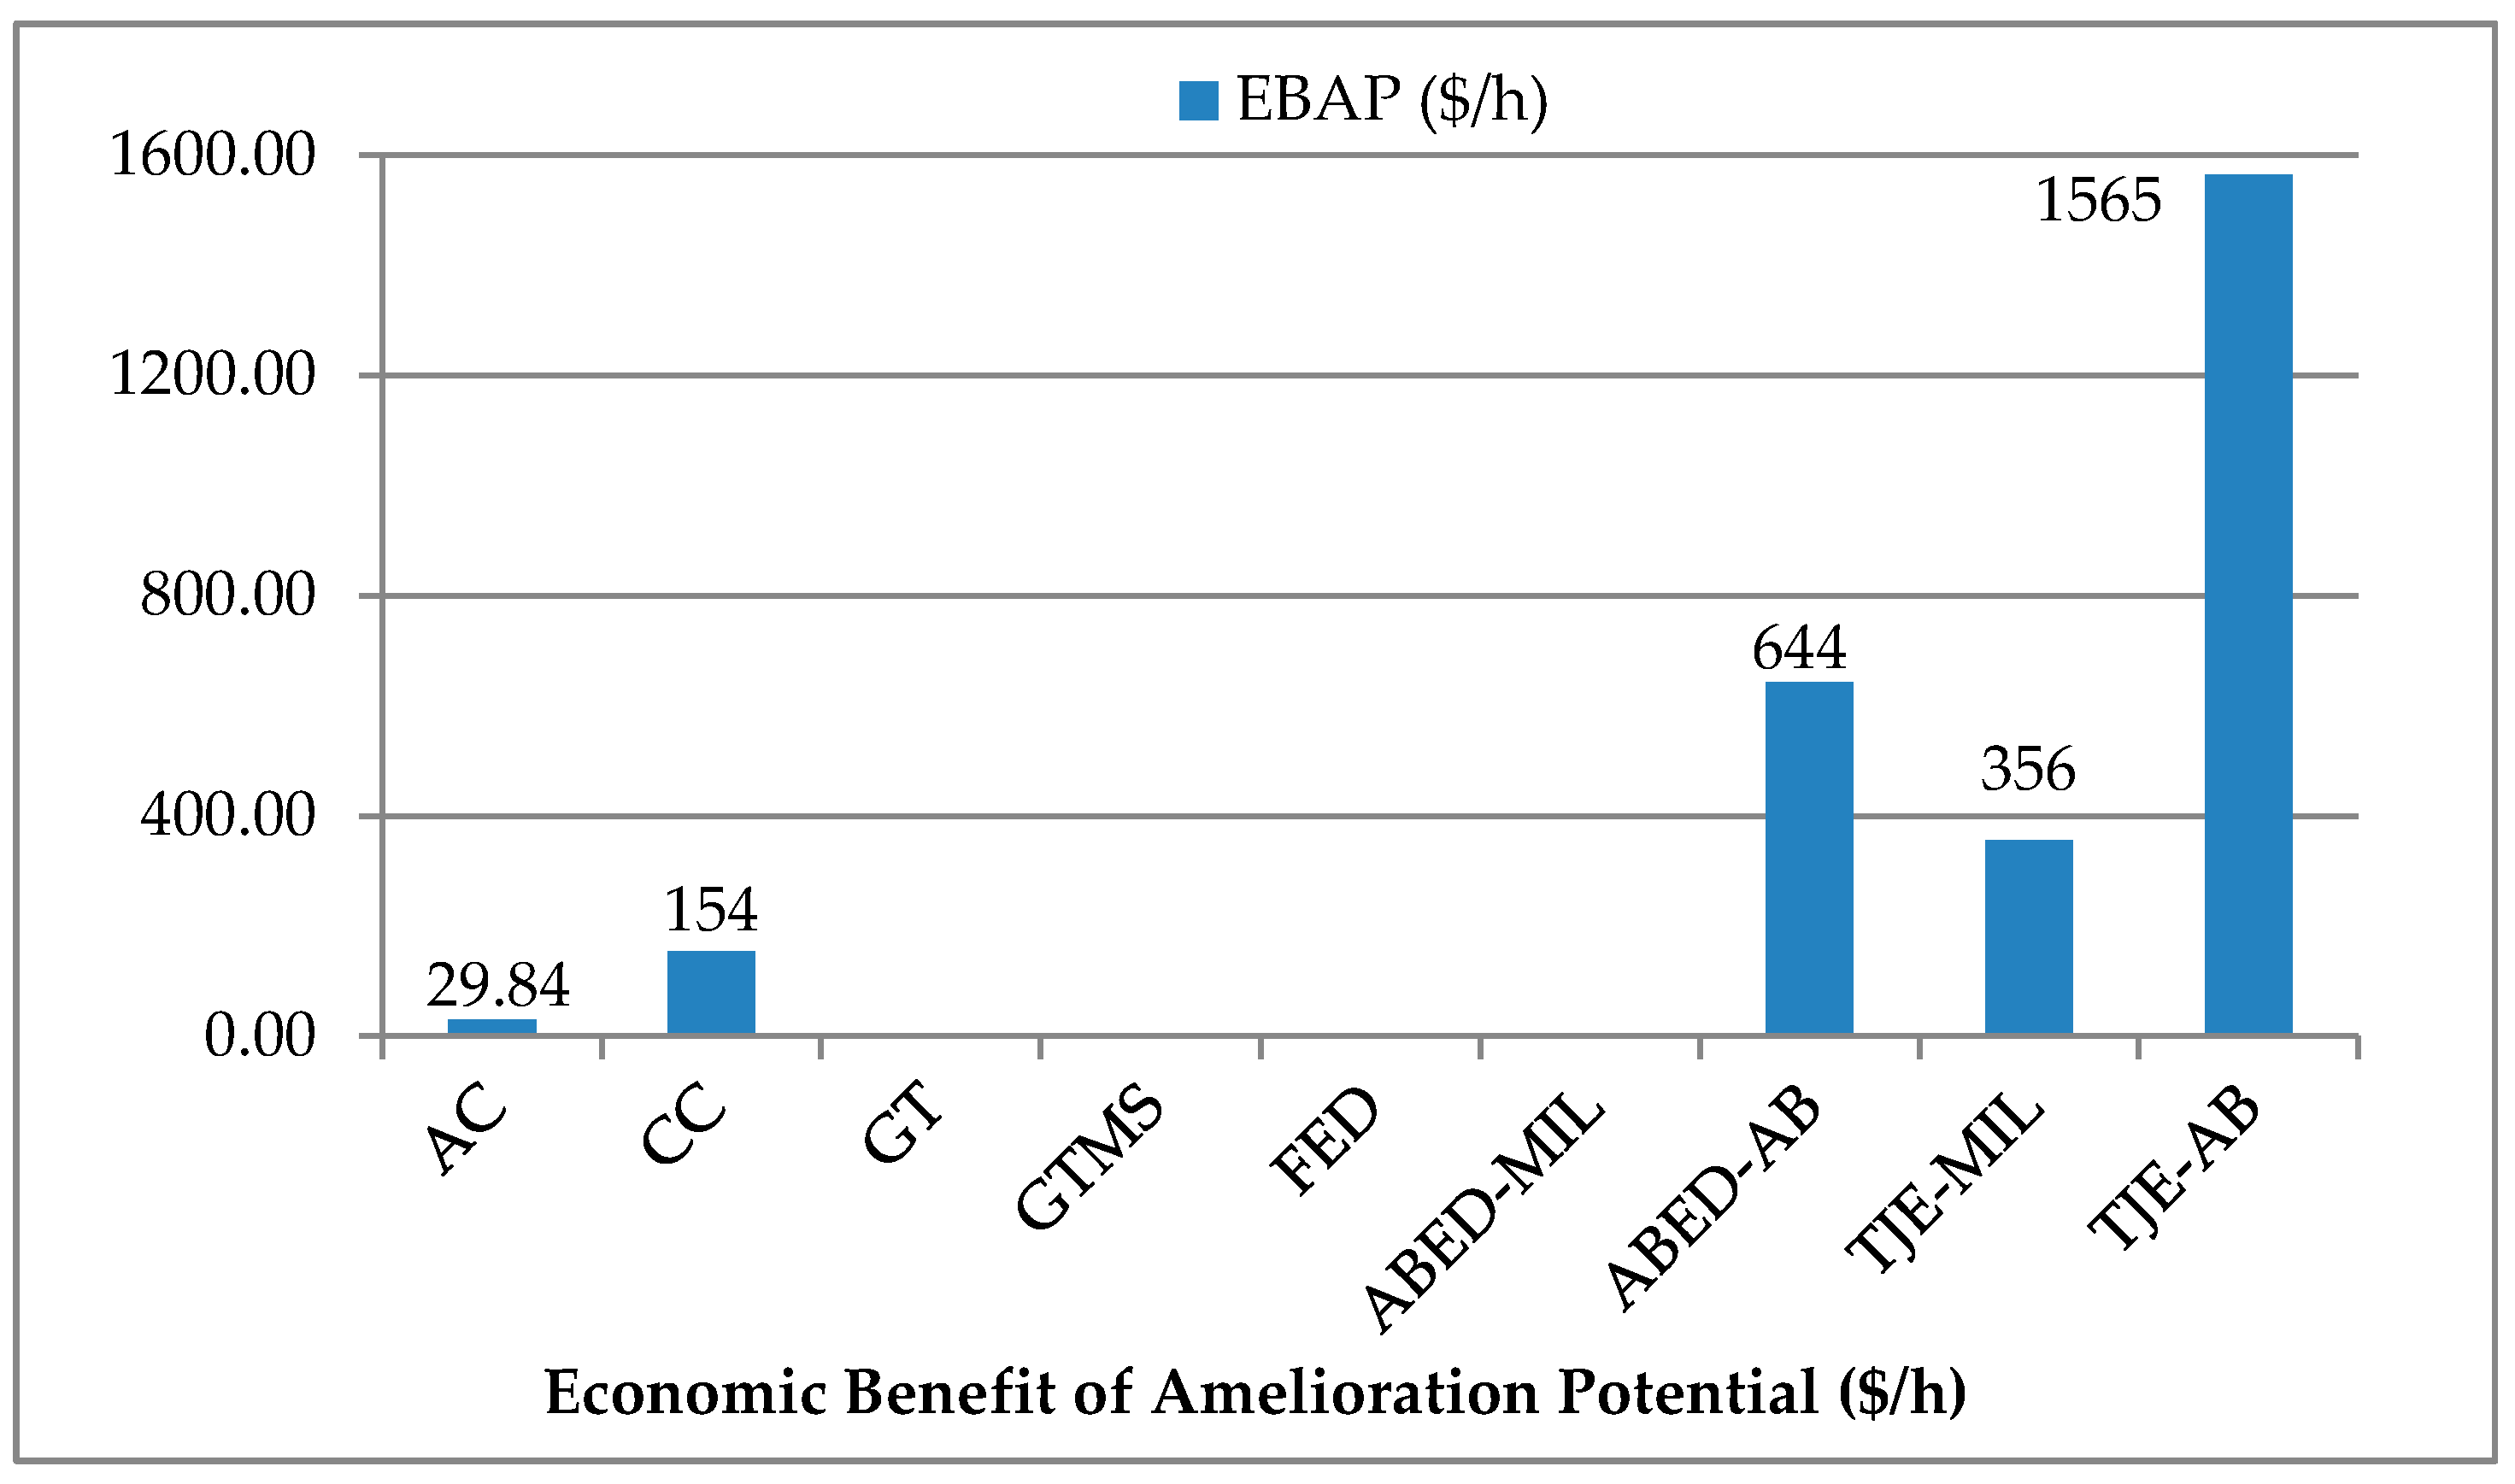
  • Reveal the sections that can be ameliorated by calculating economic benefit of amelioration potential (EBAP) for JP-8 and H2 fuels.

2. Methodology

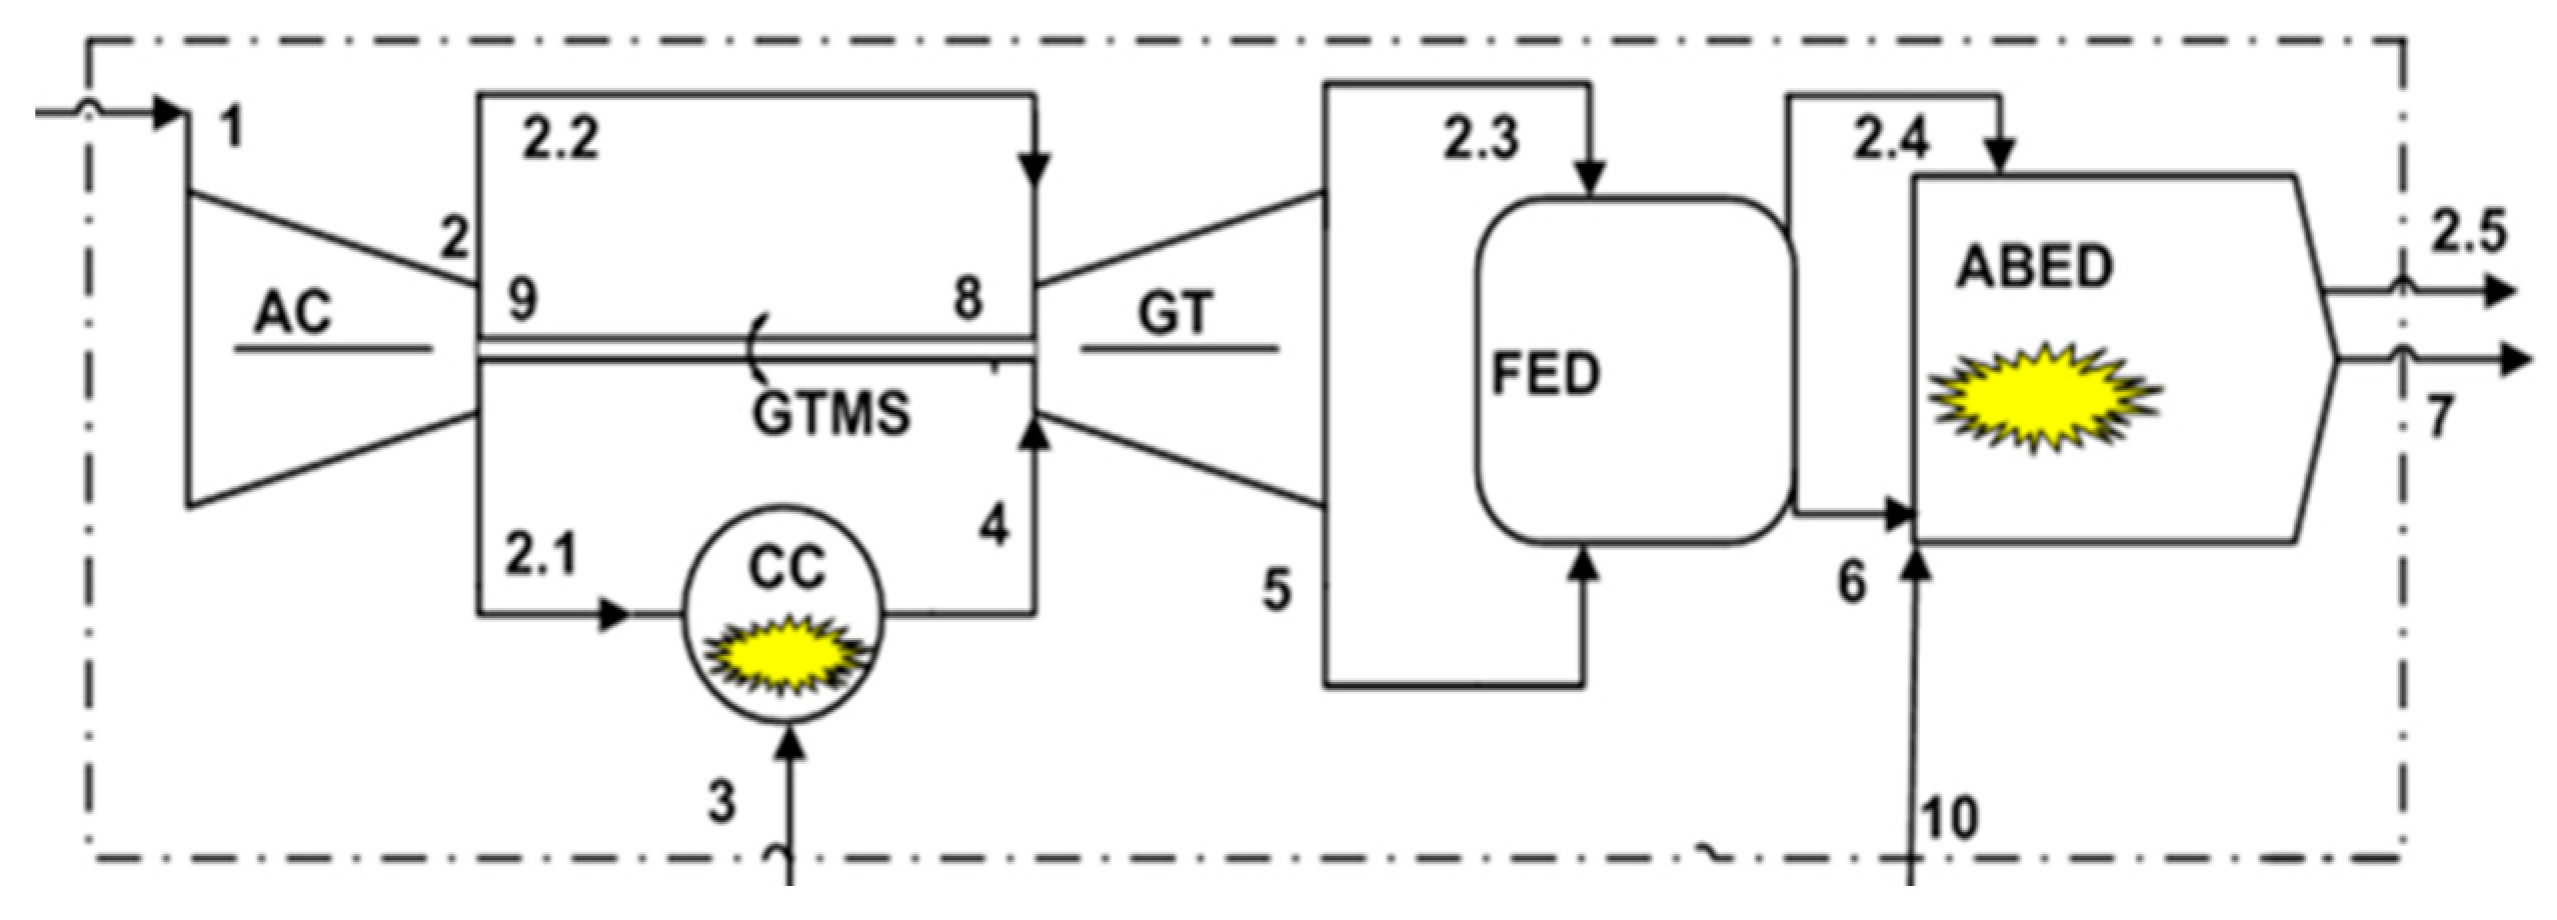
2.1. Specification of TJE

(J85-GE-5H) TJE has high impulse and lightness characteristics provided by the integrated eight-level axial compressor and two-level axial turbine. The compressor (AC) and gas turbine (GT) consist of rotor (moving) and stator (fixed) blades. Rows of rotor and stator fins form a stage. There are six cellular-circular combustion chambers (CC) between the AC and the GT. The second part, where post-combustion occurs, is called the afterburner exhaust duct (ABED). The burning process takes place in the orbicular CC and ABED sections. The basic configuration sections that form the TJE are as listed below:
  • Compressor (AC)
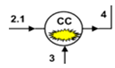
  • Combustion chamber (CC)
  • Gas turbine mechanical shaft (GTMS)
  • Gas turbine (GT)
  • Forward exhaust duct (FED)
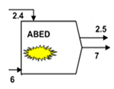
  • Afterburner exhaust duct (ABED)
The technical parameters are demonstrated as follows:
The power output was reckoned with the values of 5106 and 8575 kW for the MIL and AB PM, seriatim [63]. The take-off thrust is 25.80 kN, the outside diameter of the TJE is 0.52 m, the engine length is 2.75 m, the engine weight is 265 kg, the flight speed range is 301–1004 m/s, the maximum operating altitude is 45,000 ft and the starting altitude range is 0–25,000 ft [64].
In this study, a cost analysis of J85-GE-5H TJE, used in T-38 training aircraft, was assessed with regards to its thermodynamic and thermoeconomic aspects. In this context, exergy-based sustainability, exergoeconomic and advanced exergoeconomic analyses of the engine were executed by considering the calculated costs in line with the data obtained from the engine test unit. The experimental throughput has been displayed in the control unit in order to trace values such as pressure (P), mass rates ( m ˙ ) and temperature (T), which have been obtained by indicators attached on the TJE. As the engine worked in the engine test cell, the inlet duct was not taken into account in the analysis [63]. The physicochemical properties of JP-8 and H2 are indicated as follows:
The kerosene fuel consists of approximately 9% C8–C9 aliphatic hydrocarbons, 65% C10–C14 aliphatic hydrocarbons, 7% C15–C17 aliphatic hydrocarbons and 18% aromatics with molecular weight: ≈ 180, synonyms: JP-8, freezing point maximum: −47 °C, boiling point: 175–300 °C, vapor pressure: 0.52 mm Hg (10 °C), 1.8 mm Hg (28 °C), specific gravity: minimum: 0.775 kg/L (15 °C), maximum: 0.840 kg/L (15 °C), the lower heating value (LHV) 119,450 kJ/kg and viscosity: 8 10−6 kg/(m·s) (−20 °C) [65]. The liquefied hydrogen consists of two hydrogen atoms with molecular weight: 2.0159, synonyms: H2, melting point: −259.35 °C, boiling point: −252.88 °C, the LHV 43,124kJ/kg, density (gas): 0.08988 g/L (0 °C, 1 atm) and density (liquid): 70.8 g/L (at −253 °C) [66]. The air entering the engine is pressurized in the compressor section and passes to the combustion chamber section. Here, the mixture formed with pulverized sprayed JP-8 jet fuel is burned with spark plugs. The burnt gases expand in the GT and create mechanical work. While some of the mechanical work provides the movement of the AC and other engine accessories by rotating the mechanical shaft, the remaining part provides the necessary thrust for the flight. An extra impulse that may be needed depending on the flight characteristic is achieved by burning the sprayed AB fuel with the combustion gases in the ABED section. A basic cross section of TJE and the flow directions of air and gases are shown in Figure 1.

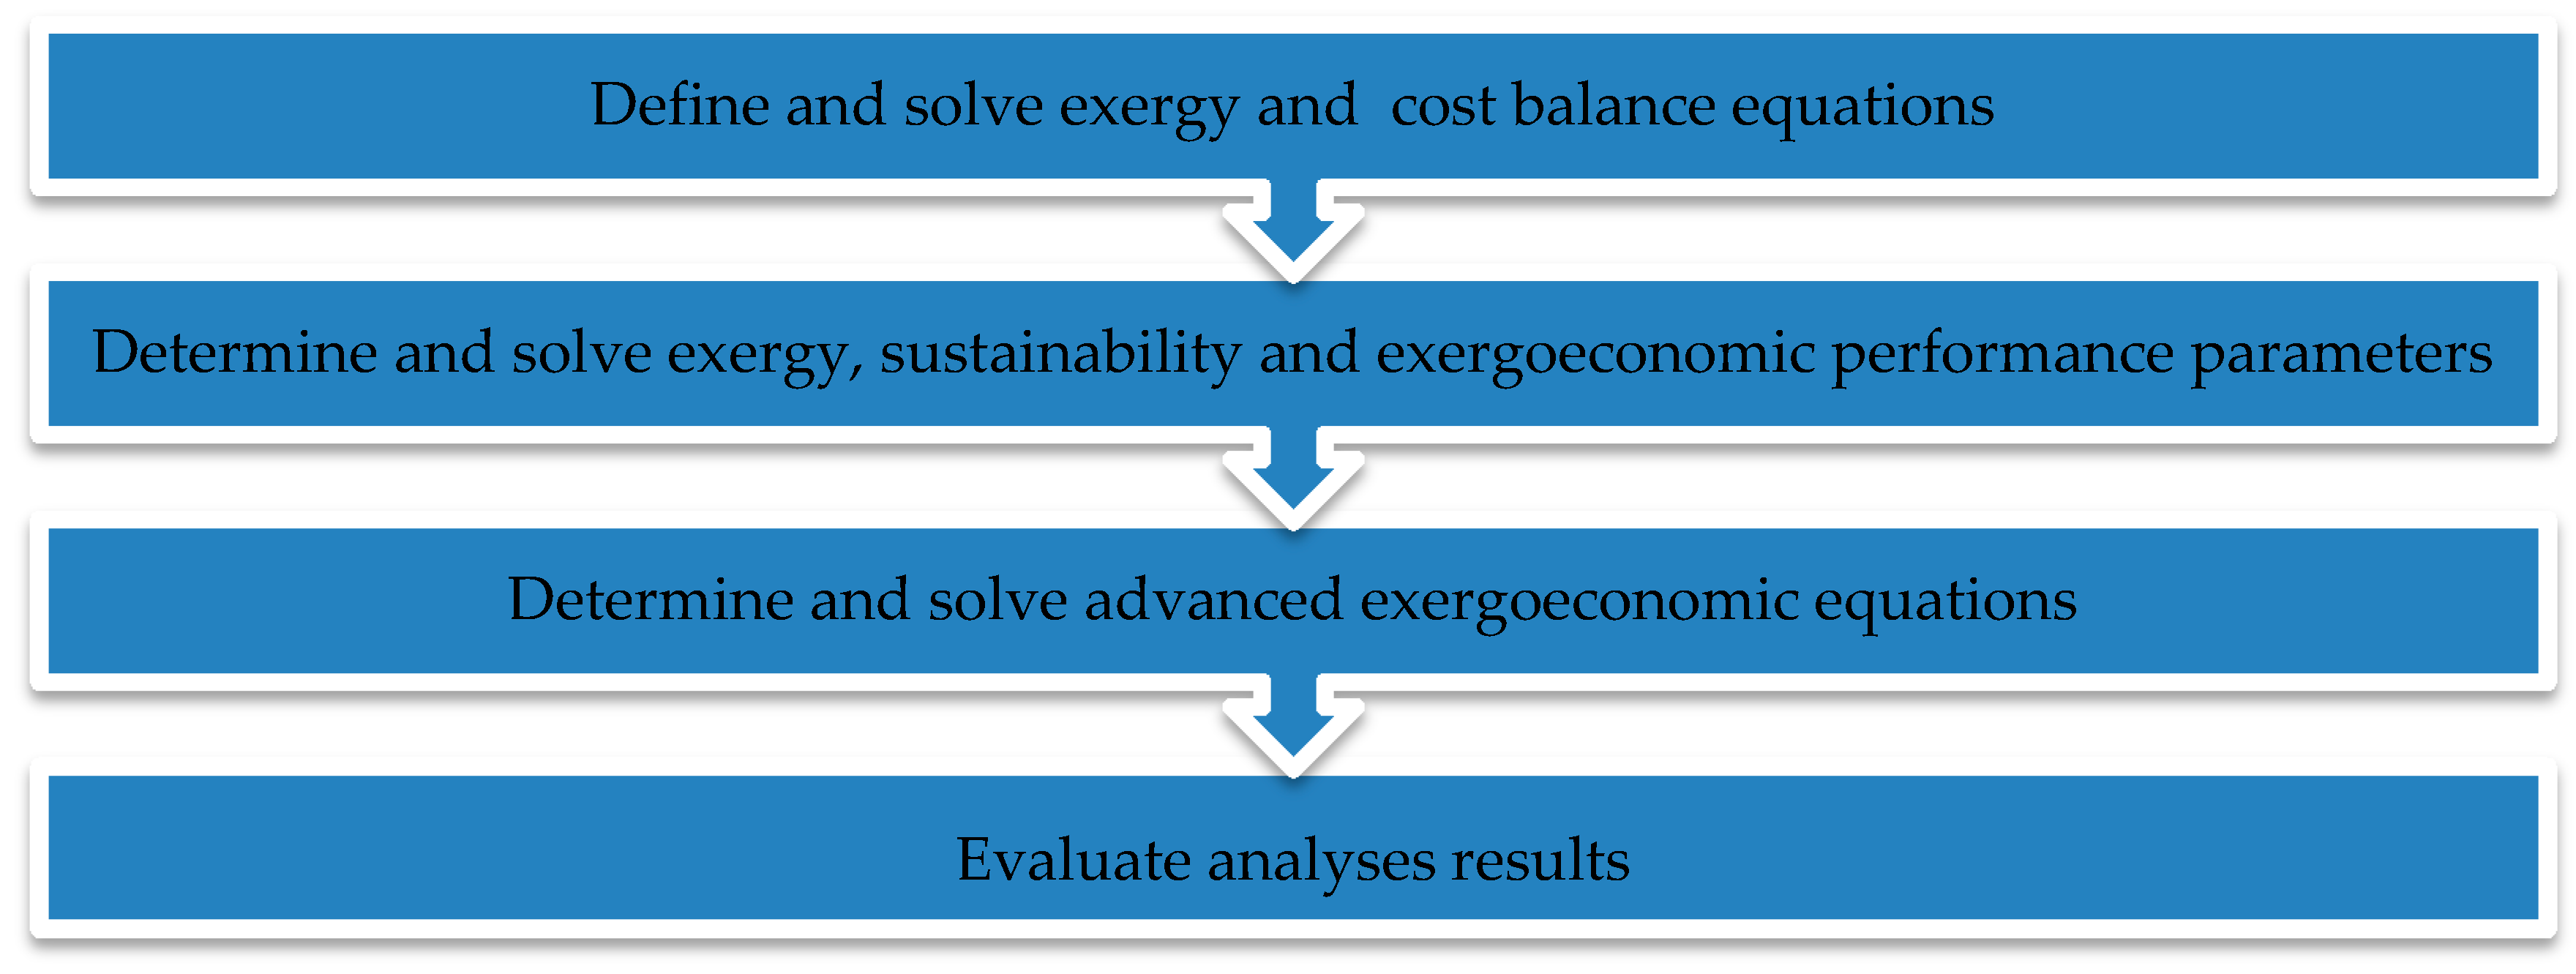
2.2. The Flow Process of the Analyses

The main flow process of the analyses is charted as shown in Figure 2.
The process starts with the definition of the process and ends up with the analyses of the outcomes of the study.

2.3. Assumptions Made

The listed assumptions are given as follows:
  • Calculations for air and burnout gases were considered with the ideal gas assumption.
  • The TJE operated under constant conditions.
  • The fully burned gases were gained upon the completion of the operation.
  • Not only in kinetic exergy but also in potential exergy, no changes occur.
  • The inlet velocity (Vin) was considered zero because of the constant test conditions.
  • The heat transfer ratios in AC and GT sections were regarded adiabatic [6,15].
  • Kerosene and hydrogen are taken into account as fuels in this research.

2.4. Exergy Analysis

Exergy, an effective appliance, uses not only the second law of thermodynamics, but also the principles of mass and energy conservation. Exergy makes it possible to use the energy resources more efficiently by considering the best performance of the gas turbine systems because it can state the site and amount of wastes. In other words, the consumption of exergy leads to an entropy production as an output of the irreversible processes in a system. The general balance equation regarding the exergy is expressed as follows:
n ( 1 T o T n ) Q ˙ n W ˙ + i n E ˙ x i n o u t E ˙ x o u t E ˙ x D = 0
The Q ˙ n , W ˙ , E ˙ x and E ˙ x D represent the ratio of heat transfer at T n temperature, the ratio of work, the flow ratio of exergy and the ratio of exergy destruction, seriatim.
The equation regarding the exergy can be expressed as follows [15,41,42]:
E ˙ x F = E ˙ x Pr + E ˙ x D
where E ˙ x F and E ˙ x Pr represent the ratio of fuel exergy and the ratio of product exergy, seriatim.
The E ˙ x L and E ˙ x C represent the exergy losses and exergy consumption, seriatim. The sum of E ˙ x L and E ˙ x D is E ˙ x C [6,63]:
E ˙ x C = E ˙ x D + E ˙ x L

2.5. Conventional Exergoeconomic Analysis

The method of exergy analysis is utilized to assess thermodynamically the inefficiencies arising from irreversible processes. The assessment of the inefficiencies in the system by assigning cost values expresses the economic dimension of engineering analysis. The analysis method, which deals with the engineering analysis of the system integrated with exergy-based thermodynamic and economic analysis, is called exergoeconomic analysis. Exergoeconomic analysis takes into account all the expenditures made during the life cycle starting from the design phase of the system. It provides an extensive assessment opportunity. The types of costs can be determined by the exergoeconomic analysis method with (i) investment costs, (ii) maintenance and operating costs, (iii) exergy destruction costs and (iv) exergy loss costs [4,48,50]. There is more than one method in the literature related to the exergoeconomic analysis. The Specific Exergy Cost (SPECO) method was applied in this research. This method involves determining the exergy flows inserting and outgoing the process and solving equilibrium equations and related auxiliary equations created for unit exergy cost value analysis [35]. With this scope, the hourly levelized cost methodology has been chosen and the regarding equations have been demonstrated in Table 1 [48,49,51,52].
The equations regarding the TJE and its sections’ hourly cost rate method algorithms are given in Table 2.

2.6. Economic Data

The T I C T J E and O M C ˙ T J E values of the TJE are 1,200,000 $ and 72,000 $/yr, seriatim [64]. The yearly working time of the system, the interest rate, the salvage value rate and the engine lifetime are assumed to be 300 h/yr, 10%, 15% and 15 years, seriatim. While the selling price of JP-8 is considered 0.572 $/kg [64], it is considered to be 5.5 $/kg for H2 fuel [52]. The C ˙ F of JP-8 are reckoned 10.26 and 10.10 $/h for MIL and AB PM, seriatim, whereas they are calculated 10.16 and 16.54 $/h. The cost of equipment and the hourly cost rates are shown in Table 3.
Table A1 and Table A2 indicate the rates of energy, exergy, mass flow, pressure and specific heat capacity for the TJE sections, seriatim, in Appendix A [63]. The equations respecting exergy and cost balance are denoted in Table 4.

2.7. Exergy and Exergoeconomic Performance Metrics

The performance metrics of the TJE respecting exergy, sustainability and exergoeconomic are assigned in Table 5 [6,37,44,49,63].
In accordance with Table A1 and Table A2, Table 6 and Table 7 demonstrate the rate of exergy, the cost rates of exergy flow and the unit exergy as per the flow state numbers, respectively.

3. Advanced Exergy and Exergoeconomic Analyses

3.1. Advanced Exergy Analysis

Thanks to traditional exergy analysis, unproductiveness in the process is numerically obtained. Irreversible processes and losses with real development potential can be reduced by implementing advanced exergy analysis. The place and enormousness of the sources causing thermodynamic deficiencies can be described via traditional exergy analysis. It also evaluates process sections with the ultimate exergy destruction in general. The efficiency of the system sections can be ameliorated by mitigating the exergy demolition rates inside the sections. A conventional exergy analysis evaluates the process performance beneath certain operating circumstances in order to improve a step or section. However, it cannot take into account the best performance actually available from the system. It is not possible to predict the exergy amelioration capacity without considering section coactions with the conventional exergy analysis methods. These coactions, which cannot be evaluated by traditional exergy analysis, could be analyzed at length by considering the method of advanced exergy analysis [67,68]. Exergy destruction of each section, shown in Figure 3, is allocated to avoidable, unavoidable, exogenous and endogenous fragments.
The destruction respecting the endogenous division involves the section performance taking account that the leftover sections operate in optimum circumstances. The impact of the left-behind sections on the entire process forges the exogenous division of the destruction. The exergy destructions are divided into unavoidable and avoidable parts when considering the disposal capacity of irreversible processes. Though the new technologic improvements are implemented on the systems, the unavoidable division of the sections cannot be eliminated. Nevertheless, the avoidable division can be recovered per technical amelioration. Further analysis of the system can be achieved by combining the E ˙ x D rates. The equations respecting advanced exergy are demonstrated in Table 8 [68,69,70,71,72,73]:

3.2. Advanced Exergoeconomic Analysis

The process evaluation in terms of cost is firstly executed via exergoeconomic analysis. Then, the results obtained from traditional exergoeconomic analysis are broken down into unavoidable, endogenous, avoidable and exogenous divisions for further assessment not only for the cost of exergy destruction C ˙ D , n but also for the cost of investment Z ˙ n T I C . The cost rates are combined to be assessed for further analysis as avoidable/exogenous-endogenous and unavoidable/exogenous-endogenous divisions. Traditional exergoeconomic analyses are not suitable for evaluating interactions between system steps, since it cannot take into account the optimum efficiency obtained from the system. It is not possible to estimate the EBAP without considering section interactions with traditional exergoeconomic analysis. The cost ratio of endogenous investment Z ˙ n E N and the cost rate of endogenous exergy destruction C ˙ D , n E N are computed assuming that the section under consideration is operating at real working circumstances, while the left behind sections are under theoretical conditions. Evaluating the interactions of all system components on each other and the improvement potential of each section is important for cost improvement. The unavoidable investment cost Z ˙ n U N refers to the inevitable cost of the section. T I C n U N is the unavoidable cost of the purchased section that cannot be reduced due to the manufacturing restricts [54,55,56,57,58,59,60,61,62]. A schematic subdivision respecting C ˙ D , n and Z ˙ n T I C are demonstrated in Figure 4.
The equations respecting the C ˙ D , n and the Z ˙ n T I C are derived and demonstrated in Table 9.

4. Results and Discussion

In accordance with Table A1 and Table 6, while exergetic and exergoeconomic performance metrics are shown with the use of kerosene in Table 10 for MIL PM, they are demonstrated in Table 11 for AB PM. According to the outcomes for the TJE, while the fuel exergy values were determined to be 16,554 kW (59.59 GJ/h) and 50,495 kW (182 GJ/h) for the MIL and the AB PM, seriatim, the product exergy values were calculated to be 5106 kW (18.38 GJ/h) and 8575 kW (30.87 GJ/h). Hence, the E ˙ x D rates were reckoned at 11,447 kW (41.21 GJ/h) and 41,920 kW (151 GJ/h) for the MIL and AB PM, seriatim. The TJE’s exergetic efficiency was determined 16.98% and 30.85% for the AB and MIL PM, seriatim [63]. The lowest SEF was reckoned in the CC section with the rate of 2.20 for the MIL PM, while it was computed to be 2.13 in the ABED section for the AB PM. The ultimate SCI were calculated in the CC section with the rate of 20.43 $/GJ both for the AB and MIL PM. The utmost EBAP was reckoned in the CC as 154 $/h for the MIL PM, while it was computed with a rate of 644 $/h for the AB PM. Figure 5 indicates the TJE and its sections’ EBAP rates with kerosene fuel use.
The overall SEF of the engine was computed 1.20 and 1.45 for AB and MIL PM, seriatim, while SCI was reckoned with the rates of 78.84 and 52.86 $/GJ. In accordance with the ameliorated potential of the system, the EBAP was determined to be 356 and 1565 $/h for MIL and AB PM, seriatim. The maximum Z ˙ T I C was calculated with the rate of 209 $/h in AC section, whereas it was reckoned at 13.76 $/h in the GTMS section with the minimum rate for both aforementioned modes. As per Table 6, C ˙ T J E was reckoned at 1405 $/h for the MIL PM, while it was calculated to be 2932 $/h for AB PM. According to Figure 6, the π and the ζ of the entire process were determined 512% and 56.20% for the MIL PM, whereas they were computed 660% and 25.95% for the AB PM, seriatim. The cost ratios and the indicators of the sustainability and exergy related to the engine sections are demonstrated below.
With respect to Table 10, the maximum unit fuel cost rate was calculated in the AC section, which had a rate of 59.39 $/GJ, while it was reckoned at 12.49 $/GJ for the entire engine. Moreover, the AC section had the ultimate unit product cost with the rate of 82.91 $/GJ, while it was calculated to be 76.45 $/GJ for the whole engine. The utmost C ˙ C and the π were determined at 338 $/h and 260% in the CC section, seriatim, while they were reckoned at 515 $/h and 512% for the whole engine. Therewithal, CC section had the minimum ζ with 28.91%.
With respect to Table 11, the ultimate unit fuel cost rate was calculated in the AC section, which had a rate of 59.39 $/GJ, while it was reckoned at 12.49 $/GJ for the entire engine. Moreover, the AC section had the ultimate unit product cost with a rate of 82.91 $/GJ, while it was calculated to be 94.97 $/GJ for the entire engine. The utmost C ˙ C was determined at 1360 $/h in the ABED section, while it was reckoned at 1886 $/h for the whole engine. In addition, ABED section had the minimum ζ with 4.63%.
In accordance with Table A2 and Table 7, while exergetic and exergoeconomic performance metrics are shown with the use of hydrogen in Table 12 for MIL PM, they are demonstrated in Table 13 for AB PM. According to the outcomes for the TJE, while the fuel exergy values were determined to be 17,594 kW (63.34 GJ/h) and 53,669 kW (193 GJ/h) for the MIL and AB PM, seriatim, the product exergy rates were calculated to be 5035 kW (18.13 GJ/h) and 8228 kW (29.62 GJ/h). Hence, the E ˙ x D rates were reckoned at 12,559 kW (45.21 GJ/h) and 45,441 kW (164 GJ/h) for MIL and AB PM, seriatim. The TJE’s exergetic efficiency was determined at 15.33% and 28.62% for the AB and MIL PM, seriatim [63]. The lowest SEF was reckoned in the CC section with a rate of 2.08 for the MIL PM, while it was computed to be 1.89 in the ABED section for the AB PM. The ultimate SCI were calculated in the CC section with a rate of 53.89 $/GJ for the MIL PM, while it was computed at 61.17 $/GJ for AB PM. The utmost EBAP was reckoned in the CC with a rate of 600 $/h for the MIL PM, while it was computed to be at a rate of 2372 $/h for the AB PM. Figure 7 indicates the EBAP of the TJE and its sections with the usage of H2 fuel.
The overall SEF of the engine was computed to be 1.18 and 1.40 for AB and MIL PM, seriatim, while SCI was reckoned with rates of 128 and 244 $/GJ. In accordance with the ameliorated potential of the system, the EBAP was determined to be 1317 and 5652 $/h for MIL and AB PM, seriatim. The maximum Z ˙ T I C was calculated with a rate of 209 $/h in the AC section, whereas it was reckoned at 13.76 $/h in GTMS section with the minimum rate for both aforementioned PMs. As per Table 7, C ˙ T J E was reckoned at 3245 $/h for MIL PM, while it was calculated to be 8545 $/h for AB PM. As per Figure 8, the π and the ζ of the entire system were determined to be 339% and 26.37% for the MIL PM, whereas they were computed to be 607% and 9.01% for the AB PM, seriatim. The cost rates and the indicators of sustainability and exergy related to engine sections are demonstrated in Figure 8.
With respect to Table 12, the ultimate unit fuel cost rate was calculated in the AC section, which had a rate of 136 $/GJ, while it was reckoned at 40.81 $/GJ for the entire engine. Moreover, the AC section had the ultimate unit product cost with a rate of 174 $/GJ, while it was calculated to be 179 $/GJ for the whole engine. The utmost C ˙ C and the π were determined to be 1245 $/h and 174% in the CC section, seriatim, while they were reckoned at 1845 $/h and 339% for the whole engine. Therewithal, the CC section had the minimum ζ with 9.95%.
With respect to Table 13, the ultimate unit fuel cost rate was calculated in the AC section, which had a rate of 136 $/GJ, while it was reckoned at 40.81 $/GJ for the entire engine. Moreover, the AC section had the ultimate unit product cost with a rate of 174 $/GJ, while it was calculated to be288 $/GJ for the entire engine. The ultimate π was assigned in the CC and ABED sections as 174% and 114%, seriatim. The ultimate C ˙ C was determined 4488 $/h in the ABED section, while it was reckoned at 6676 $/h for the whole engine. At the same time, ABED had the minimum ζ with 1.45%.
The comparative consequences of this research according to Figure 9 with the J85-GE-CAN-15 TJE research [49] are discussed as follows:
The C ˙ F , the c Pr and the C ˙ C of J85-GE-CAN-15 TJE engine were determined to be 1482 $/h, 121 $/GJ and 1040 $/h for MIL PM, respectively, while they were reckoned as 4079 $/h, 133 $/GJ and 3150 $/h for AB PM with kerosene fuel utilization. Moreover, while the SEF were calculated to be1.42 and 1.29 for the MIL and AB PM, seriatim, the SCI were reckoned at 85.26 and 103 $/GJ. As per Figure 9, the results indicate that the J85-GE-5H TJE for the present study is more cost effective than the J85-GE-CAN-15 TJE.
From another research perspective, as per [52], the C ˙ F , the c Pr and the C ˙ C of the (J69-T-25A) TJE engine were determined to be 1144 $/h, 355 $/GJ and 980 $/h, respectively, with H2 fuel use. Although the exergetic efficiency of the J69 TJE was less than the one in this study, the J85-GE-5H TJE’s C ˙ T J E was reckoned higher than the J69 TJE due to the higher rates of the C ˙ F and the Z ˙ T I C comparatively. In accordance with Table 9, the outcomes of the exergoeconomic analysis are confirmed with the results of the advanced exergoeconomic analysis. While the advanced investment costs are demonstrated in Table 14, the exergoeconomic destruction costs are indicated in Table 15 for JP-8 usage.
With respect to Table 3, the Z ˙ T J E T I C of TJE was 661 $/h for both PM with kerosene use. The major fragments of this rate were determined to be 209 $/h in the AC and 193 $/h in the GT sections. As per Table 14 for JP-8 utilization, Z ˙ T J E A V and Z ˙ T J E U N were calculated within the same rate as 98.96 $/h and 562 $/h for both PM, seriatim. The maximum Z ˙ A V , determined in the AC, was 31.38$/h. The ultimate Z ˙ U N , found out in the AC, was 178 $/h, since it had the highest unavoidable equipment cost in the entire engine. The Z ˙ A C U N of the AC was the aggregate of Z ˙ A C U N E N with a rate of 151 $/h and Z ˙ A C U N E X with a rate of 26.64 $/h.
On the other hand, the utmost endogenous investment cost Z ˙ E N , occurring in the GT section, was 181 $/h. The percentage of Z ˙ G T E N was 31.55% of the Z ˙ T J E E N (564 $/h) and 26.92% of the Z ˙ T J E T I C . The great Z ˙ E N was computed because of major E ˙ x D E N . Therefore, the exogenous investment cost Z ˙ E X was reckoned to be less than the Z ˙ E N . While the TJE had Z ˙ T J E E N with rates of 596 and 564 $/h for the MIL and AB PM, seriatim, it had Z ˙ T J E E X within rates of 65.08 and 96.87 $/h. The more exergy destruction and loss occur in the engine, the more endogenous investment cost becomes. The major fragments of the Z ˙ E X indicated in Table 14 were assigned 31.34 $/h in the AC and 12.62 $/h in the CC sections. The results show that the AC had a noticeable impact on the CC section, while the CC section had a similar impact on the AC section. Additionally, the ultimate Z ˙ A V E X was calculated to be 4.70 and 2.52 $/h in the AC and CC sections, seriatim, while the Z ˙ A V E N was calculated to be 26.68 $/h and 25.01 $/h.
In accordance with Table A3 and Table A4, the advanced exergoeconomic cost rates are displayed in Table 15. The TJE’s avoidable exergy demolition cost rates C ˙ D A V were reckoned at 134 $/h and 759 $/h for MIL and AB PM, seriatim. The maximum part of the C ˙ D A V was determined in the AC as 34.36 $/h for the MIL PM, while it was computed in the ABED with a rate of 208 $/h for the AB PM. The ultimate unavoidable exergy destruction cost rate C ˙ D U N was found out in the CC with a value of 329 $/h for MIL PM, while it was reckoned in the ABED with a rate of 1152 $/h for AB PM. The C ˙ D U N division of the CC was the aggregate of C ˙ D U N E X and C ˙ D U N E N with rates of 30.31 and 299 $/h, seriatim, for MIL PM, whereas it was the aggregate of 96.85 and 955 $/h for AB PM. The unavoidable cost rates cannot be reduced because of manufacturing restraints.
On the other hand, the ultimate endogenous exergy demolition cost C ˙ D E N , occurring in the CC, was 307 $/h. The ultimate C ˙ D E N was reckoned because of the combustion process. Hence, the exogenous exergy demolition cost C ˙ D E X was computed less than the C ˙ D E N . While the TJE had C ˙ D , T J E E N with rates of 369 and 1098 $/h for the MIL and AB PM, seriatim, the TJE engine had C ˙ D , T J E E X within rates of 146 and 788 $/h. The maximum division of the C ˙ D E X was determined in the CC with a rate of 146 $/h for the MIL PM, whereas it was computed in the ABED with a rate of 788 $/h for the AB PM. The C ˙ D E X came about in the related section because of the irreversible processes happened in the other sections. The mutual coactions among the engine sections can be figured out by breaking down the destruction cost rates into the exogenous divisions. The utmost avoidable-exogenous exergy destruction cost rate C ˙ D A V E X was calculated in the AC with a value of 4.28 $/h for MIL PM, while it was reckoned in the ABED with a rate of 33.79 $/h for the AB PM. At the same time, the ultimate avoidable-endogenous exergy demolition cost rate C ˙ D A V E N was reckoned in the AC with a value of 30.08 $/h for MIL PM, while it was reckoned in the ABED with a rate of 174 $/h for the AB PM. As per the outcomes, the C ˙ D A V E X could be reduced by implementing structural ameliorations to the entire system. The C ˙ D A V E N part could be mitigated by ameliorating the yield of the investigated section. When taking into account the usage of H2, the advanced investment costs are demonstrated in Table 16 and the exergoeconomic destruction costs are displayed in Table 17.
According to Table 3, the Z ˙ T J E T I C of TJE was 661 $/h for both modes with H2 use. The great portion of this rate were determined to be 209 $/h in the AC and 193 $/h in the GT sections; the minor portions were found to be 13.76 $/h in the GTMS and 41.29 $/h in the FED sections. As per Table 16 for H2 usage, Z ˙ T J E A V and Z ˙ T J E U N were calculated within the same rates as 98.96 $/h and 562 $/h for both PM, seriatim. The maximum Z ˙ A V was found out in the AC with a rate of 31.38 $/h, while the utmost Z ˙ U N was determined in the AC with a value of 178 $/h. The Z ˙ A C U N of the AC was the aggregate of Z ˙ A C U N E N with a rate of 154 $/h and Z ˙ A C U N E X with a rate of 24.12 $/h. The unavoidable divisions cannot be mitigated on account of technological restraints. On the other hand, the utmost Z ˙ G T E N computed in the AC to be 181 $/h. The higher the E ˙ x D , n E N occurred, the more Z ˙ U N became. Hence, the Z ˙ E X was determined less. While the TJE had Z ˙ T J E E N with rates of 596 and 564 $/h for both PM, seriatim, the TJE engine had Z ˙ T J E E X within the rates of 65.08 and 96.87 $/h. The major fragments of the Z ˙ E X indicated in Table 16 were assigned 30.61 $/h in the GT and 28.38 $/h in the AC sections. The results show that the GT had a noticeable impact on the AC section, while the AC had a similar effect on the GT section. In addition, the Z ˙ A V E X rates were calculated to be 4.26 and 2.80 $/h in the AC and CC sections, seriatim, while the Z ˙ A V E N rates were reckoned at 27.12 and 24.73 $/h.
In accordance with Table A5 and Table A6, the C ˙ D were demonstrated in Table 17. The TJE’s C ˙ D A V were 447 and 2501 $/h for MIL and AB PM, seriatim. The maximum part of the C ˙ D A V was determined in the AC with a rate of 78.86 $/h for the MIL PM, whereas it was computed in the ABED with a rate of 779 $/h for the AB PM. The ultimate C ˙ D U N in the CC was found to have a value of 1201 $/h for MIL PM, while it was reckoned in the ABED with a rate of 3709 $/h for AB PM. The C ˙ D U N fragment of the CC was the aggregate of C ˙ D U N E X with a rate of 121.27 $/h and C ˙ D U N E N with a rate of 1080 $/h for MIL PM, whereas it was the aggregate of C ˙ D U N E X with a rate of 703 $/h and C ˙ D U N E N with a rate of 3007 $/h in ABED for AB PM.
On the other hand, the ultimate C ˙ D E N , determined in the CC, was 1119 $/h. The TJE had C ˙ D , T J E E N rates of 1362 and 4077 $/h for the MIL and AB PM, seriatim, while it had C ˙ D , T J E E X rates of 483 and 2599 $/h. The maximum fragment of the C ˙ D E X was determined in the CC with a rate of 126 $/h for the MIL PM, while it was computed in the ABED with a rate of 840 $/h for the AB PM. The ultimate C ˙ D A V E X was calculated in the AC with a value of 9.16 $/h for MIL PM, while it was reckoned in the ABED to be a rate of 138 $/h for the AB PM. At the same time, the maximum C ˙ D A V E N was reckoned in the AC as 69.70 $/h for MIL PM, while it was reckoned in the ABED as 641 $/h for the AB PM. According to the outcomes, the C ˙ D A V E X rates could be mitigated by increasing the whole of the TJE’s yield. The C ˙ D A V E N rates could be minified by ameliorating the efficiency of the investigated section.

5. Conclusions

J85-GE-5H TJE was evaluated completely considering exergoeconomic and advanced exergoeconomic analyses with kerosene and hydrogen fuels usage. Primarily, sustainability, exergoeconomic and advanced exergoeconomic analyses of the TJE were fulfilled utilizing kerosene fuel with respect to real engine working circumstances. The aforementioned analyses were then perused parametrically in terms of using H2 fuel. After all, the outcomes reckoned for both fuel uses were collated in terms of cost effectiveness assessment of the TJE. The main conspicuous sequels related to the current research were stated below:
  • The C ˙ F rates were calculated to be 745 and 2271 $/h for the MIL and AB PM with kerosene use, seriatim, while they were obtained as 2585 and 7885 $/h with H2 use.
  • The C ˙ D rates with JP-8 were determined 515 $/h for the MIL PM and 1886 $/h for the AB PM. By considering the use of hydrogen, the C ˙ D for the MIL PM was 1845 $/h, whereas it was 6676 $/h for the AB PM.
  • The c Pr rates were determined as 76.45 $/GJ and 94.97 $/GJ with kerosene use, seriatim, while they were computed as 179 $/GJ and 288 $/GJ with H2 use.
  • The C ˙ T J E rates were reckoned to be 1405 $/h for the MIL PM and 2932 $/h for the AB PM. By considering the usage of hydrogen, the C ˙ T J E were 3245 $/h and 8545 $/h, seriatim.
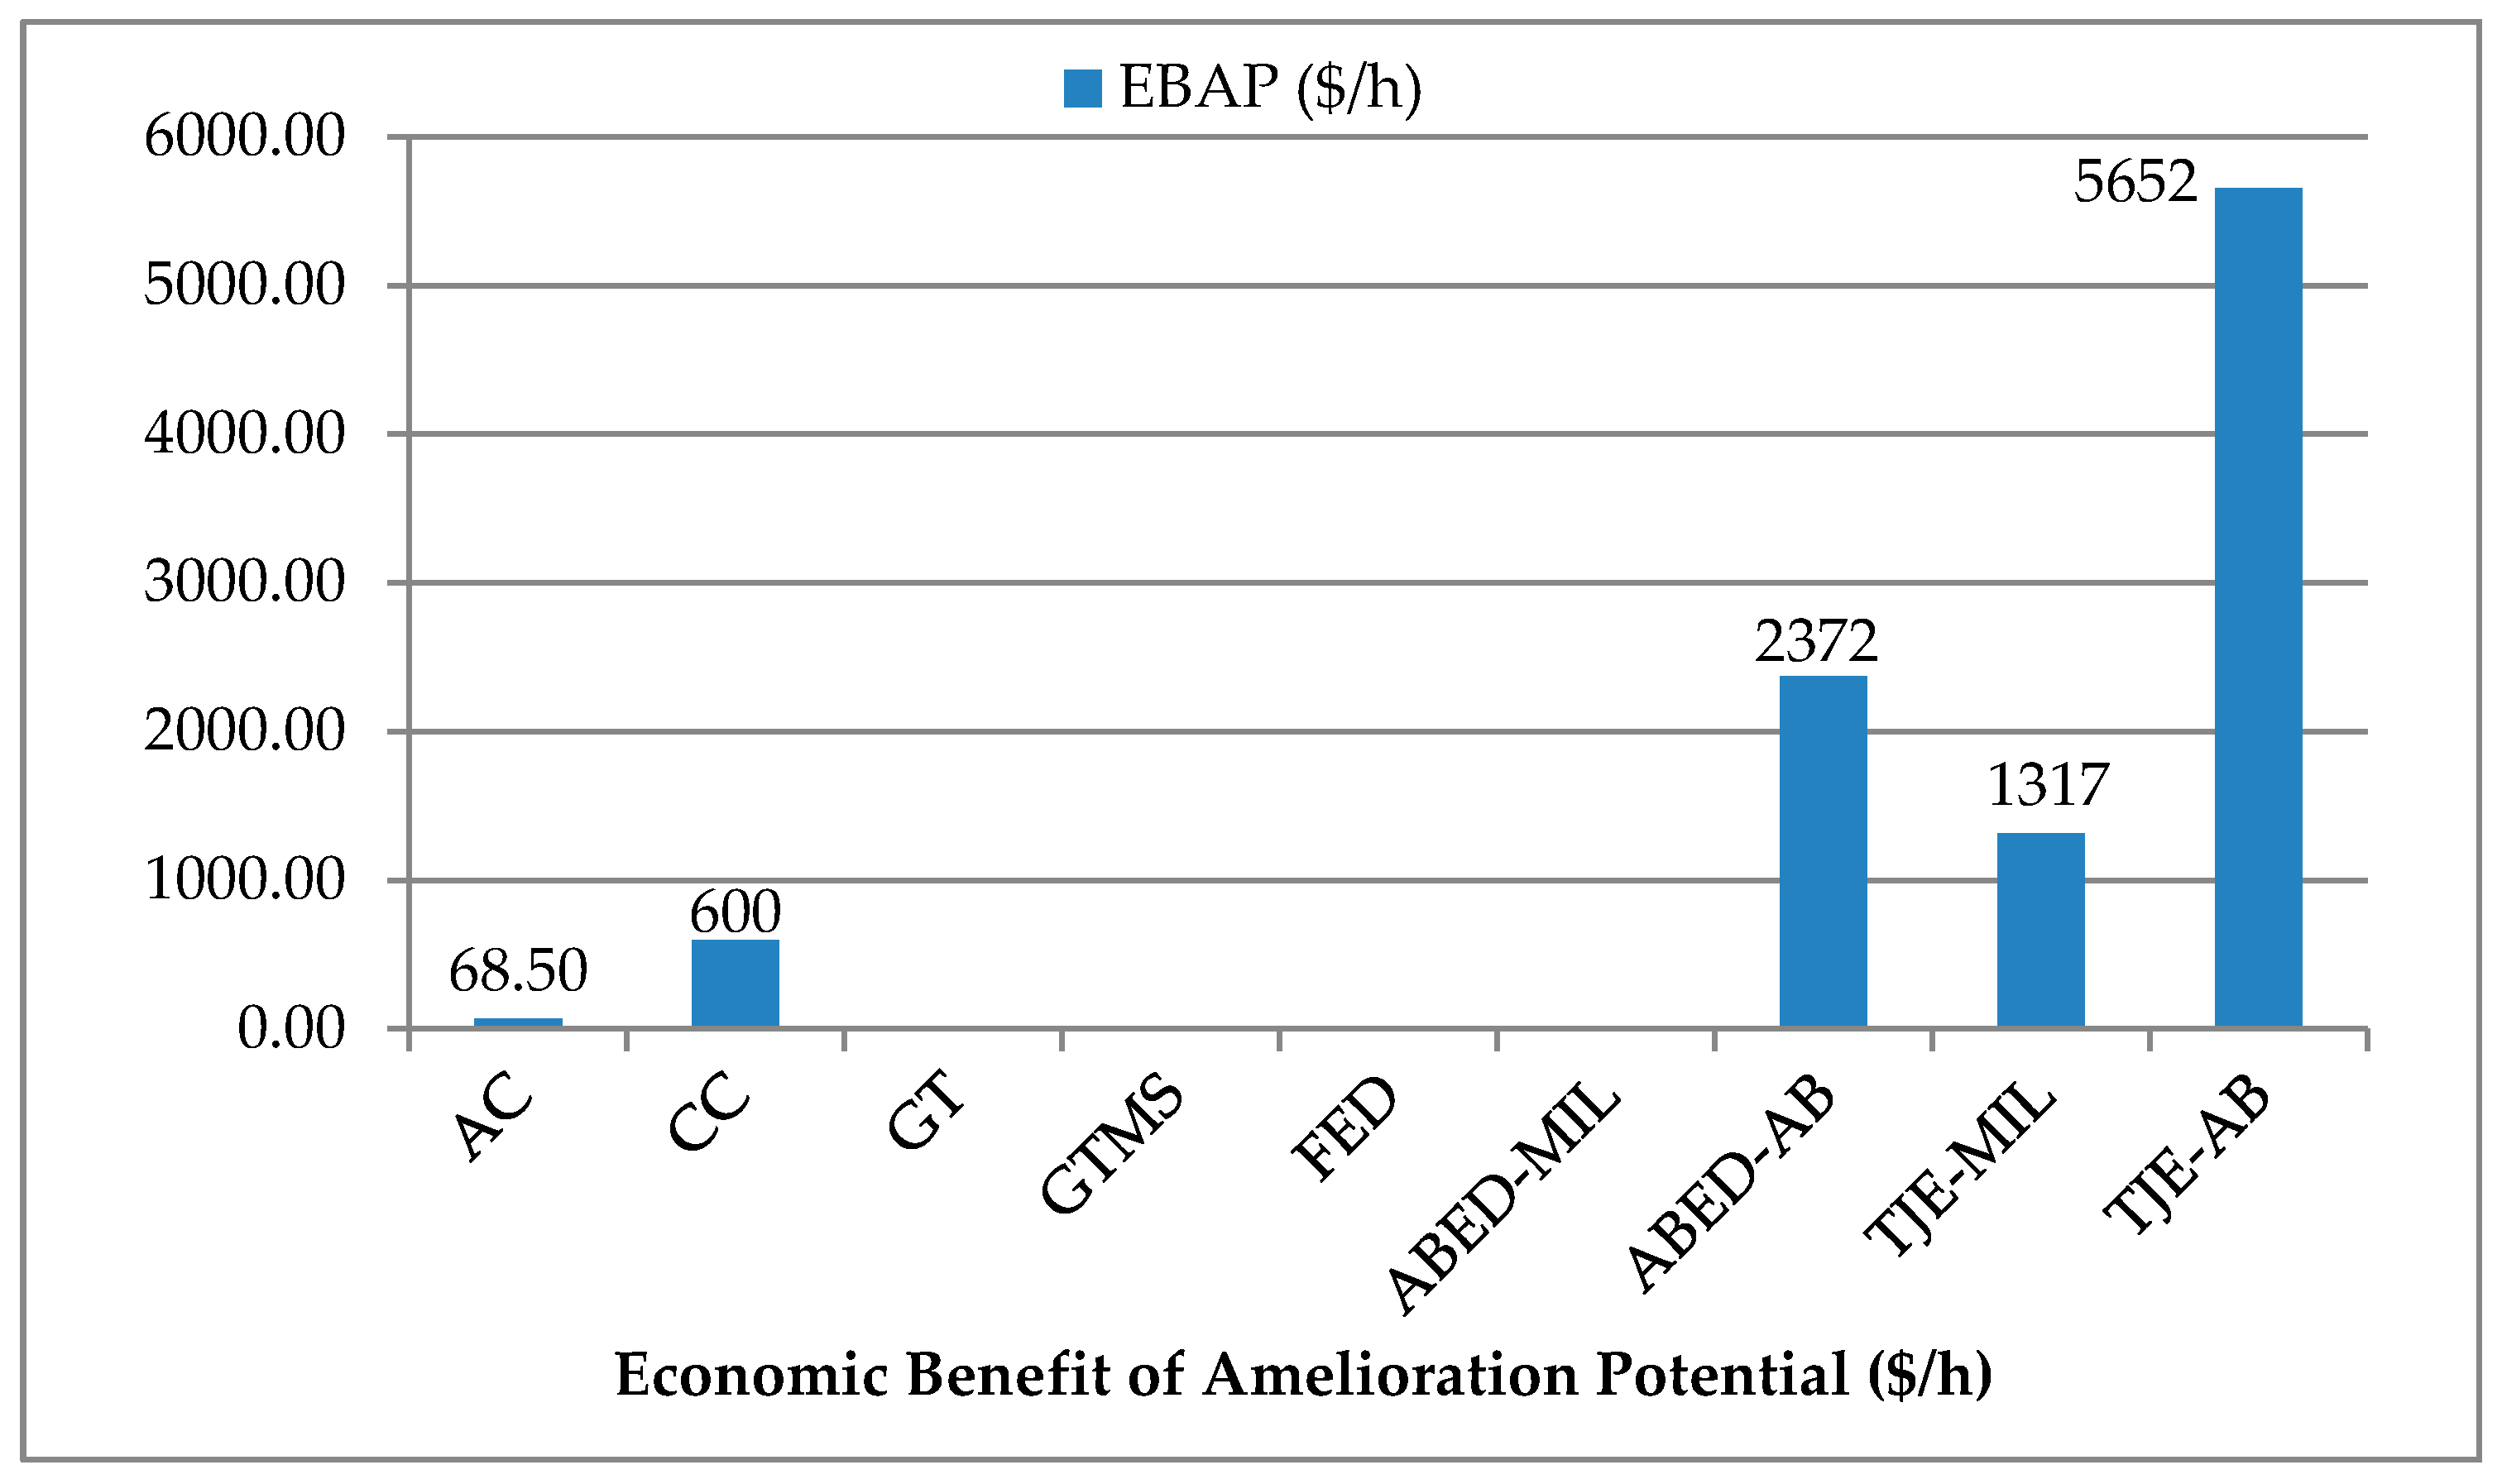
  • The EBAP values were computed to be 356 $/h and 1565 $/h for the MIL and AB PM with kerosene use, seriatim, while they were reckoned as 1317 $/h and 5652 $/h with H2 use.
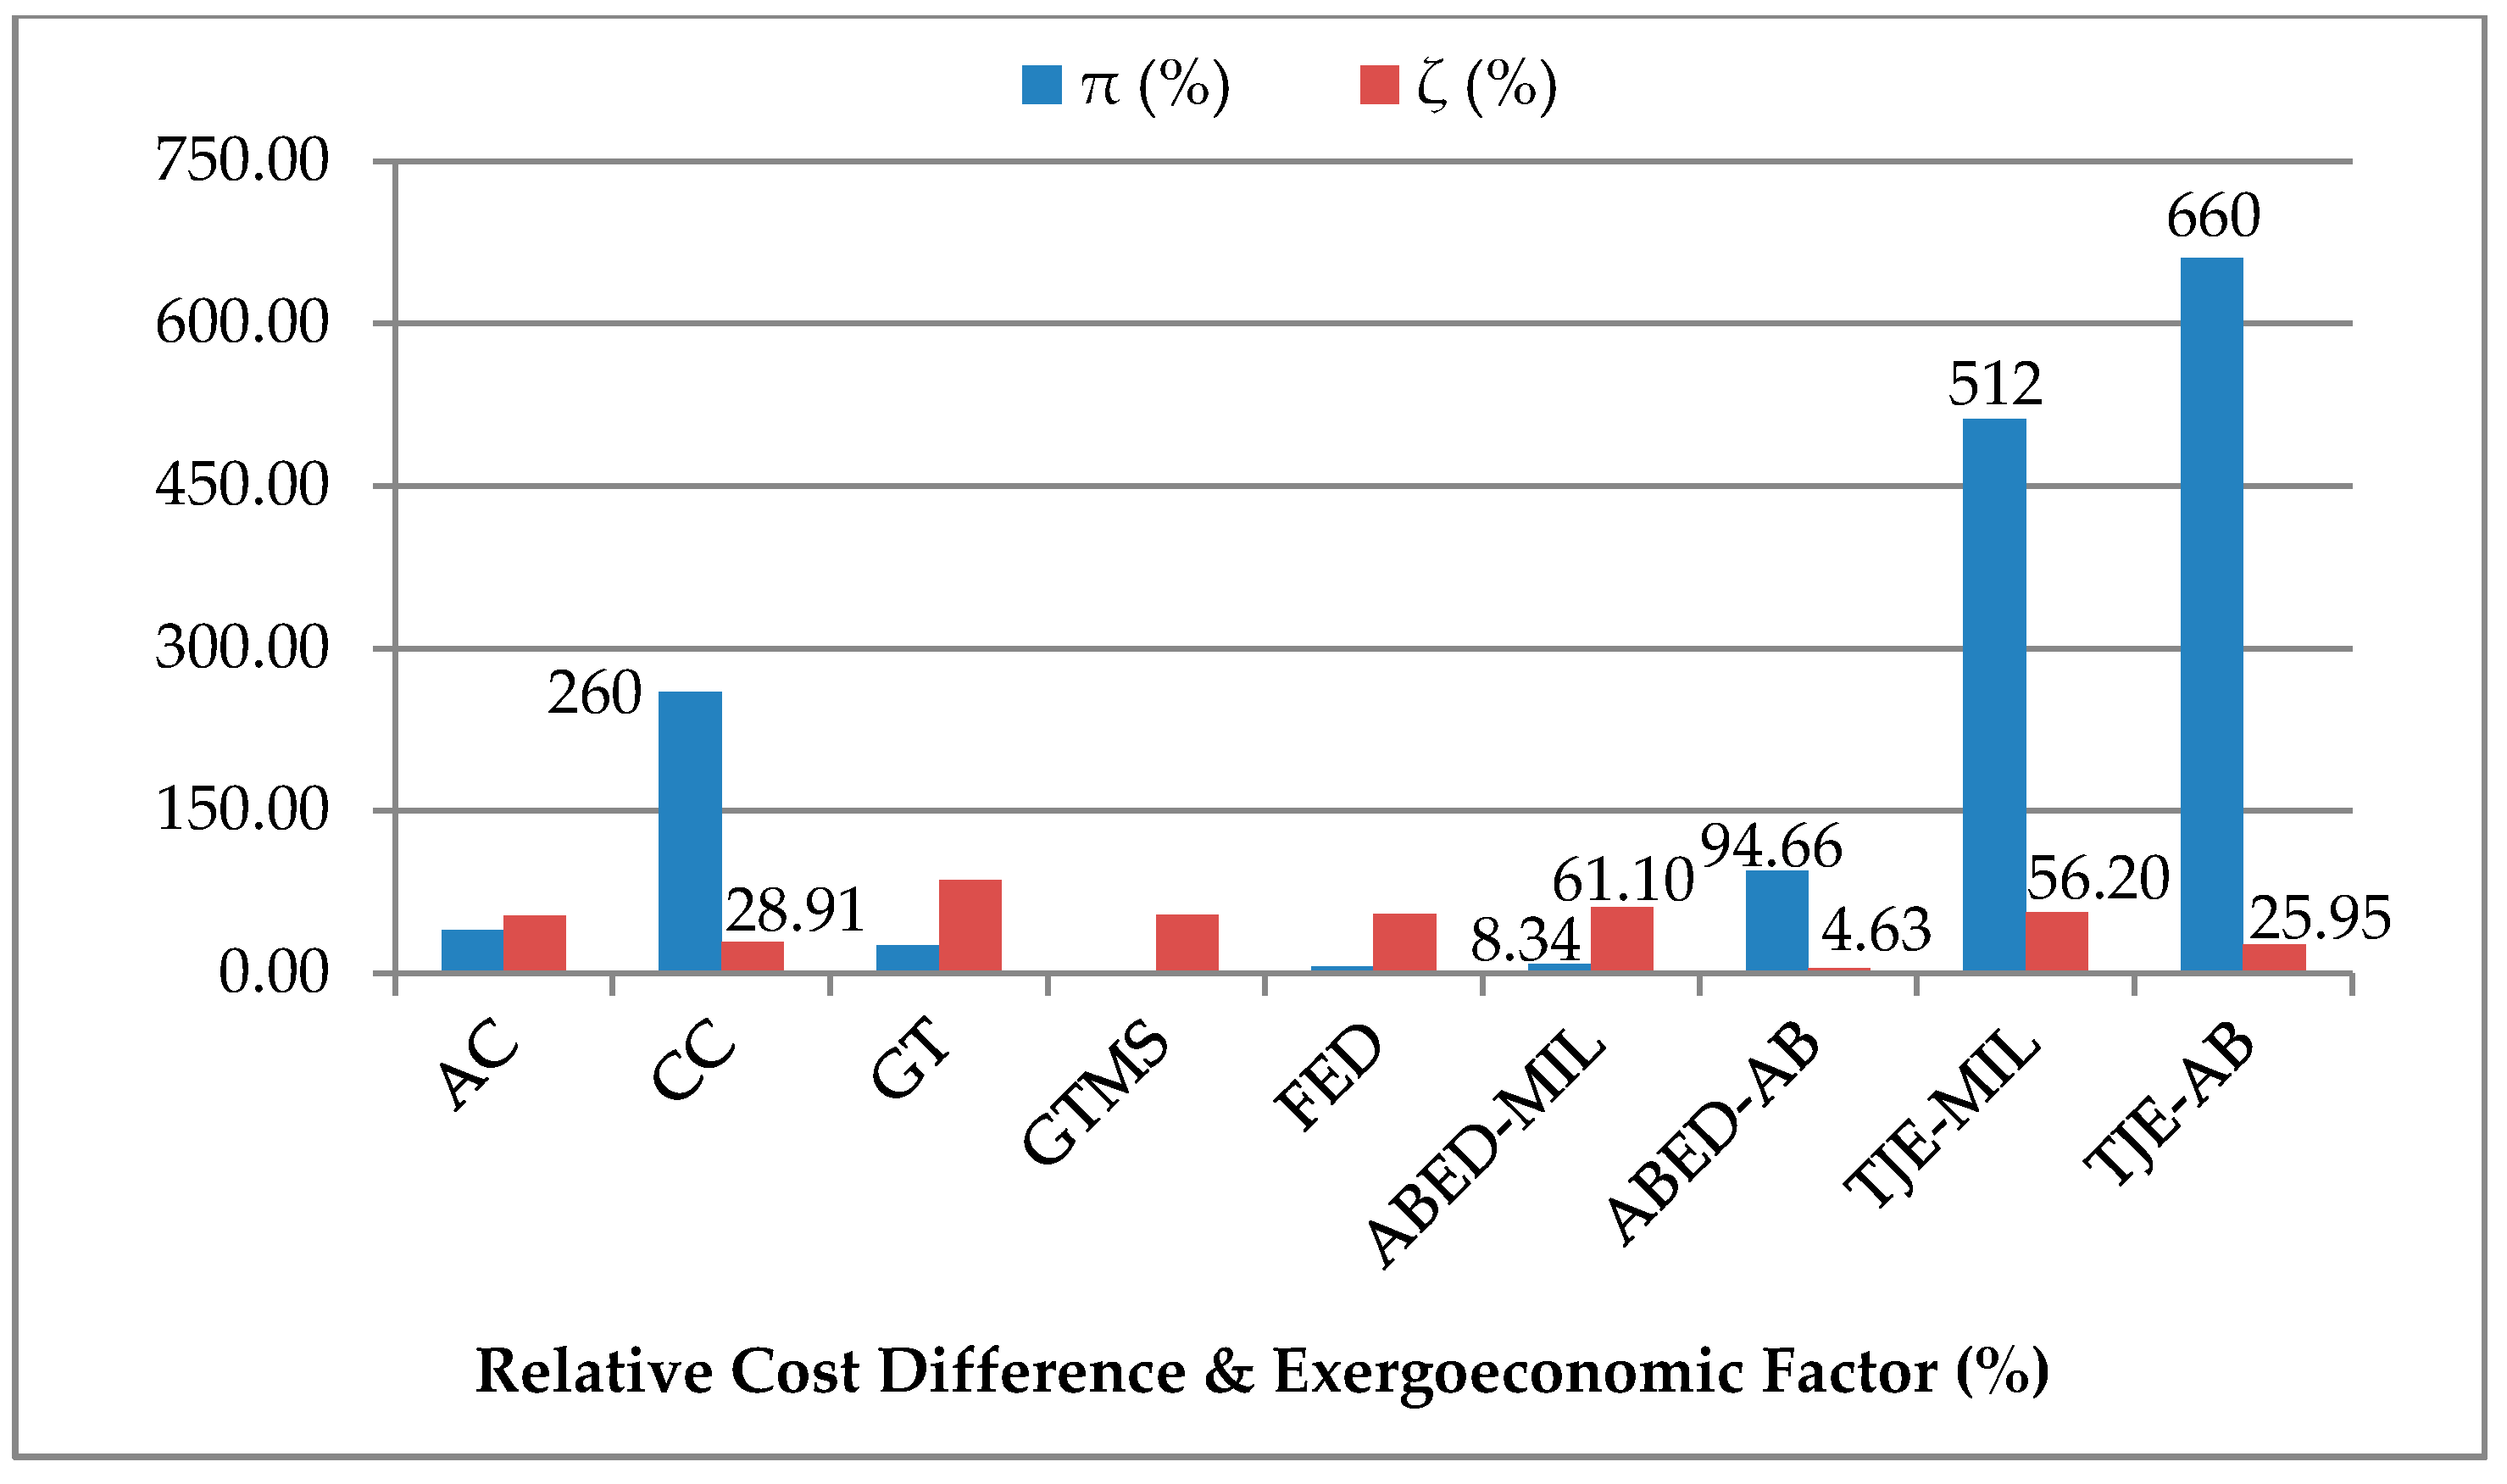
  • The ζ rates were computed as 56.20% and 25.95% for the MIL and AB PM with kerosene use, seriatim. By taking into account the use of H2, the ζ were 26.37% and 9.01%.
  • The π rates were calculated to be 512% for the MIL PM and 660% for the AB PM. By considering the use of hydrogen, the π were 339% and 607%, seriatim.
  • The SEF values were determined to be 1.45 and 1.20 for the MIL and AB PM with kerosene use, seriatim, while they were calculated 1.40 and 1.18 with H2 use.
  • The SCI values were determined to be 52.86 and 78.87 $/GJ for the MIL and AB PM, seriatim, whereas they were reckoned 128 and 244 $/GJ with H2 use.
  • The C ˙ D U N rates were calculated as 380 and 1127 $/h for MIL and AB PM with kerosene use, seriatim, while they were determined as 1298 and 4175 $/h with H2 use. Moreover, the C ˙ D U N E N rate had the highest C ˙ D for both fuel utilizations. Hence, the tract has low amelioration aptness.
  • The Z ˙ T J E U N and the Z ˙ T J E A V rates were reckoned with values of 562 and 98.96 $/h, seriatim, for both fuel uses.
  • The Z ˙ T J E E N rates were computed as 596 and 564 $/h for MIL and AB PM with kerosene use, seriatim, while they were reckoned as 590 and 589 $/h with H2 use.
  • The Z ˙ T J E E X rates were calculated 65.08 and 96.87 $/h for MIL and AB PM with kerosene use, seriatim, while they were reckoned to be 70.64 and 71.42 $/h with H2 use.
  • The C ˙ D E N rates were computed as 369 and 1098 $/h for MIL and AB PM with kerosene use, seriatim, whereas they were determined as 1362 and 4077 $/h with H2 use.
  • The C ˙ D E X rates were computed to be 146 and 788 $/h for MIL and AB PM with kerosene use, seriatim, while they were determined as 483 and 2599 $/h with H2 use.
  • As the C ˙ D E N rates were computed higher than the C ˙ D E X rates, the coactions between the sections were low.
  • The C ˙ D A V rates were computed as 134 and 759 $/h for MIL and AB PM with kerosene use, seriatim, while they were determined as 447 and 2501 $/h with H2 use. Moreover, the C ˙ D A V E X had a smaller C ˙ D rate than the C ˙ D A V E N cost rate in the whole tract not only for kerosene use but also for H2 use.
Between the system sections, the CC and ABED had the maximum C ˙ D , C ˙ D U N , SCI, π and EBAP rates for both fuel usages, whereas they had the minimum ζ and SEF rates. These results demonstrated that the primary factor bringing about an increase in the cost rates was the high demolition cost values of the CC and ABED sections because of the imperfections that happened in the combustion process. Meanwhile, the utmost avoidable investment costs were determined in the AC, CC and GT sections, whereas the utmost avoidable exergy destruction costs were reckoned in the ABED, AC and CC sections because of the relatively great exergy destructions rates. When the analyses are examined in terms of the internal state of the section, it was revealed that the potential for improvement depended mostly on sections. Hence, the endogenous demolition cost rate was larger than the exogenous demolition cost rate. The results were also similar for the cost rates of investment in terms of advanced analysis. The aforementioned analyses indicated that the sections were in the boundary of thermodynamic restraints as per the Z ˙ U N E N and the C ˙ D U N E N rates and had to be produced to obtain better performance not only in thermodynamic efficiency but also in cost effectiveness. Therefore, the researchers have been studying to enhance the performance of TJE by implementing innovations such as three-dimensional (3D) print manufacturing technologies, which lessen the labor, material and development cost rates drastically.
Consequently, the engine operated less cost effective with the use of H2 because of the increase in C ˙ D . Moreover, it was less sustainable due to the lower efficiency. Although the renewable energy sources will take the place of oil resources in the future, there has to be done to pave the way of production technologies to alter the challenges both in efficiency and cost effectiveness in gas turbine systems.

Author Contributions

Conceptualization, B.Y. and A.H.; methodology, B.Y. and A.H.; software, B.Y. and H.G.; validation, B.Y. and A.H.; formal analysis, B.Y. and A.H.; investigation, B.Y. and A.H.; resources, B.Y. and H.G.; data curation, H.G.; writing—original draft preparation, B.Y.; writing—review and editing, B.Y. and A.H. All authors have read and agreed to the published version of the manuscript.

Funding

This study received no external funding.

Acknowledgments

The authors are very grateful to the three reviewers and Assistant Editor for their constructive and valuable suggestions, which helped increase the quality of the paper.

Conflicts of Interest

The authors declare no conflict of interest.

Nomenclature

A C C ˙ yearly capital cost rate ($/yr)
c unit exergy flow cost ($/GJ)
c p specific heat capacity (kJ/(kg·K))
C ˙ exergy flow cost rate ($/h)
C R F cost recovery factor (-)
E ˙ energy rate (kW or GJ/h)
E ˙ B A P economic benefit of amelioration potential rate ($/h)
E ˙ x exergy rate (kW or GJ/h)
F C ˙ yearly fuel cost rate ($/yr)
F P fuel price ($/kg)
i interest rate (%)
L H V lower heating value of fuel (kJ/kg)
m ˙ mass flow rate (kg/s)
n lifetime (yr)
O M C ˙ yearly operation and maintenance cost ($/yr)
P pressure (kPa)
P V F present value factor (-)
P W present value ($)
Q ˙ heat transfer rate (kW or GJ/h)
R C ratio of the purchase cost of the section to the investment cost (%)
S C I sustainability cost index ($/GJ)
S E F sustainability effect factor (-)
S V salvage value ($)
S V R salvage value rate (%)
T temperature (°C or K)
T I C total investment cost ($)
V velocity (m/s)
W ˙ work rate or power (kW or GJ/h)
Z ˙ hourly investment cost rate ($/h)
Greek Letters
ψ exergy (second law) yield (%)
τ yearly operation hour (h/yr)
π relative cost difference (%)
ζ exergoeconomic factor (%)
Subscripts
A B E D afterburner exhaust duct
A C air compressor
C consumption
C C combustion chamber
D destroyed, destruction
F fuel
F E D forward exhaust duct
G T gas turbine
G T M S gas turbine mechanic shaft
i n inlet
k n kinetic exergy
L losses
n n-th section
o u t outlet
P pressure
Pr product
T temperature
T J E turbojet engine
0 reference state
1 , 2 , 3 , 8 , 9 , 10 location numbers of sections
Superscripts
A V avoidable
A V E N avoidable-endogenous
A V E X avoidable-exogenous
E N endogenous
E X exogenous
I C investment cost
O M operation and maintenance cost
R L real
U N unavoidable
U N E N unavoidable-endogenous
U N E X unavoidable-exogenous
T I C total investment cost
Abbreviations
A B afterburner
A C air compressor
A B E D afterburner exhaust duct
C C combustion chamber
C F C O continuous flow continuous open
F E D forward exhaust duct
G T gas turbine
G T M S gas turbine mechanic shaft
M I L military
P M process mode
S C I sustainability cost index
S E F sustainable effect factor
S E C section
S P E C O specific exergy cost method
T J E turbojet engine

Appendix A

Table A1. Values for energy rate, exergy rate, mass flowrate, pressure and specific heat capacity for the system sections for JP-8 fuel utilization (*: solely for Afterburner (AB) process mode) [63].
State No.Fluid Type m ˙ ( kg / s ) P ( kPa ) T ( K ) c p ( kJ / kg · K ) E ˙ ( kW ) E ˙ x ( kW )
0Air0.001012881.003750.000.00
1Air18.121012881.003750.000.00
2Air18.127195721.0440155834700
2.1Air16.317195721.0440150244230
2.2Air1.817195721.04401558470
2.3Air1.811829431.129461405740
2.4Air1.811799321.127351380720
2.5Air1.811759201.124771350699
2.5 *Air1.811751,5631.1350126911714
3Military fuel0.36245298-15,59316,554
4Combustion gas16.6768311771.2371019,45413,258
5Combustion gas16.671829431.1858613,8117156
6Combustion gas16.671799321.1834513,5686966
7Combustion gas16.671759201.1805513,2776746
7 *Combustion gas17.411751,5631.3896032,78420,164
10 *Afterburner fuel0.74245298-31,97233,941
8Mechanical work----56405640
9Mechanical work----55835583
Table A2. Values for energy rate, exergy rate, mass flowrate, pressure and specific heat capacity for the system sections for H2 fuel utilization (*: solely for AB process mode) [63].
State No.Fluid Type m ˙ ( kg / s ) P ( kPa ) T ( K ) c p ( kJ / kg · K ) E ˙ ( kW ) E ˙ x ( kW )
0Air0.001012881.003750.000.00
1Air18.121012881.003750.000.00
2Air18.127195721.0440155834700
2.1Air16.317195721.0440150244230
2.2Air1.817195721.04401558470
2.3Air1.811829231.125501359710
2.4Air1.811799121.123191332690
2.5Air1.811758941.119341289665
2.5 *Air1.8117515321.1420426471677
3Military fuel0.13245298-15,59317,594
4Combustion gas16.4468311561.2788419,55013,349
5Combustion gas16.441829231.2235613,8137059
6Combustion gas16.441799121.2208613,5526857
7Combustion gas16.441758941.2164513,1256551
7 *Combustion gas16.7117515321.3853730,62918,853
10 *Afterburner fuel0.27245298-31,97236,075
8Mechanical work----57375737
9Mechanical work----55835583
Table A3. Results for endogenous, exogenous, unavoidable and avoidable exergy demolition of the TJE and its sections for the MIL process mode for JP-8 utilization [63].
SEC. E ˙ x D R L ( kW ) E ˙ x D U N ( kW ) E ˙ x D A V ( kW ) E ˙ x D E X ( kW ) E ˙ x D E N ( kW ) E ˙ x D U N E N ( kW ) E ˙ x D U N E X ( kW ) E ˙ x D A V E N ( kW ) E ˙ x D A V E X ( kW )
AC88372216113275061011214120.01
CC752573182086906835664467419116.34
GT19311775.9512.021811098.0071.934.02
FED20913772.5025.9818311917.5964.118.39
ABED24113410733.0620811519.4293.7113.64
GTMS57.1331.1525.983.9053.2328.892.2624.341.64
TJE9109845965089782127,62683358664.04
Table A4. Results for endogenous, exogenous, unavoidable and avoidable exergy demolition of TJE and sections for the AB process mode for JP-8 utilization [63].
SEC. E ˙ x D R L ( kW ) E ˙ x D U N ( kW ) E ˙ x D A V ( kW ) E ˙ x D E X ( kW ) E ˙ x D E N ( kW ) E ˙ x D U N E N ( kW ) E ˙ x D U N E X ( kW ) E ˙ x D A V E N ( kW ) E ˙ x D A V E X ( kW )
AC88372216113275061011214120.01
CC752573182086906835664467419116.34
GT19311775.9512.021811098.0071.934.02
FED20913772.5025.9818311917.5964.118.39
ABED19,72816,7273001332916,39913,86728592532469
GTMS57.1331.1525.983.9053.2328.892.2624.341.64
TJE28,59525,0523544419324,40321,37836733024520
Table A5. Results for endogenous, exogenous, unavoidable and avoidable exergy demolition of TJE and sections in advanced exergy evaluation for the MIL process mode for H2 utilization [63].
SEC. E ˙ x D R L ( kW ) E ˙ x D U N ( kW ) E ˙ x D A V ( kW ) E ˙ x D E X ( kW ) E ˙ x D E N ( kW ) E ˙ x D U N E N ( kW ) E ˙ x D U N E X ( kW ) E ˙ x D A V E N ( kW ) E ˙ x D A V E X ( kW )
AC88372216112076362110114218.66
CC847581743008617614734982626535.24
GT31321210149.7426317438.4089.8711.34
FED22314082.4321.6920112515.6776.416.02
ABED33018214943.5028715328.8813414.62
GTMS15487.2567.1614.1414079.228.0361.056.11
TJE10,3789518860111092698500101876891.99
Table A6. Results for endogenous, exogenous, unavoidable and avoidable exergy demolition of TJE and sections in advanced exergy evaluation for the AB process mode for H2 utilization [63].
SEC. E ˙ x D R L ( kW ) E ˙ x D U N ( kW ) E ˙ x D A V ( kW ) E ˙ x D E X ( kW ) E ˙ x D E N ( kW ) E ˙ x D U N E N ( kW ) E ˙ x D U N E X ( kW ) E ˙ x D A V E N ( kW ) E ˙ x D A V E X ( kW )
AC88372216112076362110114218.66
CC847581743008617614734982626535.24
GT31321210149.7426317438.4089.8711.34
FED22314082.4321.6920112515.6776.416.02
ABED23,06619,0833,982429718,76915,4693614329968
GTMS15487.2567.1614.1414079.228.0361.056.11
TJE33,11328,4194694536327,75023,81646033934760

References

  1. Atılgan, R.; Turan, O.; Altuntas, O.; Aydin, H.; Synylo, K. Environmental impact assessment of a turboprop engine with the aid of exergy. Energy 2013, 58, 664–671. [Google Scholar] [CrossRef]
  2. Cengel, Y.A.; Boles, M.A. Thermodynamics: An Engineering Approach, 8th ed.; Mc Graw-Hill Education: New York, NY, USA, 2014. [Google Scholar]
  3. Turgut, E.T. Exergoeconomic Analysis of Aircraft Gas Turbine Engines. Ph.D. Thesis, Anadolu University, Eskisehir, Turkey, 2007. [Google Scholar]
  4. Bejan, A.; Tsatsaronis, G.; Moran, M. Thermal Design and Optimization; Wiley: New York, NY, USA, 1996. [Google Scholar]
  5. Lee, D.S.; Fahey, D.W.; Forster, P.M.; Newton, P.J.; Wit, R.C.N.; Lim, L.L.; Owena, B.; Sausen, R. Aviation and global climate change in the 21st century. Atmos. Environ. 2009, 43, 3520–3537. [Google Scholar] [CrossRef] [PubMed] [Green Version]
  6. Aydin, H.; Turan, O.; Karakoc, T.H.; Midilli, A. Exergetic sustainability indicators as a tool in commercial aircraft: A case study for a turbofan engine. Int. J. Green Energy 2015, 12, 28–40. [Google Scholar] [CrossRef]
  7. Schäfer, A.W.; Evans, A.D.; Reynolds, T.G.; Dray, L. Costs of mitigating CO2 emissions from passenger aircraft. Nat. Clim. Chang. 2016, 6, 412–417. [Google Scholar] [CrossRef] [Green Version]
  8. Lee, J.J. Can we accelerate the improvement of energy efficiency in aircraft systems? Energy Convers. Manag. 2010, 51, 189–196. [Google Scholar] [CrossRef]
  9. Altuntas, O. Designation of environmental impacts and damages of turbojet engine: A case study with GE-J85. Atmosphere 2014, 5, 307–323. [Google Scholar] [CrossRef] [Green Version]
  10. Yuksel, B.; Balli, O.; Gunerhan, H.; Hepbasli, A.; Atalay, H. Exergetic and Environmental Analyses of Turbojet Engine. In Environmentally-Benign Energy Solutions; Springer: Cham, Switzerland, 2020. [Google Scholar]
  11. Morsli, S.; Amina, S.; Ganaoui, M.E.; Ramenah, H. Computational simulation of entropy generation in a combustion chamber using a single burner. Entropy 2018, 20, 922. [Google Scholar] [CrossRef] [Green Version]
  12. International Energy Agency. World Energy Outlook; IEA: Paris, France, 2018. [Google Scholar]
  13. Cecere, D.; Giacomazzi, E.; Ingenito, A. A review on hydrogen industrial aerospace applications. Int. J. Hydrog. Energy 2014, 39, 10731–10747. [Google Scholar] [CrossRef]
  14. Dincer, I.; Acar, C. A review on potential use of hydrogen in aviation applications. Int. J. Sustain. Aviat. 2016, 2, 74–100. [Google Scholar] [CrossRef]
  15. Balli, O.; Sohret, Y.; Karakoc, T.H. The effects of hydrogen fuel usage on the exergetic performance of a turbojet engine. Int. J. Hydrog. Energy 2018, 43, 10848–10858. [Google Scholar] [CrossRef]
  16. Stamatis, A.; Vinni, C.; Bakalis, D.; Tzorbatzoglou, F.; Tsiakaras, P. Exergy analysis of an intermediate temperature solid oxide fuel cell-gas turbine hybrid system fed with ethanol. Energies 2012, 5, 4268–4287. [Google Scholar] [CrossRef]
  17. Elitzur, S.; Rosenband, V.; Gany, A. On-board hydrogen production for auxiliary power in passenger aircraft. Int. J. Hydrog. Energy 2017, 42, 14003–14009. [Google Scholar] [CrossRef]
  18. Koroneos, C.J.; Dompros, A.; Roumbas, G.; Moussiopoulos, N. Advantages of the use of hydrogen fuel as compared to kerosene. Resour. Conserv. Recycl. 2005, 44, 99–113. [Google Scholar] [CrossRef]
  19. Nalbant, Y.; Colpan, C.O.; Devrim, Y. Energy and exergy performance assessments of a high temperature-proton exchange membrane fuel cell based integrated cogeneration system. Int. J. Hydrog. Energy 2020, 45, 3584–3594. [Google Scholar] [CrossRef]
  20. Mahmoudi, S.M.S.; Sarabchi, N.; Yari, M.; Rosen, M.A. Exergy and exergoeconomic analyses of a combined power producing system including a proton exchange membrane fuel cell and an organic rankine cycle. Sustainability 2019, 11, 3264. [Google Scholar] [CrossRef] [Green Version]
  21. Harsha, S. Liquid hydrogen as aviation fuel and its relative performance with commercial aircraft fuel. Int. J. Mech. Eng. Robot. Res. 2014, 1, 73–77. [Google Scholar]
  22. Alayi, R.; Nemati, R.; Shamel, A.; Kasaeian, A.; Sarkaleh, M.K.; Ahmadi, M.H. Energetic and exergetic analysis hybrid solid oxide fuel cell systems and gas turbine (SOFC-GT). Math. Model. Eng. Prob. 2019, 6, 263–270. [Google Scholar] [CrossRef]
  23. Khandelwal, B.; Karakurt, A.; Sekaran, P.R.; Sethi, V.; Singh, R. Hydrogen powered aircraft: The future of air transport. Prog. Aerosp. Sci. 2013, 60, 45–59. [Google Scholar] [CrossRef]
  24. Nanaki, E.A.; Koroneos, C.J. Exergetic aspects of hydrogen energy systems—The case study of a fuel cell bus. Sustainability 2017, 9, 276. [Google Scholar] [CrossRef] [Green Version]
  25. Bicer, Y.; Dincer, I. Life cycle evaluation of hydrogen and other potential fuels for aircrafts. Int. J. Hydrog. Energy 2017, 42, 10722–10738. [Google Scholar] [CrossRef]
  26. Gohardani, A.S.; Doulgeris, G.; Singh, R. Challenges of future aircraft propulsion: A review of distributed propulsion technology and its potential application for the all electric commercial aircraft. Prog. Aerosp. Sci. 2011, 47, 369–391. [Google Scholar] [CrossRef]
  27. Westenberger, A. Hydrogen fuelled aircraft. AIAA International Air and Space Symposium and Exposition. In Proceedings of the Next 100 Years, AIAA 2003–2880, Dayton, OH, USA, 14–17 July 2003. [Google Scholar]
  28. Baroutaji, A.; Wilberforce, T.; Ramadan, M.; Olabi, A.G. Comprehensive investigation on hydrogen and fuel cell technology in the aviation and aerospace sectors. Renew. Sustain. Energy Rev. 2019, 106, 31–40. [Google Scholar] [CrossRef] [Green Version]
  29. Sarlioglu, B.; Morris, C.T. More electric aircraft: Review, challenges and opportunities for commercial transport aircraft. IEEE Trans. Transp. Electrif. 2015, 1, 54–64. [Google Scholar] [CrossRef]
  30. Blakey, S.; Rye, L.; Wilson, C.W. Aviation gas turbine alternative fuels: A review. Proc. Combust. Inst. 2011, 33, 2863–2885. [Google Scholar] [CrossRef]
  31. International Coordinating Council of Aerospace Industries Associations. Non-drop in fuels and advanced aircraft system power technologies. In Proceedings of the Conference on Aviation and Alternative Fuels, CAAF/09-IP/13, Rio de Janeiro, Brazil, 16–18 November 2009. [Google Scholar]
  32. Rivard, E.; Trudeau, M.; Zaghib, K. Hydrogen storage for mobility: A Review. Materials 2019, 12, 1973. [Google Scholar] [CrossRef] [PubMed] [Green Version]
  33. ASTM. ASTMD1655-18a, Standard Specification for Aviation Turbine Fuels; ASTM International: West Conshohocken, PA, USA, 2018. [Google Scholar]
  34. Naemi, S.; Avval, M.S.; Kalhori, S.B.; Mansoori, Z. Optimum design of dual pressure heat recovery steam generator using non-dimensional parameters based on thermodynamic and thermoeconomic approaches. Appl. Therm. Eng. 2013, 52, 371–384. [Google Scholar] [CrossRef]
  35. Lazzaretto, A.; Tsatsaronis, G. SPECO: A systematic and general methodology for calculating efficiencies and costs in thermal systems. Energy 2006, 31, 1257–1289. [Google Scholar] [CrossRef]
  36. Toffolo, A.; Lazzaretto, A. Evolutionary algorithms for multi-objective energetic and economic optimization in thermal system design. Energy 2002, 27, 549–567. [Google Scholar] [CrossRef]
  37. Balli, O. Thermodynamic, thermoeconomic and environmental performance analyses of a commercial aircraft’s high bypass turbofan engine. Sakarya Univ. J. Sci. 2019, 23, 453–461. [Google Scholar]
  38. Cooper, J.; Dingle, L. Engineering an afterburner for a miniature gas turbine engine. Aircr. Eng. Aerosp. Technol. 2005, 77, 104–108. [Google Scholar] [CrossRef]
  39. Li, H.; Chen, Y.; Tan, T.; Du, J.; Zhou, J.; Liu, C. Design and characteristic calculation of combustion chamber of hydrogen-fueled scramjet based on constant static temperature heating method. In Proceedings of the 2019 IEEE 10th International Conference on Mechanical and Aerospace Engineering (ICMAE), Brussels, Belgium, 22–25 July 2019. [Google Scholar]
  40. Large, J.; Pesyridis, A. Investigation of micro gas turbine systems for high speed long loiter tactical unmanned air systems. Aerospace 2019, 6, 55. [Google Scholar] [CrossRef] [Green Version]
  41. Sohret, Y.; Sogut, M.Z.; Karakoc, T.H.; Turan, O. Customised application of exergy analysis method to PW120A turboprop engine for performance evaluation. Int. J. Exergy 2016, 20, 48–65. [Google Scholar] [CrossRef]
  42. Ekici, S.; Sohret, Y.; Coban, K.; Altuntas, O.; Karakoc, T.H. Performance evaluation of an experimental turbojet engine. Int. J. Turbo Jet Eng. 2017, 34, 365–375. [Google Scholar] [CrossRef]
  43. Turan, O. An exergy way to quantify sustainability metrics for a high bypass turbofan engine. Energy 2015, 86, 722–736. [Google Scholar] [CrossRef]
  44. Kaya, N.; Turan, O.; Midilli, A.; Karakoc, T.H. Exergetic sustainability improvement potentials of a hydrogen fueled turbofan engine UAV by heating its fuel with exhaust gasses. Int. J. Hydrog. Energy 2016, 41, 8307–8322. [Google Scholar] [CrossRef]
  45. Jin, Y.; Du, J.; Li, Z.; Zhang, H. Second-law analysis of irreversible losses in gas turbines. Entropy 2017, 19, 470. [Google Scholar] [CrossRef]
  46. Ekici, S.; Altuntas, O.; Acikkalp, E.; Sogut, M.Z.; Karakoc, T.H. Assessment of thermodynamic performance and exergetic sustainability of turboprop engine using mixture of kerosene and methanol. Int. J. Exergy 2016, 19, 295–314. [Google Scholar] [CrossRef]
  47. Coban, K.; Colpan, C.O.; Karakoc, T.H. Application of thermodynamic laws on a military helicopter engine. Energy 2017, 140, 1427–1436. [Google Scholar] [CrossRef]
  48. Altayib, K. Energy, Exergy and Exergoeconomic Analyses of Gas Turbine Based Systems. Master’s Thesis, University of Ontario Institute of Technology, Oshawa, ON, Canada, 2011. [Google Scholar]
  49. Balli, O. Exergetic, exergoeconomic, sustainability and environmental damage cost analyses of J85 turbojet engine with afterburner. Int. J. Turbo Jet Eng. 2017, 34. [Google Scholar] [CrossRef]
  50. Tsatsaronis, G. Recent developments in exergy analysis and exergoeconomics. Int. J. Exergy 2008, 5, 489–499. [Google Scholar] [CrossRef]
  51. Aydin, H.; Turan, O.; Midilli, A.; Karakoc, T.H. Exergetic and exergoeconomic analysis of a turboprop engine: A case study for CT7-9C. Int. J. Exergy 2012, 11, 69–82. [Google Scholar] [CrossRef]
  52. Balli, O. A parametric study of hydrogen fuel effects on exergetic, exergoeconomic and exergoenvironmental cost performances of an aircraft turbojet engine. Int. J. Turbo Jet Eng. 2019, 36. [Google Scholar] [CrossRef]
  53. Altuntas, O.; Karakoc, T.H.; Hepbasli, A. Exergetic, exergoeconomic and sustainability assessment of piston-prop aircraft engine. Int. J. Therm. Sci. Technol. 2012, 32, 133–143. [Google Scholar]
  54. Petrakopoulou, F.; Tsatsaronis, G.; Morosuk, T. Evaluation of a power plant with chemical looping combustion using an advanced exergoeconomic analysis. Sustain. Energy Technol. Assess. 2013, 3, 9–16. [Google Scholar] [CrossRef]
  55. Petrakopoulou, F.; Tsatsaronis, G.; Morosuk, T.; Carassai, A. Advanced exergoeconomic analysis applied to a complex energy conversion system. ASME J. Eng. Gas Turbines Power 2012, 134, 1801–1808. [Google Scholar] [CrossRef]
  56. Acikkalp, E.; Aras, H.; Hepbasli, A. Advanced exergoeconomic analysis of an electricity-generating facility that operates with natural gas. Energy Convers. Manag. 2014, 78, 452–460. [Google Scholar] [CrossRef]
  57. Wei, Z.; Zhang, B.; Wu, S.; Chen, Q.; Tsatsaronis, G. Energy-use analysis and evaluation of distillation systems through avoidable exergy destruction and investment costs. Energy 2012, 42, 424–433. [Google Scholar] [CrossRef]
  58. Tsatsaronis, G.; Morosuk, T. Advanced exergoeconomic evaluation and its application to compression refrigeration machines. In Proceedings of the ASME International Mechanical Engineering Congress and Exposition, Seattle, WA, USA, 11–15 November 2007. [Google Scholar]
  59. Ochoa, G.V.; Rojas, J.P.; Forero, J.D. Advanced exergo-economic analysis of a waste heat recovery system using ORC for a bottoming natural gas engine. Energies 2020, 13, 267. [Google Scholar] [CrossRef] [Green Version]
  60. Anvari, S.; Saray, R.K.; Bahlouli, K. Conventional and advanced exergetic and exergoeconomic analyses applied to a tri-generation cycle for heat, cold and power production. Energy 2015, 91, 925–939. [Google Scholar] [CrossRef]
  61. Tsatsaronis, G.; Park, M.H. On avoidable and unavoidable exergy destructions and investment costs in thermal systems. Energy Convers. Manag. 2002, 43, 1259–1270. [Google Scholar] [CrossRef]
  62. Cziesla, F.; Tsatsaronis, G.; Gao, Z. Avoidable thermodynamic inefficiencies and costs in an externally fired combined cycle power plant. Energy 2006, 31, 1472–1489. [Google Scholar] [CrossRef]
  63. Yuksel, B.; Balli, O.; Gunerhan, H.; Hepbasli, A. Comparative performance metric assessment of a military turbojet engine utilizing hydrogen and kerosene fuels through advanced exergy analysis method. Energies 2020, 13, 1205. [Google Scholar] [CrossRef] [Green Version]
  64. TurAF-Turkish Air Forces. 1’st Air Supply and Maintenance Center, Annually Operation and Maintenance Report; First Air Supply and Maintenance Center: Eskisehir, Turkey, 2019. [Google Scholar]
  65. National Research Council (US). Permissible Exposure Levels for Selected Military Fuel Vapors; The National Academies Press: Washington, DC, USA, 1996. [Google Scholar]
  66. Abe, I. Physical and chemical properties of hydrogen. Energy Carriers Convers. Syst. 2012, 1, 1–3. [Google Scholar]
  67. Vatani, A.; Mehrpooya, M.; Palizdar, A. Advanced exergetic analysis of five natural gas liquefaction processes. Energy Convers. Manag. 2014, 78, 720–737. [Google Scholar] [CrossRef]
  68. Sohret, Y.; Acikkalp, E.; Hepbasli, A.; Karakoc, T.H. Advanced exergy analysis of an aircraft gas turbine engine: Splitting exergy destructions into parts. Energy 2015, 90, 1219–1228. [Google Scholar] [CrossRef]
  69. Kelly, S.; Tsatsaronis, G.; Morosuk, T. Advanced exergetic analysis: Approaches for splitting the exergy destruction into endogenous and exogenous parts. Energy 2009, 34, 384–391. [Google Scholar] [CrossRef]
  70. Balli, O. Advanced exergy analyses of an aircraft turboprop engine (TPE). Energy 2017, 124, 599–612. [Google Scholar] [CrossRef]
  71. Callak, M.; Balkan, F.; Hepbasli, A. Avoidable and unavoidable exergy destructions of a fluidized bed coal combustor and a heat recovery steam generator. Energy Convers. Manag. 2015, 98, 54–58. [Google Scholar] [CrossRef]
  72. Shivam, M.; Sohret, Y.; Sanjay, O. Advanced exergy analysis of aero gas turbine cycle based on air-film blade cooling. In Proceedings of the International Symposium on Sustainable Aviation, ISSA-2017-302, Kiev, Ukraine, 10–13 September 2017. [Google Scholar]
  73. Petrakopoulou, F.; Tsatsaronis, G.; Morosuk, T.; Carassai, A. Conventional and advanced exergetic analyses applied to a combined cycle power plant. Energy 2012, 41, 146–152. [Google Scholar] [CrossRef]
Figure 1. A simply view and flow diagram of the turbojet engine (TJE) [63].
Energies 13 03823 g001
Figure 2. A flow process of the analyses.
Energies 13 03823 g002
Figure 3. A schematic subdivision of exergy destruction [63].
Energies 13 03823 g003
Figure 4. A schematic subdivision respecting the costs of investment and exergy destruction.
Energies 13 03823 g004
Figure 5. Economic profit of amelioration potential (EBAP) with JP-8 fuel usage.
Energies 13 03823 g005
Figure 6. Relative cost difference (π) and exergoeconomic factor (ζ) with JP-8 fuel usage.
Energies 13 03823 g006
Figure 7. Economic benefit of amelioration potential (EBAP) with H2 fuel usage.
Energies 13 03823 g007
Figure 8. Relative cost difference (π) and exergoeconomic factor (ζ) with H2 fuel usage.
Energies 13 03823 g008
Figure 9. (a) The TJE’s total cost rate; (b) The TJE’s unit product cost rate.
Energies 13 03823 g009
Table 1. The hourly levelized cost parameters of the TJE.
DescriptionUnitEquationEquation No
The cost rate of exergy flow, C ˙ n ($/h) c n E ˙ x n (4)
The hourly rate of total investment cost, Z ˙ n T I C ($/h) Z ˙ n I C + Z ˙ n O M (5)
The hourly rate of the TJE’s maintenance cost, Z ˙ T J E O M ($/h) O M C ˙ T J E τ (6)
The hourly rate of maintenance cost, Z ˙ n O M ($/h) Z ˙ T J E O M T I C n T I C T J E (7)
The hourly rate of the TJE’s investment cost, Z ˙ T J E I C ($/h) A C ˙ C T J E τ (8)
The hourly rate of investment cost, Z ˙ n I C ($/h) Z ˙ T J E I C T I C n T I C T J E (9)
The total hourly rate of the TJE’s investment cost, Z ˙ T J E T I C ($/h) Z ˙ T J E I C + Z ˙ T J E O M (10)
Table 2. The cost methodology algorithms of the TJE.
DescriptionUnitEquationEquation No
The TJE’s present worth, P W T J E ($) T I C T J E S V T J E P V F ( i , n ) (11)
The TJE’s salvage value, S V T J E ($) T I C T J E S V R (12)
The TJE’s present value factor, P V F (-) 1 ( 1 + i ) n (13)
The TJE’s yearly capital cost rate, A C ˙ C T J E ($/yr) P W T J E C R F ( i , n ) (14)
Capital recovery factor, C R F (-) i ( i + 1 ) n ( i + 1 ) n 1 (15)
The cost rate of yearly fuel, F C ˙ ($/yr) F P m ˙ F τ 3600 (16)
The TJE’s hourly fuel cost rate, C ˙ F ($/h) F C ˙ τ (17)
Table 3. The TJE and its sections’ cost of equipment and the hourly cost rates.
SEC. R C ( % ) T I C ( $ ) Z ˙ I C ( $ / h ) Z ˙ O M ( $ / h ) Z ˙ T I C ( $ / h )
AC31.67380,00013376.00209
CC20.83250,00087.6450.00138
GT29.17350,00012370.00193
FED6.2575,00026.2915.0041.29
ABED10.00120,00042.0724.0066.07
GTMS2.0825,0008.765.0013.76
TJE100.001,200,000421240.00661
Table 4. The equations respecting exergy and cost balance of the TJE.
SectionUnitEquationEquation No.
Energies 13 03823 i001(AC)(kW) E ˙ x 1 + E ˙ x 9 E ˙ x 2 = E ˙ x D , A C (18)
($/h) ( C ˙ 1 + C ˙ 9 ) + Z ˙ A C T I C = C ˙ 2 = c 2 E ˙ x 2 (19)
($/GJ) C ˙ 2 E ˙ x 2 = C ˙ 2.1 E ˙ x 2.1 = C ˙ 2.2 E ˙ x 2.5 = c 2 , 2.1 , 2.2 (20)
Energies 13 03823 i002(CC)(kW) E ˙ x 2.1 + E ˙ x 3 E ˙ x 4 = E ˙ x D , C C (21)
($/h) ( C ˙ 2.1 + C ˙ 3 ) + Z ˙ C C T I C = C ˙ 4 = c 4 E ˙ x 4 (22)
Energies 13 03823 i003(GT)(kW) ( E ˙ x 4 E ˙ x 5 ) + ( E ˙ x 2.2 E ˙ x 2.3 ) W ˙ 8 = E ˙ x D , G T (23)
($/h) ( C ˙ 4 C ˙ 5 ) + ( C ˙ 2.2 C ˙ 2.3 ) + Z ˙ G T T I C = C ˙ 8 = c 8 W ˙ 8 (24)
Energies 13 03823 i004 (FED)(kW) ( E ˙ x 5 E ˙ x 6 ) + ( E ˙ x 2.3 E ˙ x 2.4 ) = E ˙ x D , F E D (25)
($/h) ( C ˙ 5 + C ˙ 2.3 ) + Z ˙ D C T I C = ( C ˙ 6 + C ˙ 2.4 ) (26)
Energies 13 03823 i005 (ABED-MIL)(kW) ( E ˙ x 6 E ˙ x 7 ) + ( E ˙ x 2.4 E ˙ x 2.5 ) + E ˙ x 10 = E ˙ x D , A B E D , E ˙ x 10 = 0 (27)
($/h) ( C ˙ 6 + C ˙ 2.4 + C ˙ 10 ) + Z ˙ A B E D T I C = ( C ˙ 2.5 + C ˙ 7 ) , C ˙ 10 = 0 (28)
Energies 13 03823 i006(ABED-AB)(kW) ( E ˙ x 6 E ˙ x 7 ) + ( E ˙ x 2.4 E ˙ x 2.5 ) + E ˙ x 10 = E ˙ x D , A B E D , E ˙ x 10 0 (29)
($/h) ( C ˙ 6 + C ˙ 2.4 + C ˙ 10 ) + Z ˙ A B E D T C = ( C ˙ 7 + C ˙ 2.5 ) , C ˙ 10 0 (30)
Energies 13 03823 i007(GTMS)(kW) W ˙ 8 W ˙ 9 = E ˙ x D , G T M S (31)
($/h) C ˙ 8 + Z ˙ G T M S T I C = C ˙ 9 = c 9 W ˙ 9 (32)
(TJE–MIL)(kW) ( E ˙ x 1 + E ˙ x 3 ) E ˙ x Pr , T J E = E ˙ x C , T J E (33)
($/h) ( C ˙ 1 + C ˙ 3 ) + Z ˙ T J E T I C = C ˙ 2.5 + C ˙ 7 = C ˙ k n , T J E = c P E ˙ x k n , T J E (34)
(TJE-AB)(kW) ( E ˙ x 1 + E ˙ x 3 + E ˙ x 10 ) E ˙ x Pr , T J E = E ˙ x C , T J E (35)
($/h) ( C ˙ 1 + C ˙ 3 + C ˙ 10 ) + Z ˙ T J E T I C = C ˙ 2.5 + C ˙ 7 = C ˙ k n , T J E = c P E ˙ x k n , T J E (36)
Table 5. Exergy, sustainability and exergoeconomic performance equations for the TJE.
DescriptionUnitEquationEquation No
Exergy efficiency, ψ (%) E ˙ x Pr / E ˙ x F (37)
Sustainability effect factor, S E F (-) 1 / ( 1 ψ n ) (38)
Sustainability cost index, S C I ($/GJ) c Pr ( 1 ψ n ) (39)
Unit exergy cost rate of product, c Pr ($/GJ) C ˙ Pr / E ˙ x Pr (40)
Economic benefit of amelioration potential rate, E B A P n ($/h) E B A P n = c Pr , n E ˙ x I P ˙ = c Pr , n ( 1 ψ n ) E ˙ x C , n (41)
Total cost rate of the TJE, C ˙ T J E ($/h) C ˙ F , T J E + Z ˙ T J E T I C (42)
Exergy loss cost rate, C ˙ L ($/h) c F E ˙ x L (43)
Exergy destruction cost rate, C ˙ D ($/h) c F E ˙ x D (44)
Exergy consumption cost rate, C ˙ C ($/h) c F ( E ˙ x D + E ˙ x L ) (45)
Relative cost difference, π n (%) ( c Pr , n c F , n ) / c F , n (46)
Exergoeconomic factor, ξ n (%) Z ˙ n T I C / ( Z ˙ n T I C + C ˙ D , n ) (47)
Table 6. Values for the cost rates of exergy flow and unit exergy related to process sections for kerosene fuel use (*: exclusively AB PM).
Location NoEx (kW)Ex (GJ/h)c ($/GJ) C ˙ ($/h)
00.000.000.000.00
10.000.000.000.00
2470016.9282.911403
2.1423015.2382.911263
2.24701.6982.91140
2.37402.6652.68140
2.47202.5954.11140
2.56992.5255.78140
2.5 *17146.1722.74140
316,55459.5912.49745
413,25847.7344.942145
5715625.7644.941158
6696625.0847.811199
7674624.2952.091265
7 *20,16472.5938.462792
10 *33,94112212.491527
8564020.3058.121180
9558320.1059.391194
TJE-MIL510618.3876.451405
TJE-AB857530.8794.972932
Table 7. Values for the cost rates of exergy flow and unit exergy related to process sections for hydrogen fuel use (*: exclusively AB PM).
Location NoEx (kW)Ex (GJ/h)c ($/GJ) C ˙ ($/h)
00.000.000.000.00
10.000.000.000.00
2470016.921742949
2.1423015.231742654
2.24701.69174295
2.37102.56115295
2.46902.48119295
2.56652.39123295
2.5 *16776.0448.84295
317,59463.3440.812585
413,34948.061125376
5705925.411122843
6685724.681172884
7655123.591252950
7 *18,85367.871228250
10 *36,07513040.815300
8573720.651322726
9558320.101362740
TJE-MIL503518.131793245
TJE-AB822829.622888545
Table 8. The advanced exergy equations of the process.
DescriptionUnitEquationEquation No
Endogenous exergy destruction rate, E ˙ x D , n E N (GJ/h) E ˙ x Pr , n R L × ( E ˙ x D E ˙ x Pr ) n E N (48)
Exogenous exergy destruction, E ˙ x D , n E X (GJ/h) E ˙ x D , n E X = E ˙ x D , n R L E ˙ x D , n E N (49)
Unavoidable exergy destruction, E ˙ x D , n U N (GJ/h) E ˙ x Pr , n R L × ( E ˙ x D E ˙ x Pr ) n U N (50)
Avoidable exergy destruction, E ˙ x D , n A V (GJ/h) E ˙ x D , n A V = E ˙ x D , n R L E ˙ x D , n U N (51)
Unavoidable-endogenous exergy destruction, E ˙ x D , n U N E N (GJ/h) E ˙ x D , n U N E N = E ˙ x D , n R L × ( E ˙ x D U N E ˙ x D R L × E ˙ x D E N E ˙ x D R L ) = E ˙ x D U N × E ˙ x D E N E ˙ x D R L (52)
Unavoidable-exogenous exergy destruction, E ˙ x D , n U N E N (GJ/h) E ˙ x D , n U N E X = E ˙ x D , n R L × ( E ˙ x D U N E ˙ x D R L × E ˙ x D E X E ˙ x D R L ) = E ˙ x D U N × E ˙ x D E X E ˙ x D R L (53)
Avoidable-endogenous exergy destruction, E ˙ x D , n A V E N (GJ/h) E ˙ x D , n A V E N = E ˙ x D , n R L × ( E ˙ x D A V E ˙ x D R L × E ˙ x D E N E ˙ x D R L ) = E ˙ x D A V × E ˙ x D E N E ˙ x D R L (54)
Avoidable-exogenous exergy destruction, E ˙ x D , n A V E X (GJ/h) E ˙ x D , n A V E X = E ˙ x D , n R L × ( E ˙ x D A V E ˙ x D R L × E ˙ x D E X E ˙ x D R L ) = E ˙ x D A V × E ˙ x D E X E ˙ x D R L (55)
Table 9. Advanced exergoeconomic equations of investment and exergy destruction costs [55].
Investment   Cost   ( Z ˙ n T I C ) Equation No Exergy   Destruction   Cost   ( C ˙ D , n ) Equation NoUnit
Z ˙ n E N = E ˙ P , n E N . ( Z ˙ E ˙ P ) n R L (56) C ˙ D , n E N = c F , n . E ˙ D , n E N (64)($/h)
Z ˙ n E X = Z ˙ n R L Z ˙ n E N (57) C ˙ D , n E X = C ˙ D , n R L C ˙ D , n E N (65)($/h)
Z ˙ n U N = ( T I C U N T I C R L ) n . Z ˙ n R L (58) C ˙ D , n U N = c F , n . E ˙ D , n U N (66)($/h)
Z ˙ n A V = Z ˙ n R L Z ˙ n U N (59) C ˙ D , n A V = C ˙ D , n R L C ˙ D , n U N (67)($/h)
Z ˙ n U N , E N = E ˙ P , n E N . ( Z ˙ n U N E ˙ P ) n (60) C ˙ D , n U N , E N = c F , n   . E ˙ D , n U N , E N (68)($/h)
Z ˙ n U N , E X = Z ˙ n U N Z ˙ n U N , E N (61) C ˙ D , n U N , E X = C ˙ D , n U N C ˙ D , n U N , E N (69)($/h)
Z ˙ n A V , E N = Z ˙ n E N Z ˙ n U N , E N (62) C ˙ D , n A V , E N = C ˙ D , n E N C ˙ D , n U N , E N (70)($/h)
Z ˙ n A V , E X = Z ˙ n E X Z ˙ n U N , E X (63) C ˙ D , n A V , E X = C ˙ D , n E X C ˙ D , n U N , E X (71)($/h)
Table 10. Results for exergy, exergoeconomic and sustainability performance indicators for MIL PM with kerosene fuel use.
SEC. E ˙ x F ( kW ) E ˙ x Pr ( kW ) E ˙ x C ( kW ) ψ ( % ) S E F ( ) S C I ( $ / GJ ) E B A P ( $ / h ) c F ( $ / GJ ) c Pr ( $ / GJ ) C C ˙ ( $ / h ) Z ˙ T I C ( $ / h ) π ( % ) ζ ( % )
AC5583470088384.196.3213.1129.8459.3982.9118920939.6052.57
CC16,5549028752554.542.2020.4315412.4944.9433813826028.91
GT5833564019396.6930.231.921.0646.2458.1232.1219325.6985.71
FED7895768620997.3537.701.280.9145.6648.4034.4341.295.9954.53
ABED7686744524196.8631.841.651.3248.4052.4342.0666.078.3461.10
GTMS5640558357.1398.9998.730.600.1258.120.3511.9513.762.2053.52
Total Destruction Rate-9109-- ---410---
Total Losses Rate-2338-- ---105---
TJE16,554510611,44730.851.4552.8635612.4976.4551566151256.20
Table 11. Results for exergy, exergoeconomic and sustainability performance indicators for AB PM with kerosene fuel use.
SEC. E ˙ x F ( kW ) E ˙ x Pr ( kW ) E ˙ x C ( kW ) ψ ( % ) S E F ( ) S C I ( $ / GJ ) E B A P ( $ / h ) c F ( $ / GJ ) c Pr ( $ / GJ ) C C ˙ ( $ / h ) Z ˙ T I C ( $ / h ) π ( % ) ζ ( % )
AC5583470088384.196.3213.1129.8459.3982.9118920939.6052.57
CC16,5549028752554.542.2020.4315412.4944.9433813826028.91
GT5833564019396.6930.231.921.0646.2458.1232.1219325.6985.71
FED7895768620997.3537.701.280.9145.6648.4034.4341.295.9954.53
ABED41,60621,87819,72852.582.1117.6564419.1237.23136066.0794.664.63
GTMS5640558357.1398.9998.730.600.1258.120.3511.9513.762.2053.52
Total Destruction Rate-28,595--- --1286---
Total Losses Rate-13,324--- --599---
TJE50,495857541,92016.981.2078.84156512.4994.97188666166025.95
Table 12. Results for exergy, exergoeconomic and sustainability performance indicators for MIL PM with hydrogen fuel use.
SEC. E ˙ x F ( kW ) E ˙ x Pr ( kW ) E ˙ x C ( kW ) ψ ( % ) S E F ( ) S C I ( $ / GJ ) E P I ˙ P ( $ / h ) c F ( $ / GJ ) c Pr ( $ / GJ ) C C ˙ ( $ / h ) Z ˙ T I C ( $ / h ) π ( % ) ζ ( % )
AC5583470088384.196.3227.5668.5013617443320927.8532.57
CC17,5949119847551.832.0853.8960040.8111212451381749.95
GT6050573731394.8219.326.836.6511413212919315.7859.99
FED7769754622397.1334.883.362.581121179041.294.3131.46
ABED7546721633095.6222.845.476.0911712513966.076.7532.19
GTMS5737558315497.3137.163.671.9713213673.3713.763.2815.80
Total Destruction Rate-10,378-- --1525-- -
Total Losses Rate-2181-- --320-- -
TJE17,594503512,55928.621.40128131740.81179184566133926.37
Table 13. Results for exergy, exergoeconomic and sustainability performance indicators for AB PM with hydrogen fuel use.
SEC. E ˙ x F ( kW ) E ˙ x Pr ( kW ) E ˙ x C ( kW ) ψ ( % ) S E F ( ) S C I ( $ / GJ ) E P I ˙ P ( $ / h ) c F ( $ / GJ ) c Pr ( $ / GJ ) C C ˙ ( $ / h ) Z ˙ T I C ( $ / h ) π ( % ) ζ ( % )
AC5583470088384.196.3227.5668.5013617443320927.8532.57
CC17,5949119847551.832.0853.8960040.8111212451381749.95
GT6050573731394.8219.326.836.6511413212919315.7859.99
FED7769754622397.1334.883.362.581121179041.294.3131.46
ABED43,59620,53023,06647.091.8961.17237253.99116448866.071141.45
GTMS5737558315497.3137.163.671.9713213673.3713.763.2815.80
Total Destruction Rate-33,113------4865---
Total Losses Rate-12,327------1811---
TJE53,669822845,44115.331.182445,65240.8128866766616079.01
Table 14. Results for advanced investment costs for kerosene use.
SEC. Z ˙ T I C ( $ / h ) Z ˙ U N ( $ / h ) Z ˙ A V ( $ / h ) Z ˙ E X ( $ / h ) Z ˙ E N ( $ / h ) Z ˙ U N E N ( $ / h ) Z ˙ U N E X ( $ / h ) Z ˙ A V E N ( $ / h ) Z ˙ A V E X ( $ / h )
AC20917831.3831.3417815126.6426.684.70
CC13811027.5312.6212510010.1025.012.52
GT19317319.2712.0018116310.8018.071.20
FED41.2935.106.195.1236.1730.744.355.430.77
ABED-MIL66.0752.8513.219.0557.0245.617.2411.401.81
ABED-AB66.0752.8513.2111.1554.9243.948.9210.982.23
GTMS13.7612.391.380.9412.8211.540.851.280.09
TJE-MIL661562996559650655.3389.219.75
TJE-AB661562999756447982.3684.4514.51
Table 15. Results for advanced exergy destruction costs for kerosene utilization.
SEC. C D ˙ ( $ / h ) C ˙ D U N ( $ / h ) C ˙ D A V ( $ / h ) C ˙ D E X ( $ / h ) C ˙ D E N ( $ / h ) C ˙ D U N E N ( $ / h ) C ˙ D U N E X ( $ / h ) C ˙ D A V E N ( $ / h ) C ˙ D A V E X ( $ / h )
AC18915434.3628.2816013024.0030.084.28
CC3383299.3431.0430729930.318.610.74
GT32.1219.4812.642.0030.1218.151.3311.970.67
FED34.4322.5111.924.2730.1619.622.8910.541.38
ABED-MIL42.0623.3518.705.7636.3019.973.3816.332.38
ABED-AB13601152208231112995519717433.79
GTMS11.956.525.430.8211.146.040.475.090.34
TJE-MIL51538013414636934337.4826.36108
TJE-AB188611277597881098962165136623
Table 16. Results for advanced investment costs for H2 utilization.
SEC. Z ˙ T I C ( $ / h ) Z ˙ U N ( $ / h ) Z ˙ A V ( $ / h ) Z ˙ E X ( $ / h ) Z ˙ E N ( $ / h ) Z ˙ U N E N ( $ / h ) Z ˙ U N E X ( $ / h ) Z ˙ A V E N ( $ / h ) Z ˙ A V E X ( $ / h )
AC20917831.3828.3818115424.1227.124.26
CC13811027.5313.9812498.9311.1824.732.80
GT19317319.2730.6116214627.5516.213.06
FED41.2935.106.194.0237.2731.683.425.590.60
ABED-MIL66.0752.8513.218.7057.3745.896.9611.471.74
ABED-AB66.0752.8513.2112.3153.7643.019.8510.752.46
GTMS13.7612.391.381.2612.5011.251.131.250.13
TJE-MIL6615629970.6459050260.0588.3810.58
TJE-AB6615629971.4258950160.7288.2710.70
Table 17. Results for advanced exergy destruction costs of TJE and sections for H2 utilization.
SEC. C D ˙ ( $ / h ) C ˙ D U N ( $ / h ) C ˙ D A V ( $ / h ) C ˙ D E X ( $ / h ) C ˙ D E N ( $ / h ) C ˙ D U N E N ( $ / h ) C ˙ D U N E X ( $ / h ) C ˙ D A V E N ( $ / h ) C ˙ D A V E X ( $ / h )
AC43335478.8658.7737430549.6169.709.16
CC1245120144.121261119108012138.945.18
GT12986.9841.5320.4110871.2215.7636.884.65
FED89.9756.6833.298.7681.2150.356.3330.862.43
ABED-MIL13976.6062.6018.3312164.4312.1756.446.16
ABED-AB4488370977984036483007703641138
GTMS73.3741.4631.916.7266.6537.643.8229.012.90
TJE-MIL1845139844748313621249149113334
TJE-AB6676417525012599407734996765781923

