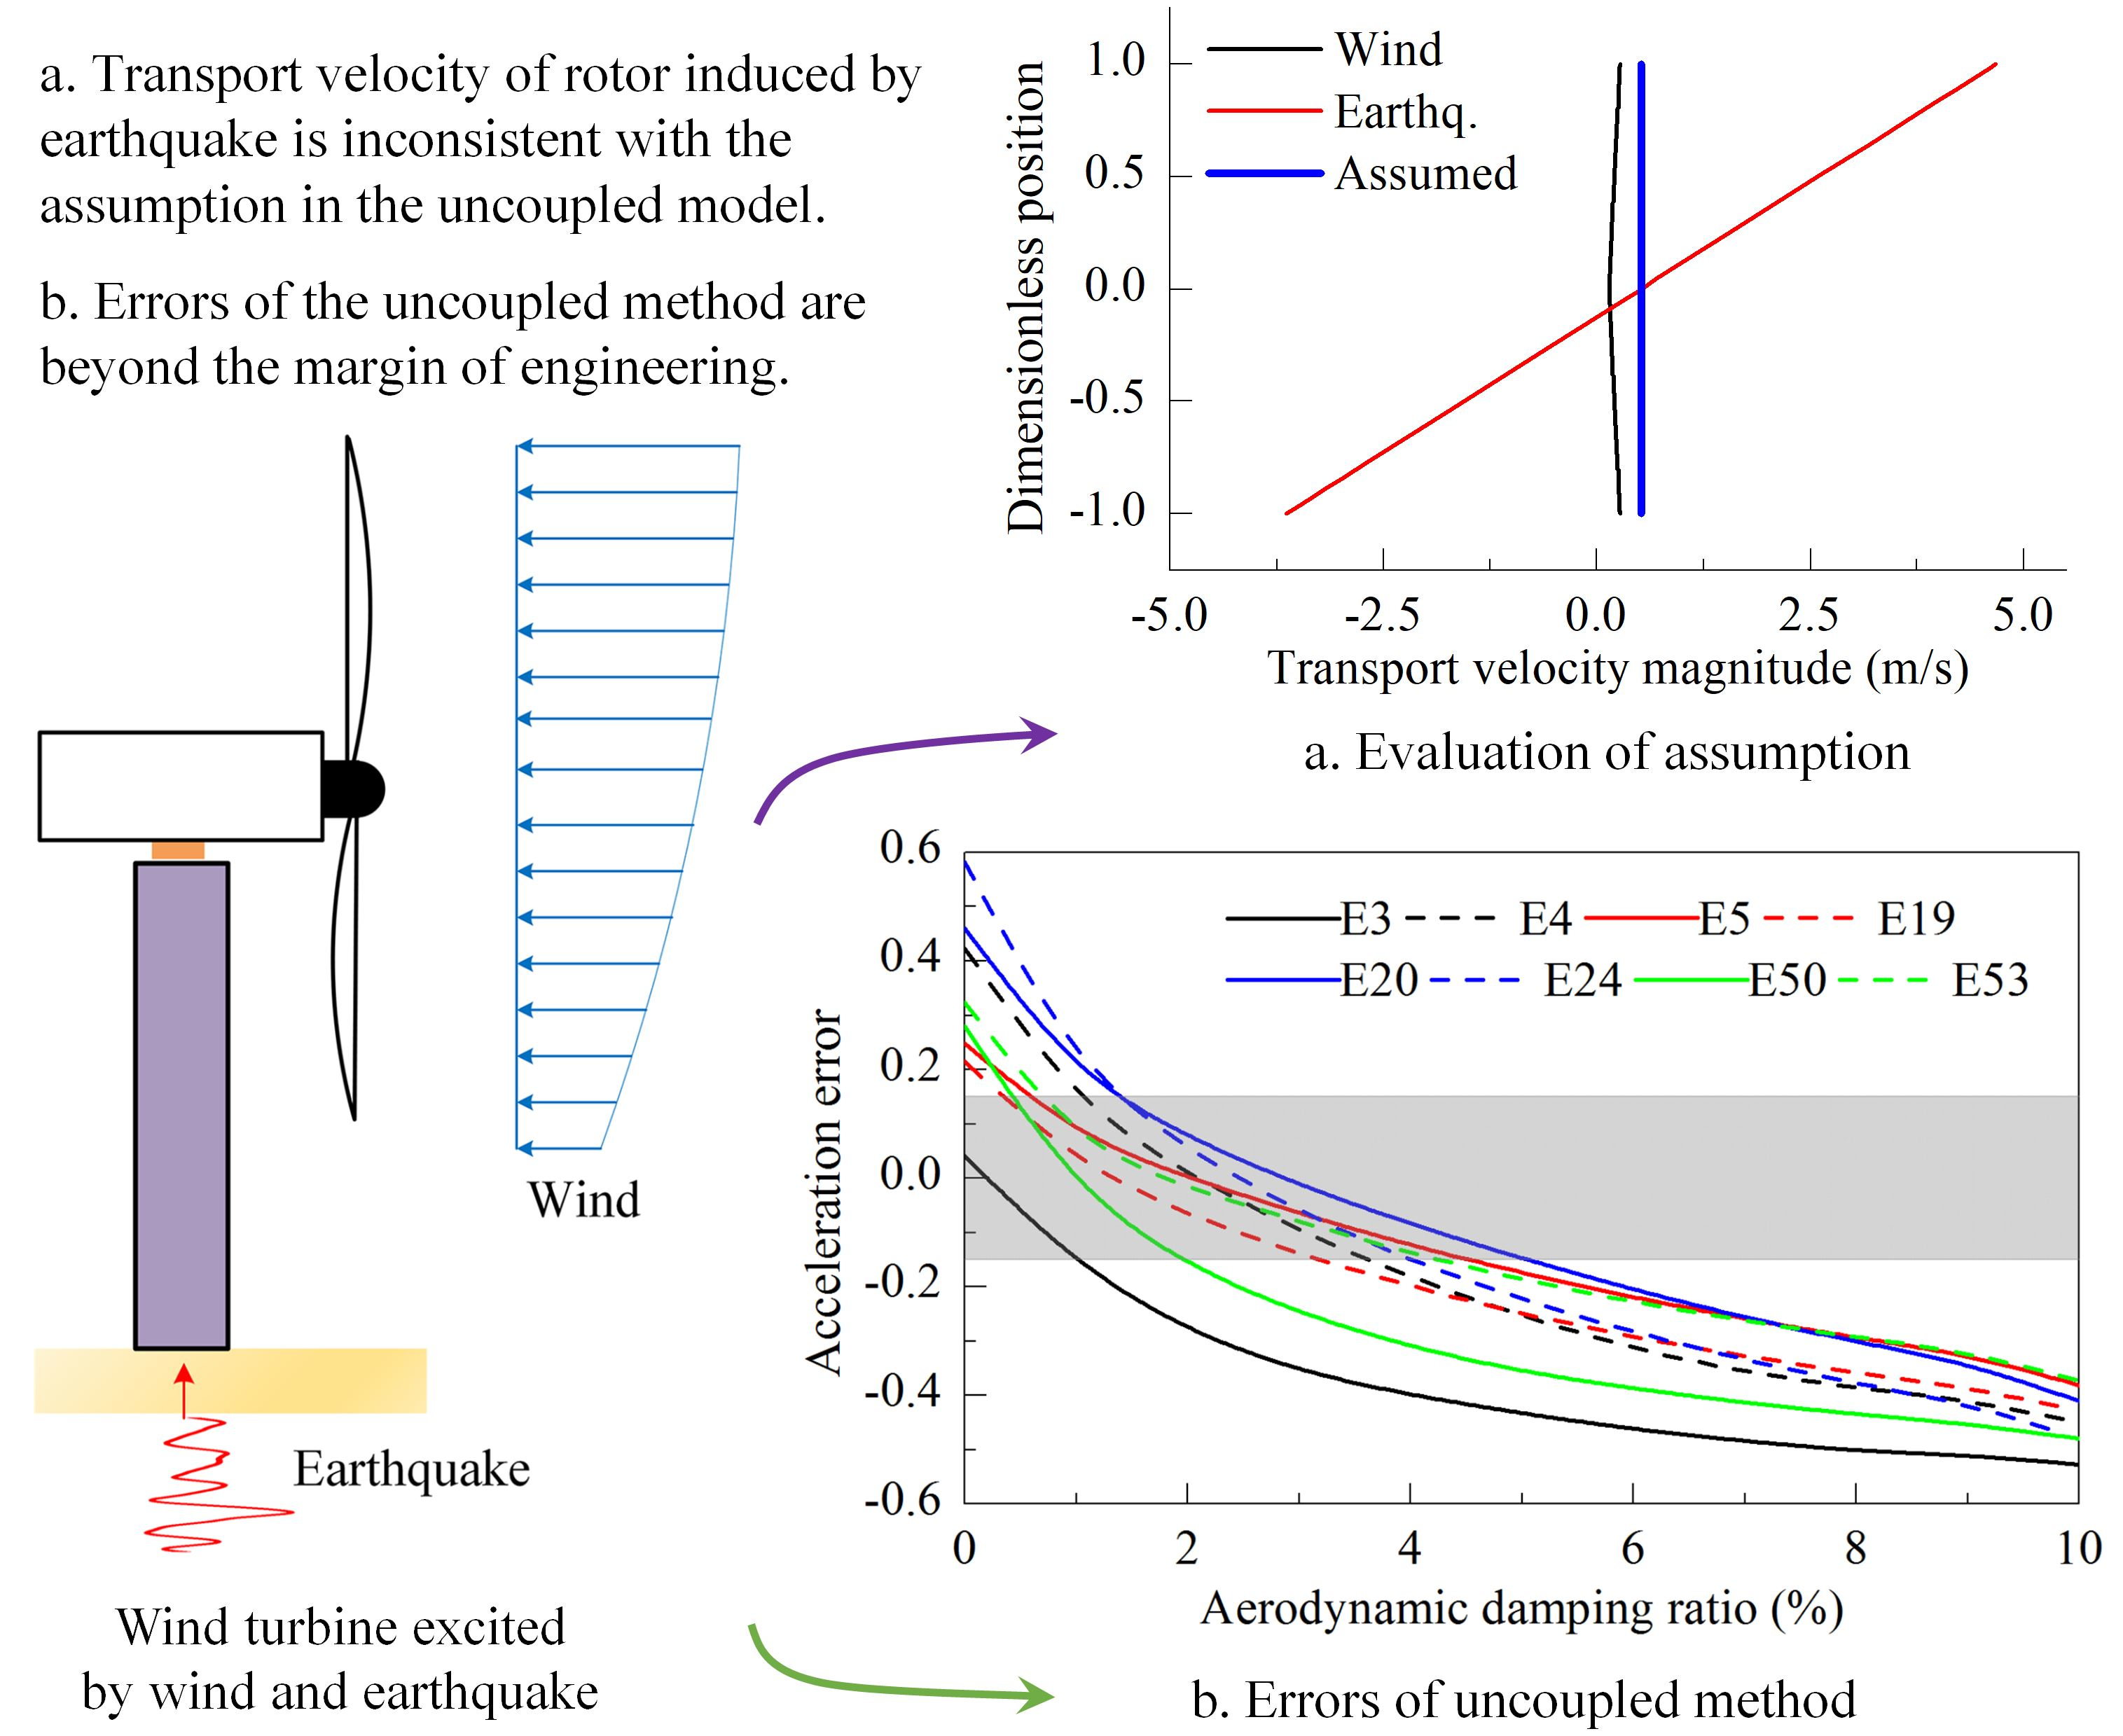
Figure 1.
Dimensions of numerical model.
Figure 1.
Dimensions of numerical model.
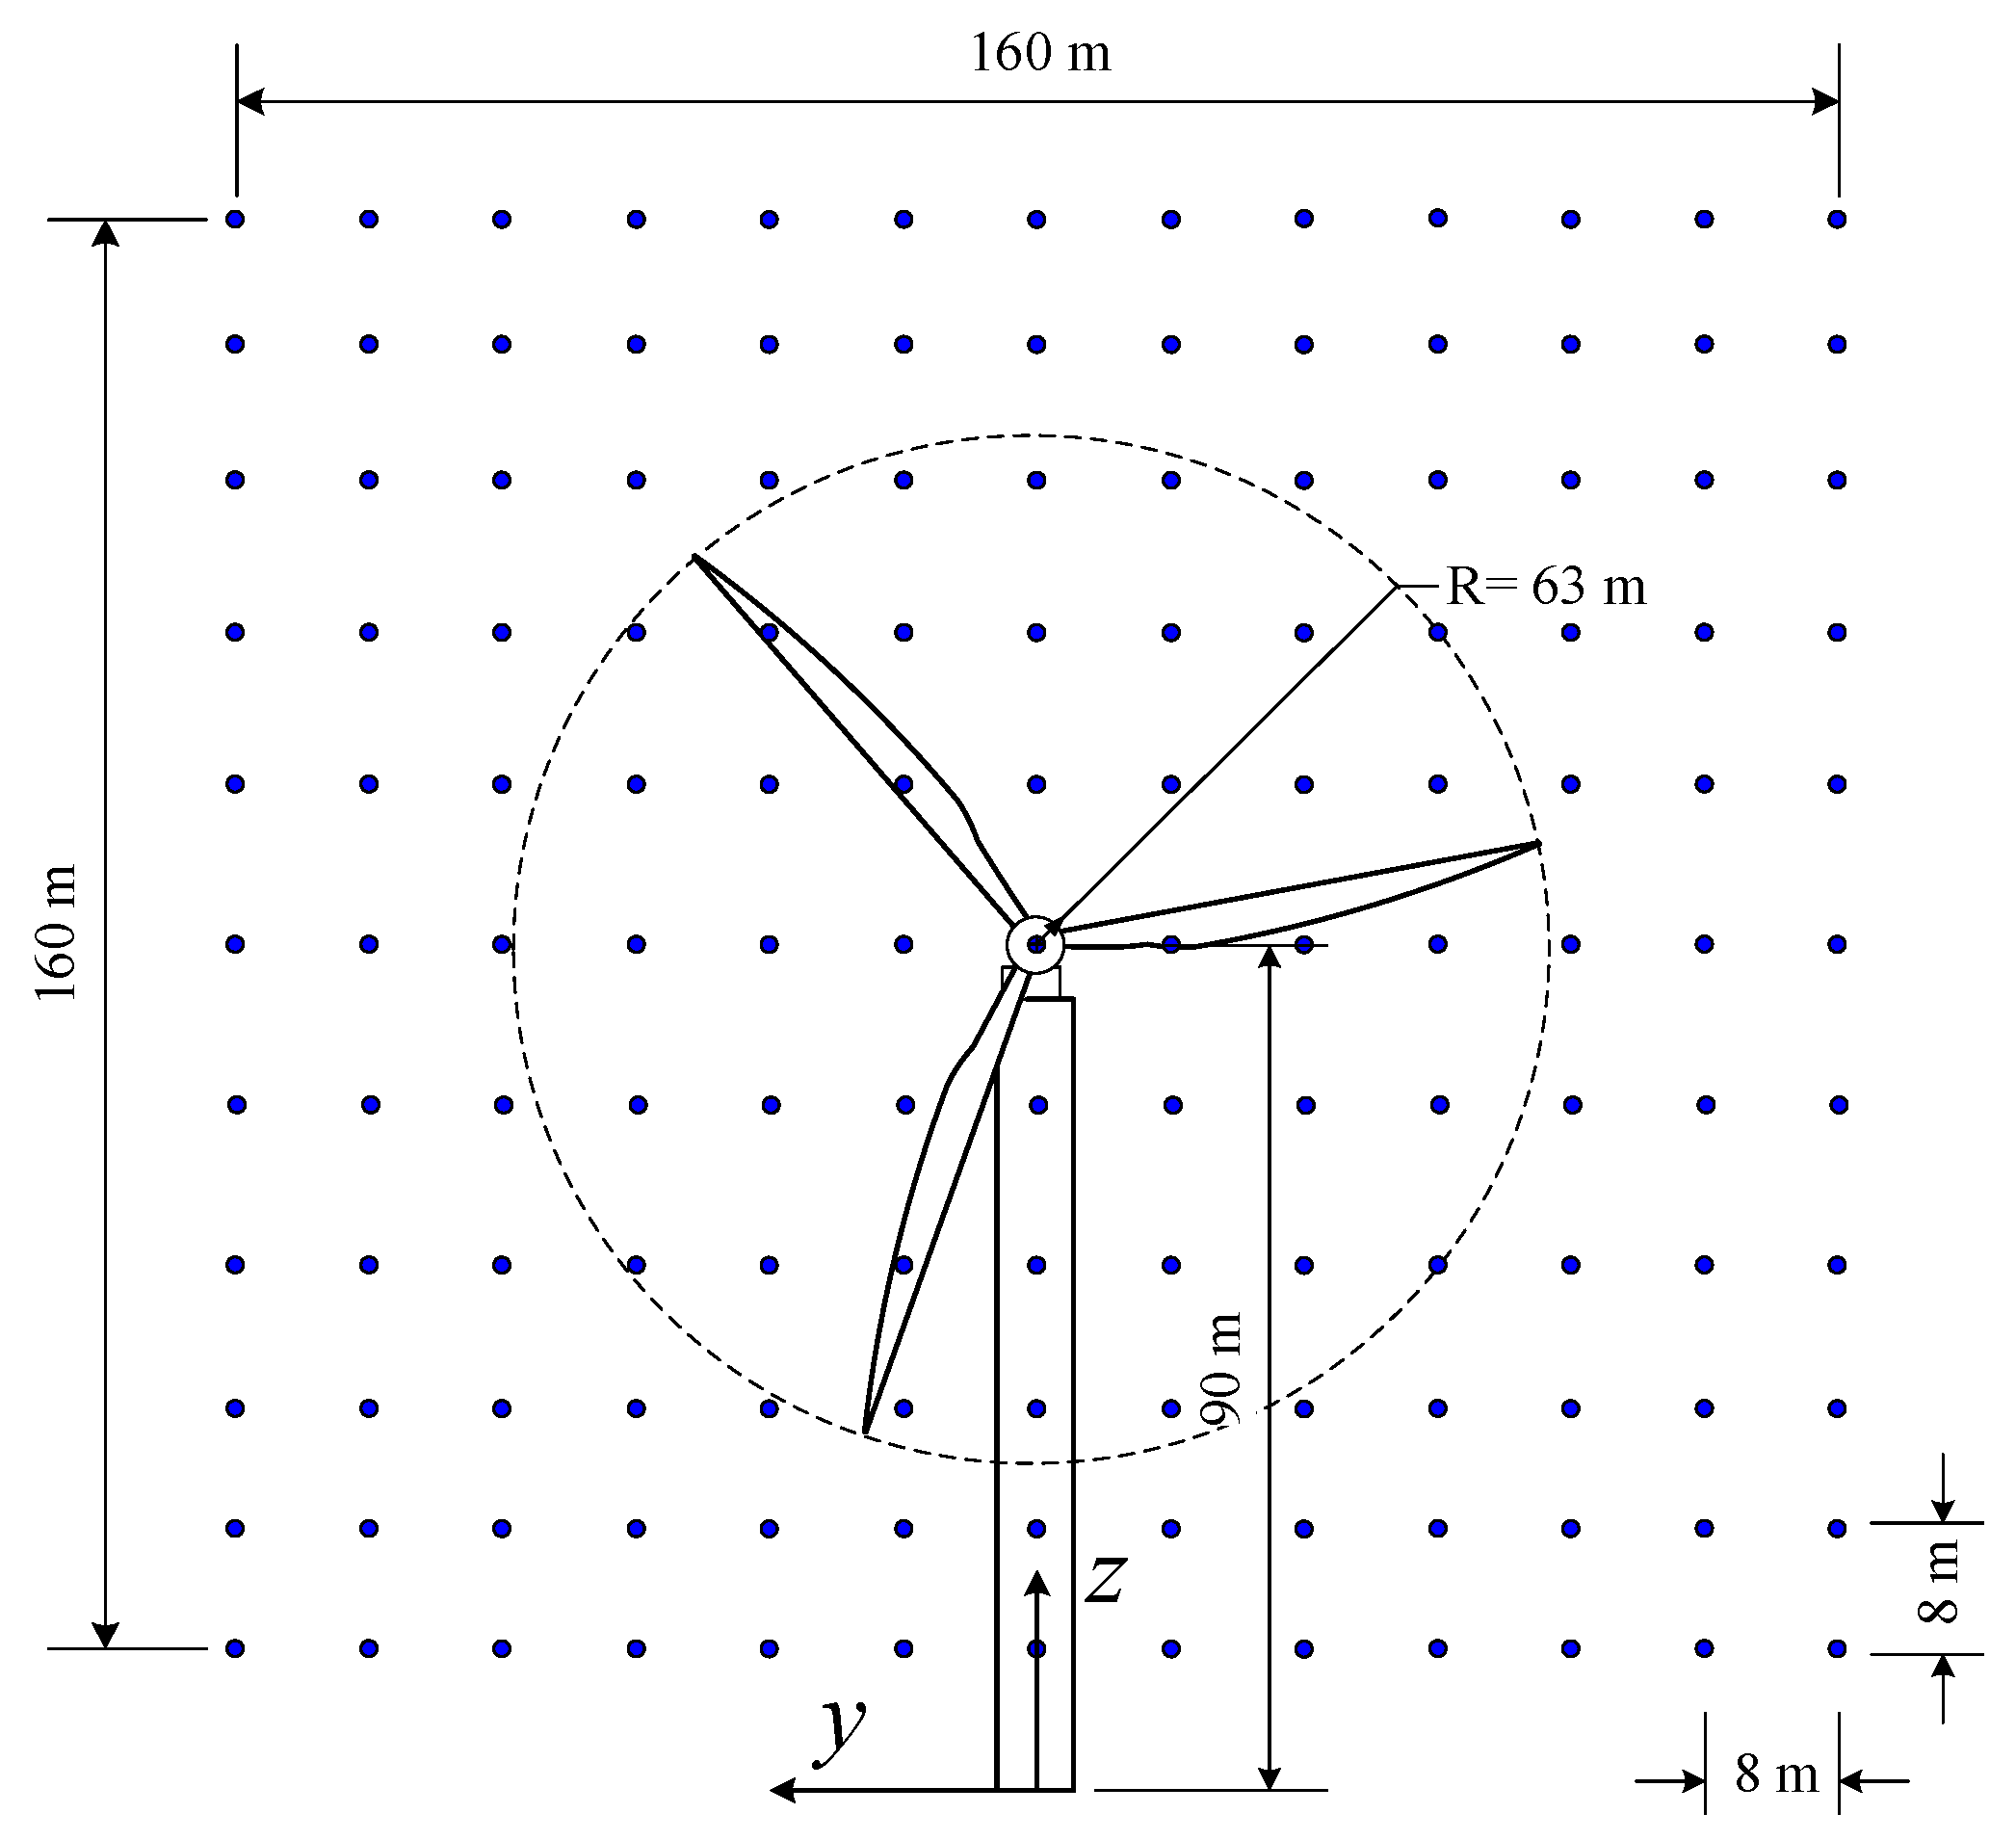
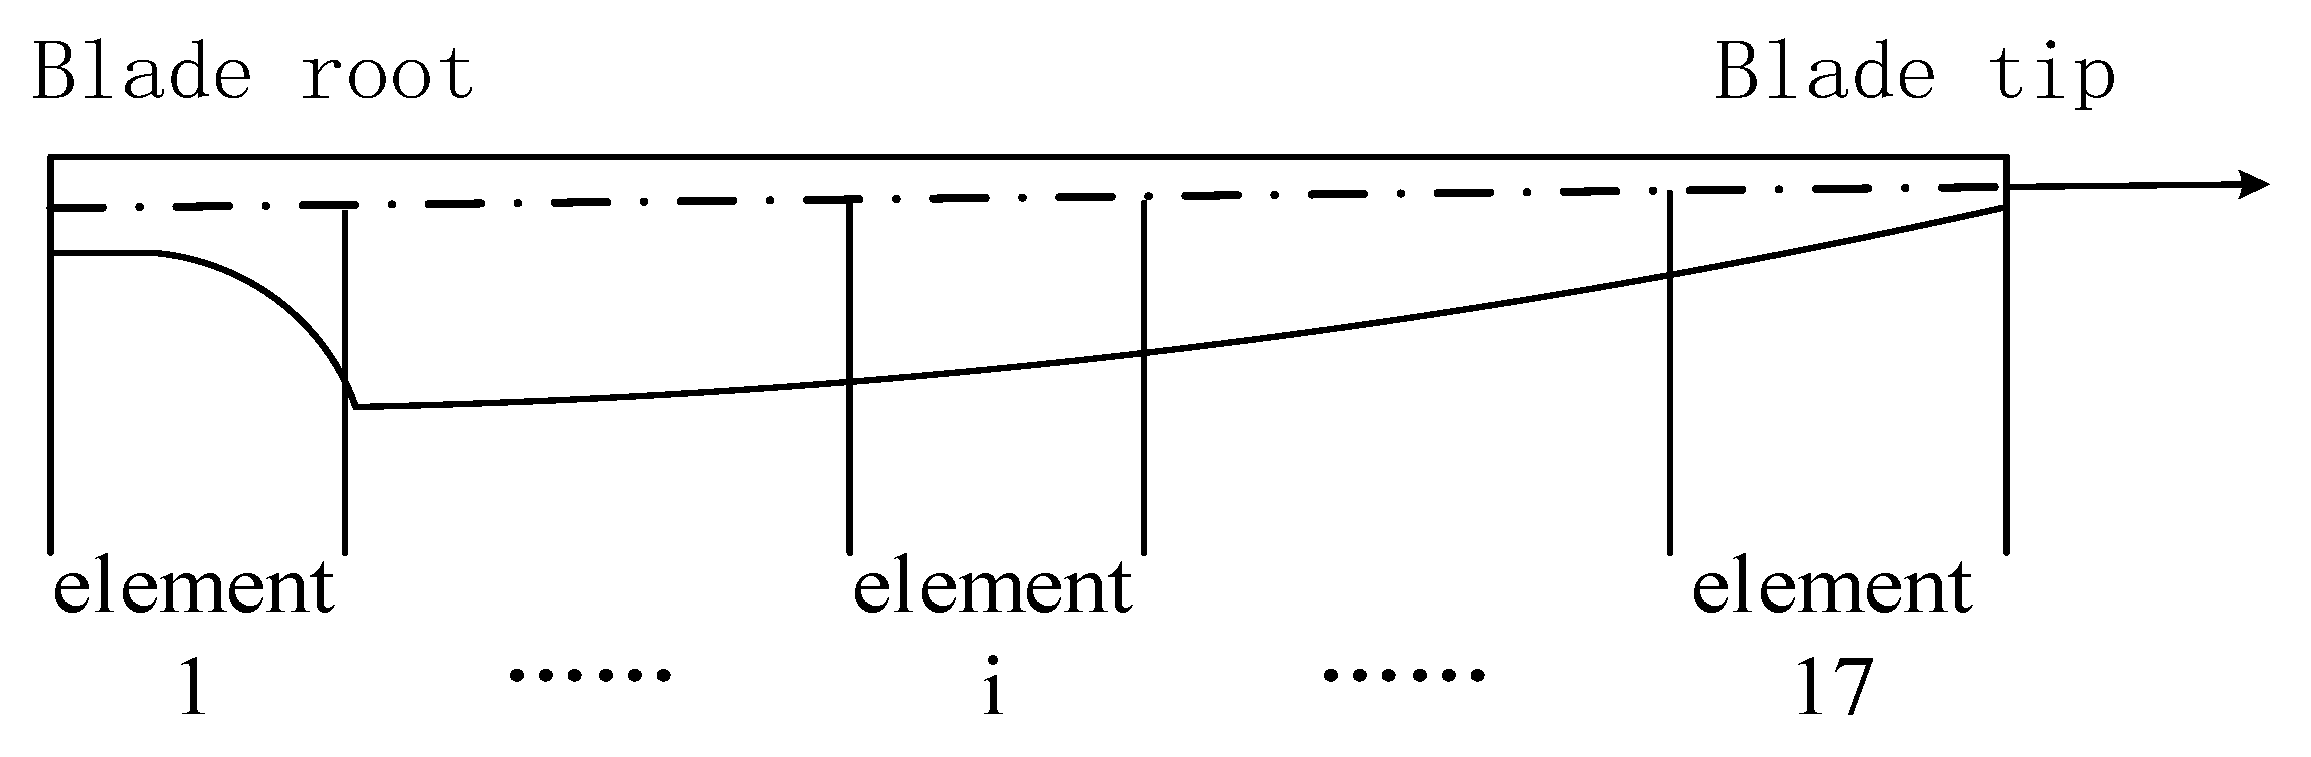
Figure 2.
Element distribution of the blade.
Figure 2.
Element distribution of the blade.
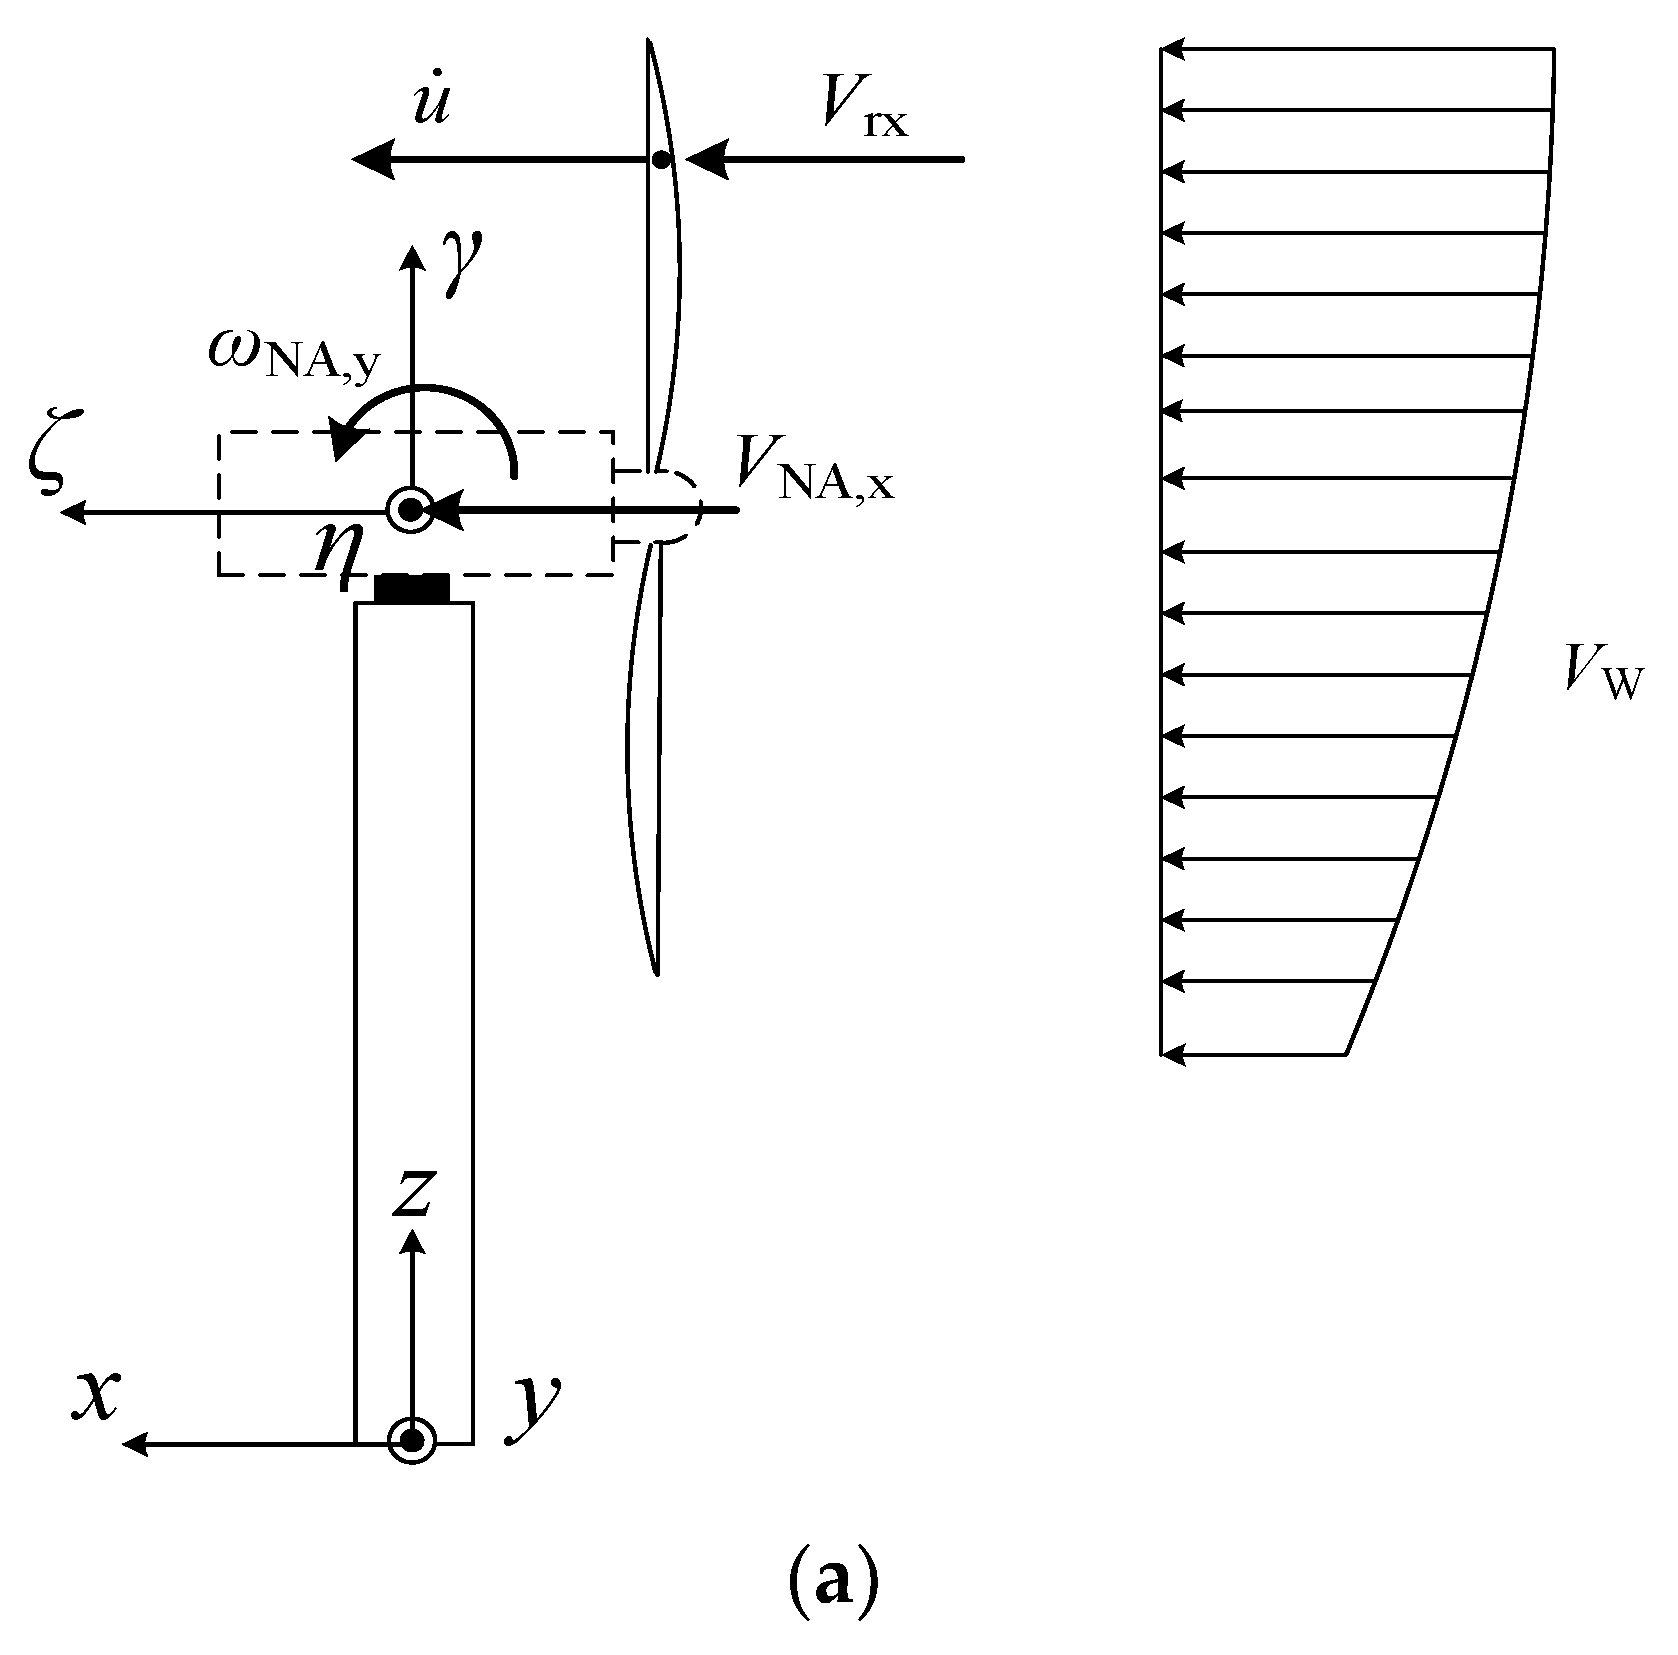
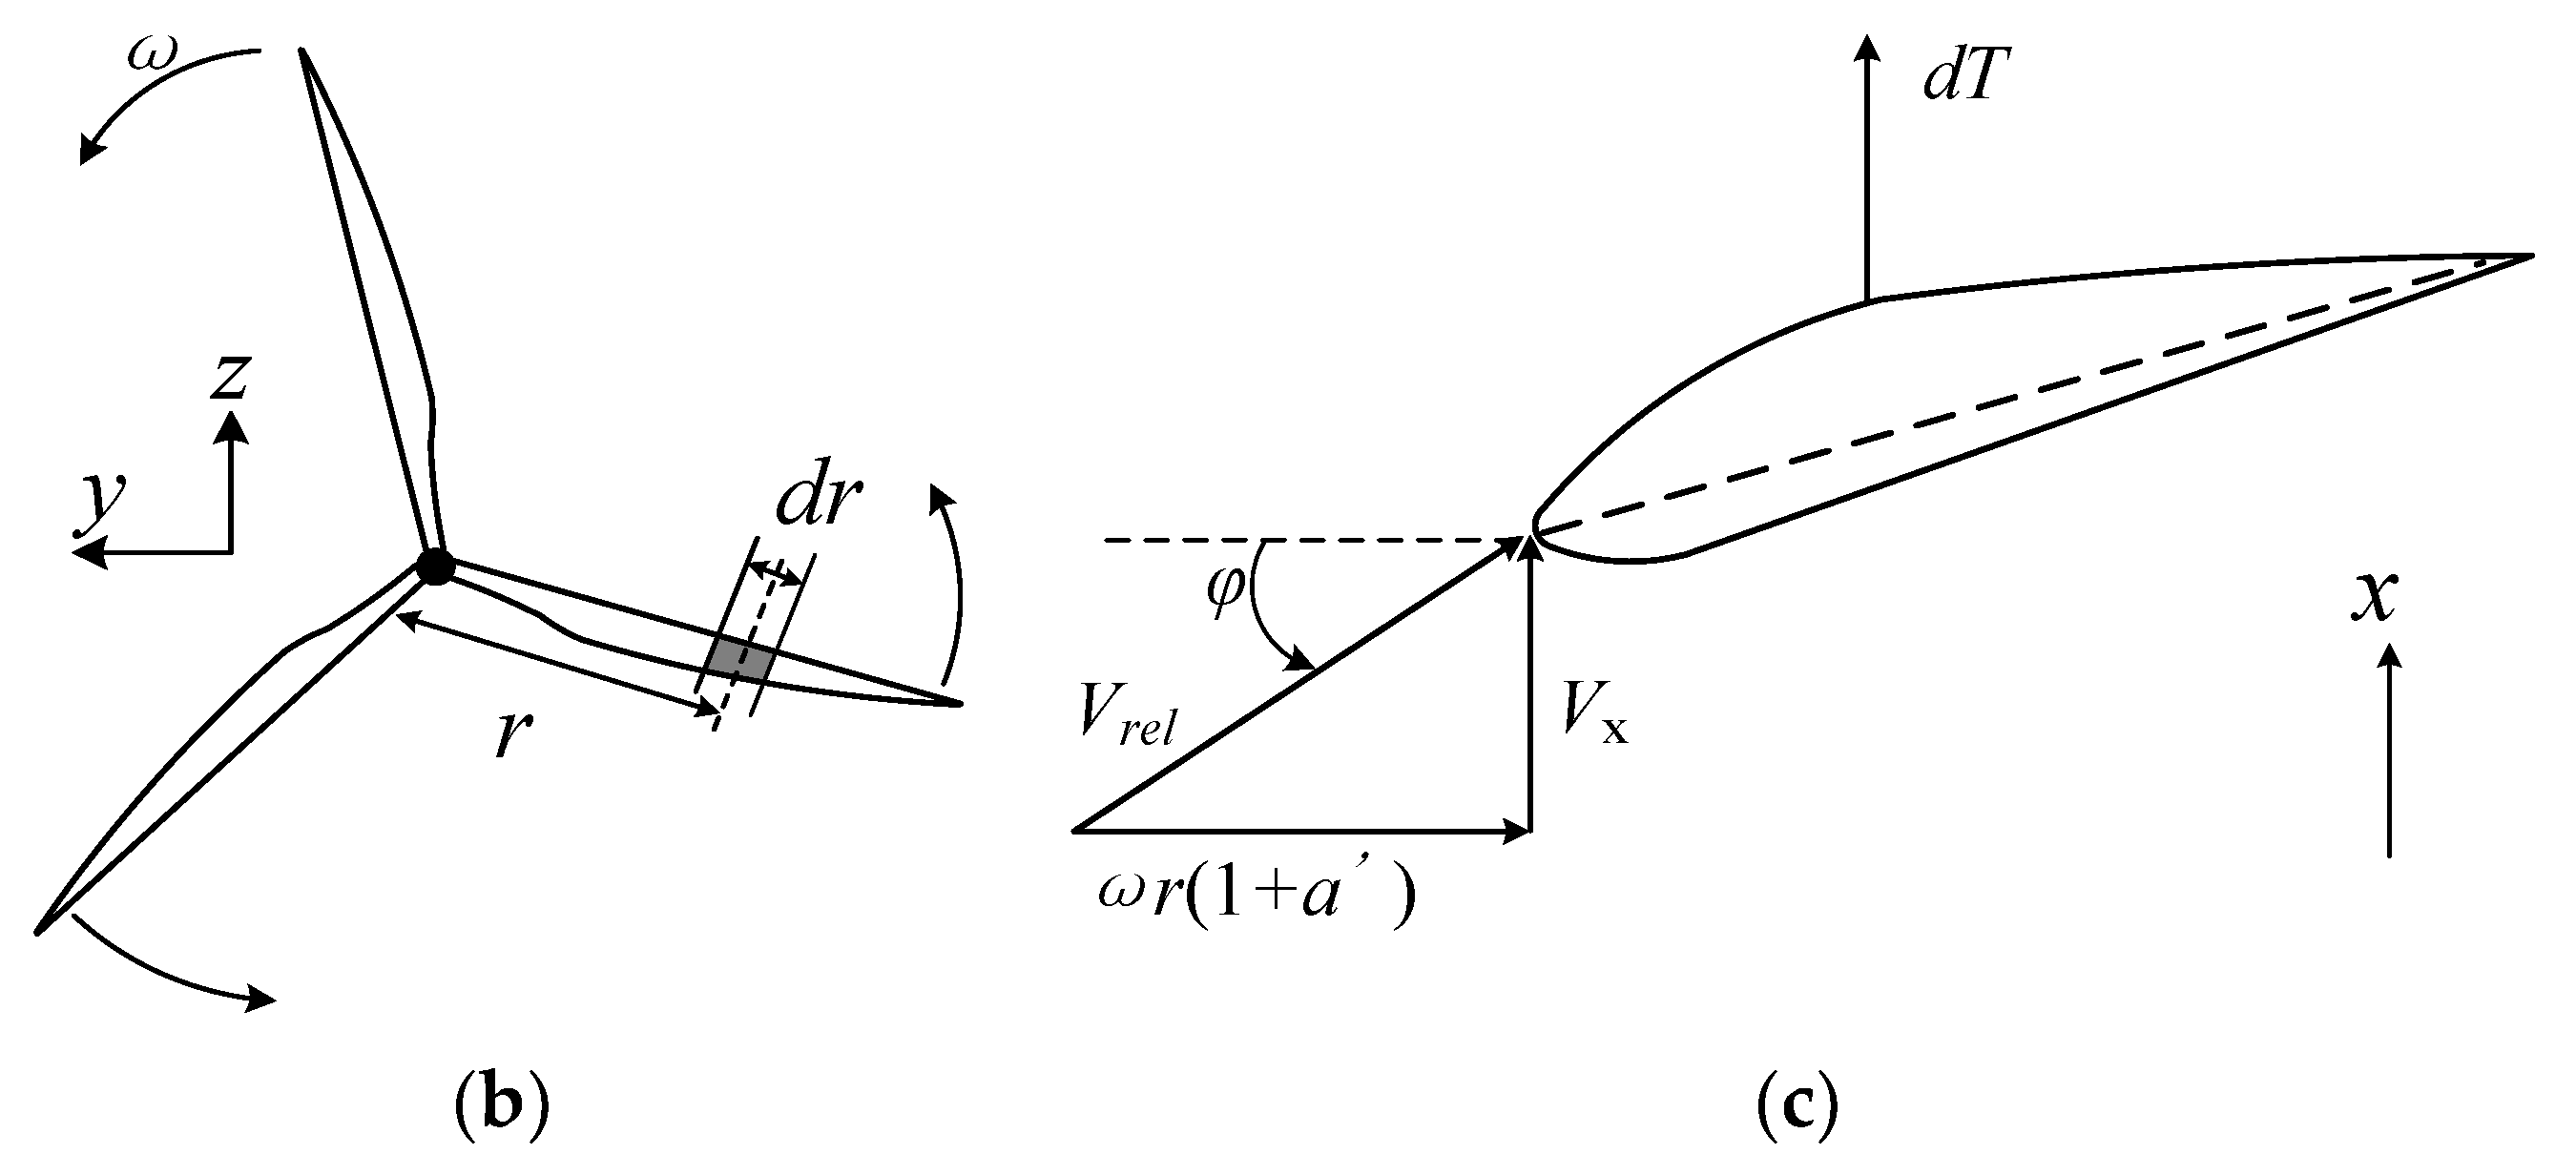
Figure 3.
Analysis model of statics and kinematics; (a) Whole model, (b) Rotor, (c) Cross section of blade.
Figure 3.
Analysis model of statics and kinematics; (a) Whole model, (b) Rotor, (c) Cross section of blade.
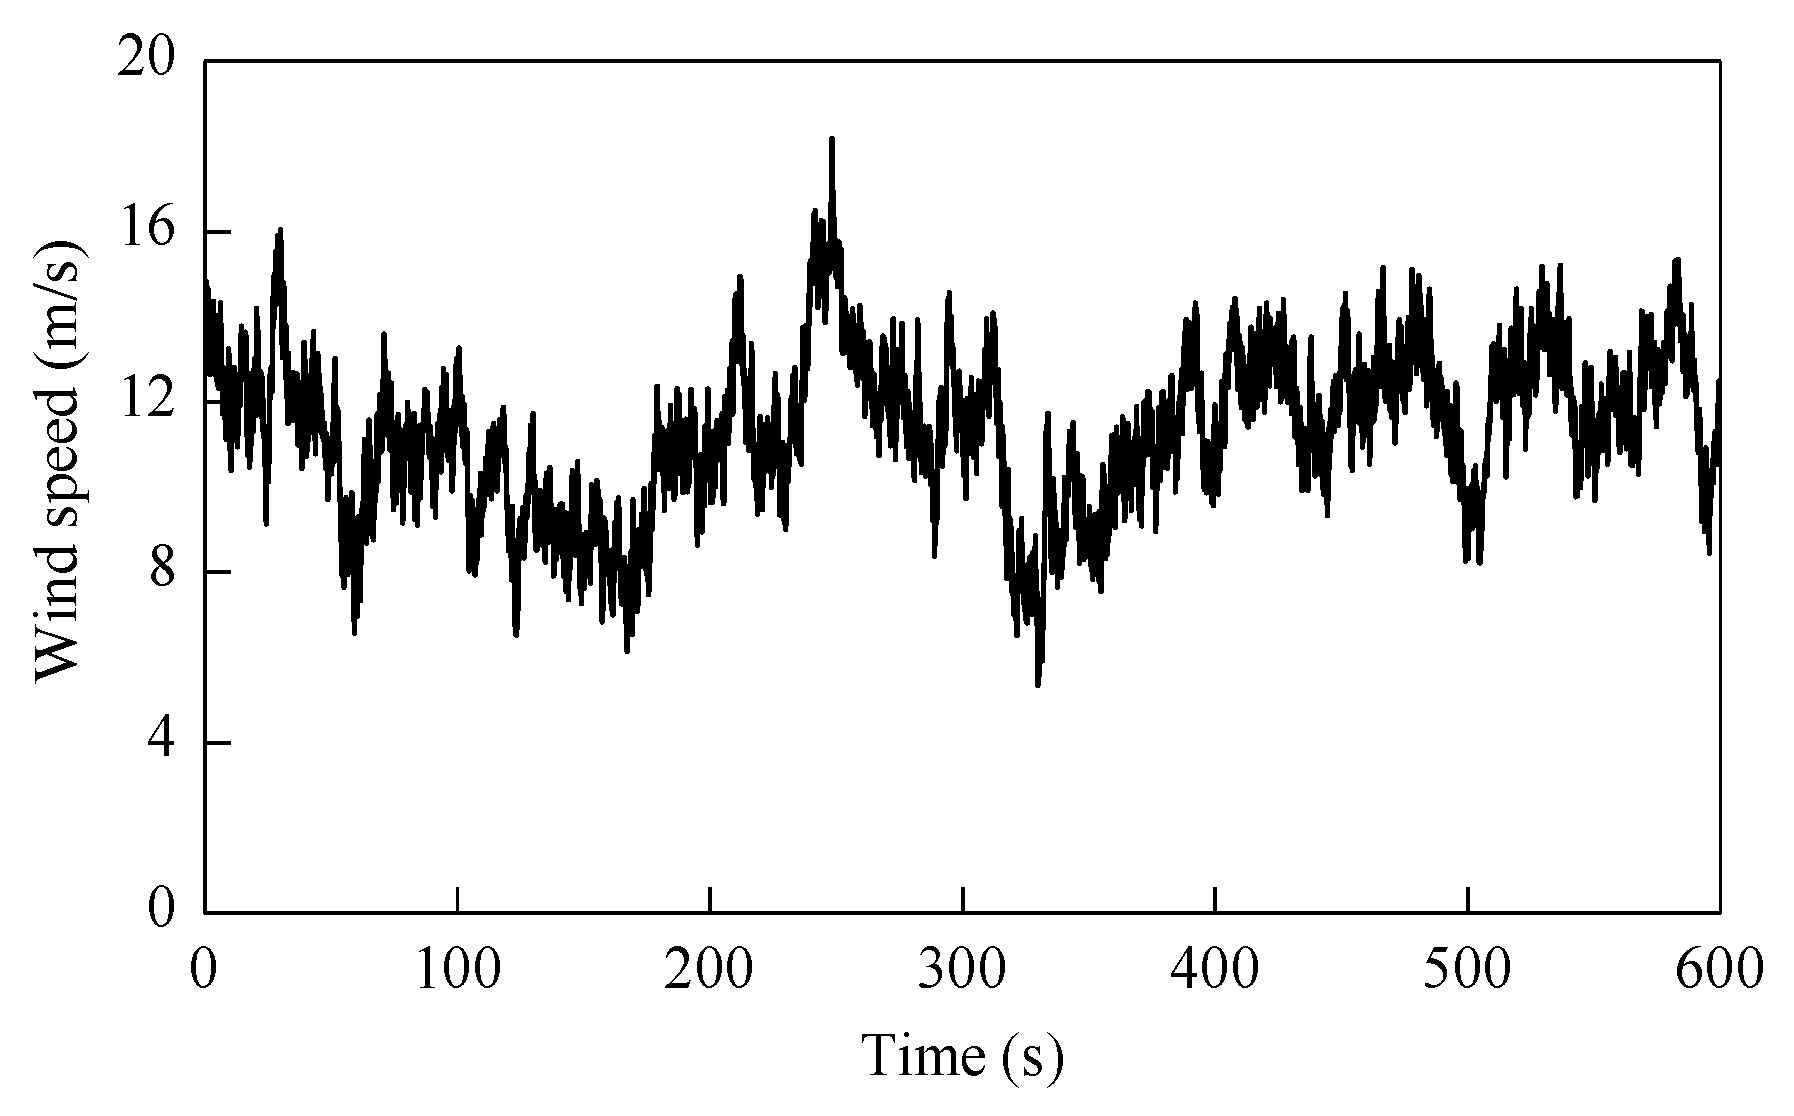
Figure 4.
Wind speed time history at the hub height of the wind turbine.
Figure 4.
Wind speed time history at the hub height of the wind turbine.
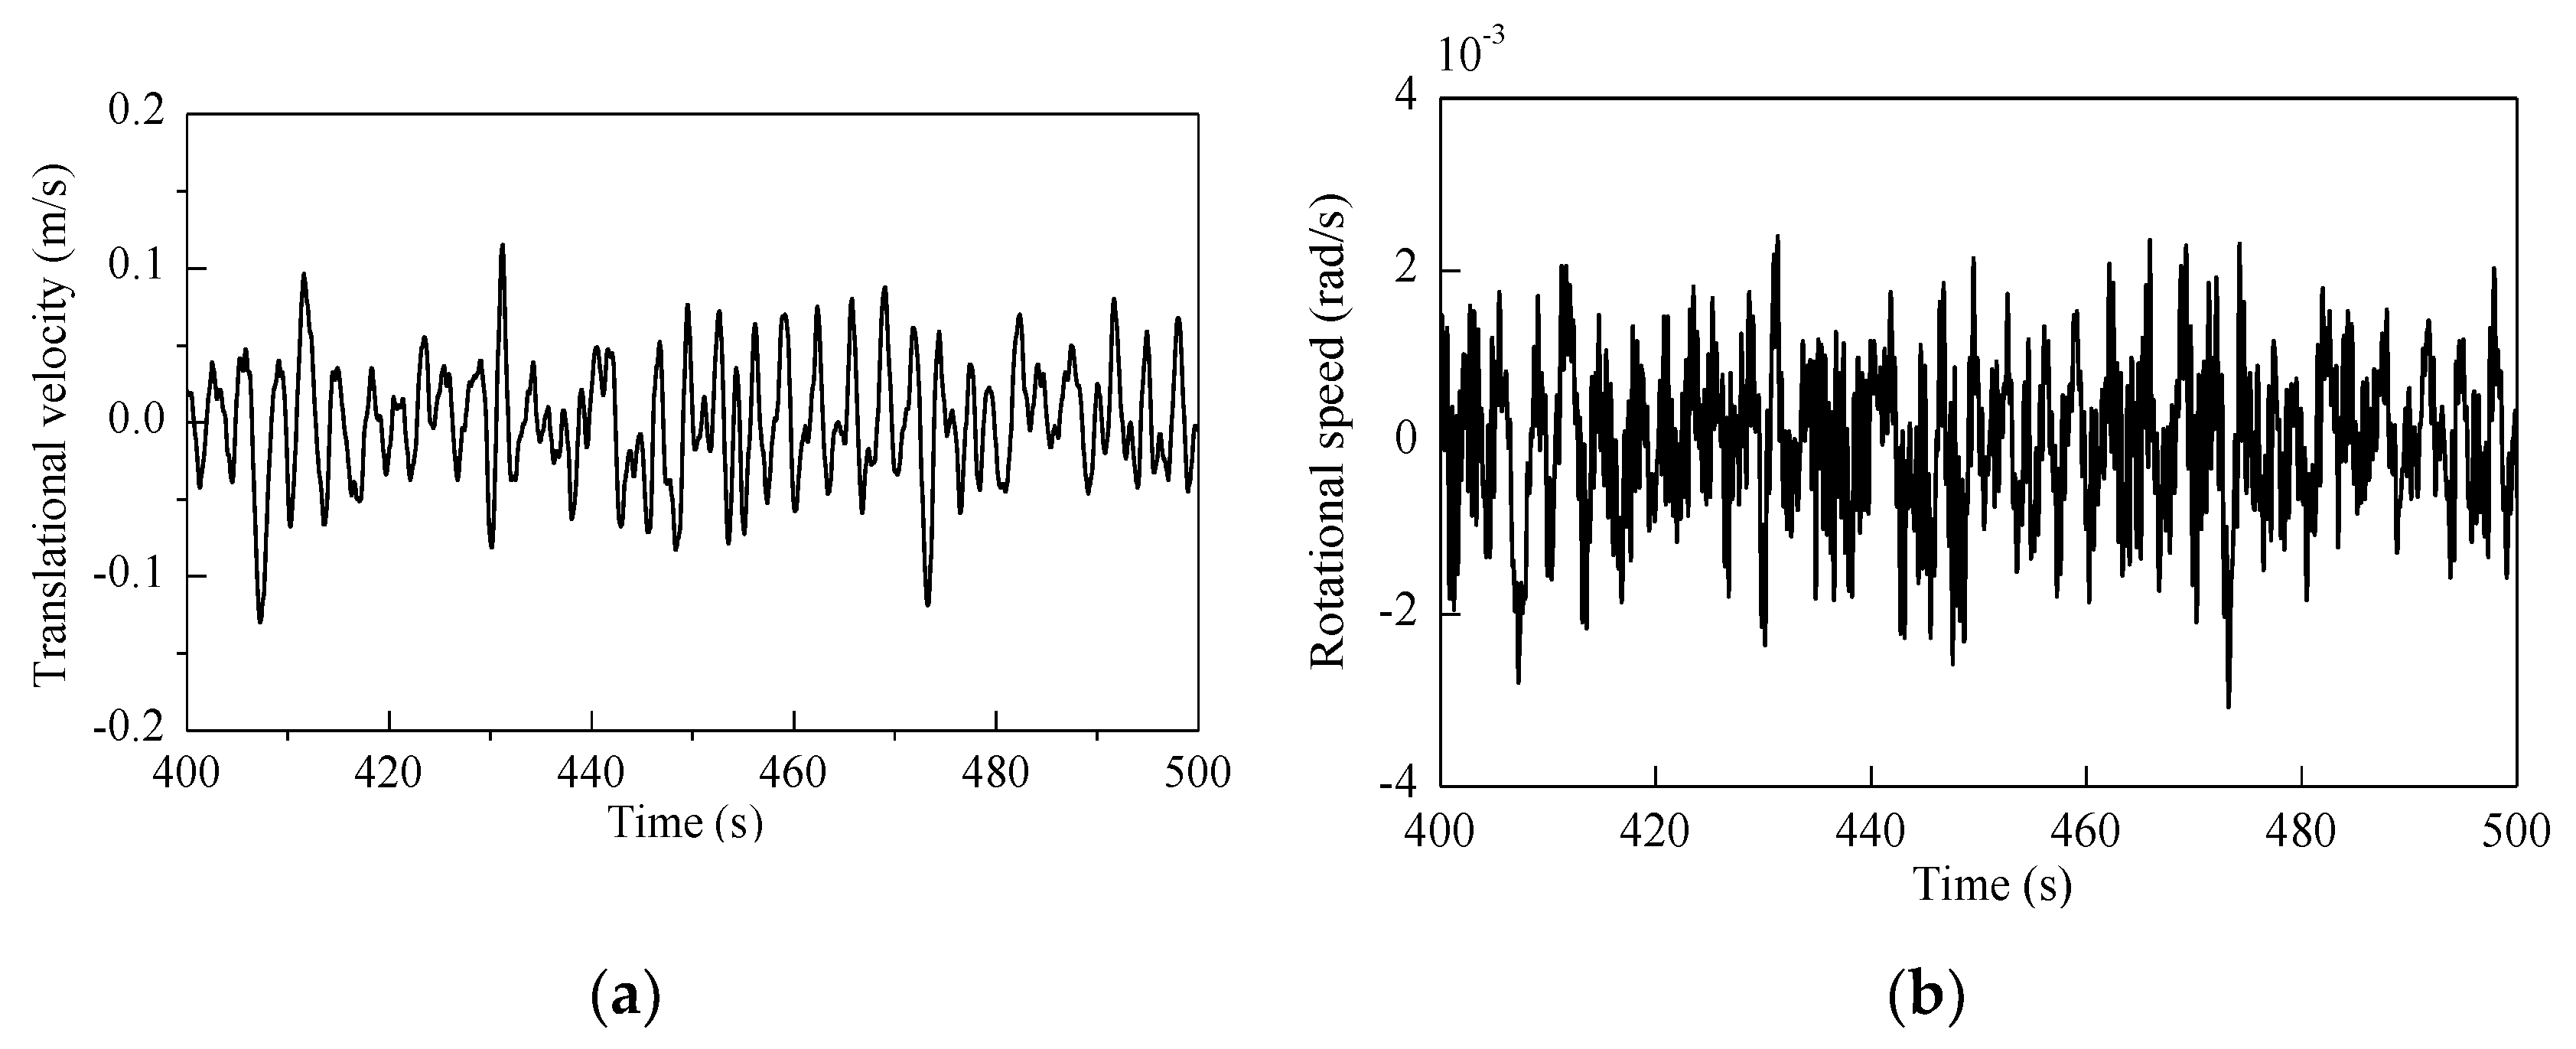
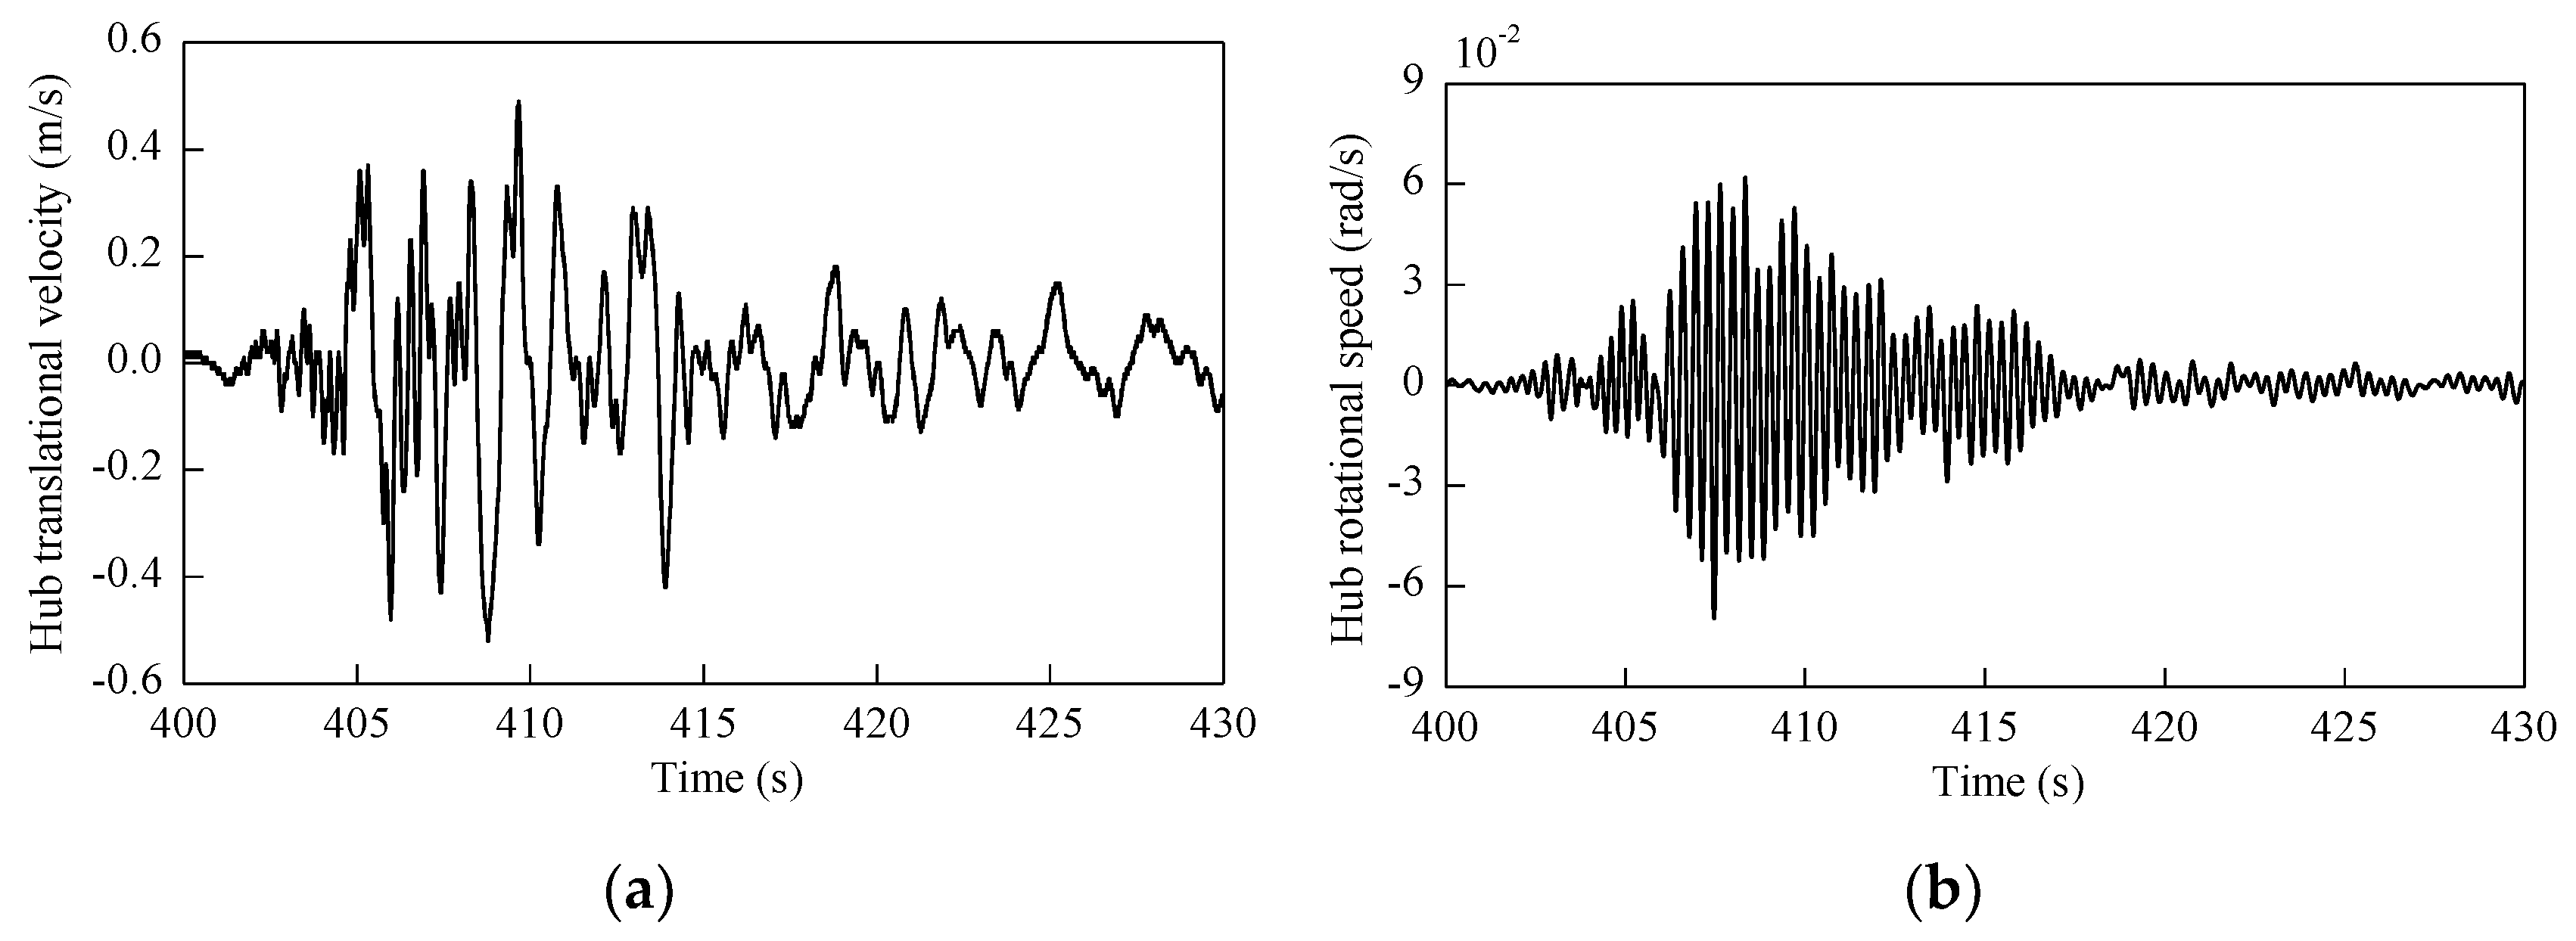
Figure 5.
Oscillation velocity of the nacelle subjected to turbulent wind; (a) translational velocity in the x-axis, (b) angular velocity in the y-axis.
Figure 5.
Oscillation velocity of the nacelle subjected to turbulent wind; (a) translational velocity in the x-axis, (b) angular velocity in the y-axis.
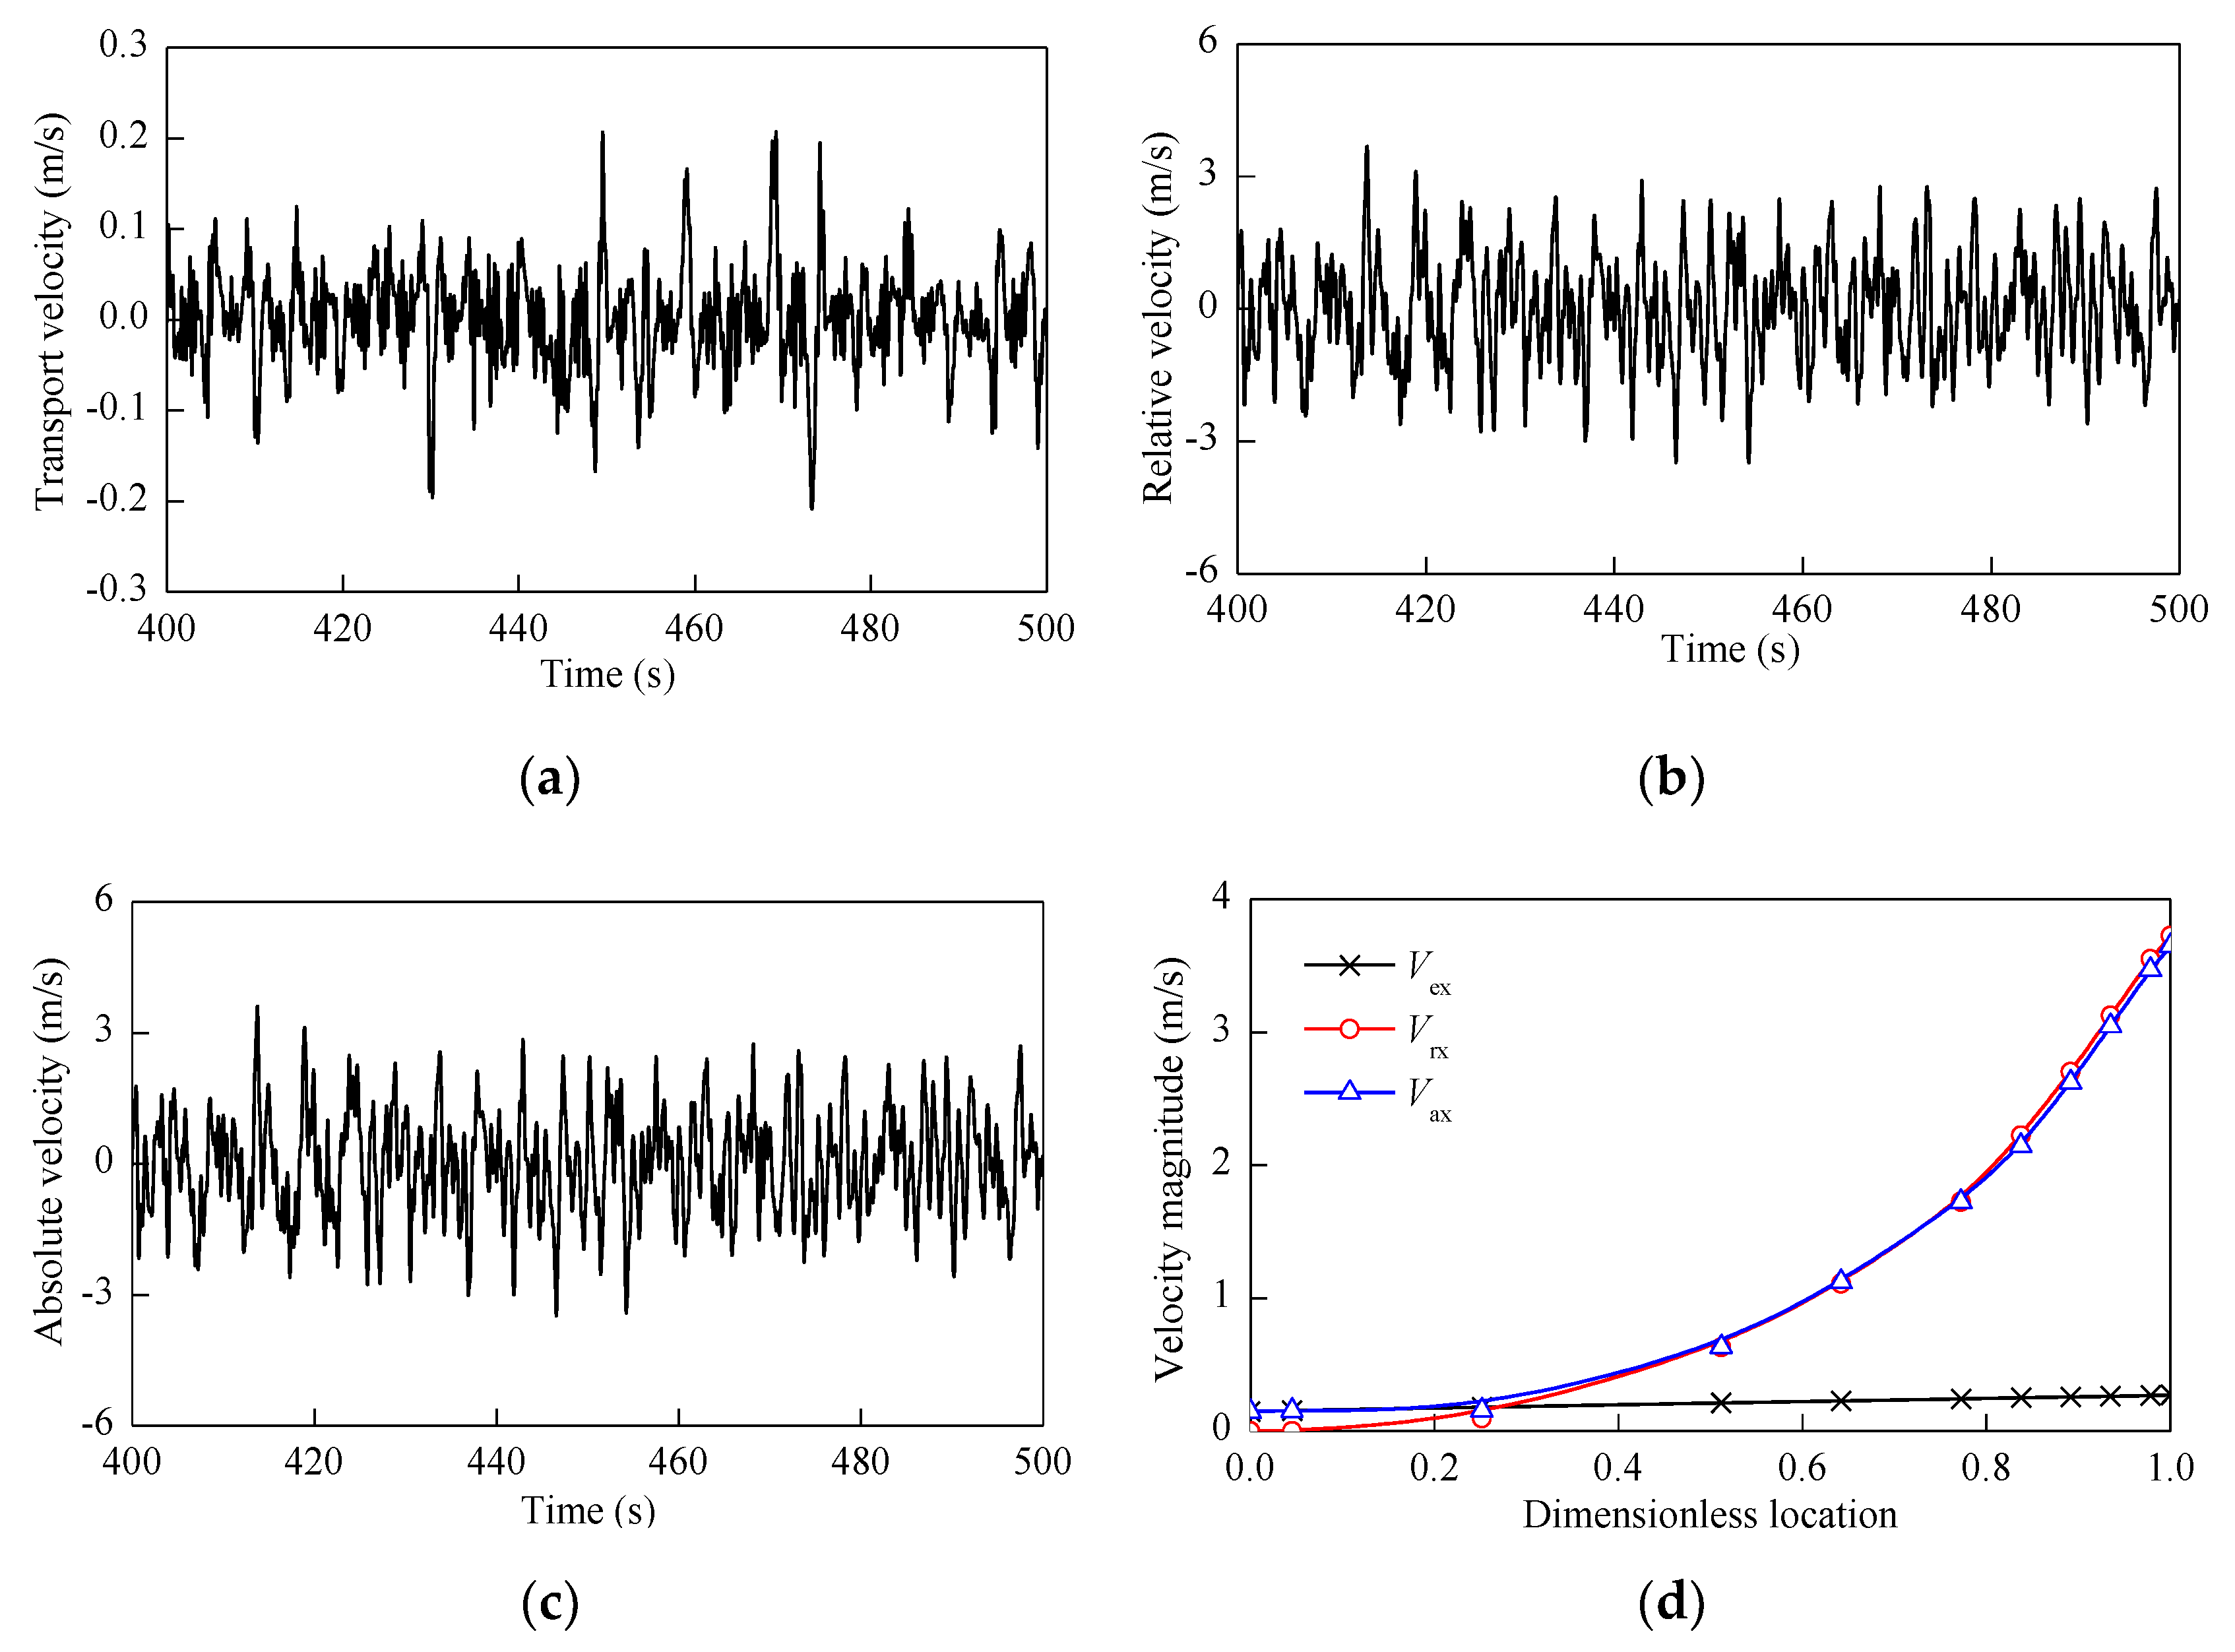
Figure 6.
Oscillation velocity of blade 1 along the x-axis; (a) transport velocity of blade tip, (b) relative velocity of blade tip, (c) absolute velocity of blade tip, (d) velocity amplitude of blade.
Figure 6.
Oscillation velocity of blade 1 along the x-axis; (a) transport velocity of blade tip, (b) relative velocity of blade tip, (c) absolute velocity of blade tip, (d) velocity amplitude of blade.
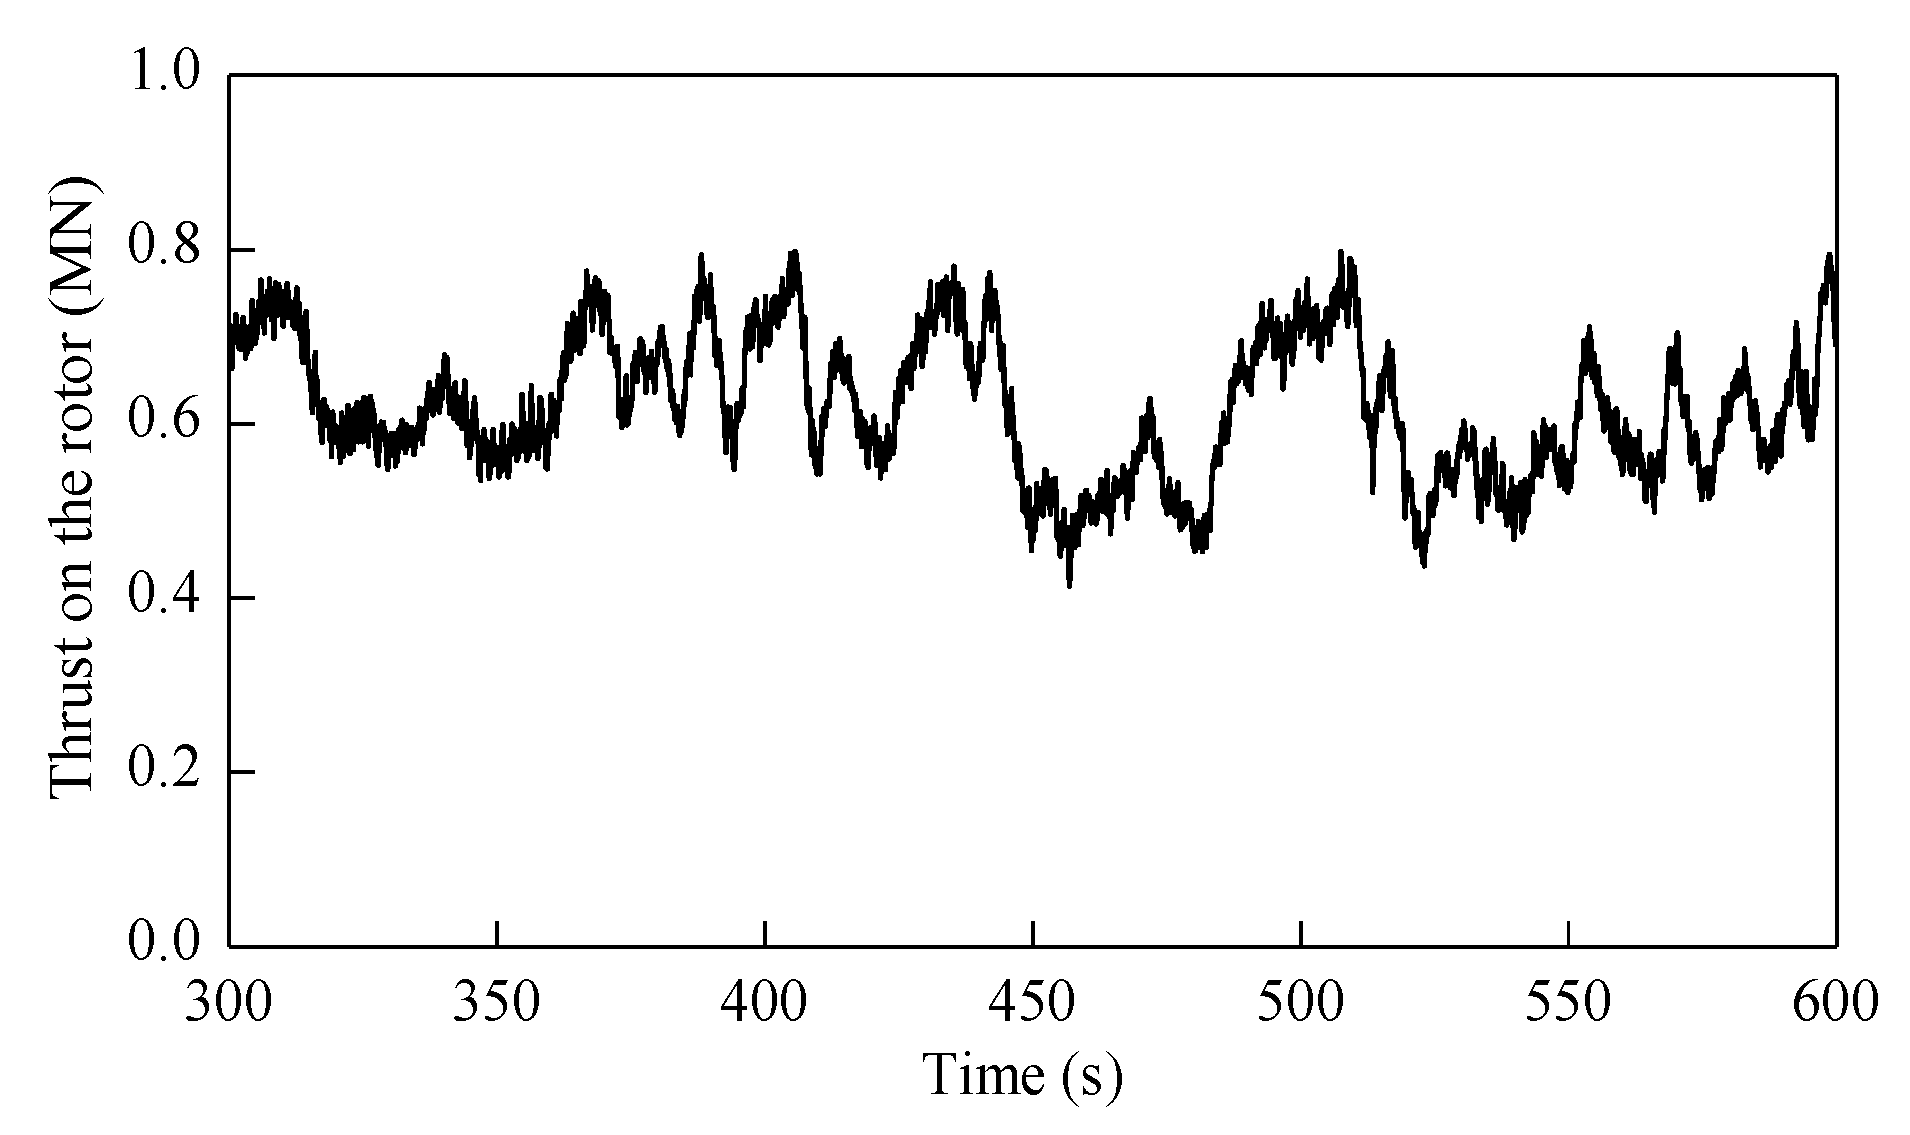
Figure 7.
Thrust on the rotor when the mean wind speed at hub height is 11.4 m/s.
Figure 7.
Thrust on the rotor when the mean wind speed at hub height is 11.4 m/s.
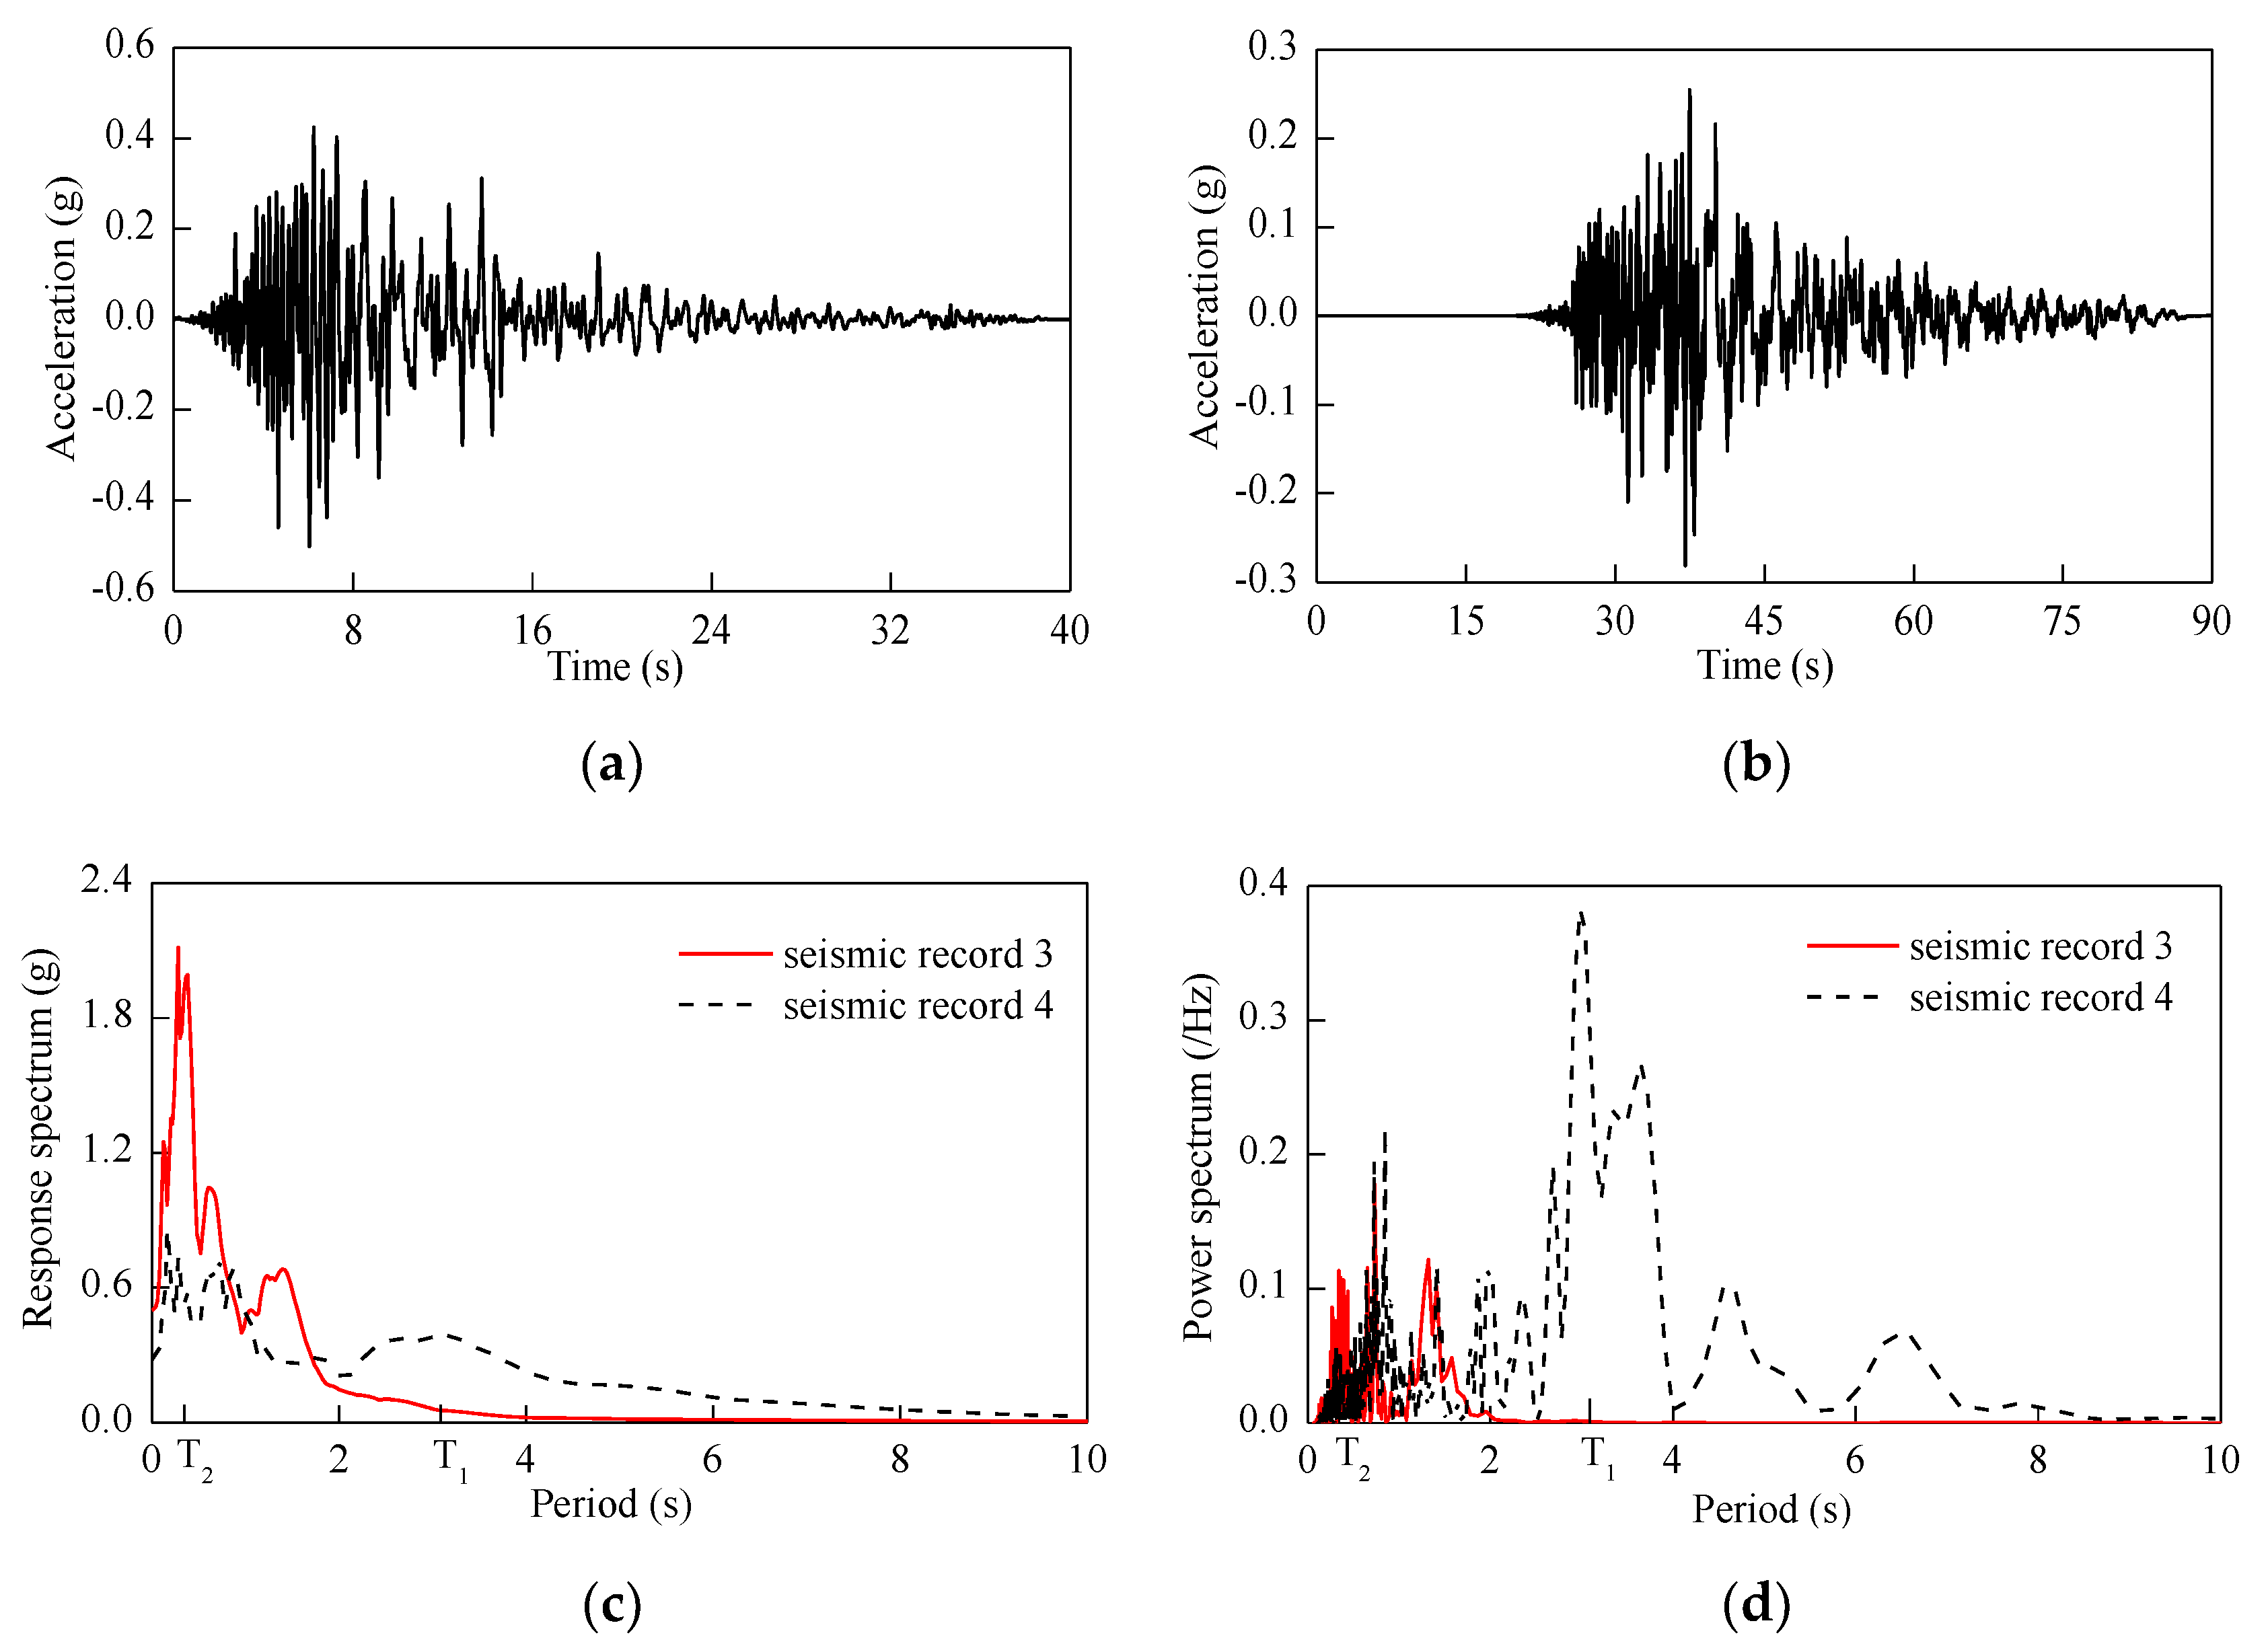
Figure 8.
Time history and spectral characteristic of seismic records 3 and 4; (a) acceleration time history of Record 3, (b) acceleration time history of Record 4, (c) acceleration response spectrum, (d) power spectrum.
Figure 8.
Time history and spectral characteristic of seismic records 3 and 4; (a) acceleration time history of Record 3, (b) acceleration time history of Record 4, (c) acceleration response spectrum, (d) power spectrum.
Figure 9.
Nacelle oscillation velocity when the input ground motion is seismic record 3; (a) translational velocity in x-axis, (b) angular velocity about y-axis.
Figure 9.
Nacelle oscillation velocity when the input ground motion is seismic record 3; (a) translational velocity in x-axis, (b) angular velocity about y-axis.
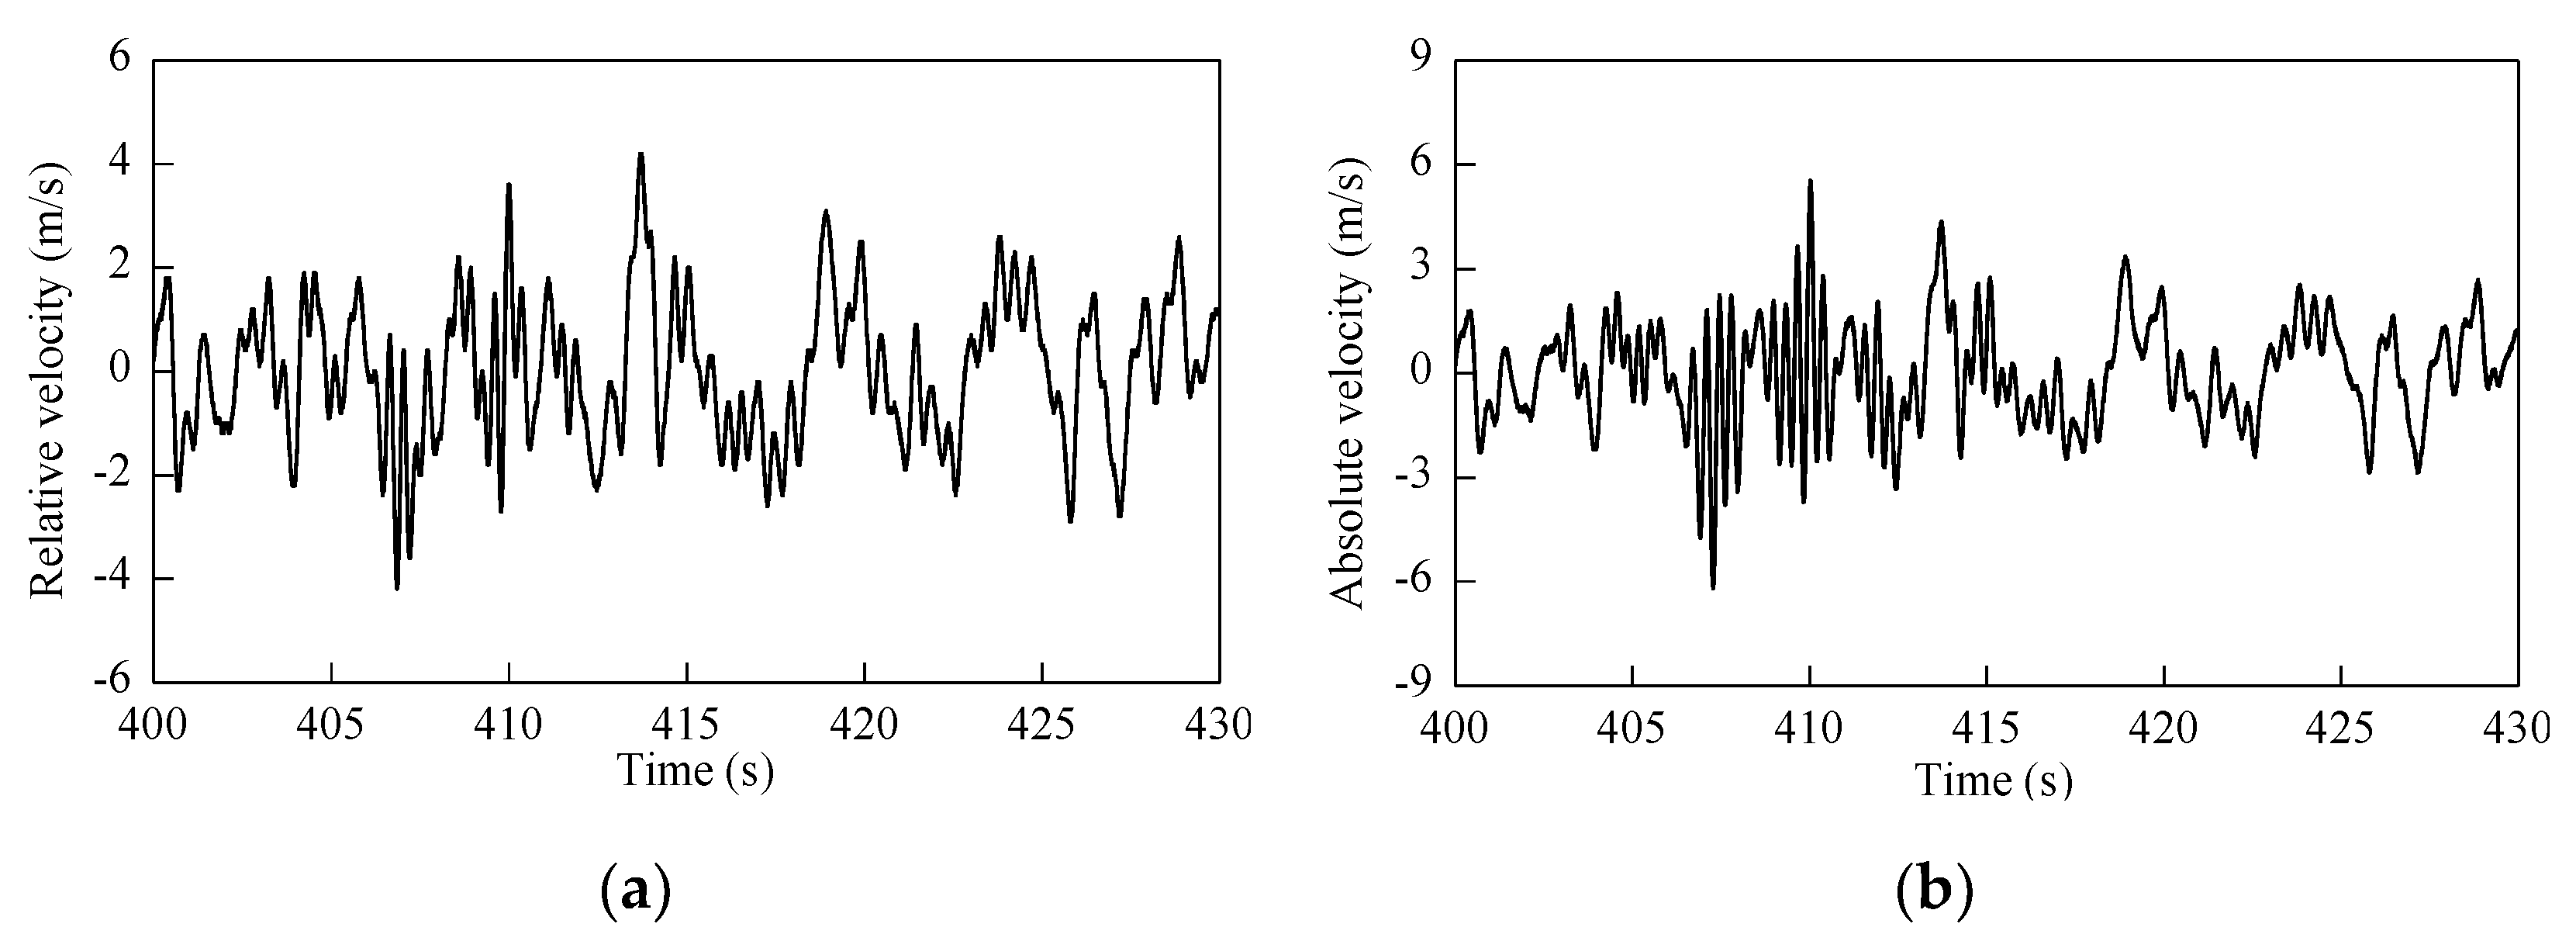
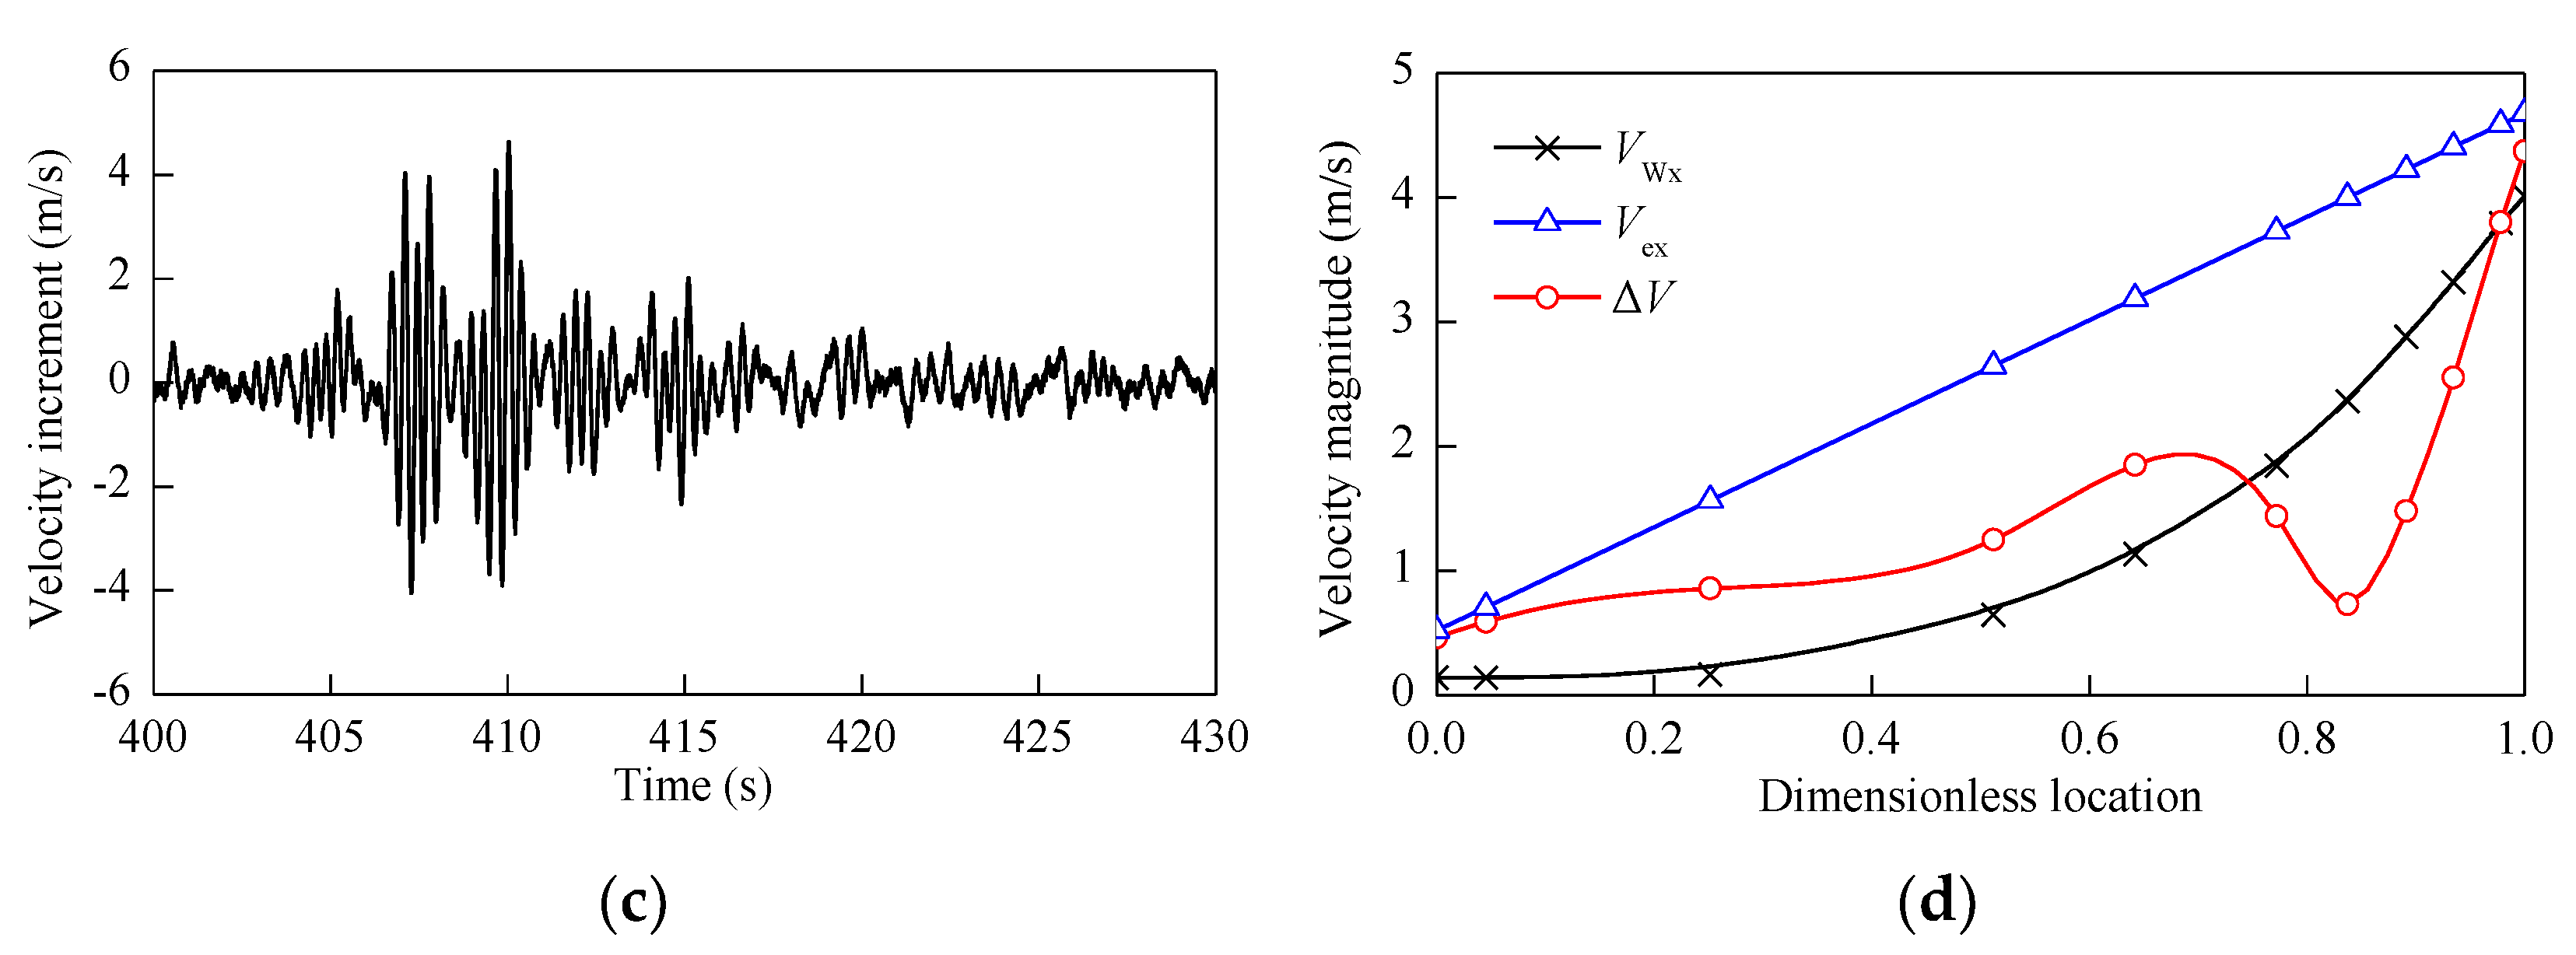
Figure 10.
Oscillation velocity of the blade along the x-axis when the input ground motion is seismic record 3; (a) relative velocity of blade tip, (b) absolute velocity of blade tip, (c) velocity increment of blade tip, (d) velocity amplitude along the blade.
Figure 10.
Oscillation velocity of the blade along the x-axis when the input ground motion is seismic record 3; (a) relative velocity of blade tip, (b) absolute velocity of blade tip, (c) velocity increment of blade tip, (d) velocity amplitude along the blade.
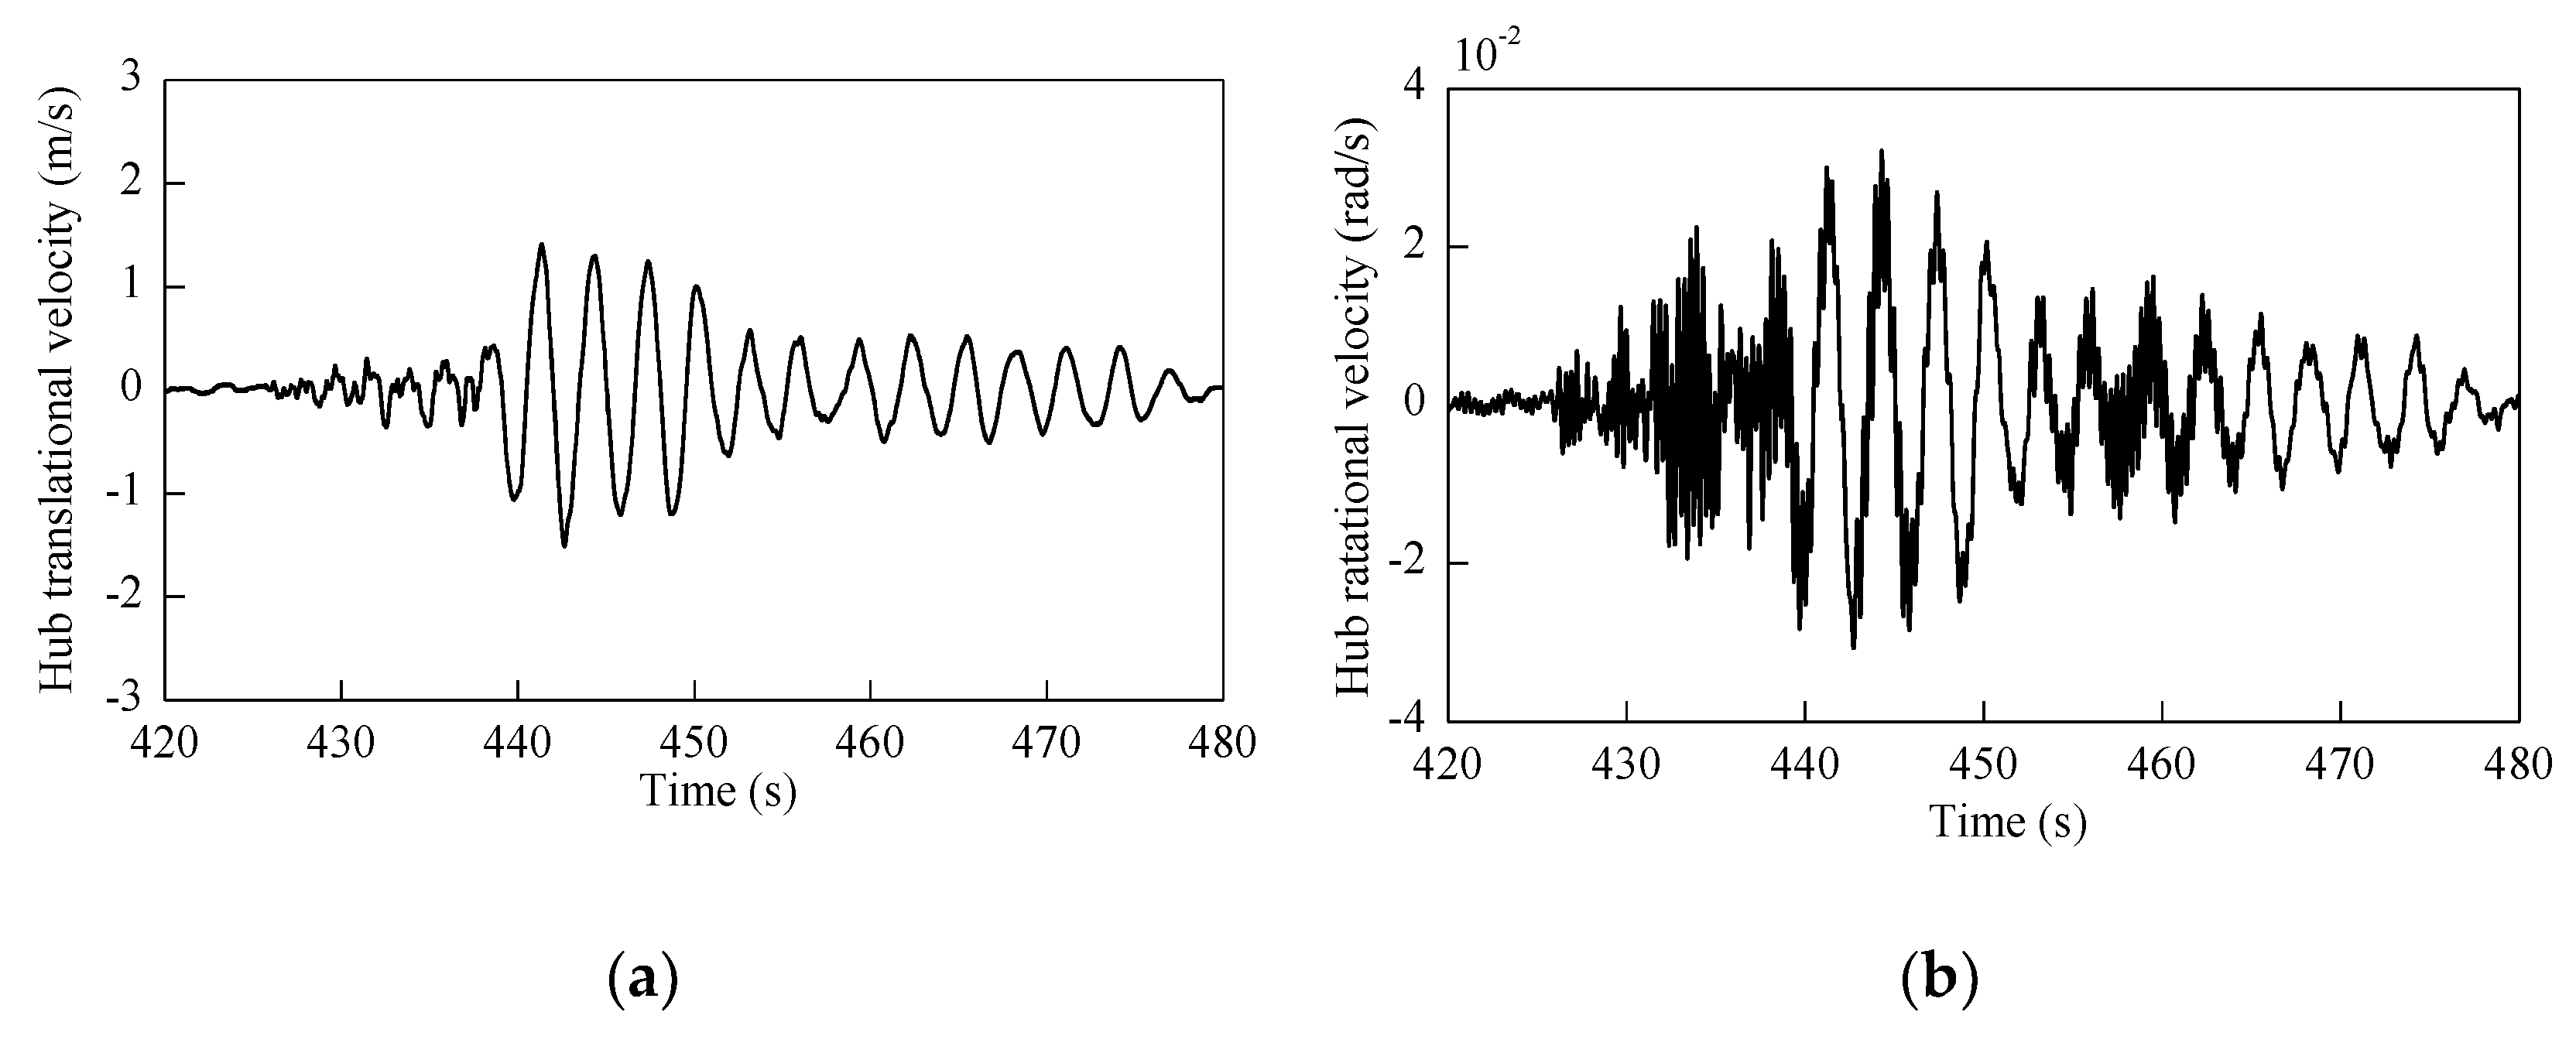
Figure 11.
Nacelle oscillation velocity when the input ground motion is seismic record 4; (a) translational velocity in x-axis, (b) angular velocity in y-axis.
Figure 11.
Nacelle oscillation velocity when the input ground motion is seismic record 4; (a) translational velocity in x-axis, (b) angular velocity in y-axis.
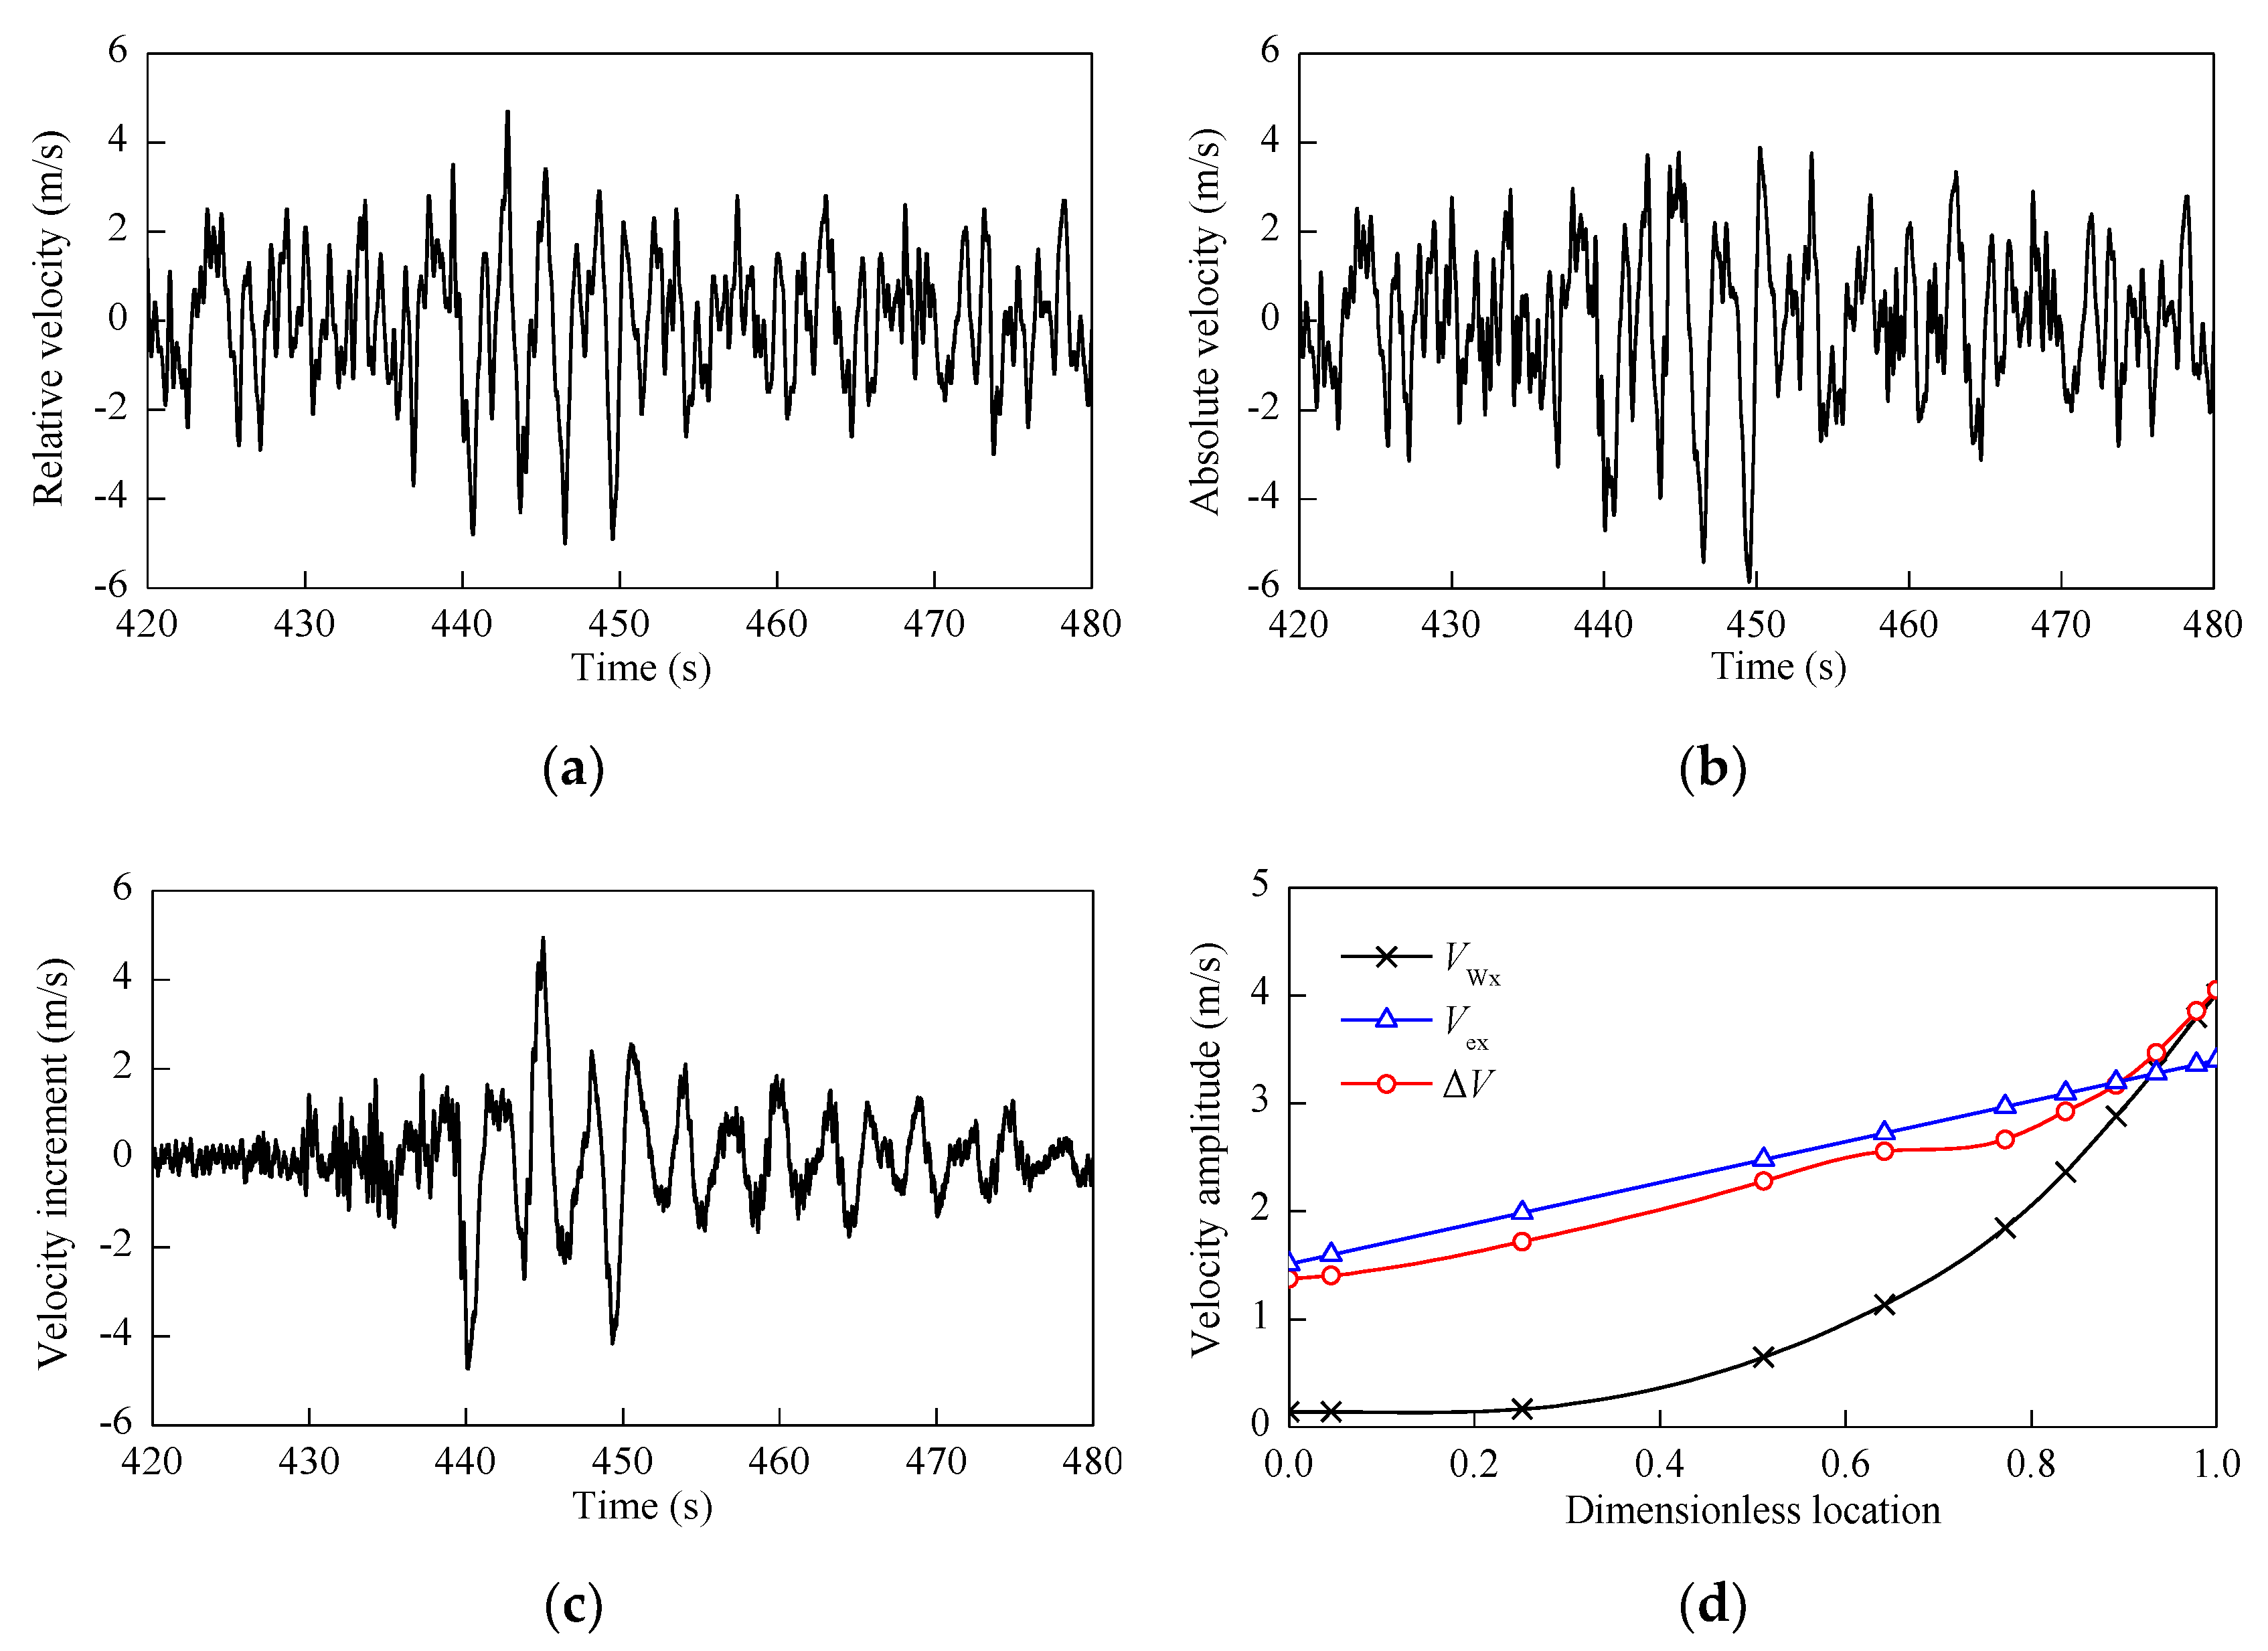
Figure 12.
Oscillation velocity of blade along the x-axis when the input ground motion is seismic record 4; (a) relative velocity of blade tip, (b) absolute velocity of blade tip, (c) velocity increment of blade tip, (d) velocity amplitude along the blade.
Figure 12.
Oscillation velocity of blade along the x-axis when the input ground motion is seismic record 4; (a) relative velocity of blade tip, (b) absolute velocity of blade tip, (c) velocity increment of blade tip, (d) velocity amplitude along the blade.
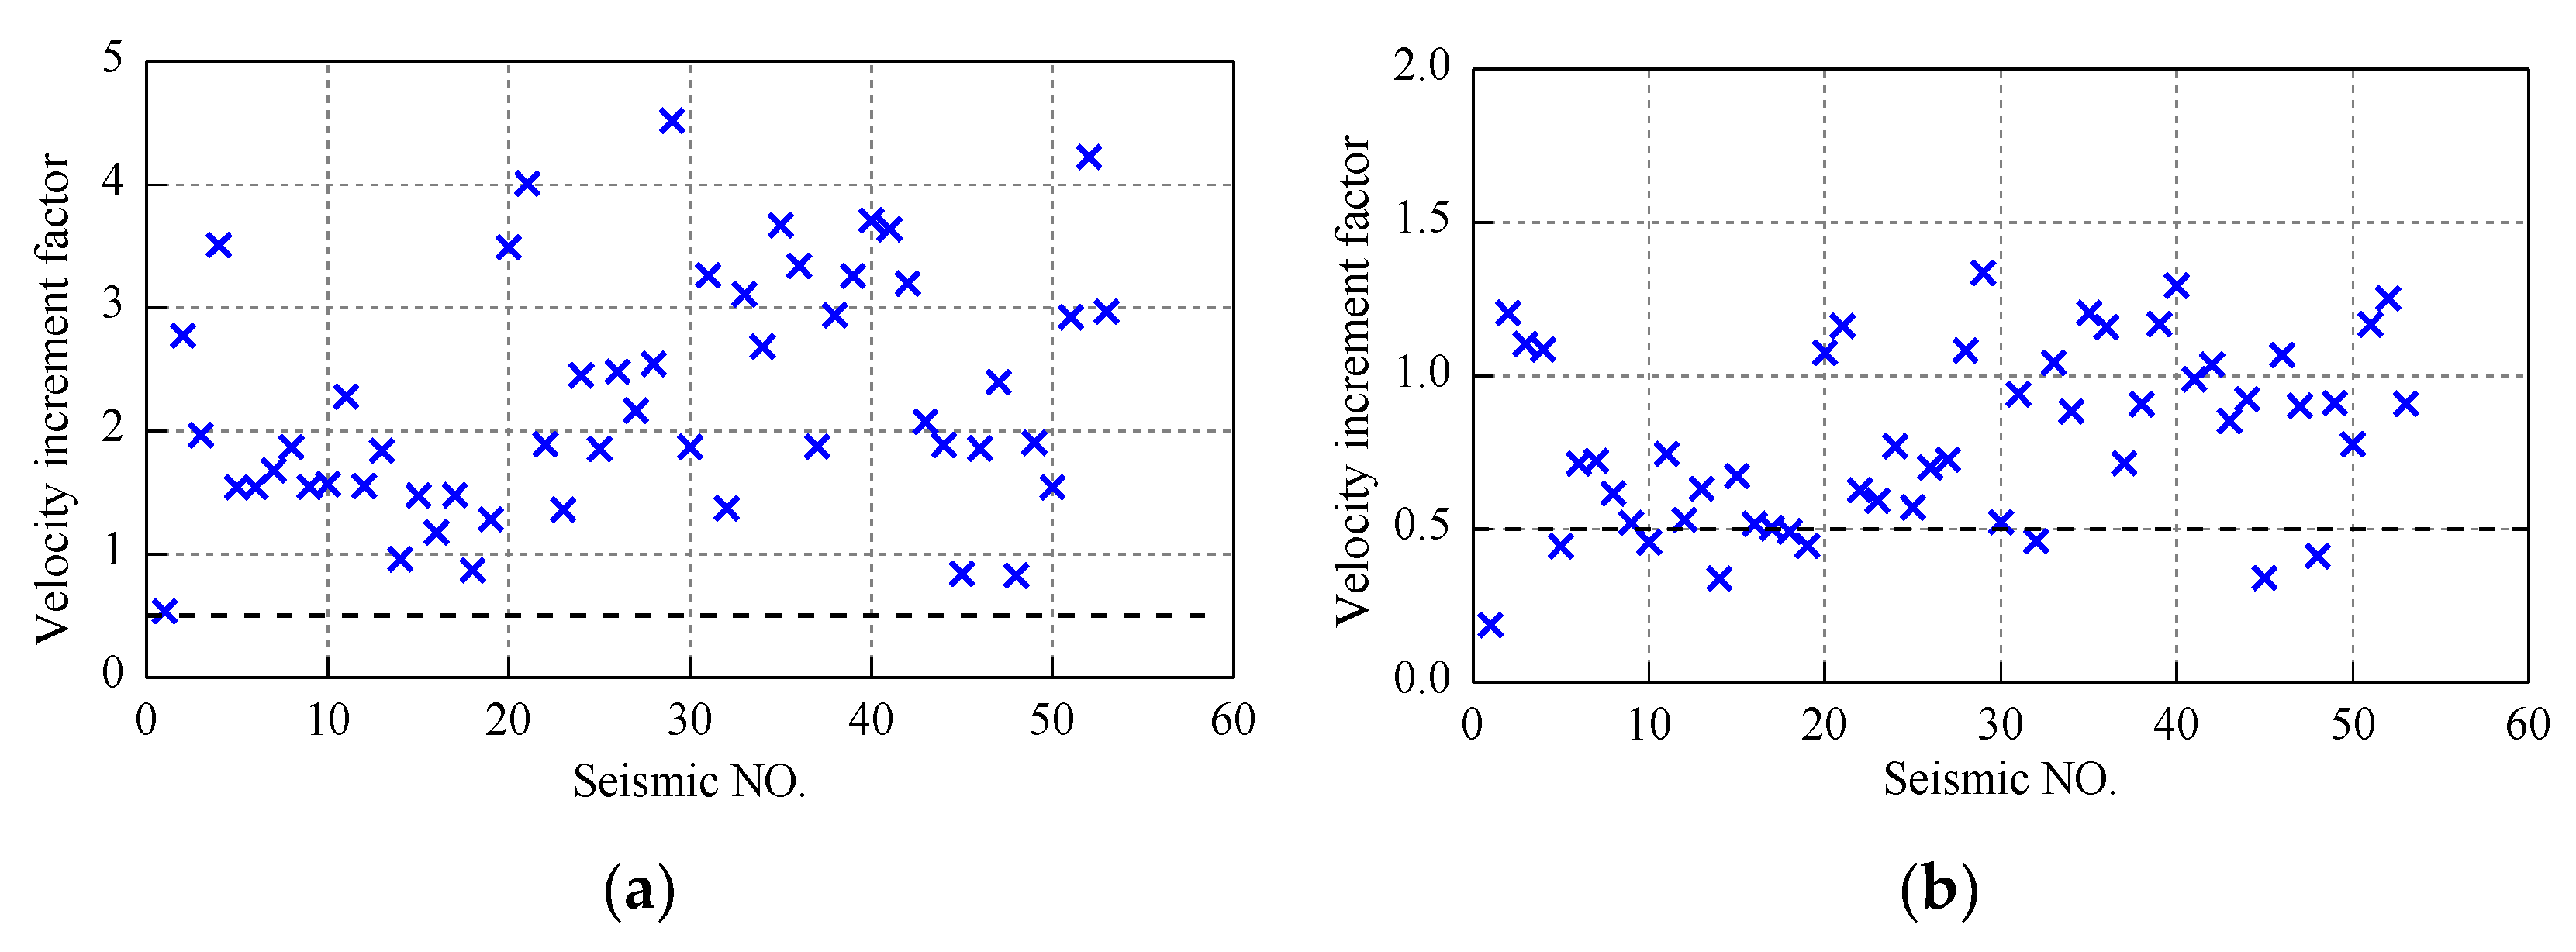
Figure 13.
Velocity increment factor of the blade at different locations; (a) middle of blade, (b) tip of blade.
Figure 13.
Velocity increment factor of the blade at different locations; (a) middle of blade, (b) tip of blade.
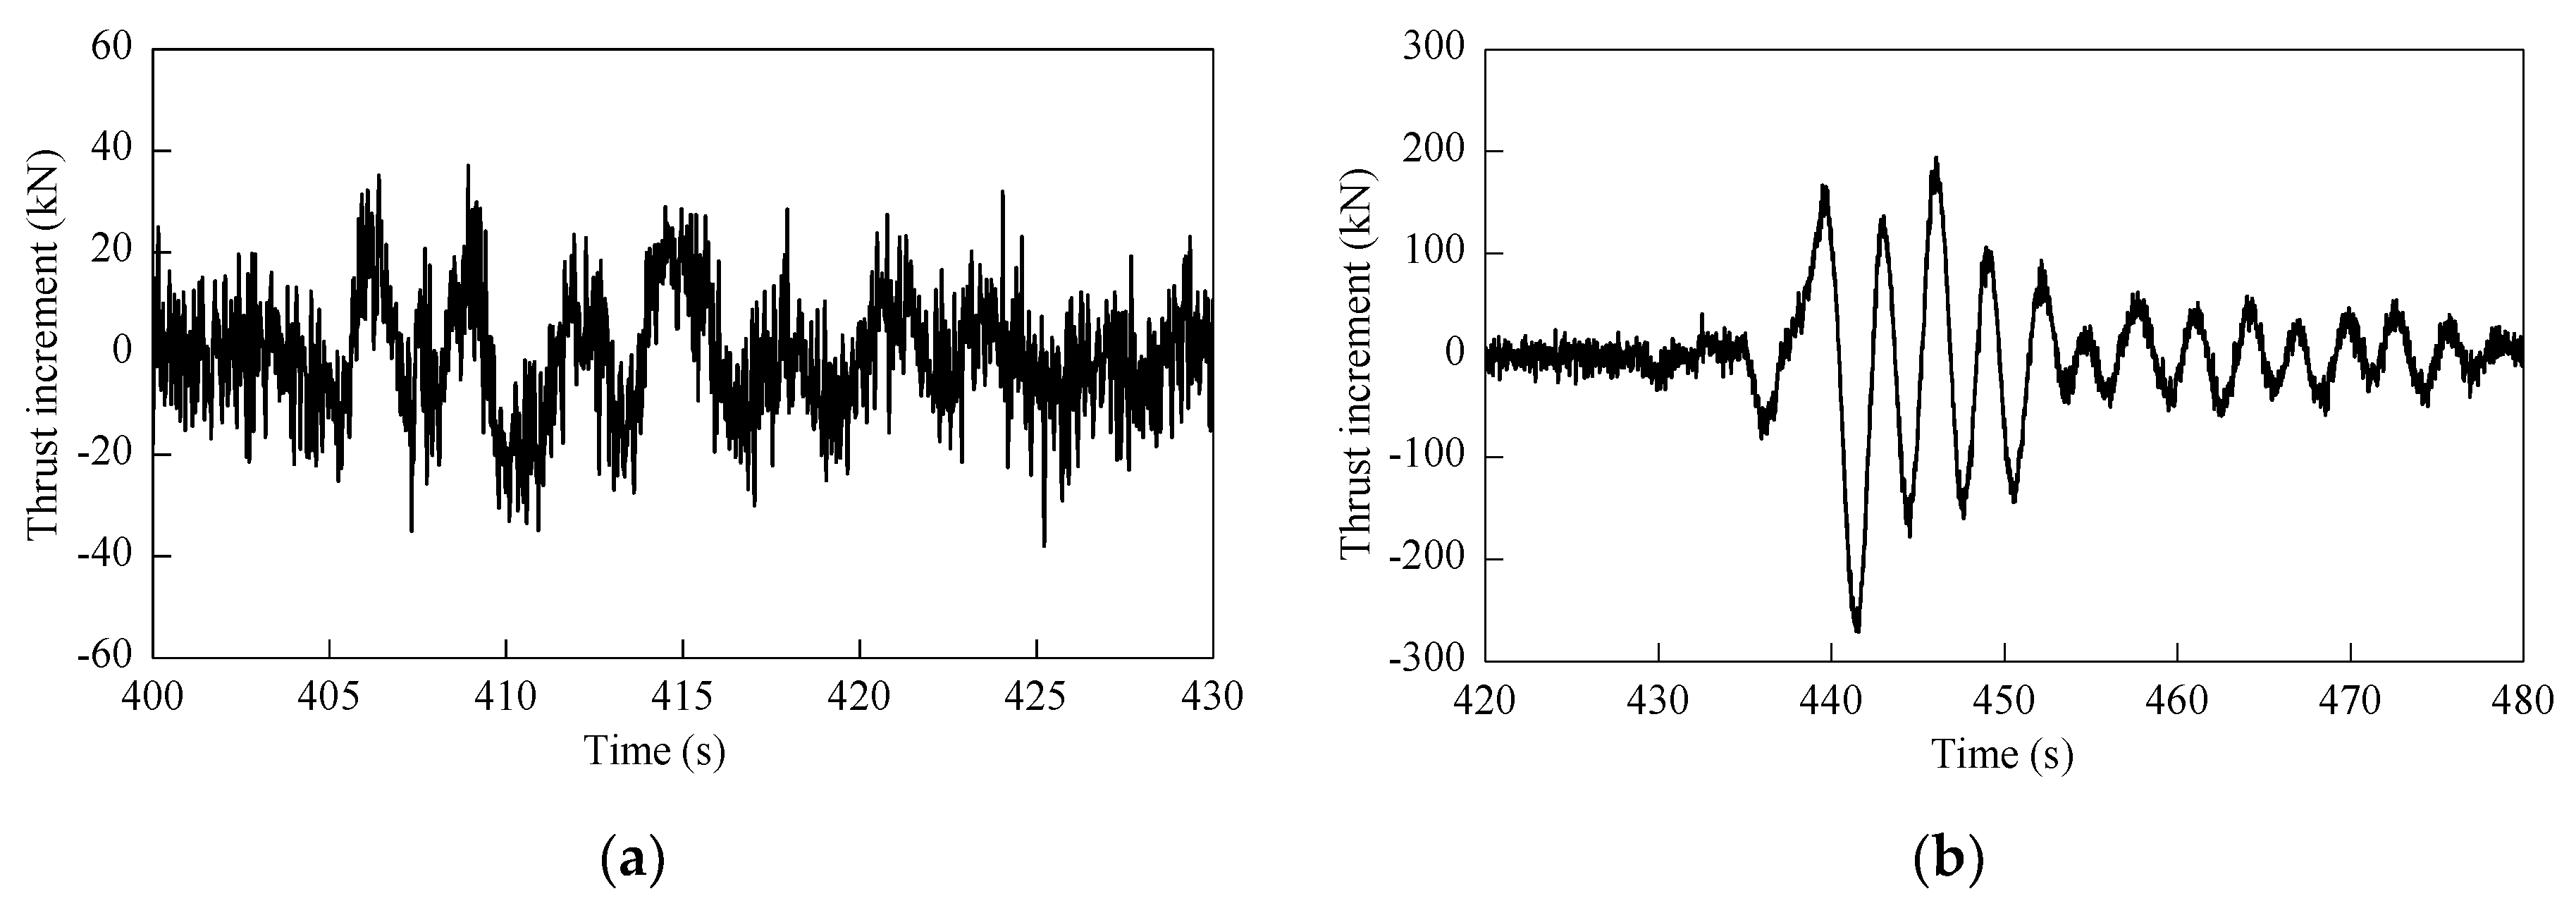
Figure 14.
Thrust variation on the rotor induced by (a) Seismic record 3 and (b) Seismic record 4.
Figure 14.
Thrust variation on the rotor induced by (a) Seismic record 3 and (b) Seismic record 4.
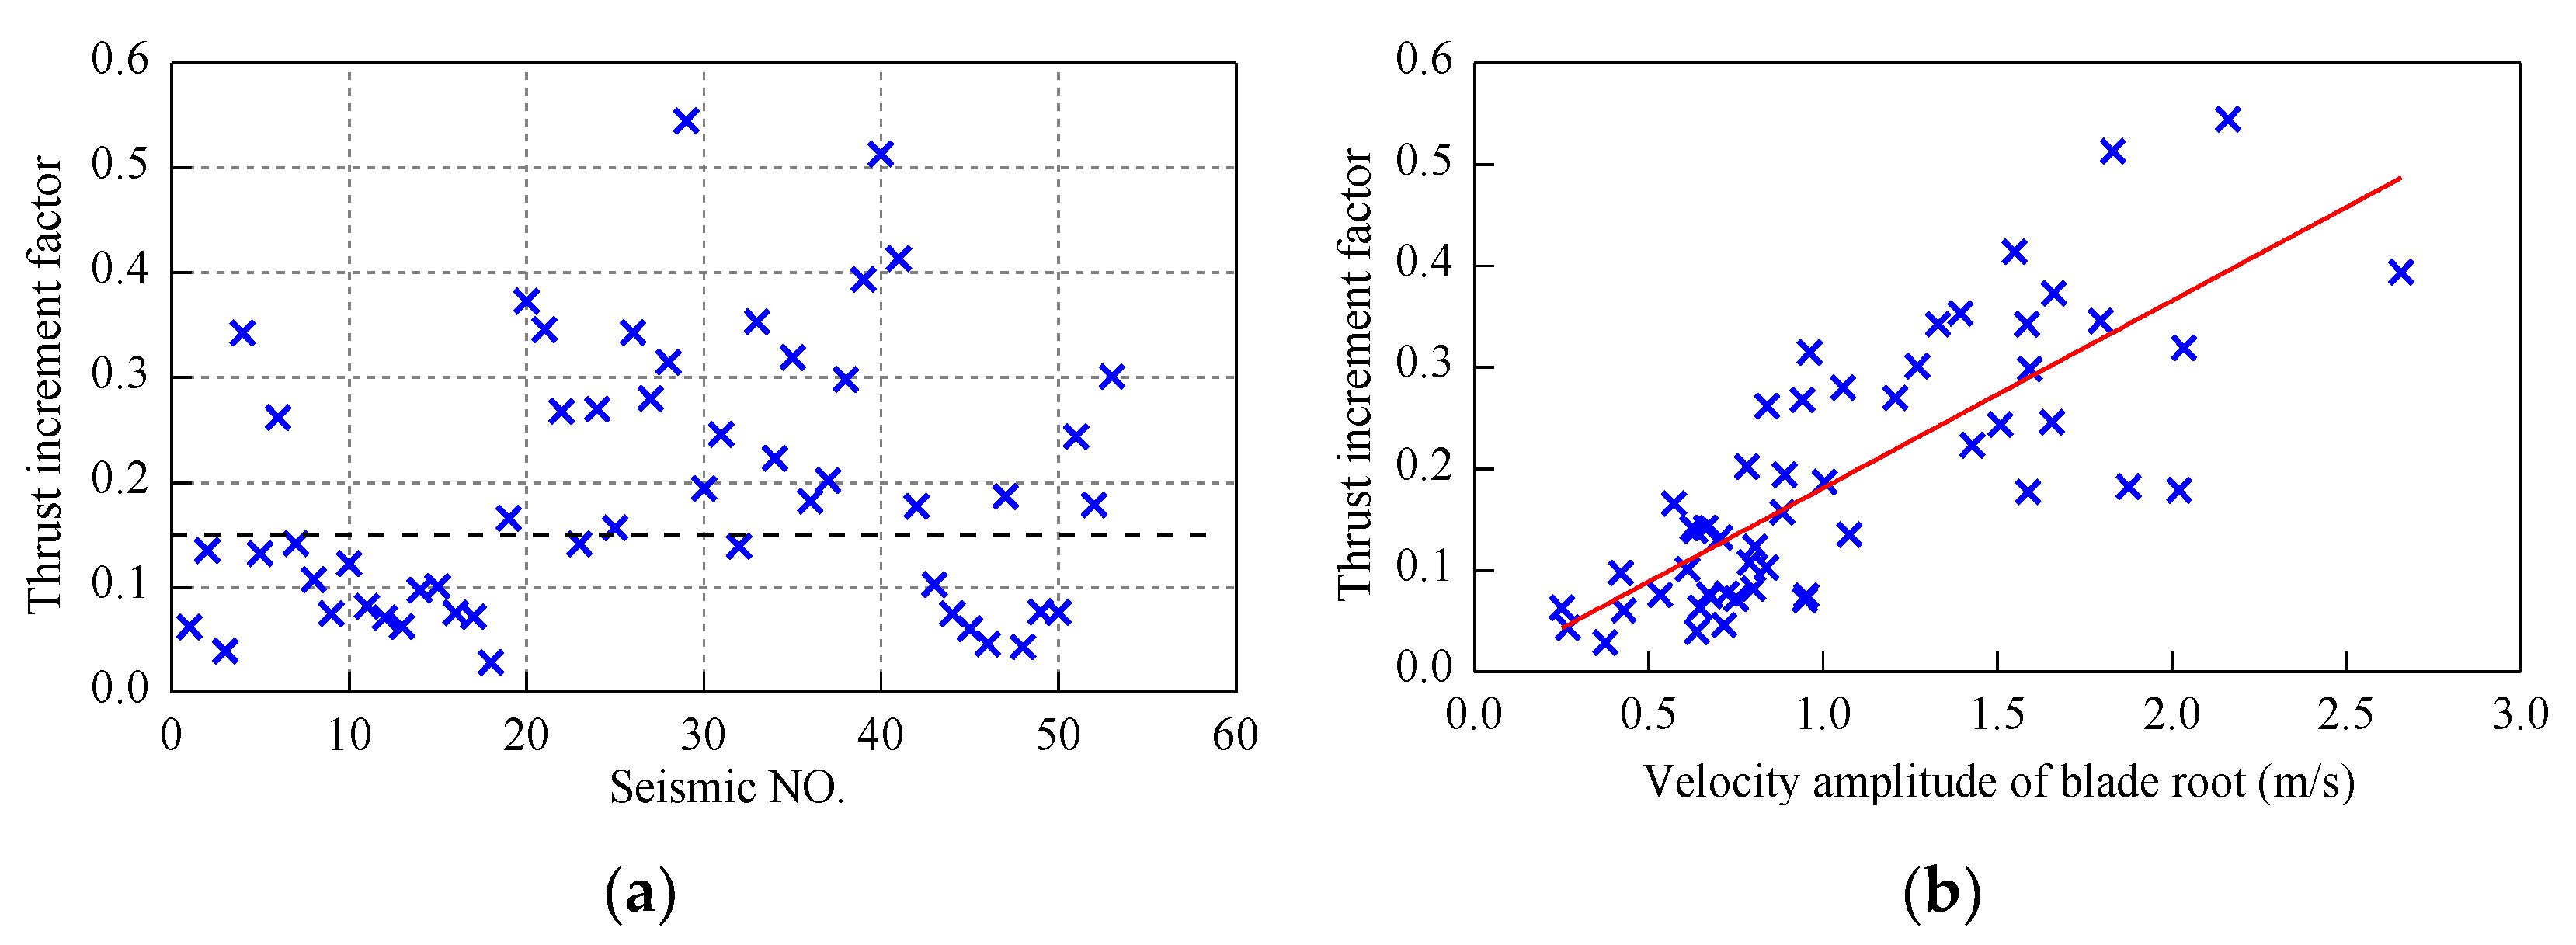
Figure 15.
Factor of thrust variation caused by different earthquakes; (a) thrust variation factor, (b) relation between thrust variation factor and velocity amplitude of blade root.
Figure 15.
Factor of thrust variation caused by different earthquakes; (a) thrust variation factor, (b) relation between thrust variation factor and velocity amplitude of blade root.
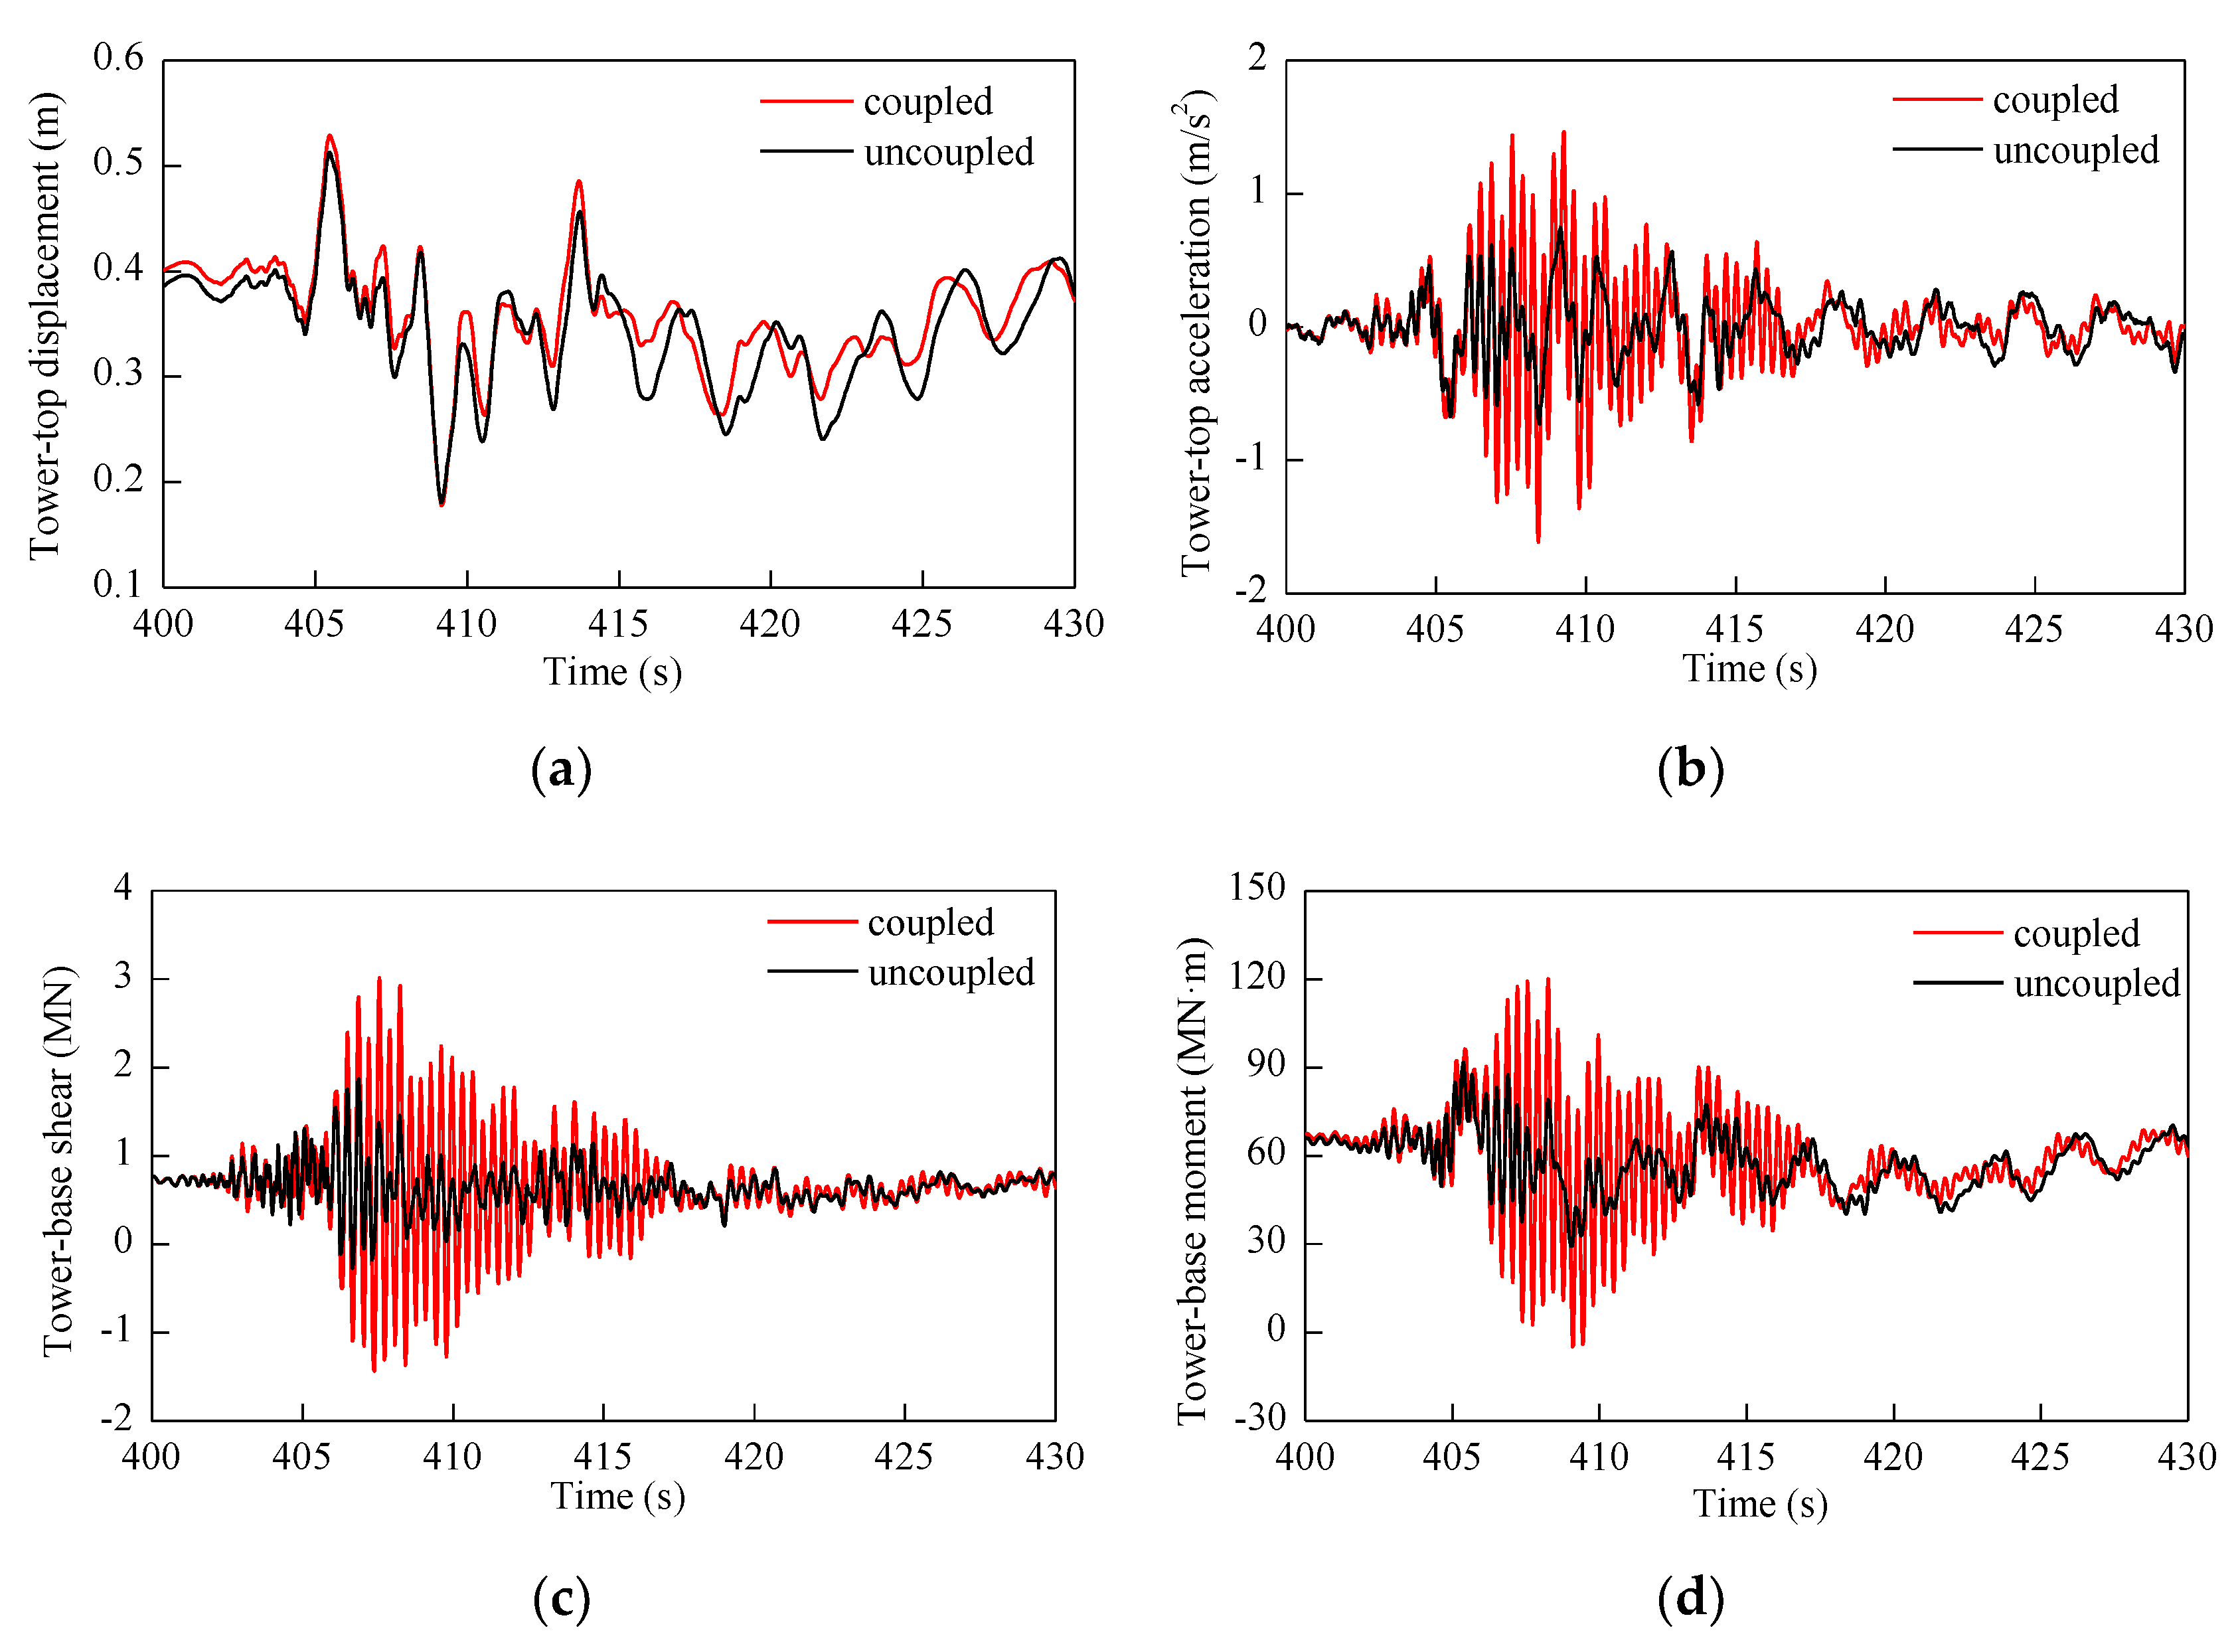
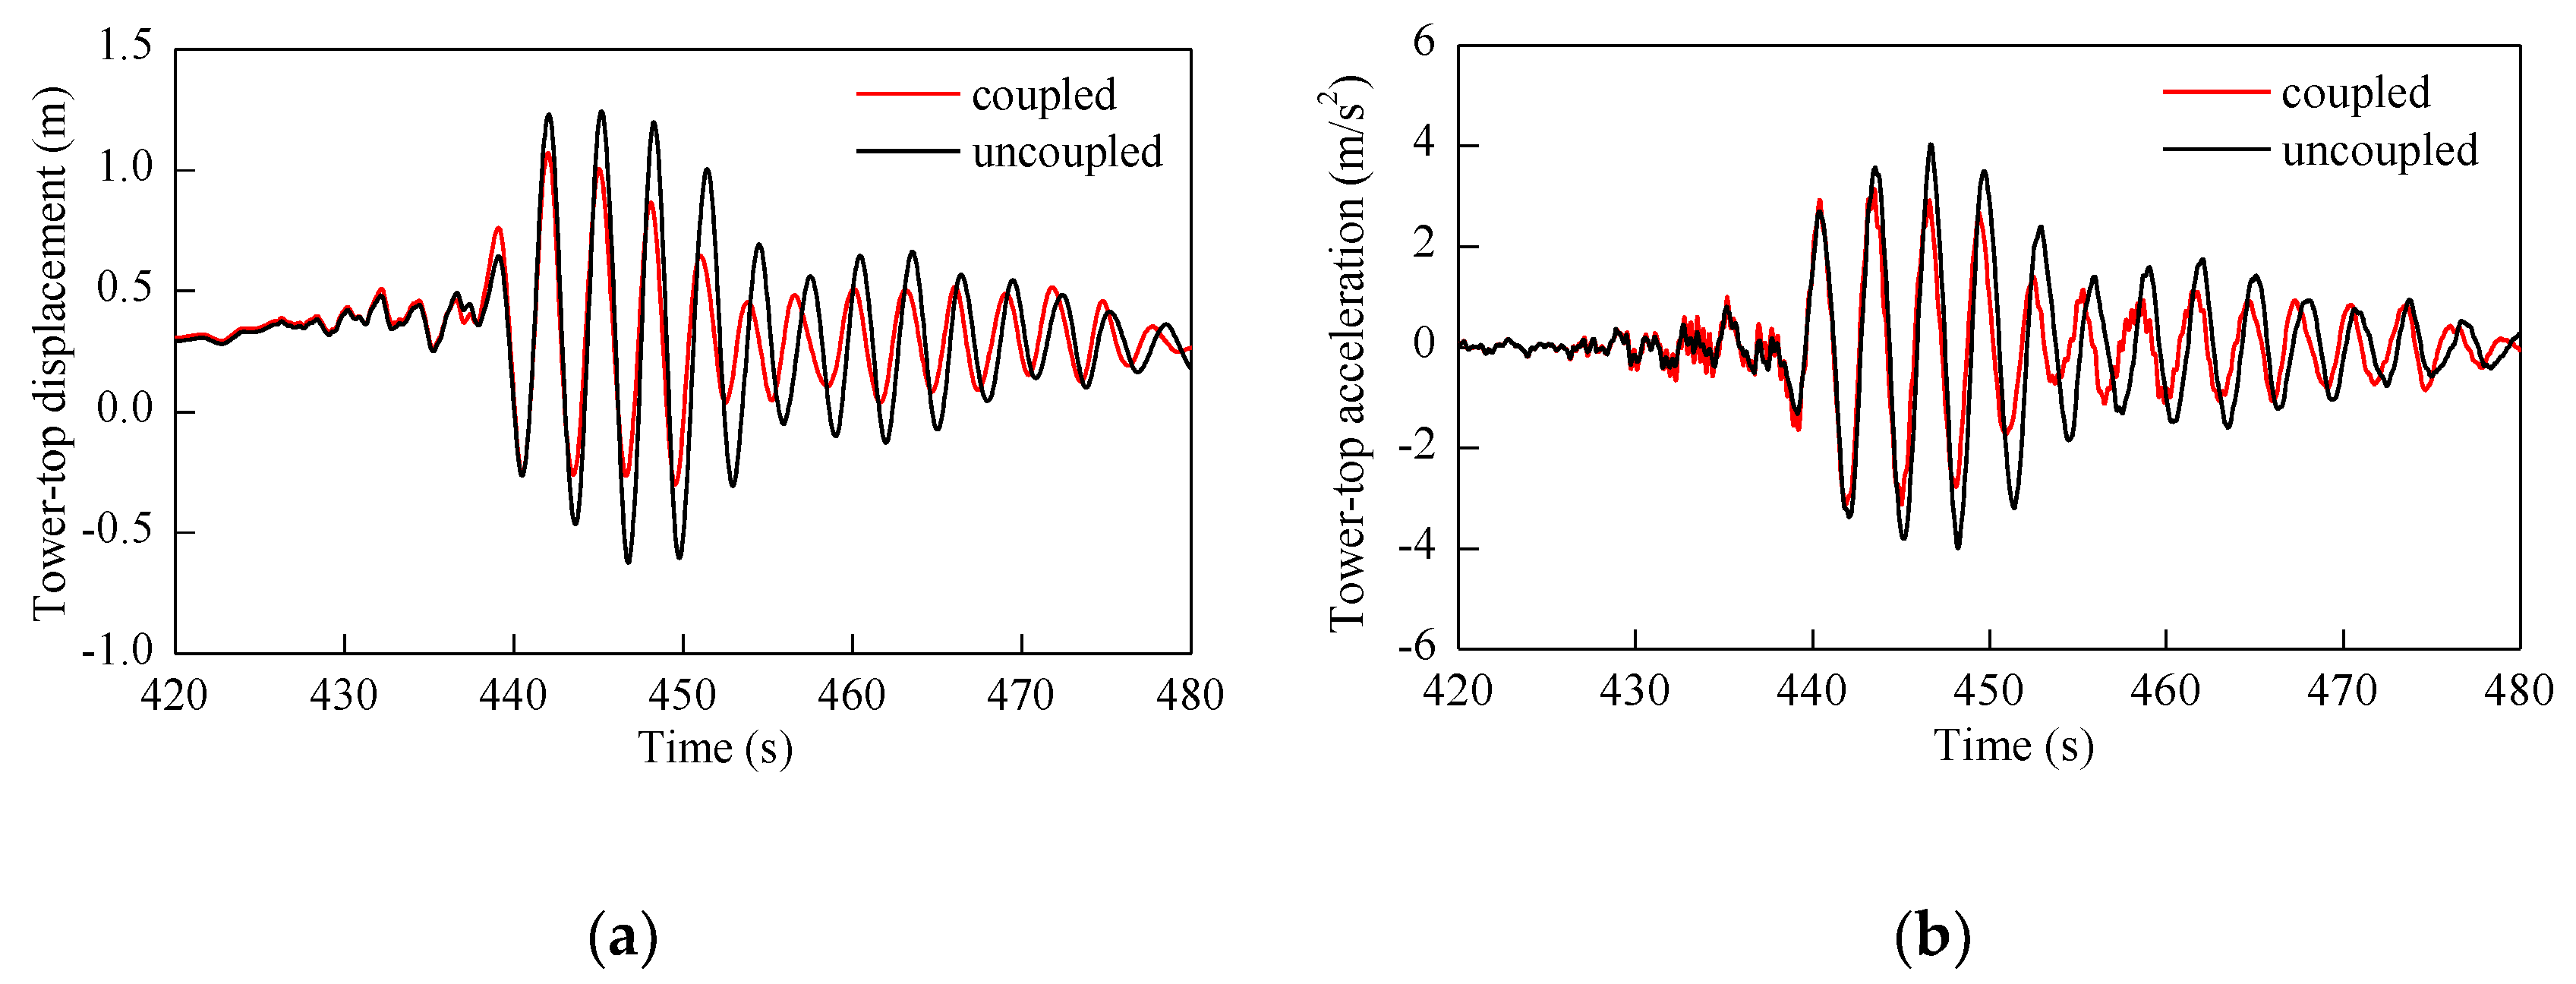
Figure 16.
Seismic response of wind turbine using coupled and uncoupled methods as the earthquake is seismic record 3; (a) tower-top displacement, (b) tower-top acceleration, (c) tower-base shear force, (d) tower-base bending moment.
Figure 16.
Seismic response of wind turbine using coupled and uncoupled methods as the earthquake is seismic record 3; (a) tower-top displacement, (b) tower-top acceleration, (c) tower-base shear force, (d) tower-base bending moment.
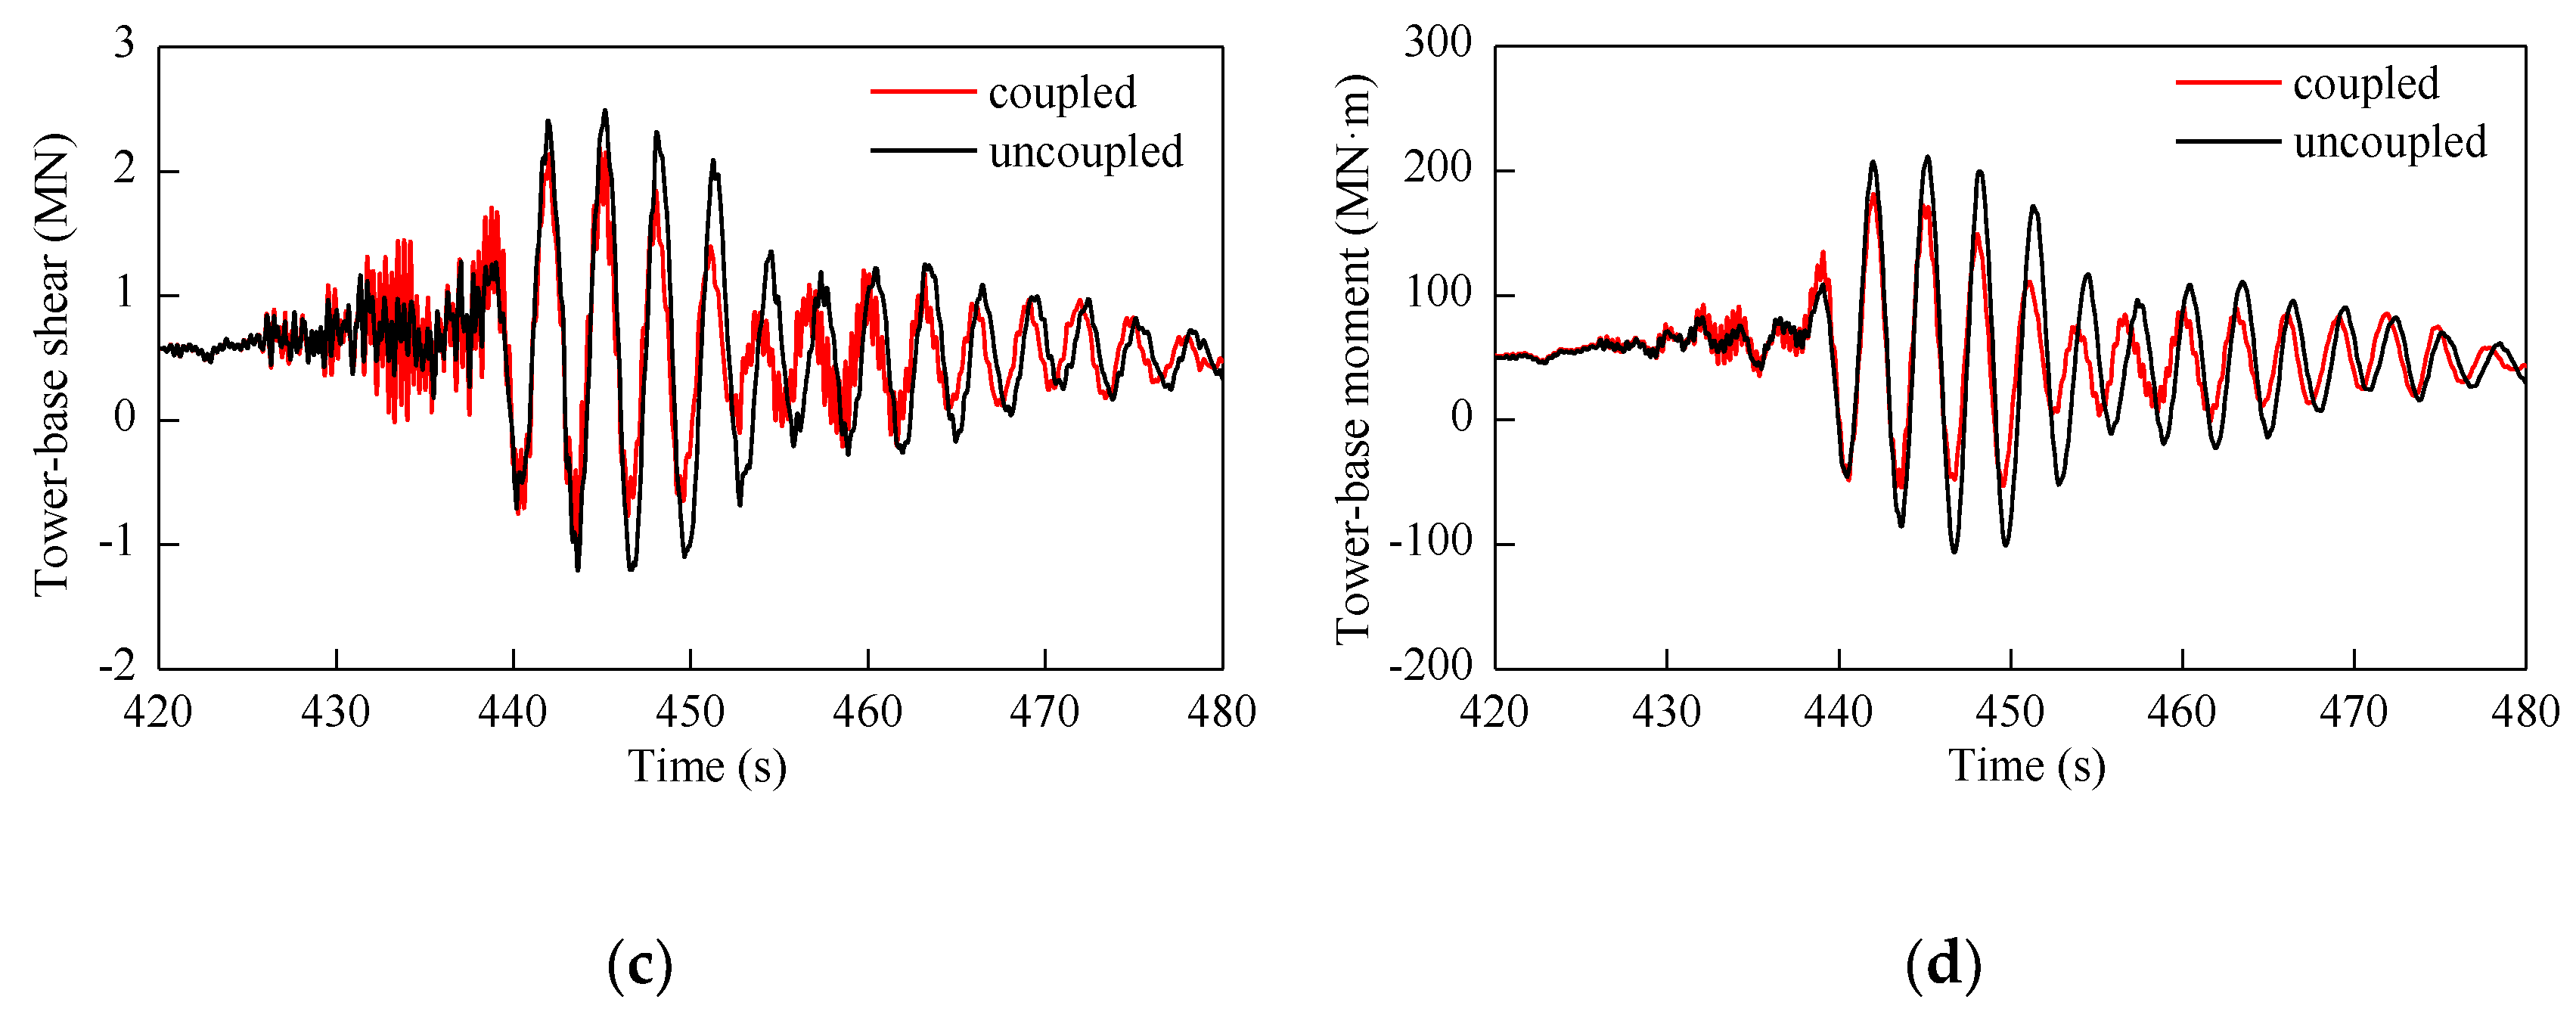
Figure 17.
Seismic response of wind turbine using coupled and uncoupled methods as the earthquake is seismic record 4; (a) tower-top displacement, (b) tower-top acceleration, (c) tower-base shear force, (d) tower-base bending moment.
Figure 17.
Seismic response of wind turbine using coupled and uncoupled methods as the earthquake is seismic record 4; (a) tower-top displacement, (b) tower-top acceleration, (c) tower-base shear force, (d) tower-base bending moment.
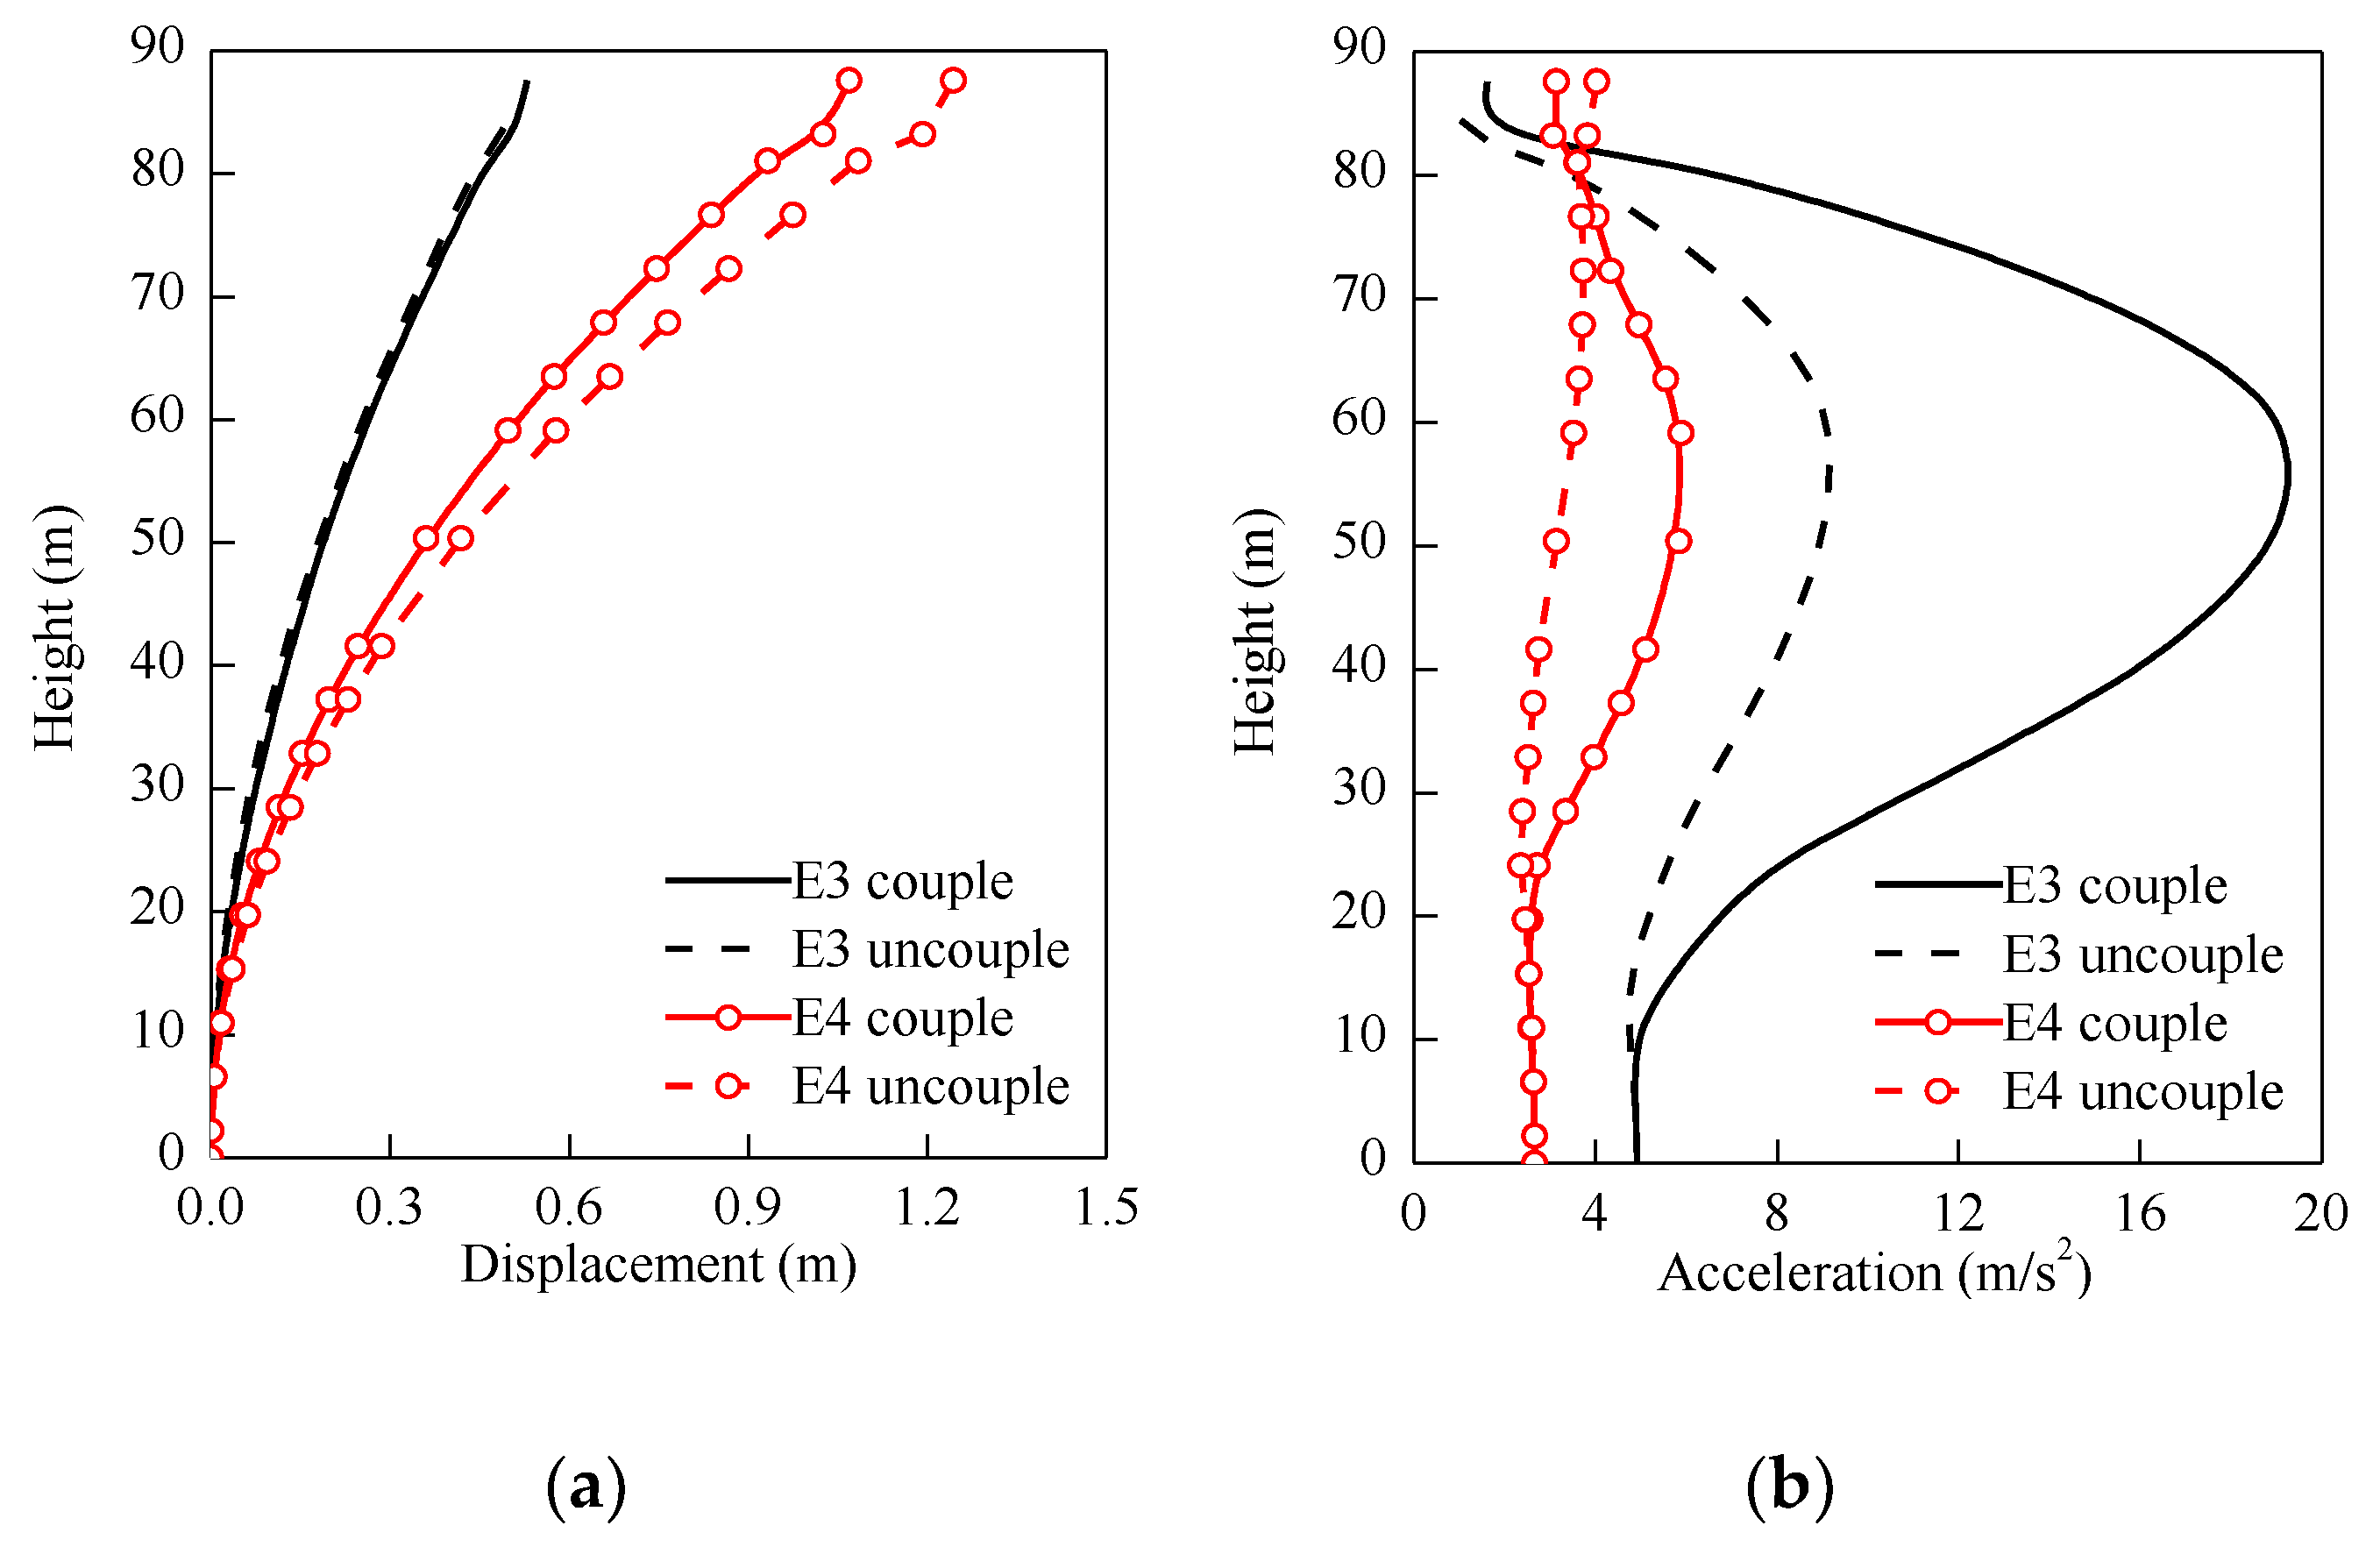
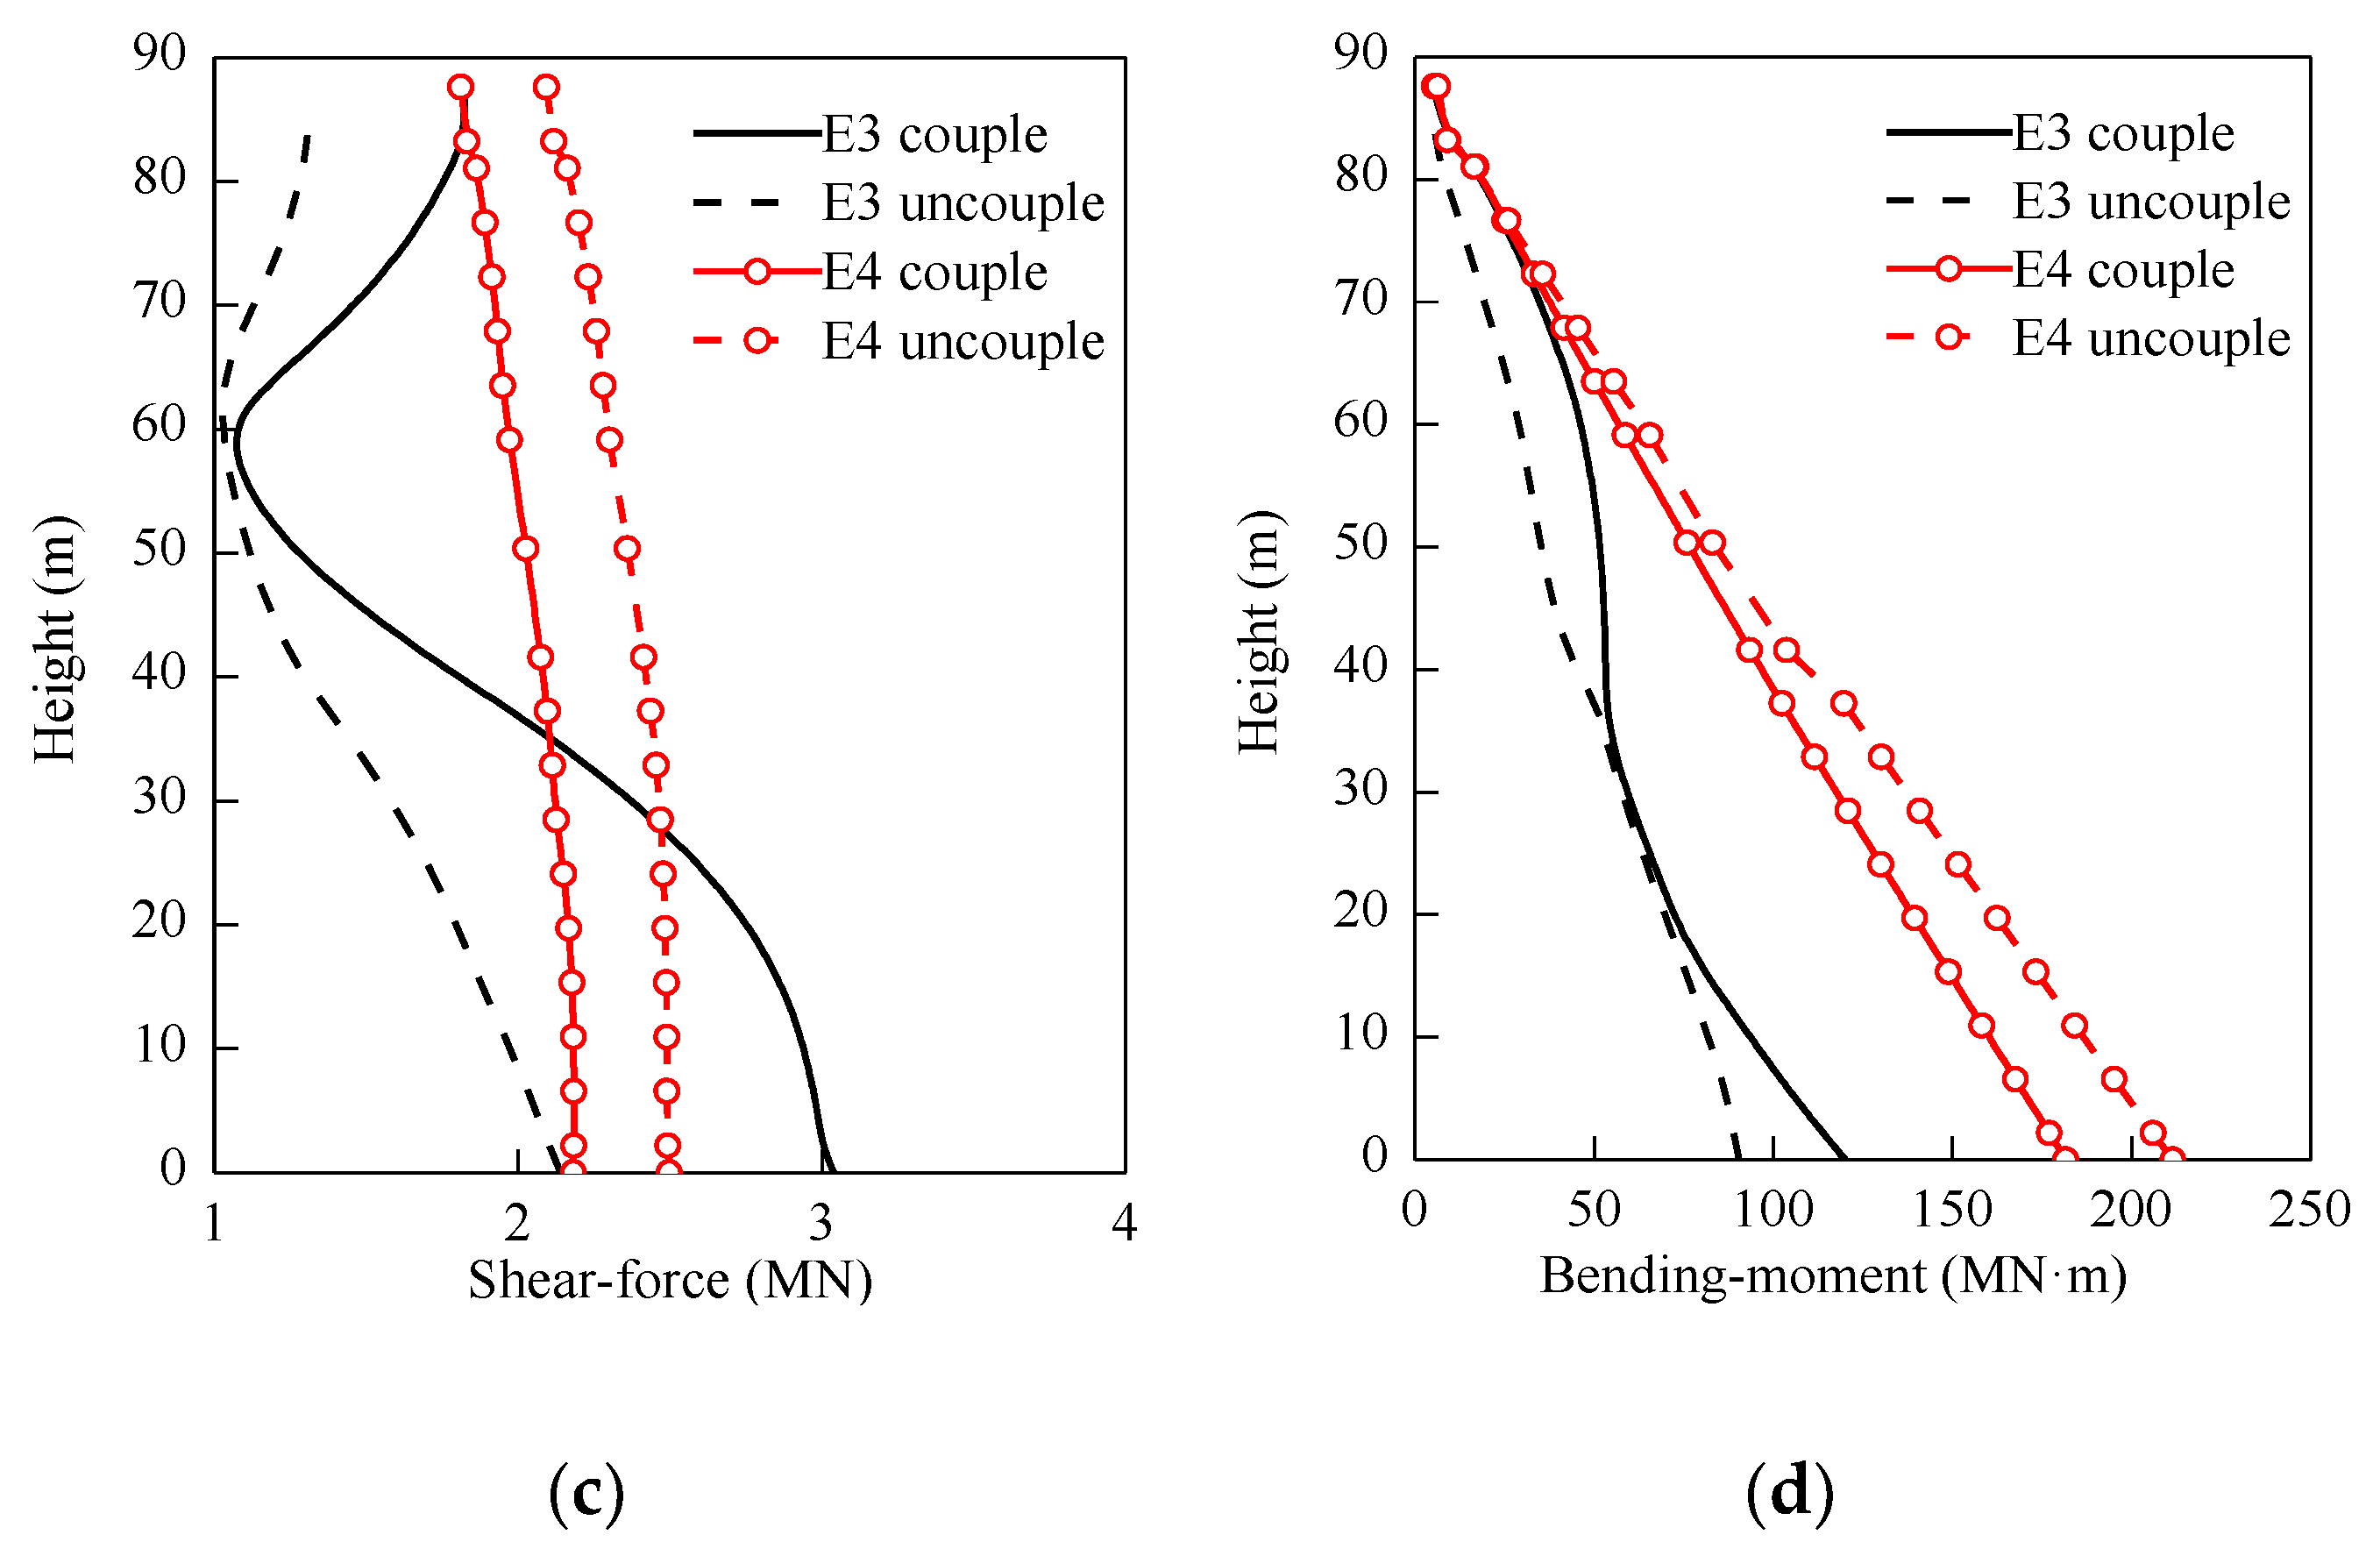
Figure 18.
Seismic response amplitude of the tower for seismic records 3 and 4; (a) relative displacement, (b) absolute acceleration, (c) shear force, (d) bending moment.
Figure 18.
Seismic response amplitude of the tower for seismic records 3 and 4; (a) relative displacement, (b) absolute acceleration, (c) shear force, (d) bending moment.
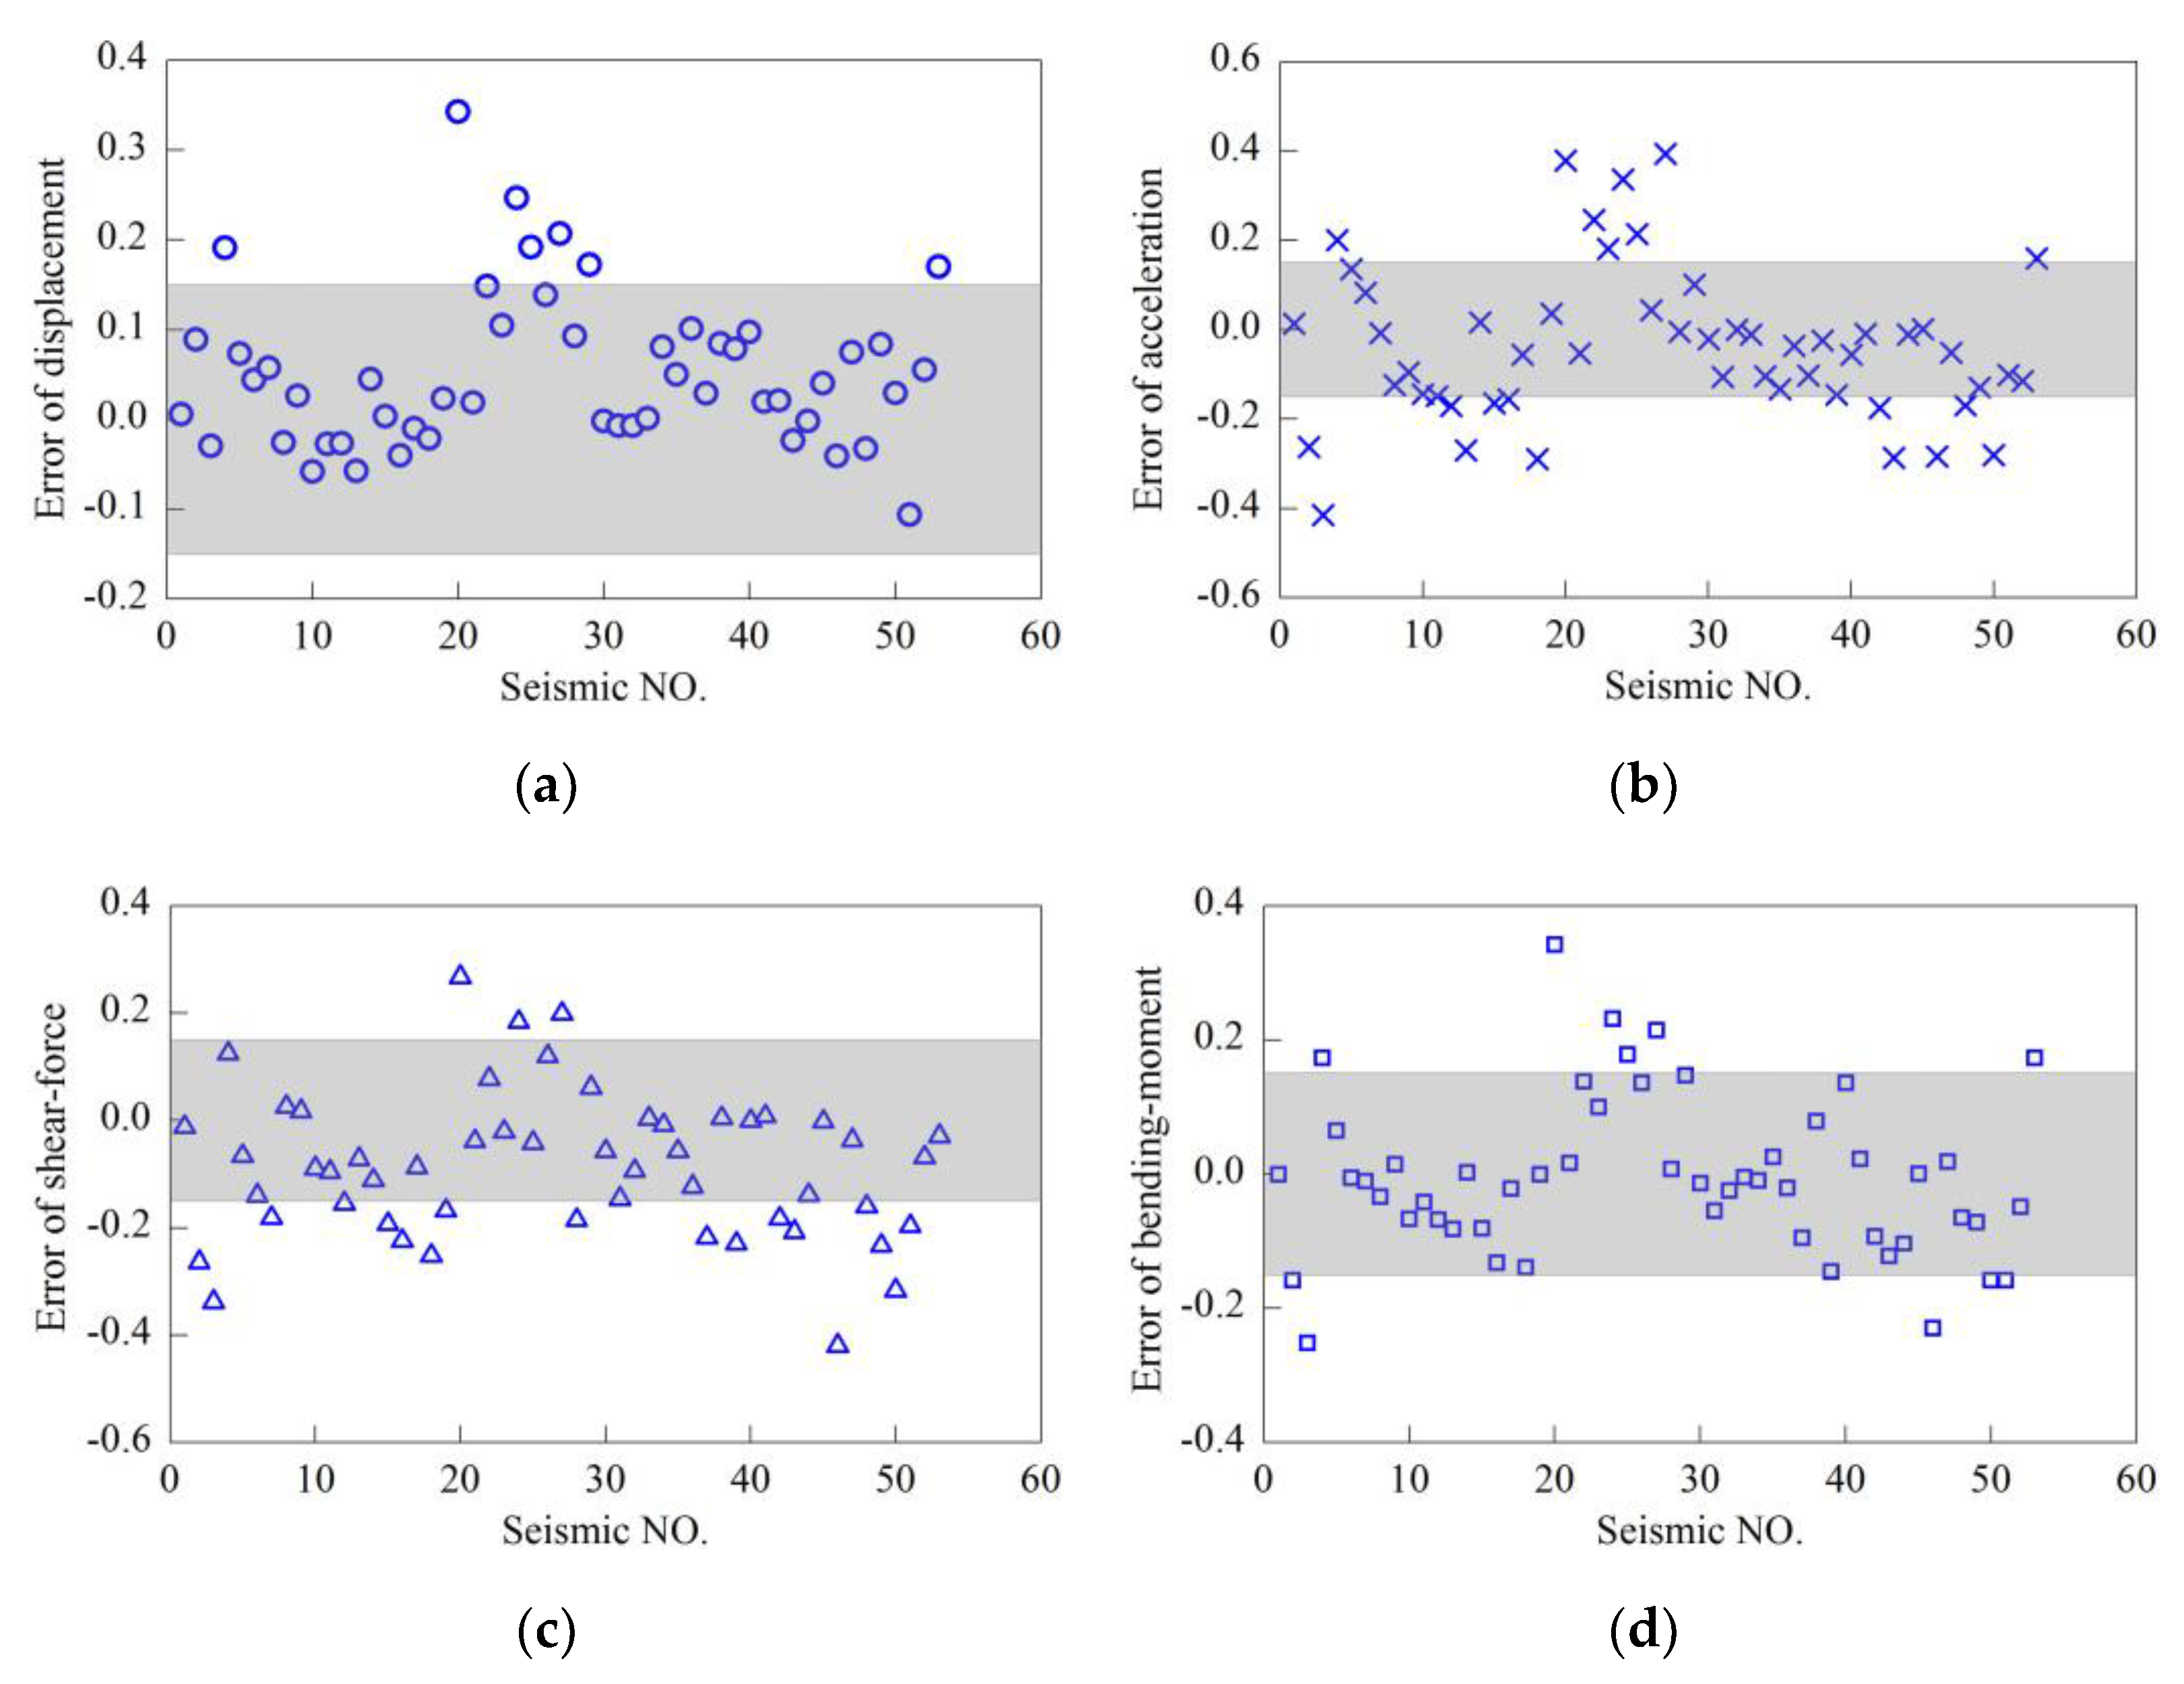
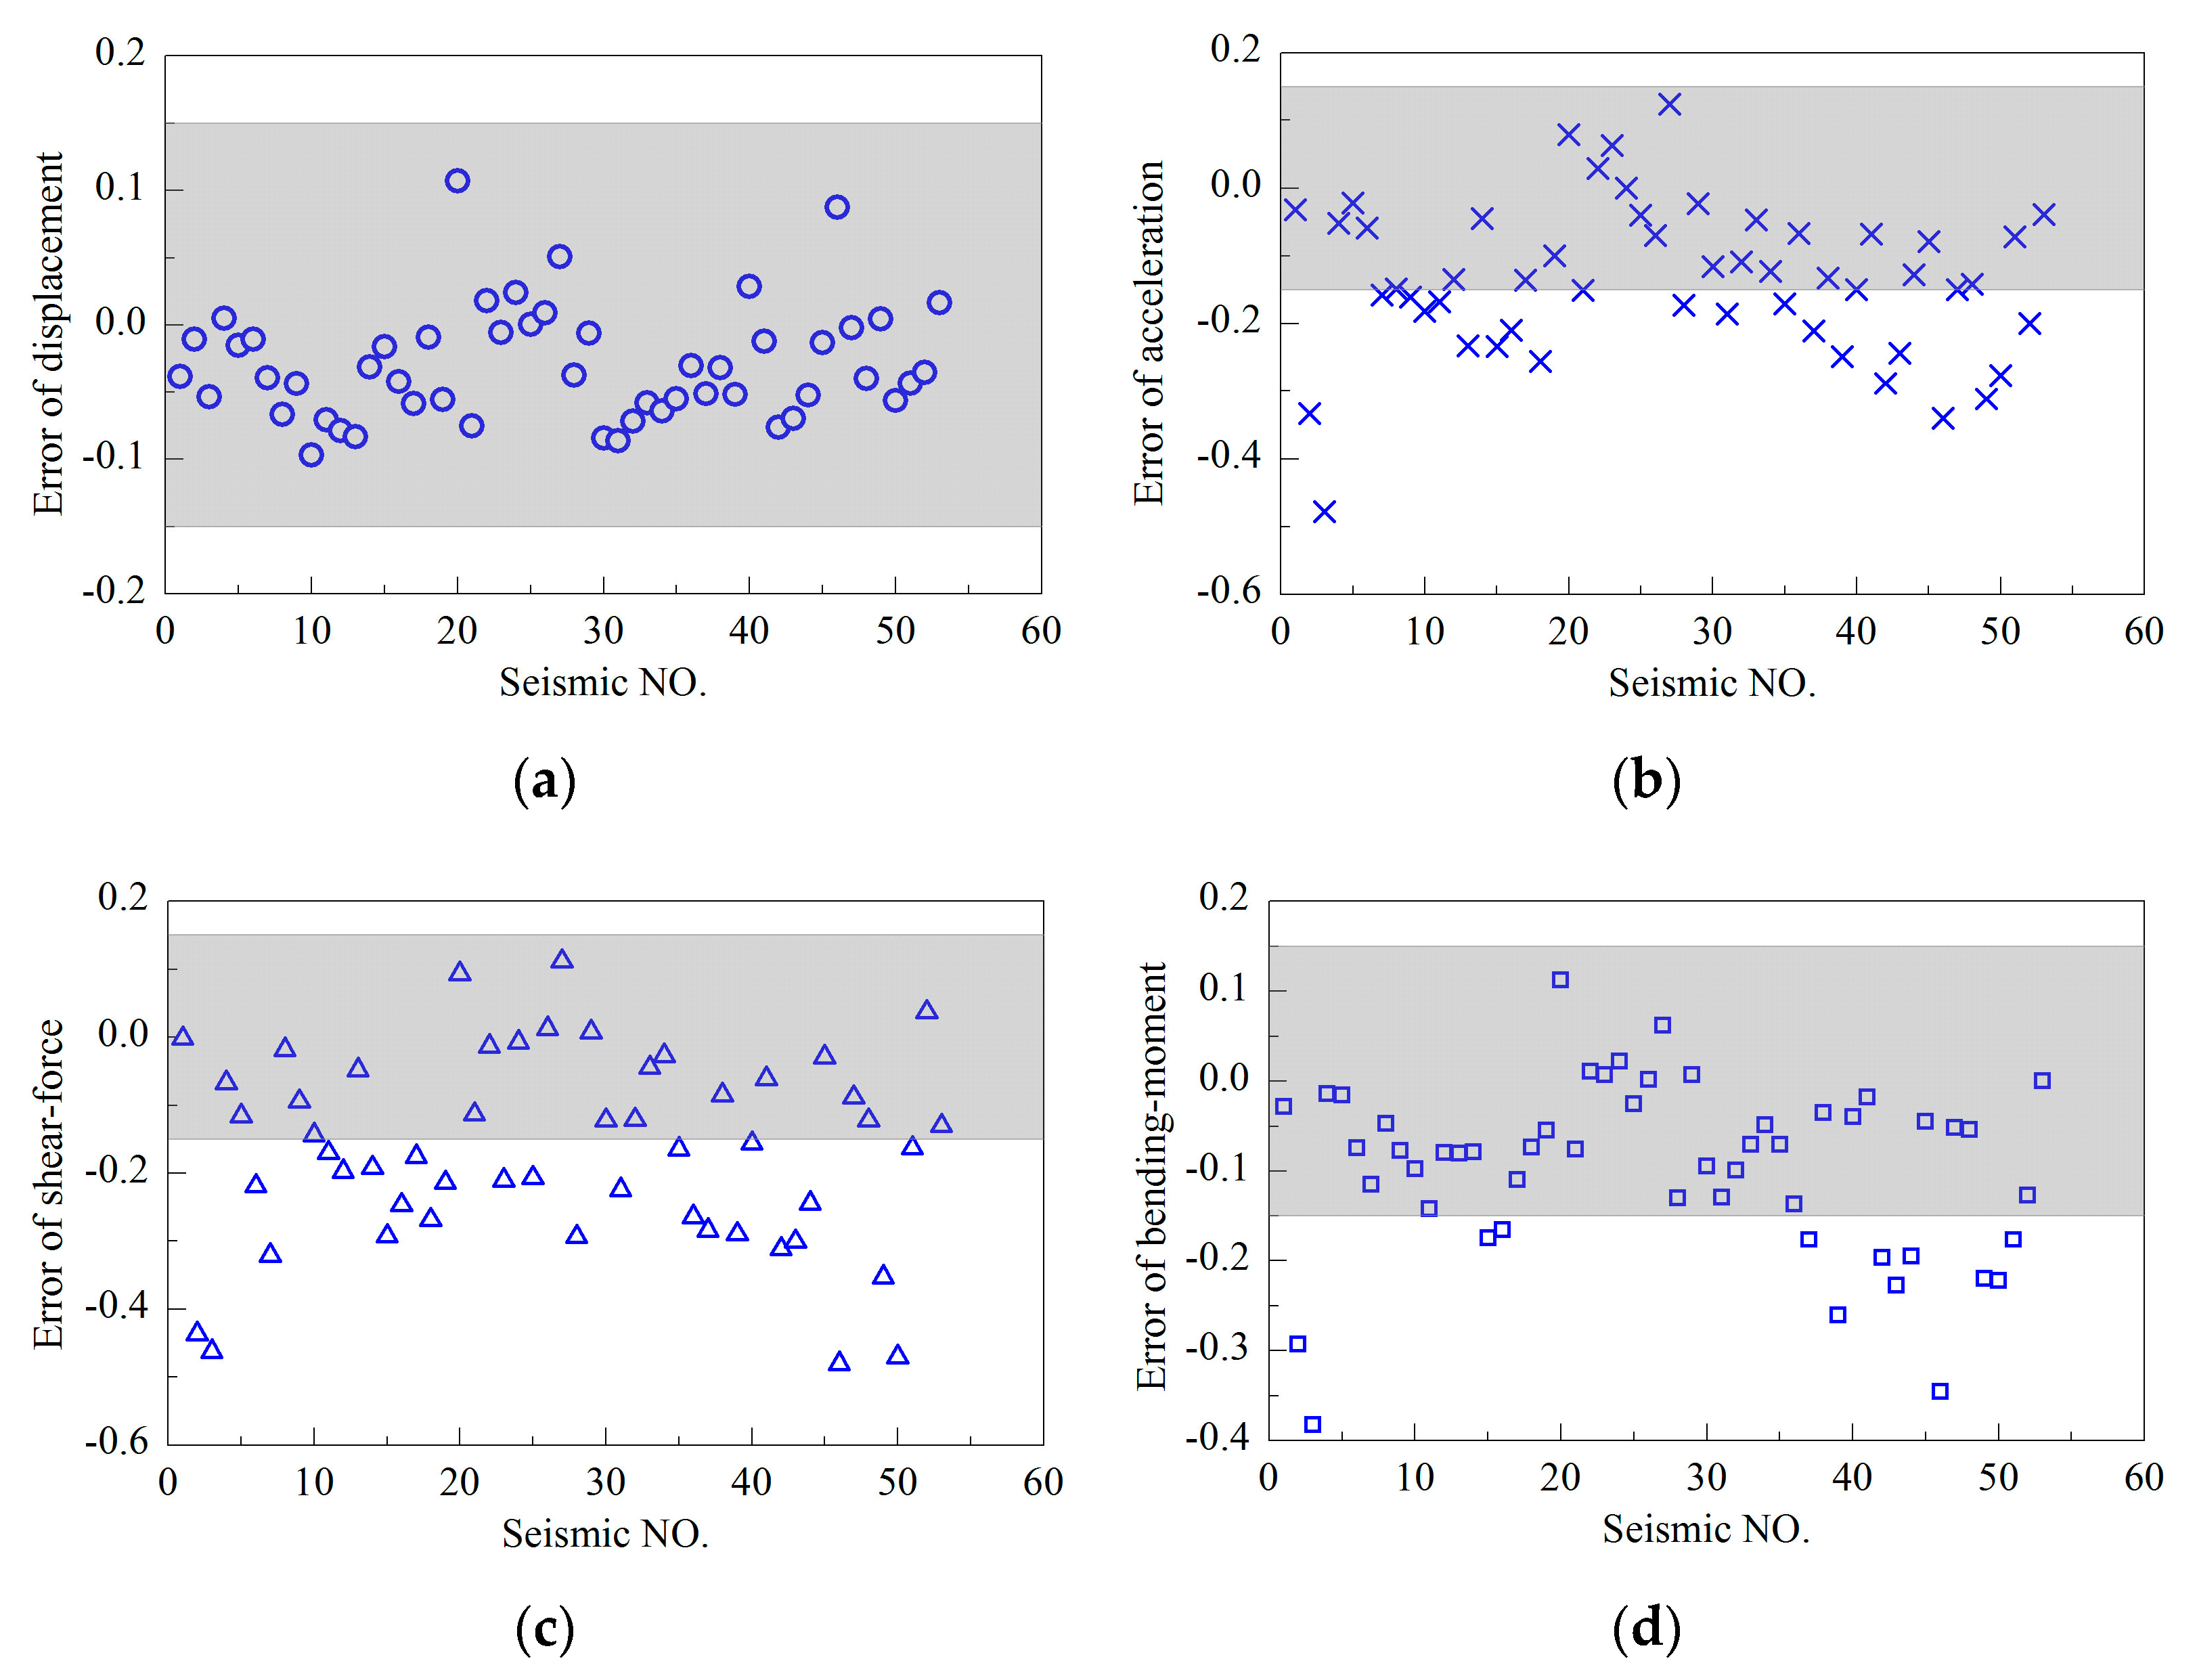
Figure 19.
Relative error between coupled and uncoupled analysis as aerodynamic damping ratio is 4% and mean wind speed at hub height equals 11.4 m/s; (a) tower-top displacement, (b) tower-top acceleration, (c) tower-base shear force, (d) tower-base bending moment.
Figure 19.
Relative error between coupled and uncoupled analysis as aerodynamic damping ratio is 4% and mean wind speed at hub height equals 11.4 m/s; (a) tower-top displacement, (b) tower-top acceleration, (c) tower-base shear force, (d) tower-base bending moment.
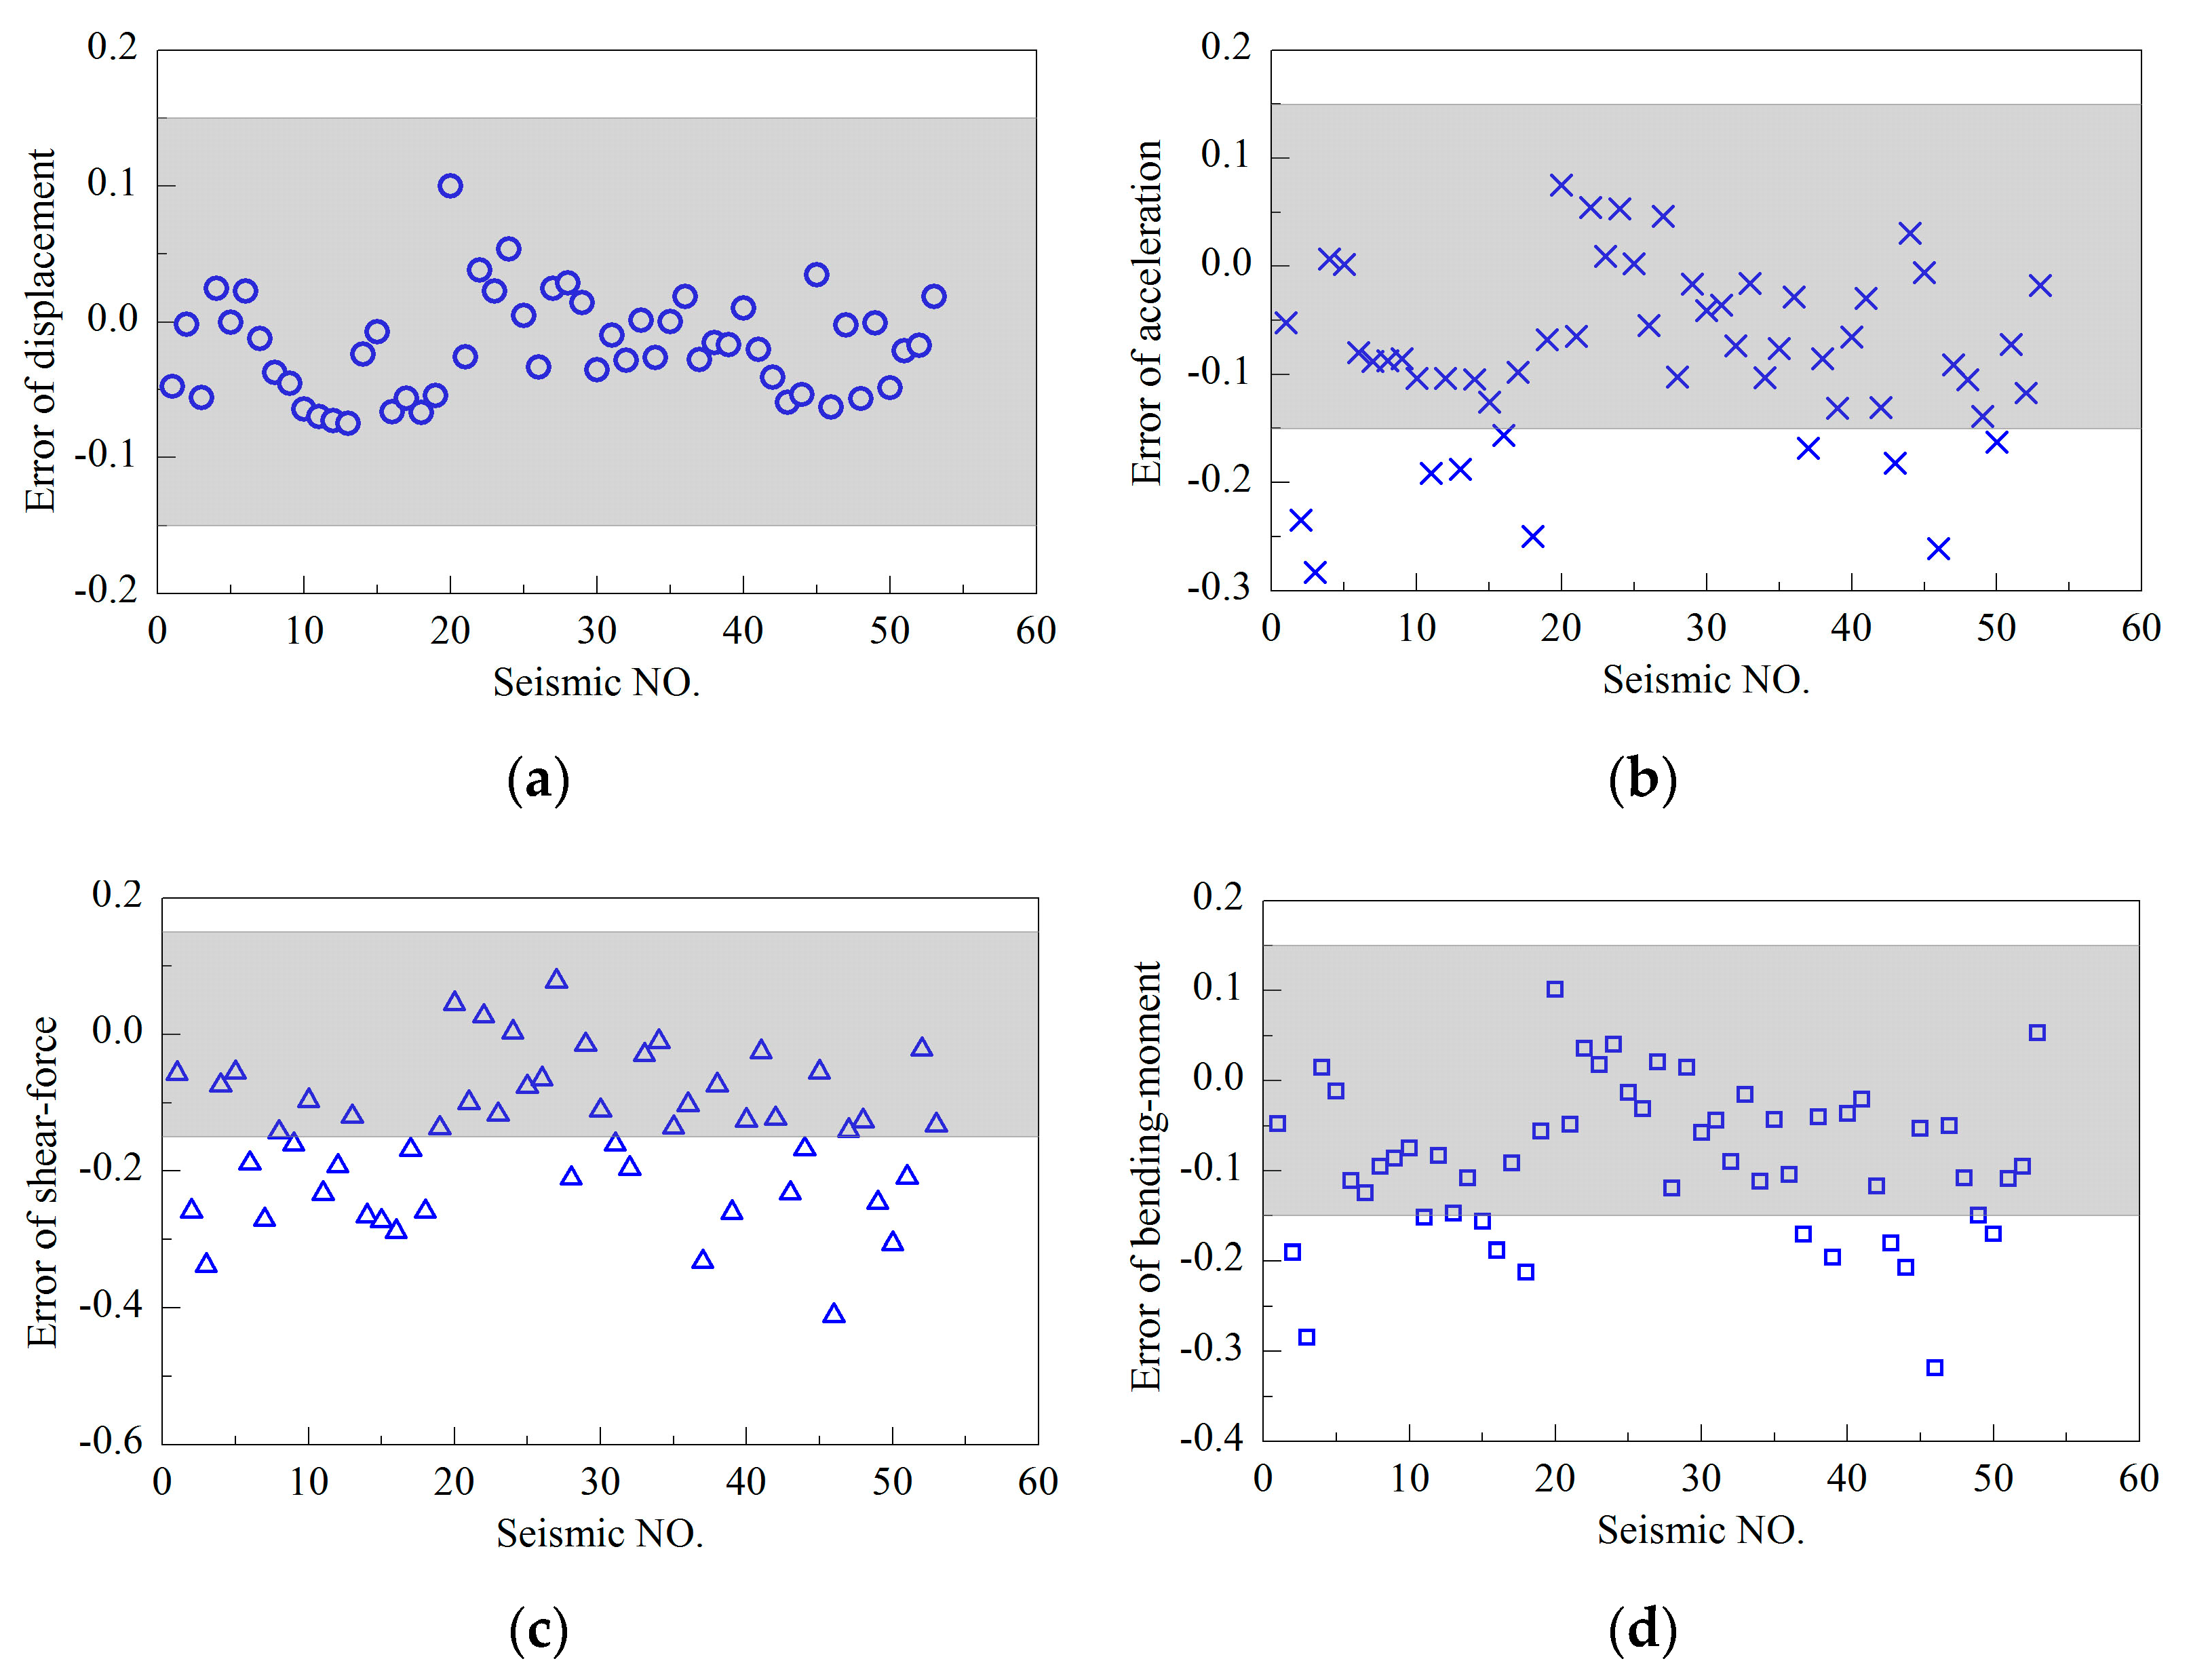
Figure 20.
Relative error between coupled and uncoupled analysis as aerodynamic damping ratio is 7% and mean wind speed at hub height equals 11.4 m/s; (a) tower-top displacement, (b) tower-top acceleration, (c) tower-base shear force, (d) tower-base bending moment.
Figure 20.
Relative error between coupled and uncoupled analysis as aerodynamic damping ratio is 7% and mean wind speed at hub height equals 11.4 m/s; (a) tower-top displacement, (b) tower-top acceleration, (c) tower-base shear force, (d) tower-base bending moment.
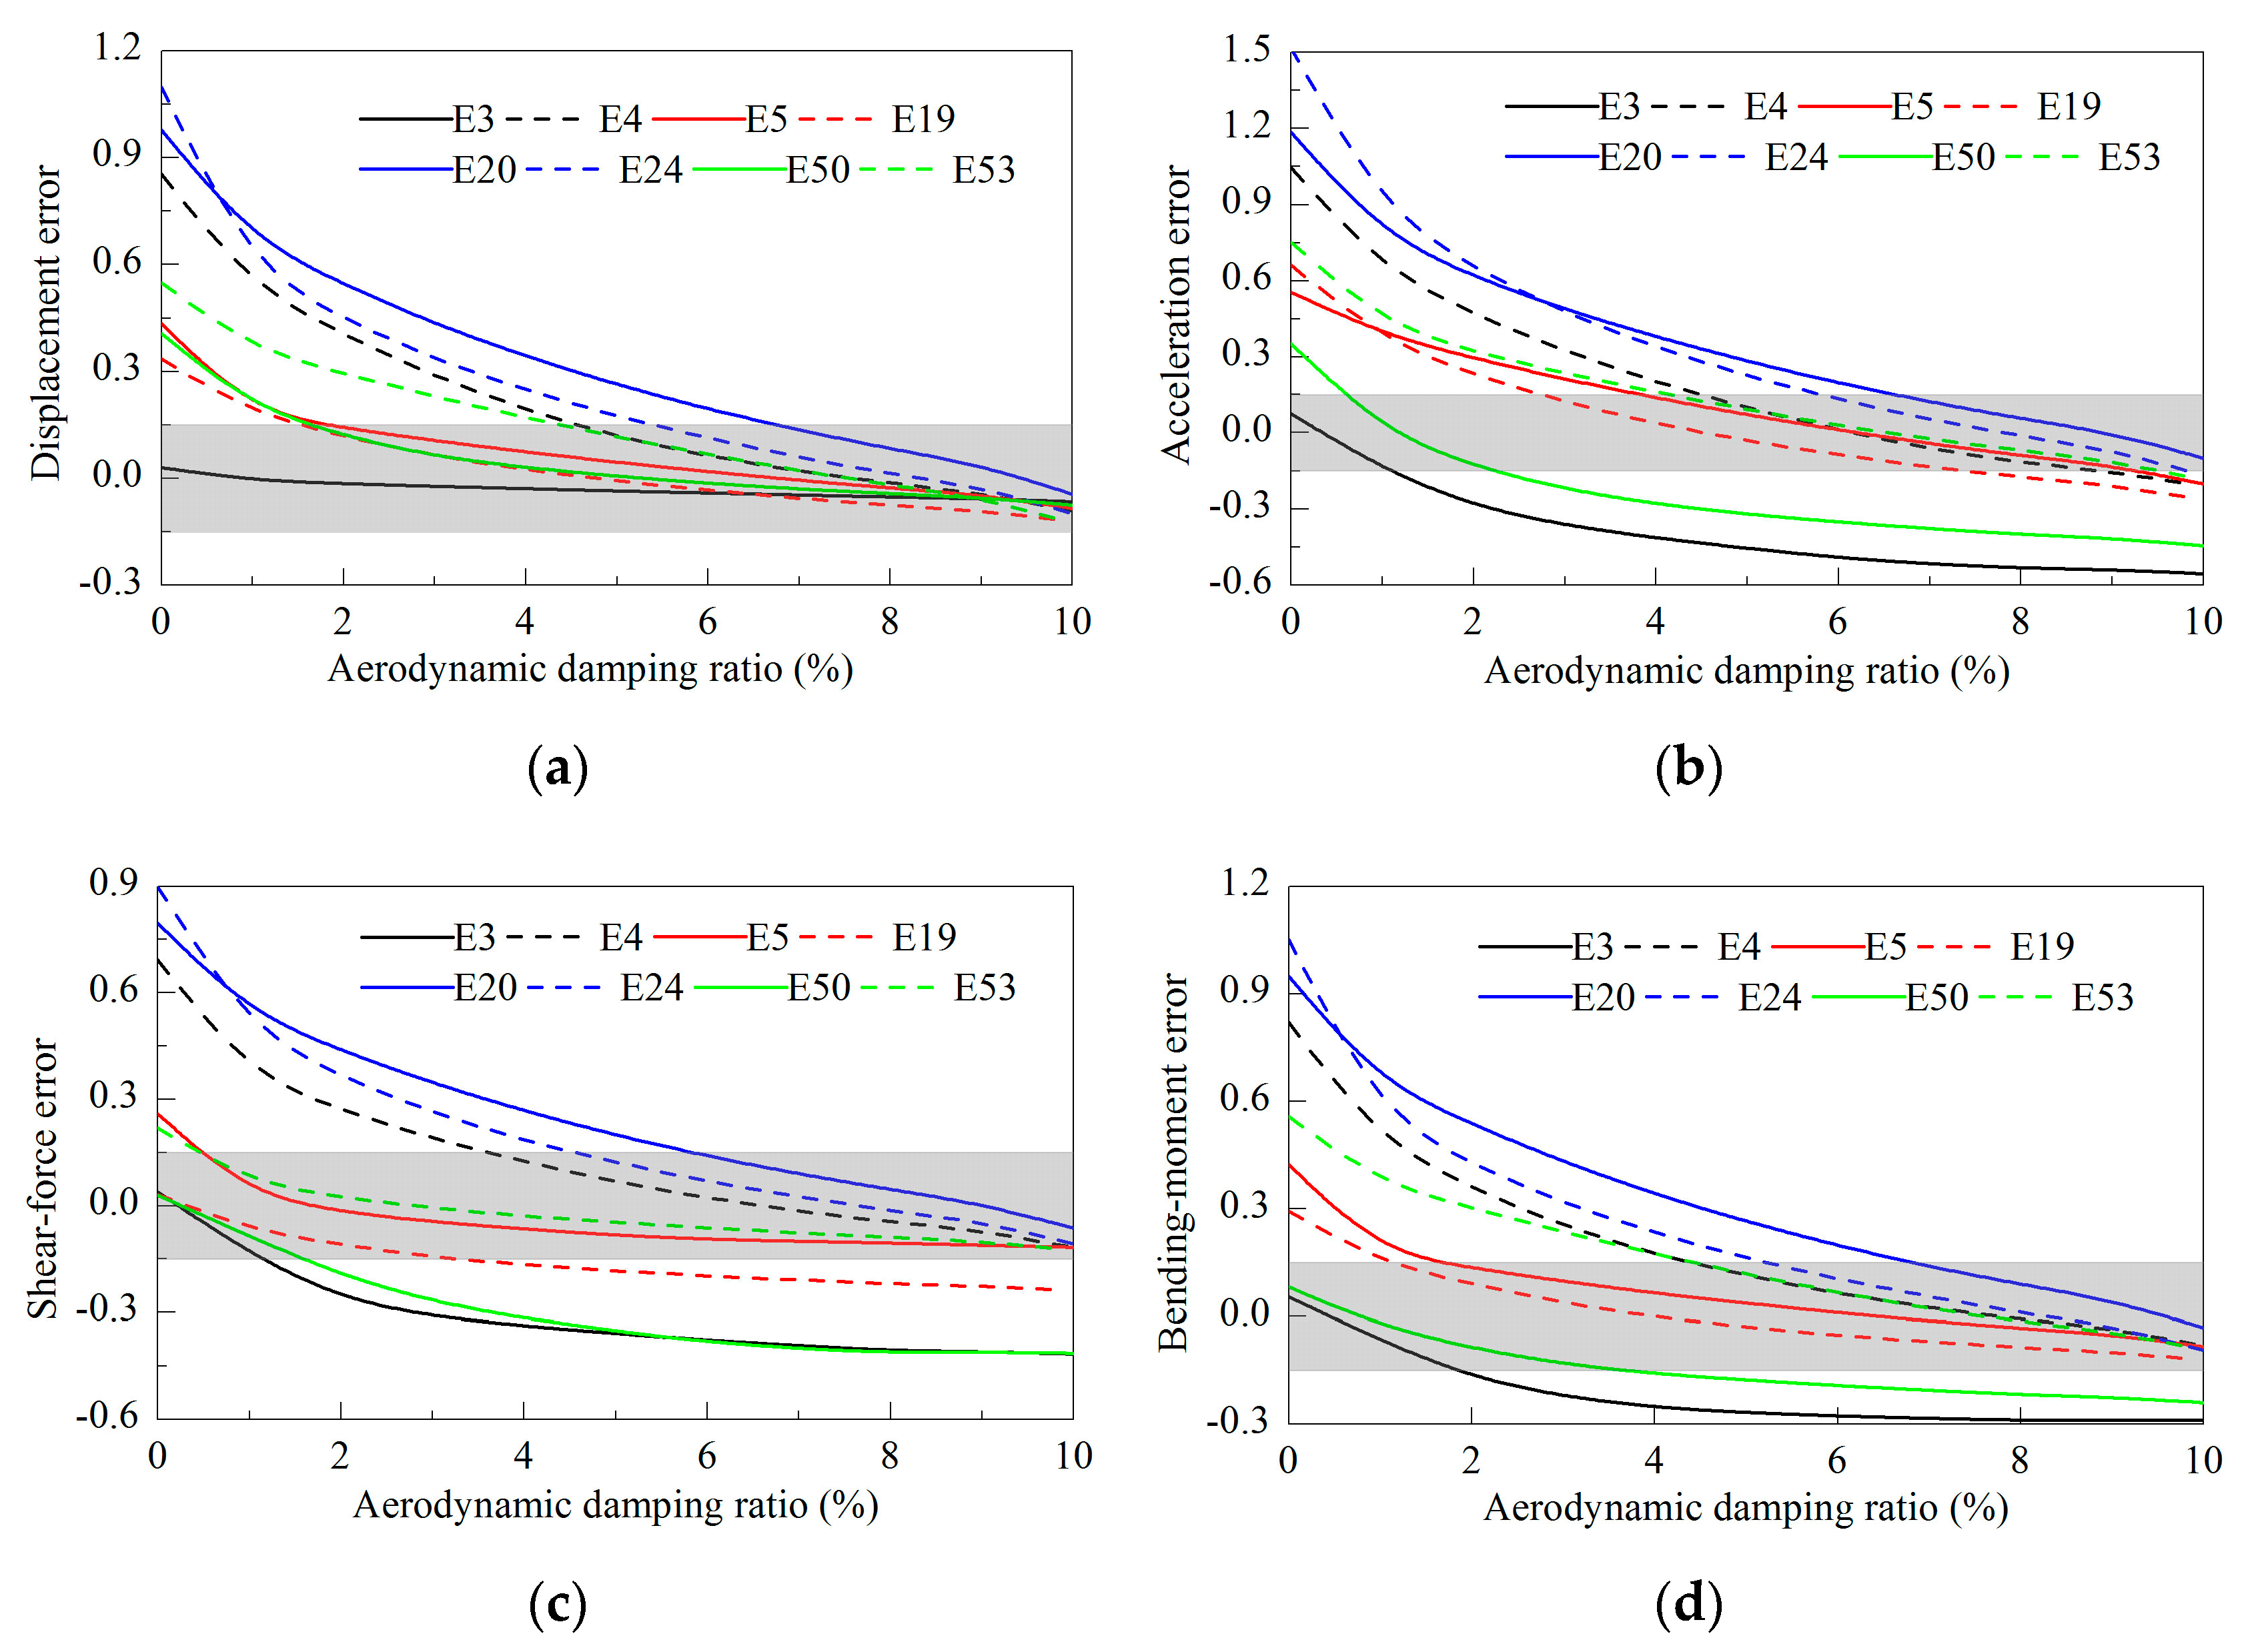
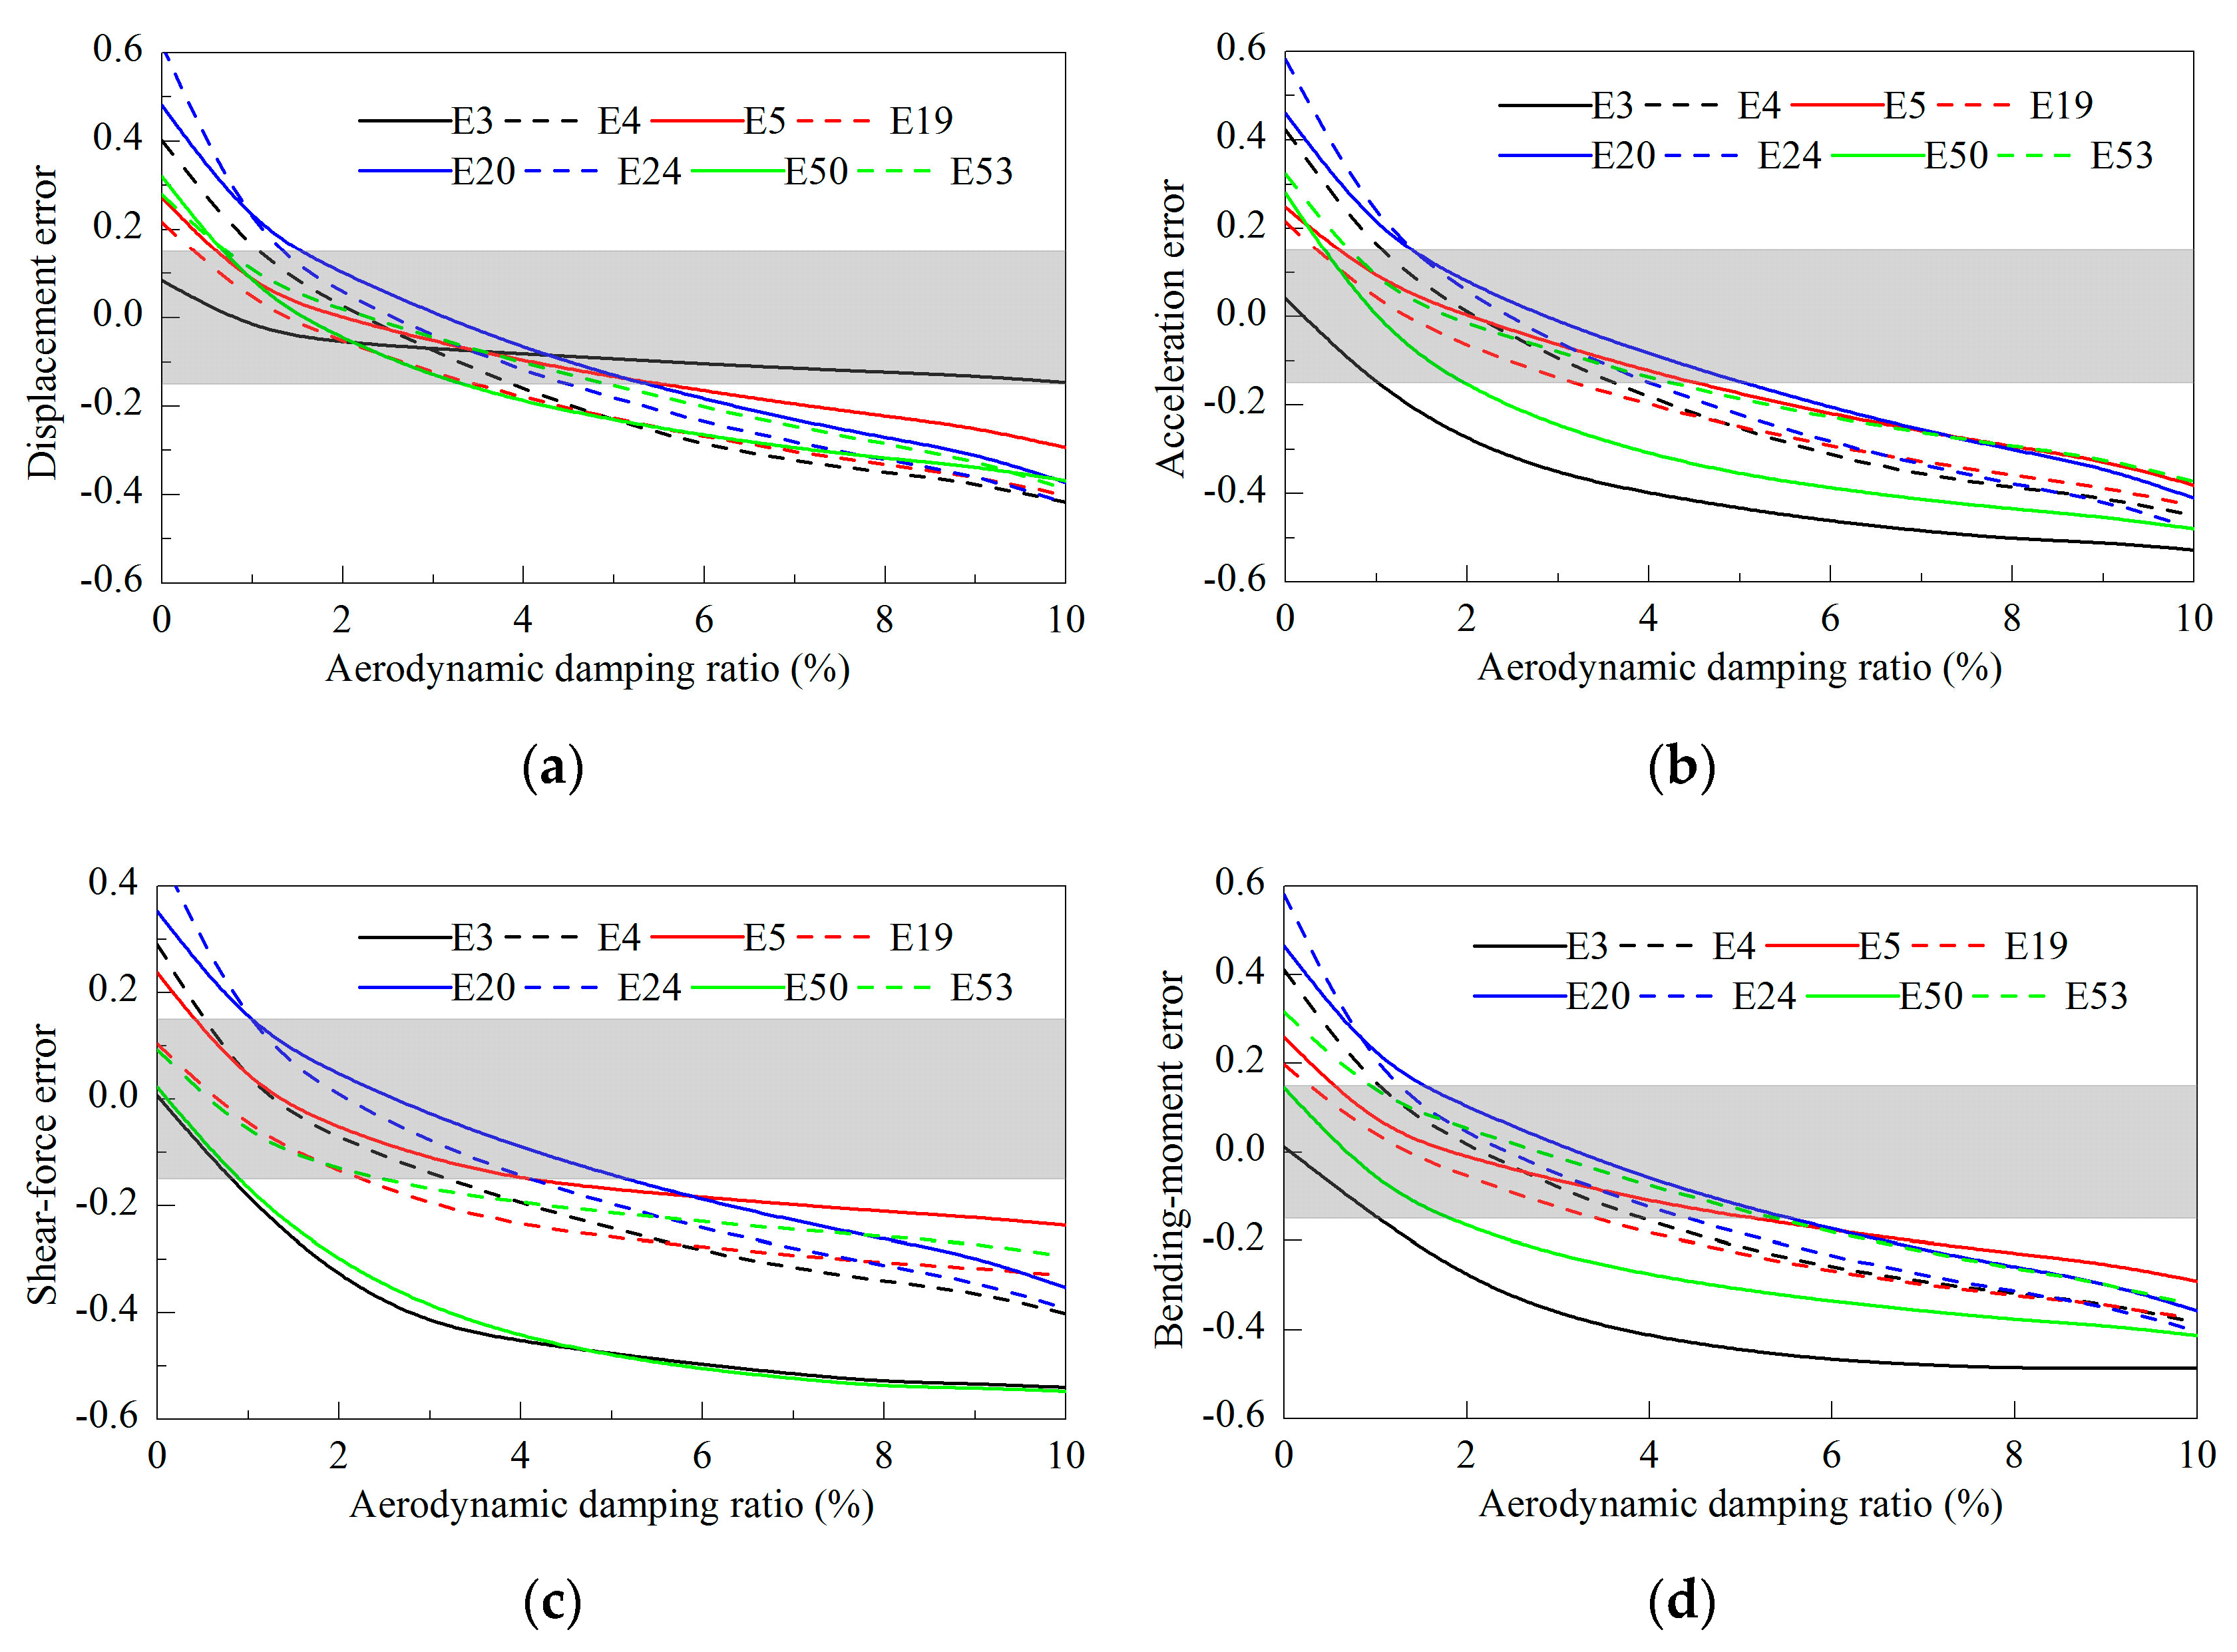
Figure 21.
Response error between coupled and uncoupled analysis for variable aerodynamic damping ratios as the mean wind speed at hub height is 11.4 m/s; (a) tower-top displacement, (b) tower-top acceleration, (c) tower-base shear force, (d) tower-base bending moment.
Figure 21.
Response error between coupled and uncoupled analysis for variable aerodynamic damping ratios as the mean wind speed at hub height is 11.4 m/s; (a) tower-top displacement, (b) tower-top acceleration, (c) tower-base shear force, (d) tower-base bending moment.
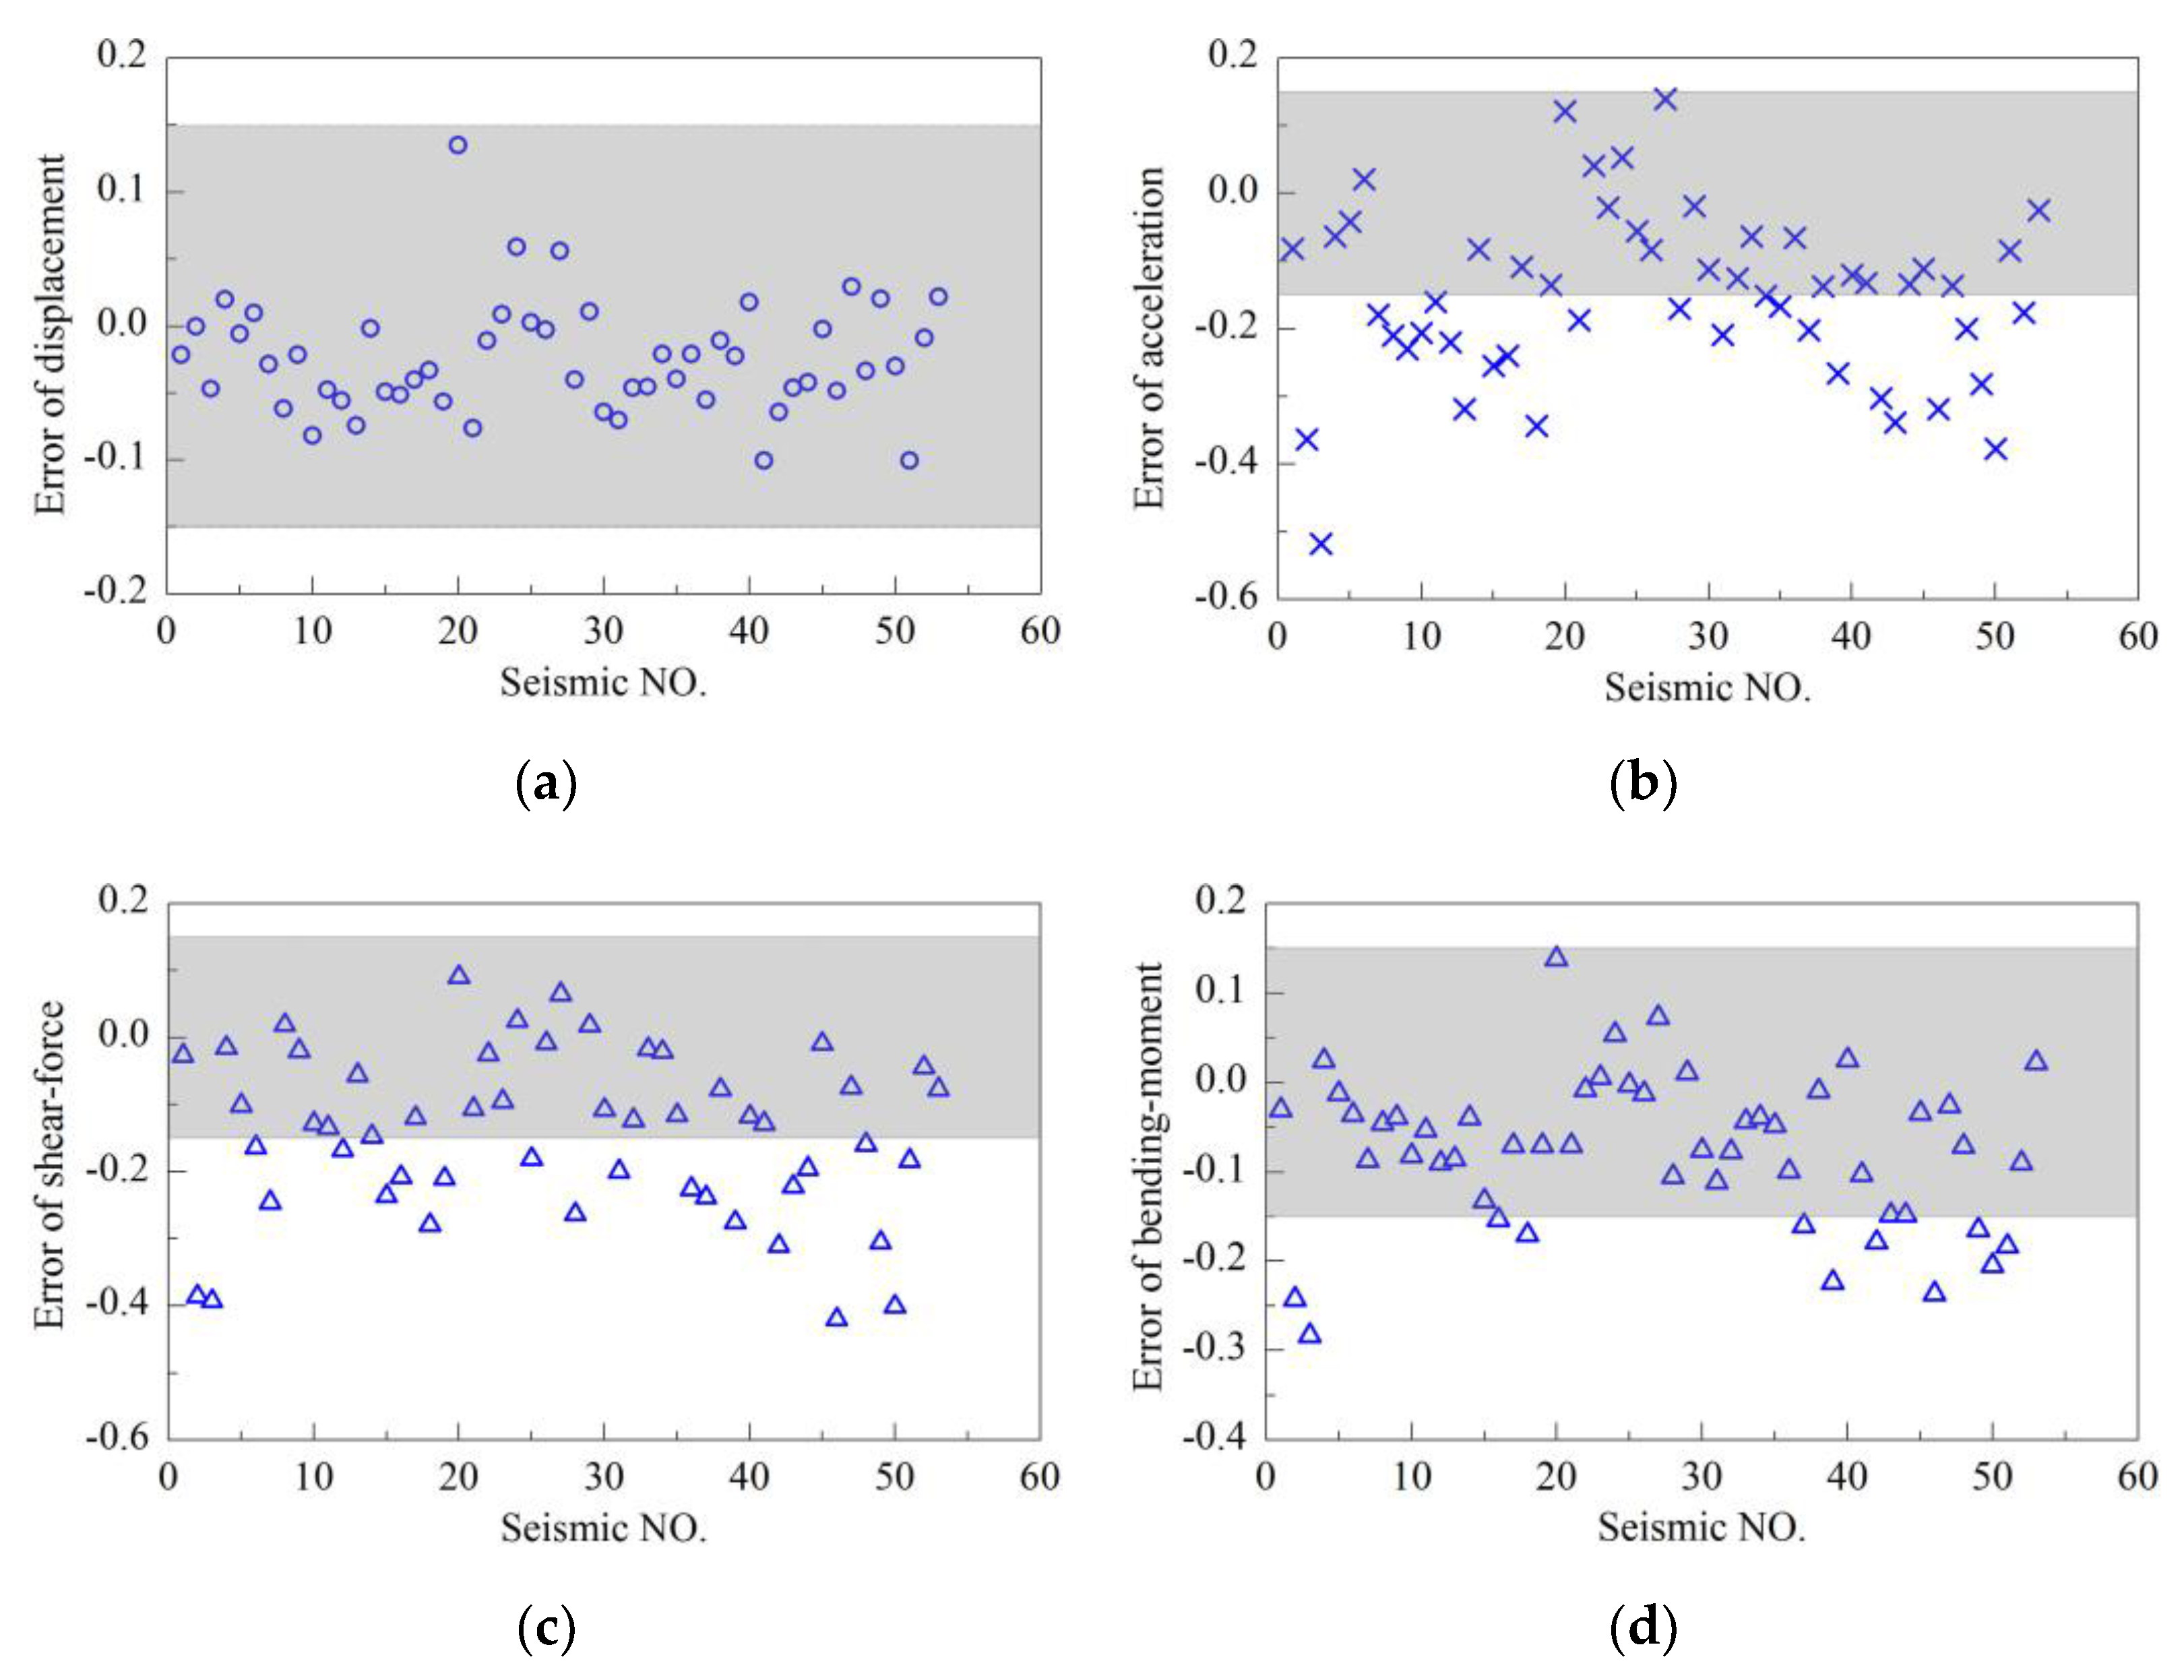
Figure 22.
Relative error between coupled and uncoupled analysis as aerodynamic damping ratio is 3% and mean wind speed at hub height equals 5 m/s; (a) tower-top displacement, (b) tower-top acceleration, (c) tower-base shear force, (d) tower-base bending moment.
Figure 22.
Relative error between coupled and uncoupled analysis as aerodynamic damping ratio is 3% and mean wind speed at hub height equals 5 m/s; (a) tower-top displacement, (b) tower-top acceleration, (c) tower-base shear force, (d) tower-base bending moment.
Figure 23.
Response error between coupled and uncoupled analysis for variable aerodynamic damping ratios as mean wind speed at hub height is 5 m/s; (a) tower-top displacement, (b) tower-top acceleration, (c) tower-base shear force, (d) tower-base bending moment.
Figure 23.
Response error between coupled and uncoupled analysis for variable aerodynamic damping ratios as mean wind speed at hub height is 5 m/s; (a) tower-top displacement, (b) tower-top acceleration, (c) tower-base shear force, (d) tower-base bending moment.
Figure 24.
Relative error between coupled and uncoupled analysis as aerodynamic damping ratio is 7% and mean wind speed at hub height equals 18 m/s; (a) tower-top displacement, (b) tower-top acceleration, (c) tower-base shear force, (d) tower-base bending moment.
Figure 24.
Relative error between coupled and uncoupled analysis as aerodynamic damping ratio is 7% and mean wind speed at hub height equals 18 m/s; (a) tower-top displacement, (b) tower-top acceleration, (c) tower-base shear force, (d) tower-base bending moment.
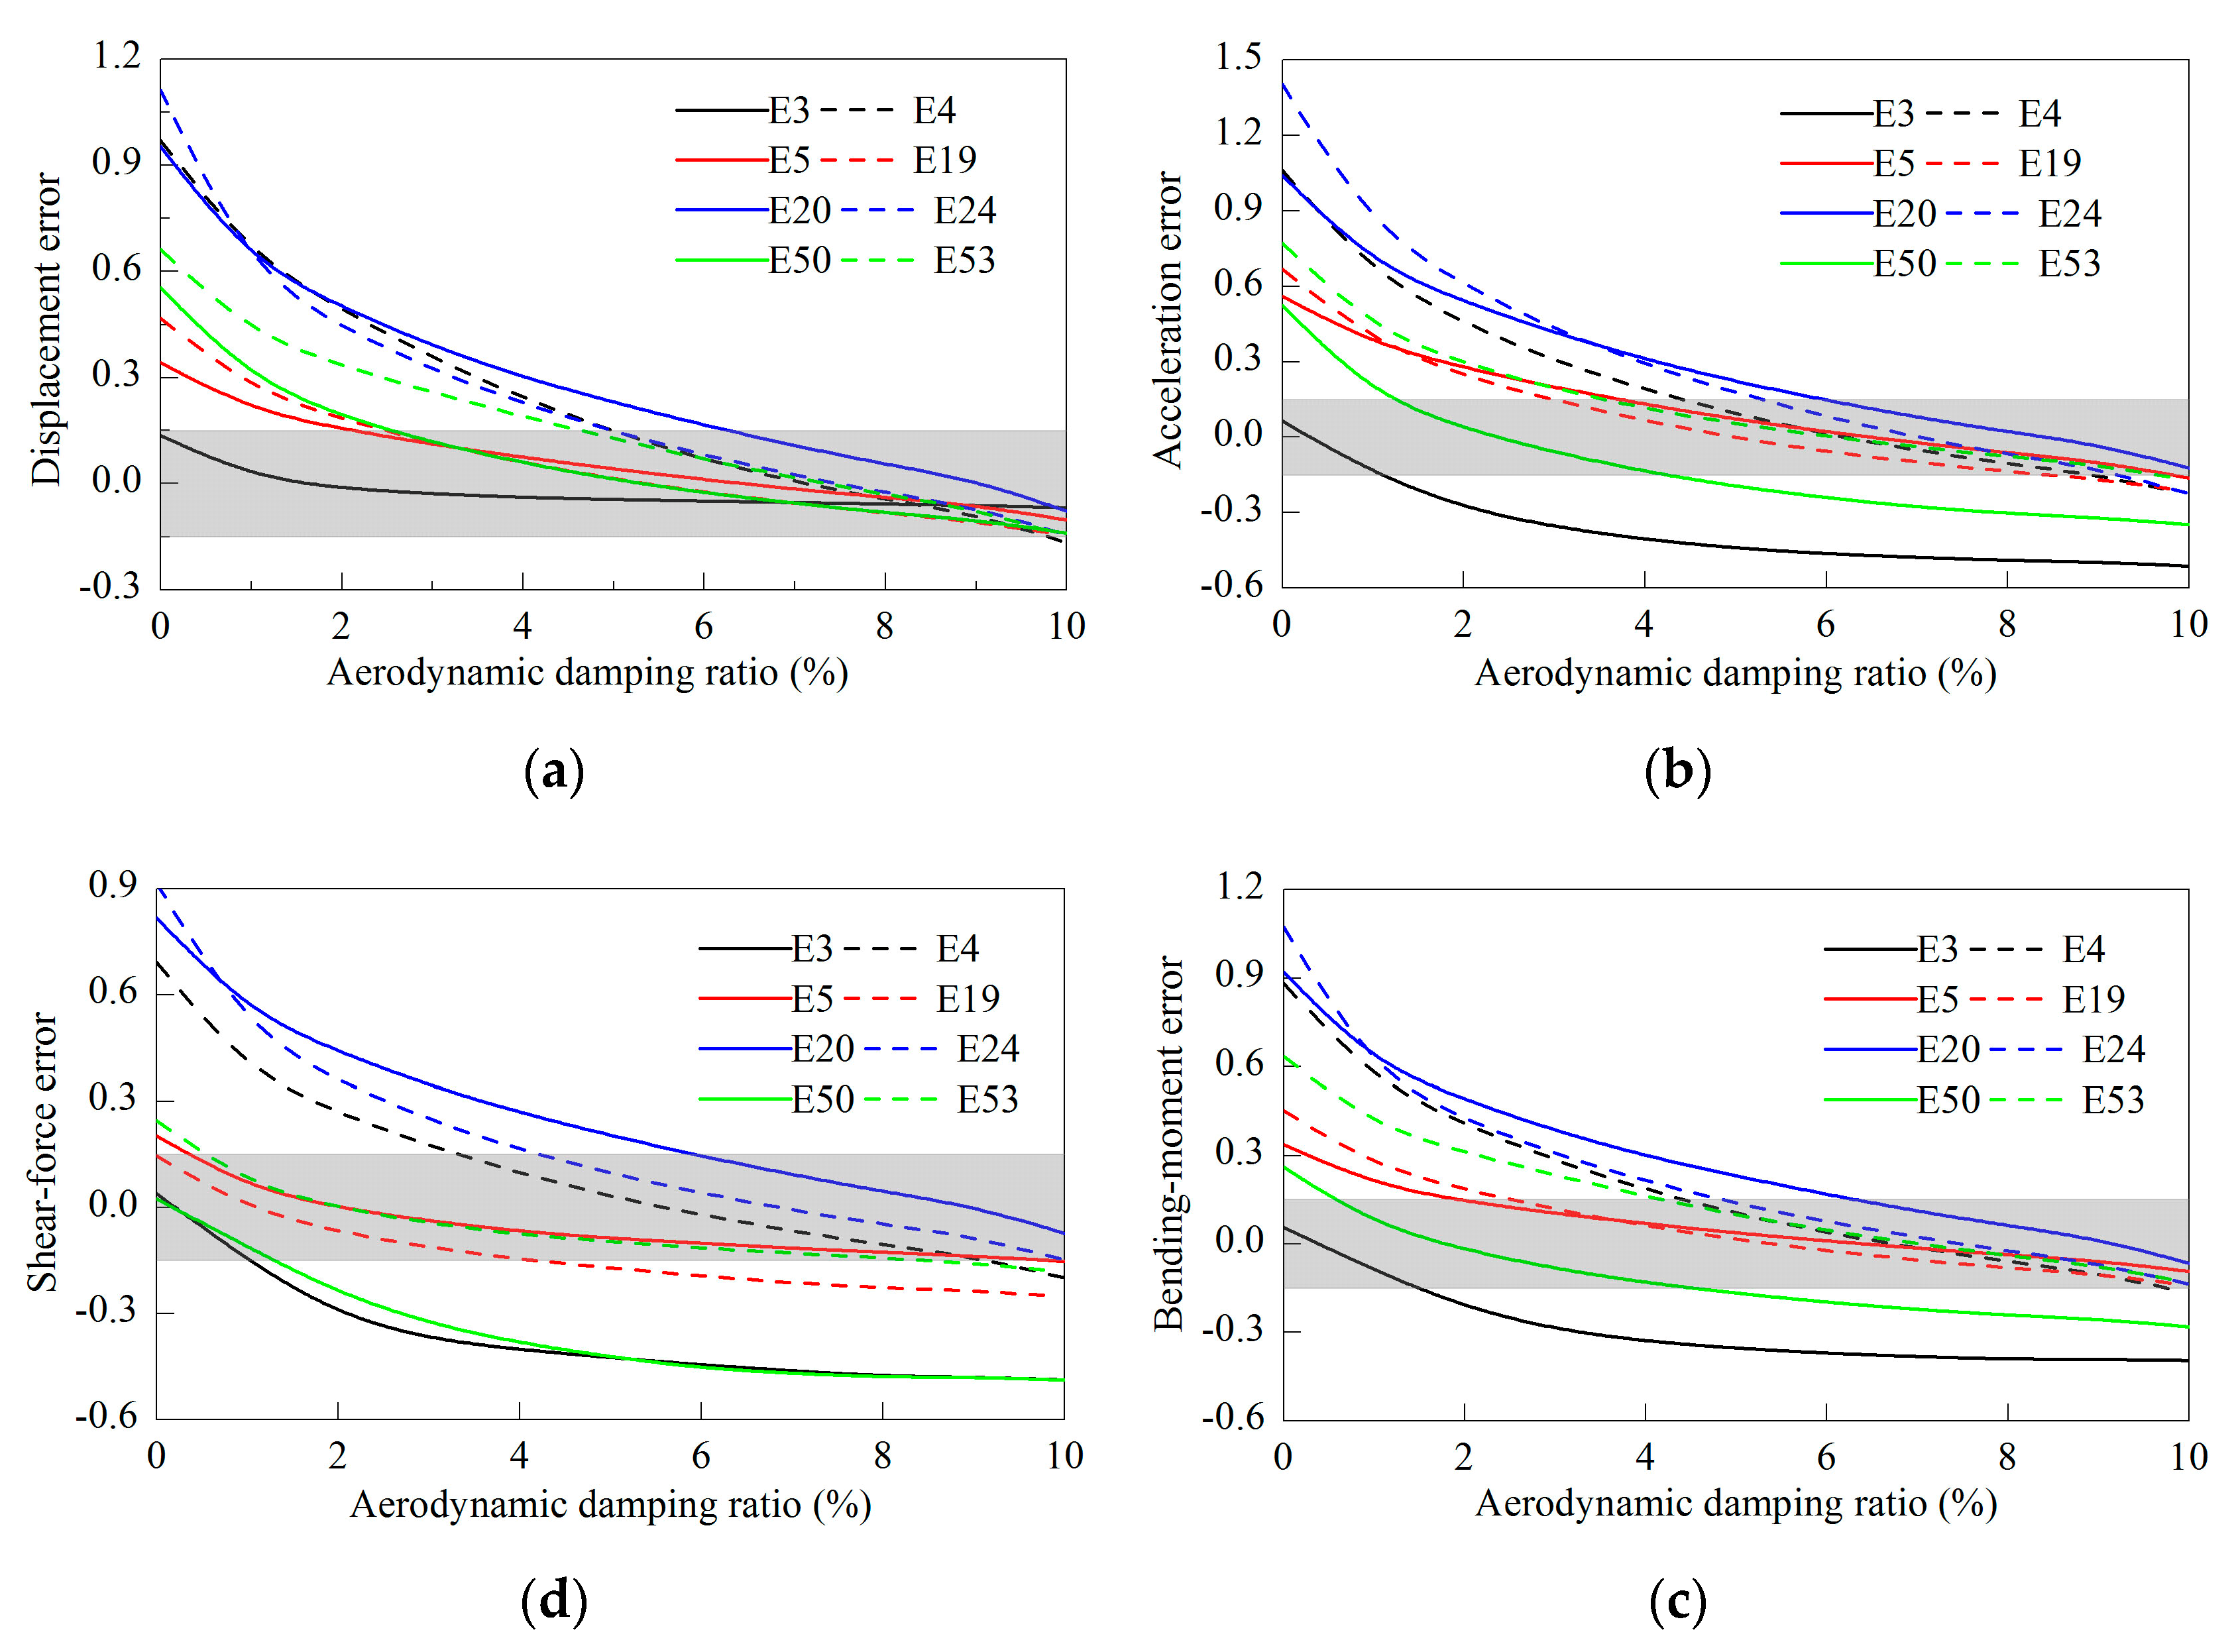
Figure 25.
Response error between coupled and uncoupled analysis for variable aerodynamic damping as the mean wind speed at hub height is 18 m/s; (a) tower-top displacement, (b) tower-top acceleration, (c) tower-base shear force, (d) tower-base bending moment.
Figure 25.
Response error between coupled and uncoupled analysis for variable aerodynamic damping as the mean wind speed at hub height is 18 m/s; (a) tower-top displacement, (b) tower-top acceleration, (c) tower-base shear force, (d) tower-base bending moment.
Table 1.
Properties of National Renewable Energy Laboratory (NREL) 5-MW Wind Turbine.
Table 1.
Properties of National Renewable Energy Laboratory (NREL) 5-MW Wind Turbine.
| Part/Item | Property | Value |
|---|
| Blade | Rotor diameter | 126 m |
| | Hub height | 90 m |
| | Cut-in, rated and cut-out wind speed | 3 m/s, 11.4 m/s, 25 m/s |
| | Cut-in and rated rotor speed | 6.9 rpm, 12.1 rpm |
| | Length | 61.5 m |
| | Overall mass | 17,740 kg |
| | Structural damping ratio | 0.5% |
| Hub and nacelle | Hub diameter | 3 m |
| | Hub mass | 56,780 kg |
| | Nacelle mass | 240,000 kg |
| Tower | Bottom and top outer diameter | 6 m, 3.87 m |
| | Bottom and top wall thickness | 0.027 m, 0.019 m |
| | Overall mass | 347,460 kg |
| | Structural damping ratio | 1% |
Table 2.
Frequencies of the NREL 5 MW wind turbine.
Table 2.
Frequencies of the NREL 5 MW wind turbine.
| Modes | Description | Natural Frequency (Hz) |
|---|
| 1 | 1st Tower Fore-Aft | 0.3240 |
| 2 | 1st Tower Side-to-Side | 0.3120 |
| 3 | 1st Drivetrain Torsion | 0.6205 |
| 4 | 1st Blade Asymmetric Flapwise Yaw | 0.6664 |
| 5 | 1st Blade Asymmetric Flapwise Pitch | 0.6675 |
| 6 | 1st Blade Collective Flap | 0.6993 |
| 7 | 1st Blade Asymmetric Edgewise Pitch | 1.0793 |
| 8 | 1st Blade Asymmetric Edgewise Yaw | 1.0898 |
| 9 | 2nd Blade Asymmetric Flapwise Yaw | 1.9337 |
| 10 | 2nd Blade Asymmetric Flapwise Pitch | 1.9223 |
| 11 | 2nd Blade Collective Flap | 2.0205 |
| 12 | 2nd Tower Fore-Aft | 2.9003 |
| 13 | 2nd Tower Side-to-Side | 2.9361 |
Table 3.
Details of input ground motions obtained from Pacific Earthquake Engineering Research (PEER) database.
Table 3.
Details of input ground motions obtained from Pacific Earthquake Engineering Research (PEER) database.
| ID. | Event | Year | Station | Manitude | Component | PGA(g) |
|---|
| 1 | Kocaeli, Turkey | 1999 | Arcelik | 7.5 | ARC000 | 0.22 |
| 2 | Duzce, Turkey | 1999 | Bolu | 7.1 | BOL000 | 0.73 |
| 3 | Loma Prieta | 1989 | Capitola | 6.9 | CAP000 | 0.53 |
| 4 | Chi-Chi, Taiwan | 1999 | CHY101 | 7.6 | CHY101-E | 0.35 |
| 5 | Imperial Valley | 1979 | Delta | 6.5 | DLT262 | 0.24 |
| 6 | Kocaeli, Turkey | 1999 | Duzce | 7.5 | DZC180 | 0.31 |
| 7 | Imperial Valley | 1979 | El Centro Array #11 | 6.5 | H-E11140 | 0.36 |
| 8 | Loma Prieta | 1989 | Gilroy Array #3 | 6.9 | G03090 | 0.37 |
| 9 | Hector Mine | 1999 | Hector | 7.1 | HEC090 | 0.34 |
| 10 | Superstition Hills | 1987 | El Centro Imp. Co. | 6.5 | B-ICC090 | 0.26 |
| 11 | Northridge | 1994 | Canyon Country-WLC | 6.7 | LOS000 | 0.41 |
| 12 | Northridge | 1994 | Beverly Hills-Mulhol | 6.7 | MUL009 | 0.42 |
| 13 | Kobe, Japan | 1995 | Nishi-Akashi | 6.9 | NIS000 | 0.51 |
| 14 | San Fernando | 1971 | LA-Hollywood Stor | 6.6 | PEL090 | 0.21 |
| 15 | Superstition Hills | 1987 | Poe Road (temp) | 6.5 | POE360 | 0.30 |
| 16 | Cape Mendocino | 1992 | Rio Dell Overpass | 7.0 | RIO270 | 0.39 |
| 17 | Kobe, Japan | 1995 | Shin-Osaka | 6.9 | SHI000 | 0.24 |
| 18 | Friuli, Italy | 1976 | Tolmezzo | 6.5 | TMZ000 | 0.31 |
| 19 | Landers | 1992 | Yermo Fire Station | 7.3 | YER270 | 0.24 |
| 20 | Manjil, Iran | 1990 | Abbar | 7.4 | ABBAR-T | 0.21 |
| 21 | Darfield | 2010 | Christchurch Cathedral College | 7.0 | CN26W | 0.19 |
| 22 | Chi-Chi, Taiwan | 1999 | CHY104 | 7.6 | CHY104-N | 0.17 |
| 23 | Mexico | 2010 | Calexico Fire Station | 7.2 | CXO090 | 0.27 |
| 24 | Mexico | 2010 | Cerro Prieto Geothermal | 7.2 | GEO000 | 0.26 |
| 25 | Darfield | 2010 | Christchurch Hospital | 7.0 | HCS89W | 0.15 |
| 26 | Chi-Chi, Taiwan | 1999 | TCU070 | 7.6 | TCU070-N | 0.16 |
| 27 | Chi-Chi, Taiwan | 1999 | TCU109 | 7.6 | TCU109-N | 0.16 |
| 28 | Duzce, Turkey | 1999 | Duzce | 7.1 | DZC-180 | 0.30 |
| 29 | Imperial Valley | 1979 | El Centro Array-6 | 6.5 | H-E06230 | 0.44 |
| 30 | Imperial Valley | 1979 | El Centro Array-7 | 6.5 | H-E07140 | 0.34 |
| 31 | Erzican, Turkey | 1992 | Erzincan | 6.7 | ERZ-NS | 0.51 |
| 32 | Kocaeli, Turkey | 1999 | Izmit | 7.5 | LZT090 | 0.22 |
| 33 | Landers | 1992 | Lucerne | 7.3 | LCN260 | 0.73 |
| 34 | Cape Mendocino | 1992 | Petrolia | 7.0 | PET090 | 0.66 |
| 35 | Superstition Hills | 1987 | Parachute Test Site | 6.5 | PTS225 | 0.45 |
| 36 | Northridge-01 | 1994 | Rinaldi Receiving Sta | 6.7 | RRS228 | 0.83 |
| 37 | Loma Prieta | 1989 | Saratoga-Aloha | 6.9 | STG090 | 0.32 |
| 38 | Irpinia, Italy | 1980 | Sturno | 6.9 | STU270 | 0.36 |
| 39 | Northridge | 1994 | Sylmar-Olive View | 6.7 | SYL360 | 1.68 |
| 40 | Chi-Chi, Taiwan | 1999 | TCU065 | 7.6 | TCU065-E | 0.81 |
| 41 | Chi-Chi, Taiwan | 1999 | TCU102 | 7.6 | TCU102-E | 0.30 |
| 42 | Northridge-01 | 1994 | LA-Sepulveda VA | 6.7 | 0637-360 | 0.93 |
| 43 | Imperial Valley-06 | 1979 | Bonds Corner | 6.5 | BCR140 | 0.59 |
| 44 | Loma Prieta | 1989 | BRAN | 6.9 | BRN000 | 0.48 |
| 45 | Imperial Valley-06 | 1979 | Chihuahua | 6.5 | CHI282 | 0.25 |
| 46 | Loma Prieta | 1989 | Corralitos | 6.9 | CLS000 | 0.68 |
| 47 | Gazli | 1976 | Karakyr | 6.8 | GAZ0 | 0.61 |
| 48 | Nahanni | 1985 | Site 2 | 6.8 | S2240 | 0.49 |
| 49 | Nahanni | 1985 | Site 1 | 6.8 | S1010 | 0.91 |
| 50 | Northridge | 1994 | Northridge-Saticoy | 6.7 | STC090 | 0.37 |
| 51 | Chi-Chi, Taiwan | 1999 | TCU067 | 7.6 | TCU067-E | 0.50 |
| 52 | Chi-Chi, Taiwan | 1999 | TCU084 | 7.6 | TCU084-E | 1.16 |
| 53 | Kocaeli, Turkey | 1999 | Yarimca | 7.5 | YPT330 | 0.35 |
Table 4.
Response amplitude of the wind turbine as the earthquake is seismic record 3.
Table 4.
Response amplitude of the wind turbine as the earthquake is seismic record 3.
| Model | Tower-Top Displacement | Tower-Top Acceleration | Tower-Base Shear-Force | Tower-Base Bending-Moment |
|---|
| m | m/s2 | MN | MN·m |
|---|
| coupled | 0.53 | 1.61 | 3.04 | 120 |
| uncouple | 0.51 | 0.71 | 2.14 | 90 |
Table 5.
Response amplitude of the wind turbine as the earthquake is seismic record 4.
Table 5.
Response amplitude of the wind turbine as the earthquake is seismic record 4.
| Model | Tower-Top Displacement | Tower-Top Acceleration | Tower-Base Shear-Force | Tower-Base Bending-Moment |
|---|
| m | m/s2 | MN | MN·m |
|---|
| coupled | 1.05 | 3.15 | 2.18 | 172 |
| uncouple | 1.25 | 4.03 | 2.49 | 211 |
Table 6.
Parameters of wind field.
Table 6.
Parameters of wind field.
| Mean Wind Speed at Hub, Vhub | Wind Samples |
|---|
| 5 m/s | 5 |
| 11.4 m/s | 5 |
| 18 m/s | 5 |


