Review

Moisture-Safe Cold Attics in Humid Climates of Europe and North America

Department of Architecture and Environment, University Centre for Energy Efficient Buildings, Czech Technical University in Prague, Trinecka 1024, 273 43 Bustehrad, Czech Republic
*
Author to whom correspondence should be addressed.
Energies 2020, 13(15), 3856; https://doi.org/10.3390/en13153856
Submission received: 6 May 2020 / Revised: 23 July 2020 / Accepted: 24 July 2020 / Published: 28 July 2020
(This article belongs to the Section G: Energy and Buildings)

Abstract

:
During the last few decades, unheated attic spaces (so-called “cold attics”) have been one of the most moisture-problematic spaces in the building practices of Europe and North America. Problems with such spaces are usually associated with condensation, frost formation, and mould growth on the lower surfaces of the roof deck. To solve these problems, a number of qualitative studies were performed. Although these studies revealed many important pieces of information, some of them are seemingly not in accordance with one another. Therefore, there has not yet been presented cold attic design which is suitable (especially moisture-safe) for the whole target region. The aim of this paper is to determine whether such a design can be determined or state the reasons why it is not possible. Based on a review of published studies, 38 cold attic designs were selected for detailed analysis. Their comparative parameters were established, quantified, and compared. The moisture-safeness of each design was evaluated using an original approach, and the designs were sorted into groups based on their similarities. Despite many uncertainties, it was found that the criteria for moisture-safe cold attic design in the target region can likely be stated.

1. Introduction

1.1. Background

A cold attic is an unheated space surrounded by a pitched roof, gable walls, and a thermally insulated ceiling of the highest floor of the building. Typical European and North American cold attic designs can be seen in Figure 1. As the attic is located outside the main thermal envelope, the temperature within it is governed mostly by the outdoor environment. During the heating season, the temperature of attic air is generally very close to the temperature of the outdoor air; thus, the attic is “cold” [1,2]. The heating season is also the most critical in terms of attic moisture problems. Typically, these problems include condensation, frost formation, and mould growth on the lower surface of the roof deck and on its contact with the rafters and wall beams (see Figure 2). In some cases, also other inner-attic surfaces can experience similar problems (see Figure 3). In response to these problems, many hygro-thermal studies of cold attics have been performed [2,3,4,5,6,7,8,9,10,11,12,13,14,15,16,17,18,19,20,21,22,23,24,25,26,27,28,29]. One of the first was presented as early as 1941 [3]. However, a significant increase in such problems and the responding studies were recorded after the energy crises in 1970s since many countries tightened their requirements for building energy consumption, which led to a step-increase in thermal resistance and the airtightness of building envelopes [12,13,30]. A lack of experience with such new assemblies generated new hygro-thermal problems. This situation was further exacerbated by new and upgraded building materials that were on the market at that time. Around 1990, the first vapour-permeable underlay felts [31] were introduced, which allowed an attic to be unventilated while remaining vapour-permeable to the outdoor environment. Misunderstandings of such designs, however, complicated the situation even further, and cold attics have become one of the most moisture-problematic spaces in building practices [13,14,32,33,34].
Although past studies revealed many important pieces of information, some of them are not in agreement with one another as noted by some of the recent studies [15,16]. An example can be illustrated using one of the most discussed parameters of attic design—the ventilation. In the Czech Republic (Central Europe) ventilation by outdoor air is a traditional practice and remains the best way to keep an attic moisture-safe [1,33]. Clear evidence can be found, for example, in agriculture buildings, whose attics often serve as spaces for the dry storage of hay, straw, and other supplies. Although such spaces are often placed above cattle sheds that provide a moisture load to the attic, the stored supplies are kept sufficiently dry, even though the “dryness” remains limited by the moisture present within the ventilation air itself [2]. Accordingly, some studies also claim that attics should be ventilated [3,4,5]. Other studies, however, state that there is an optimal ventilation rate and that the attic should not be ventilated too much or too low. On the other hand, some studies found that unventilated (sealed) attics perform better than ventilated ones [2,6], while another study notes that both designs, ventilated and unventilated, perform similarly well [7]. On the contrary, another study revealed that suitable conditions for mould growth are present in both designs [8]. Finally, some studies recommend using an unventilated cold attic in combination with mechanical adaptive ventilation [9,12,14,35].
Based on such information, without context, this topic seems poorly understood and unsolved. It should be emphasized, moreover, that this applies to only one parameter: the ventilation. However, when all the key parameters and contextual information are considered, these studies may be shown not to disprove each other and may, moreover, reveal some new logical connections between themselves.

1.2. Goal of this Paper
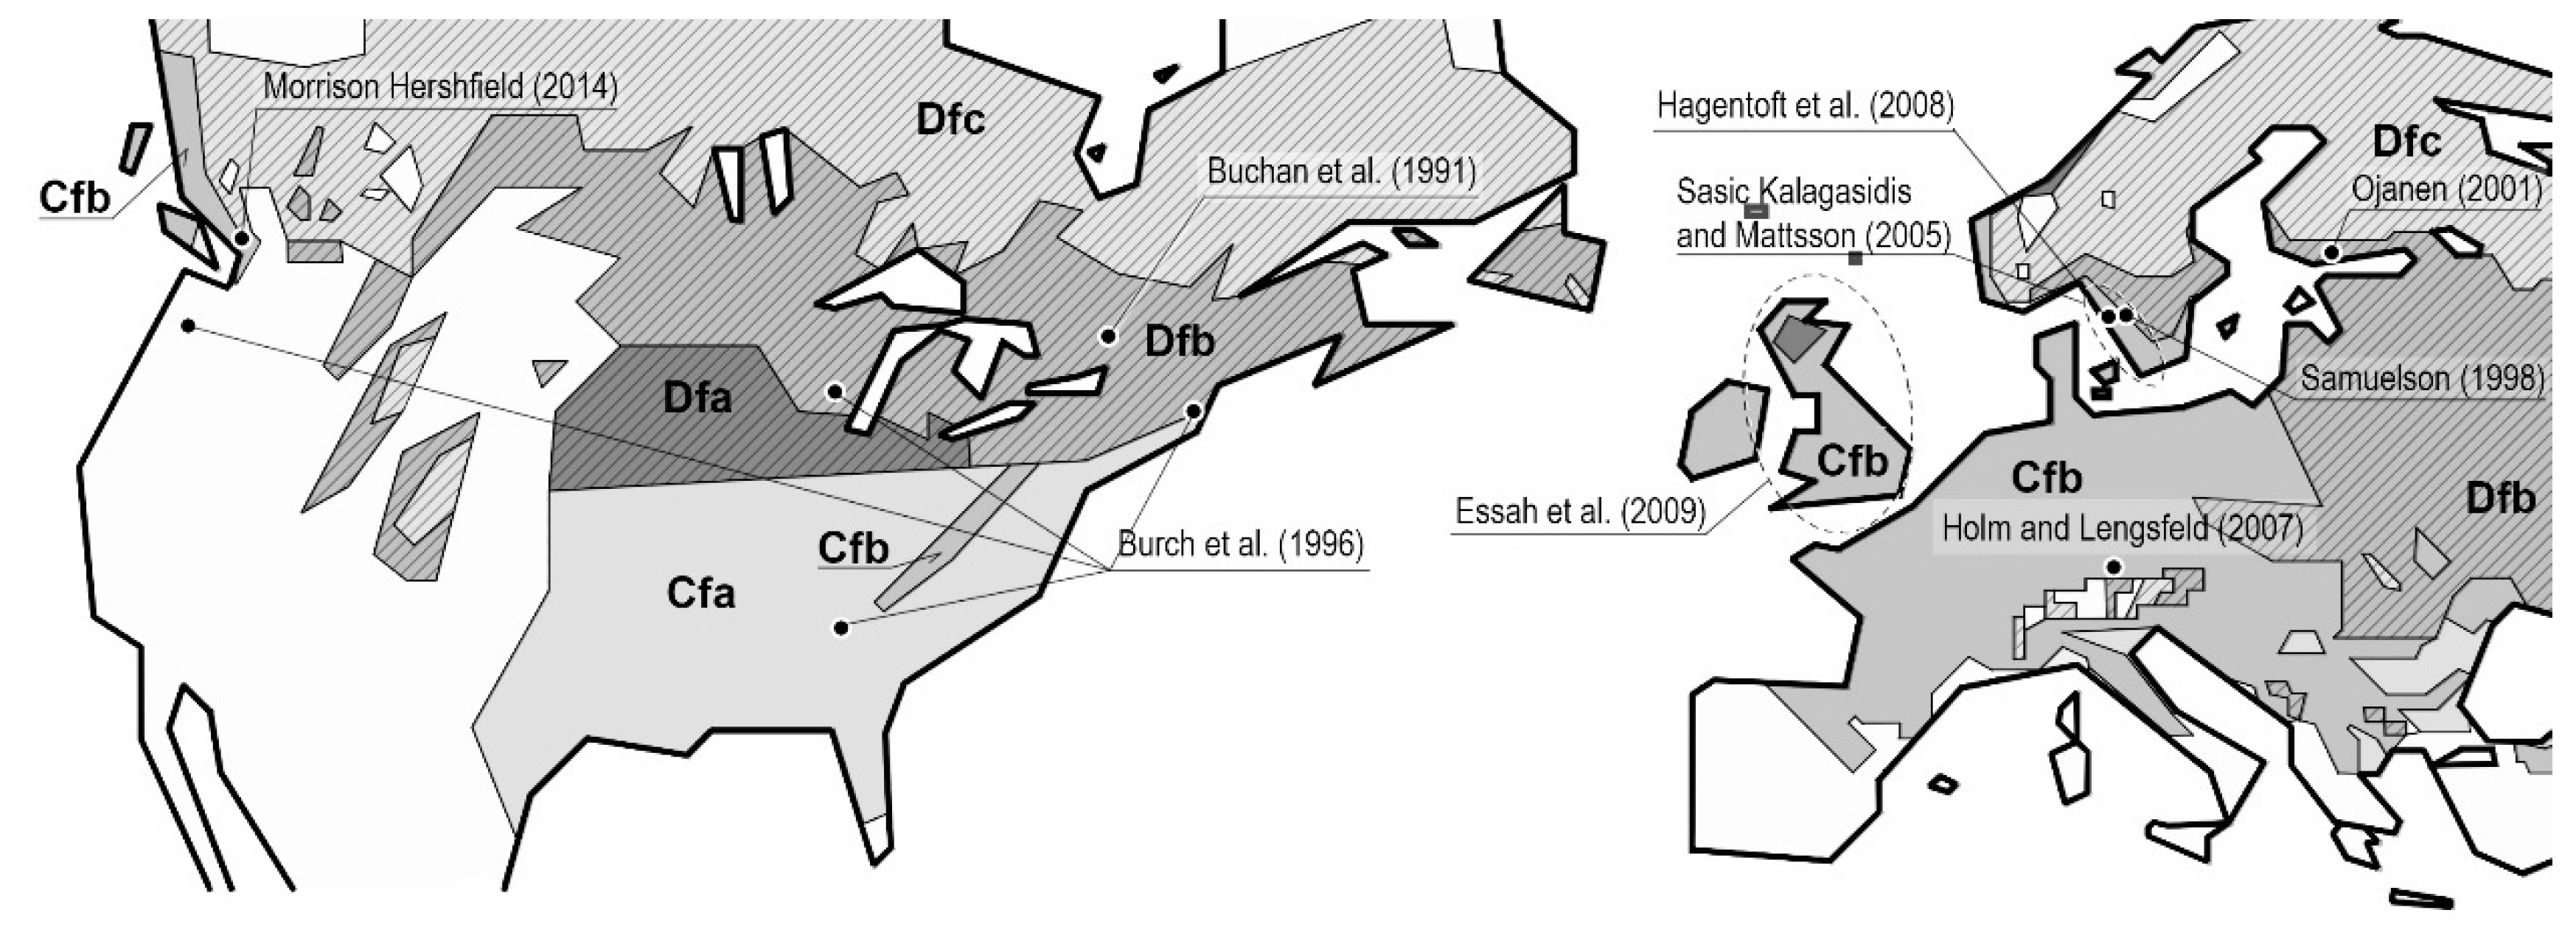
The aim of this paper is to determine whether it can be determined one or more cold attic designs that would be suitable (especially moisture-safe) for the whole or prevailing part of the humid climates of Europe and North America, or state any reasons why such a determination is not possible. Since the selected studies that this paper is based on handle mostly traditional, commonplace designs, the results are also based on such designs.

1.3. Target Region

Studies on similar hygro-thermal problems of cold attics were performed mostly in Europe and North America. If the locations of the tested attics are plotted on a map of the Köppen–Geiger climate classification (see Figure 4 and Table 1), most attics are shown to belong to a humid–temperate and humid–cold climates (“Cf” and “Df”, respectively). This region was ultimately suggested as the target area and referred to as the “humid climates of Europe and North America” hereafter.
The map in Figure 4 was roughly redrawn from [36], where the authors used data from the period of 1951–2000, which roughly corresponds to publication years of the studies.
Although climate zones can shift in the future [37], potential moisture-safe attic designs should always be valid for a particular climate–cultural region.

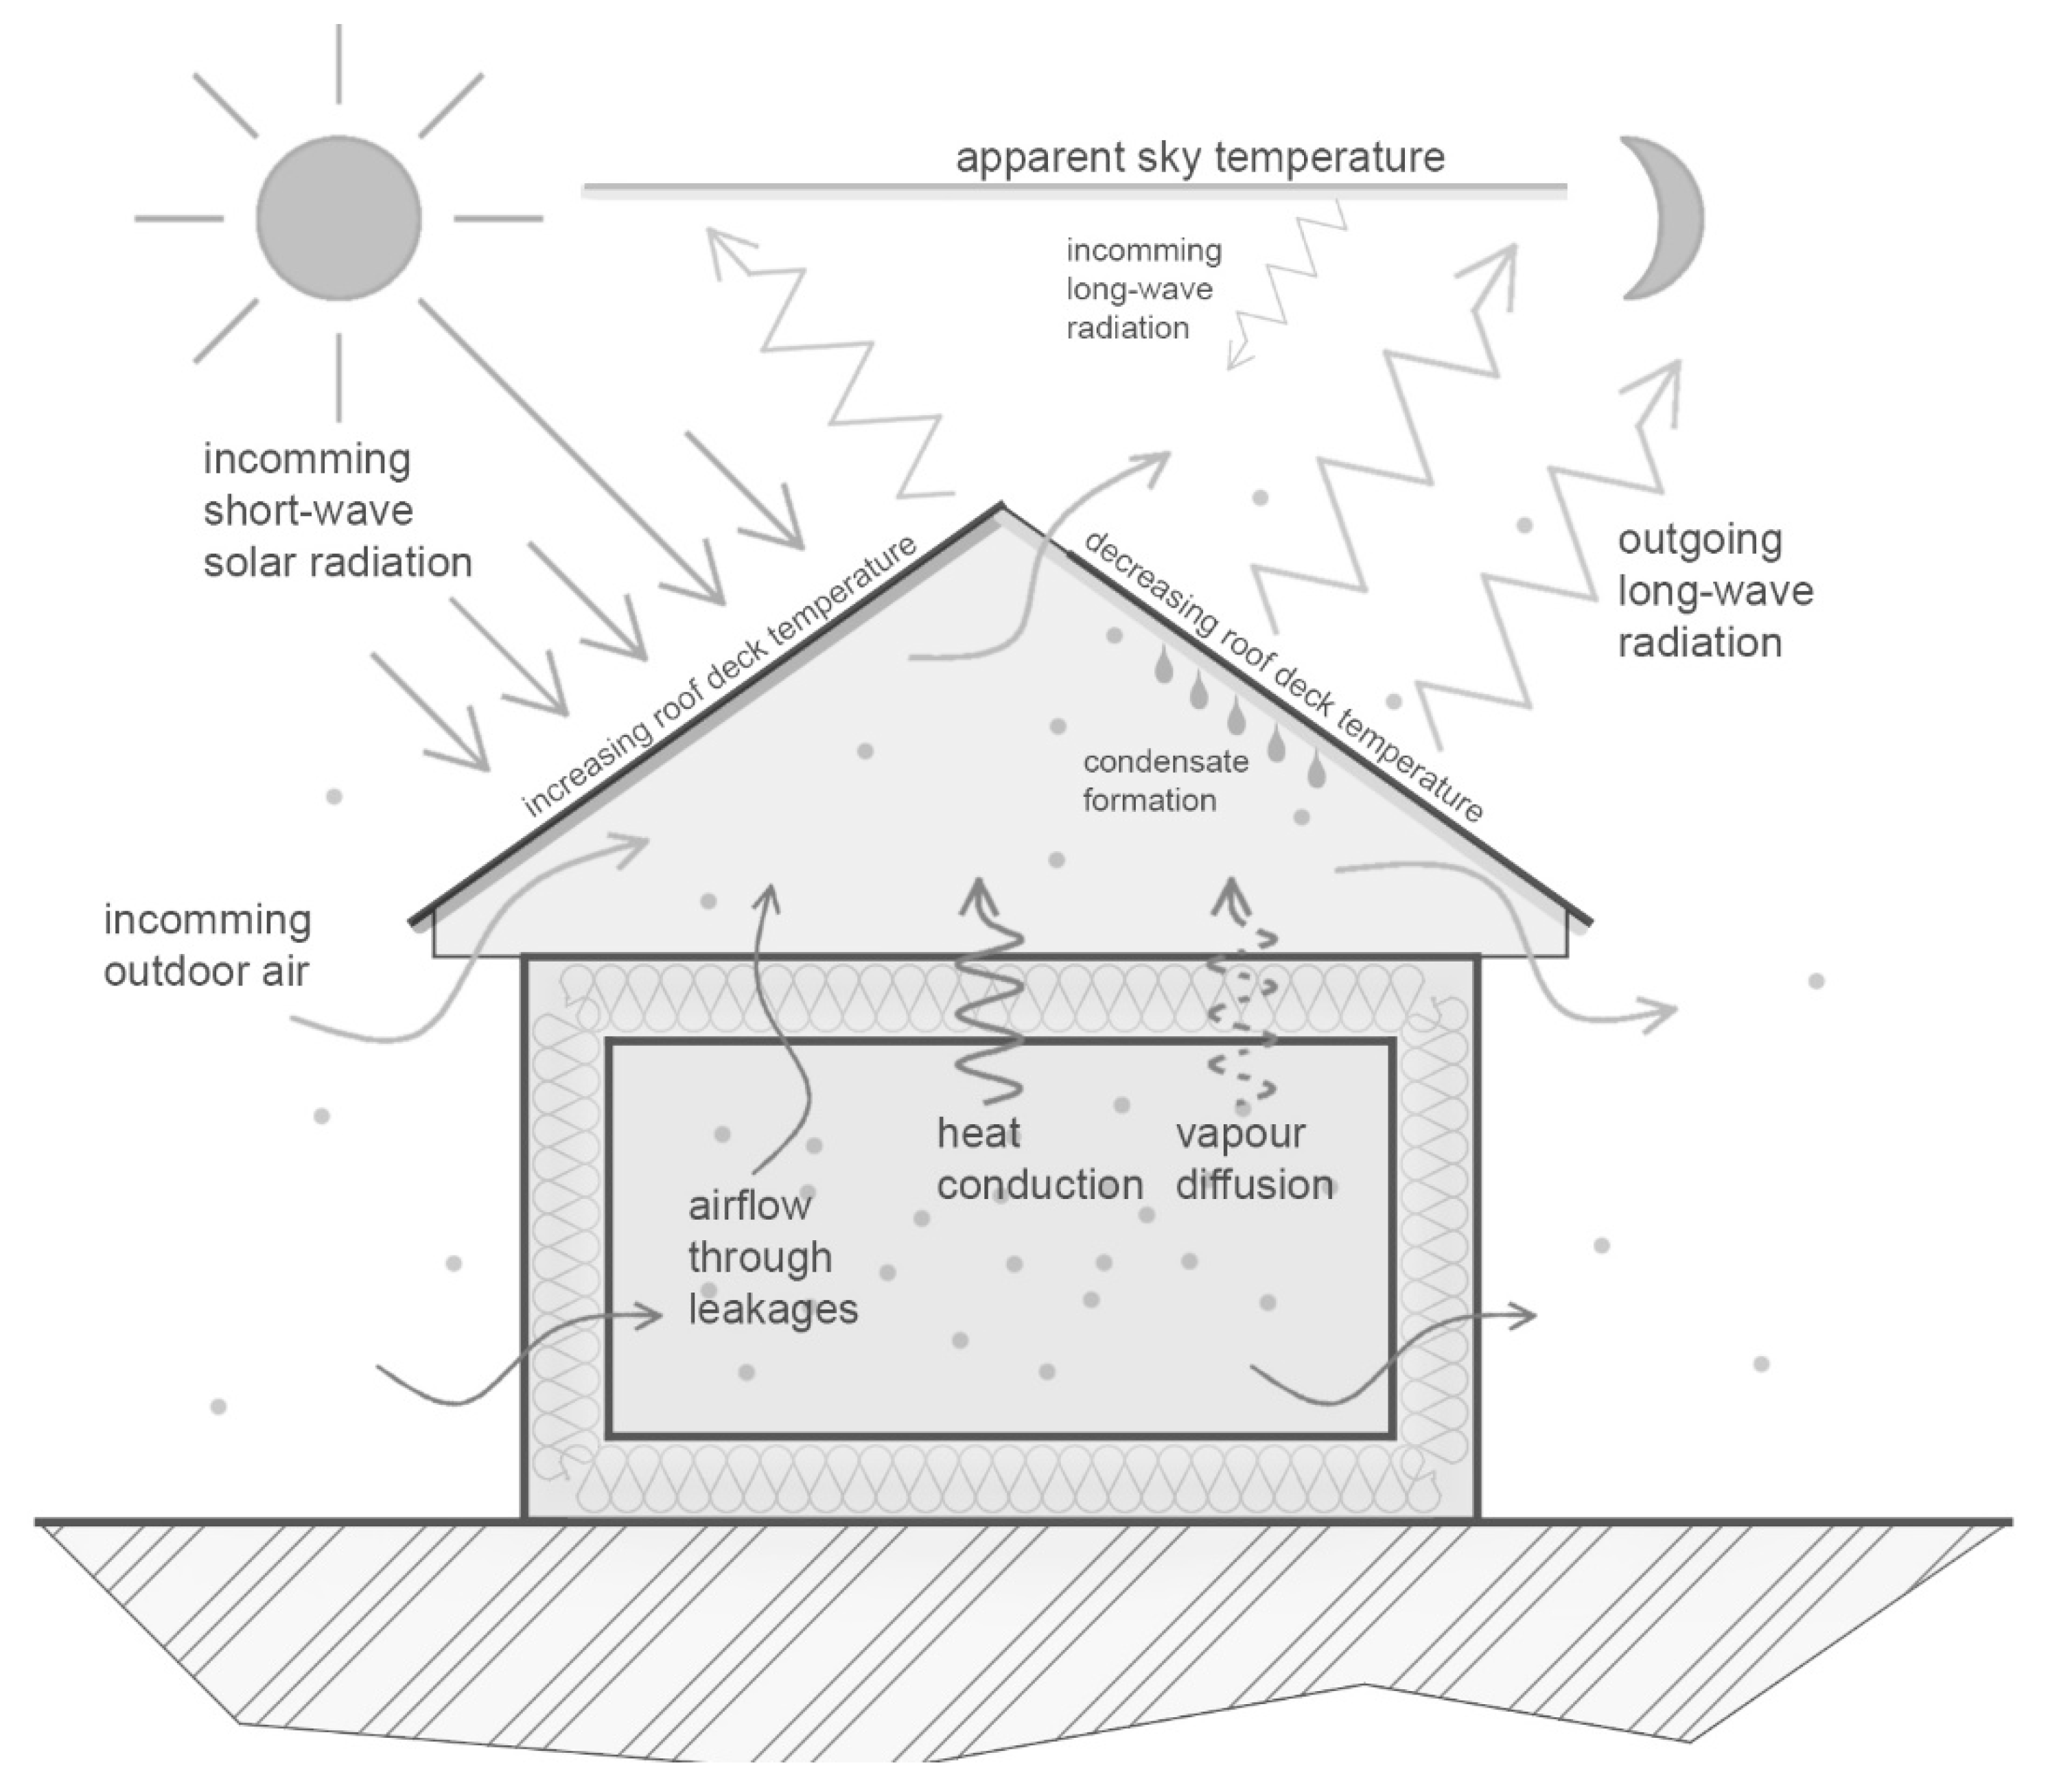
1.4. Causes of Problems and General Measures

The moisture problems of cold attics are related mainly to the high relative humidity on their inner surfaces. Such conditions are caused by a high amount of moisture present within the attic, the low temperature of the surfaces, or a combination of both. An excessive moisture to the attic can be provided by the surrounding environments or by built-in moisture. In the humid climates of Europe and North America, the main potential source of moisture is the air within the interior (living space), which is usually conditioned to ca. 20–24 °C and 30–60% relative humidity throughout the year. The absolute humidity of such a space is usually higher in the cold season compared to the outdoor air (in the Czech Republic, it is about twice the amount). This moisture can be transported into the attic by airflow (convection) and by diffusion (see Figure 5). Since airflow is the dominant mechanism of the two (considering ordinary construction and pressure differences), ceiling airtightness is the most recommended measure for achieving a moisture-safe cold attic [2,5,6,10,17,18,38,39]. The main flow pathways include leakages around attic staircases, electric conduits, ceiling fixtures, and other elements that penetrate the ceiling [3,5,39,40]. Therefore, special care should be taken in sealing these details. However, more than the ceiling’s airtightness determines the airflow across it. The airtightness of the interior and attic envelopes are other important factors, followed by the house and attic geometry, interior ventilation regime, presence of furnace flue, and others (see Figure 5).
Although vapour diffusion is usually much less important in terms of risky moisture input to the attic, it should not be underestimated [10], and an equivalent air layer thickness of the ceiling around 10 m should be retained [17,41]. The most straightforward way to avoid excessive moisture input from the interior into the attic is to use an air-barrier with a sufficiently high vapour-tightness.
Interior air, however, is not the only potential source of excessive moisture for the attic. Particularly in the maritime areas of the target region the outdoor air can contain enough moisture to cause problems within ventilated attics [2,8,9,28,29,42]. The lack of sunshine hours in such areas can further exacerbate these problems [8]. In such cases, the attic is surrounded by two environments, both with a risky amount of moisture (at least for certain time periods). Therefore, not only the ventilation regime but the whole attic design should be taken into account in the design process.
Except for construction imperfections or failures, the last potential moisture source is built-in moisture, which should be avoided or removed directly after erecting the building [14,17]. Attic designs that allow this moisture to be transported out during their operation are preferable.
The second parameter that affects the high surface relative humidity is surface temperature. In terms of inner-attic surfaces, the most critical is the roof deck, which experiences several effects. First, roof (and gable walls) are affected by low outdoor air temperatures before other inner-attic constructions. A more important factor, however, is the effect of longwave sky radiation. As the roof faces the sky, it emits thermal energy to the atmosphere and outer space. The apparent sky temperature (the temperature of an imaginary sky body) can thus be calculated. Under a clear sky, this temperature can be in the order of 10 °C—lower than the temperature of the outdoor air. In this way, the roof deck can be cooled down and experience high levels of relative humidity. If the surface temperature drops below the dew point of the air within the attic, condensation or frost formation (desublimation) takes place. Condensate or melted frost can be absorbed by porous materials or can drop or run down from the roof deck onto the attic floor or into construction joints (see Figure 2). In most cases, this leads to an increase in the moisture content of porous materials, which can cause changes in their mechanical properties or initiate biodegradable processes [43,44]. Longwave sky radiation is present during the whole day but is most evident during clear winter nights since during the clear daytime it is overpowered by incoming solar radiation (see Figure 5).
However, moisture-related problems can occur even without any condensation. Sufficiently high relative humidity in combination with a suitable temperature (and few other factors) for a sufficiently long time period can lead to mould growth [43,44]. Although moulds cannot cause any significant mechanical degradation to the structure, they can prepare suitable conditions for decay fungi or other biodeteriogens [43,45,46,47]. The presence of moulds within the attic also leads to a higher concentration of their spores in the attic air and, consequently, usually also in the interior air, which can cause health problems for the occupants [48,49,50]. These are reasons why mould growth is, along with condensation, usually considered one of the signs of improper hygro-thermal conditions [9,51].
Measures to avoid a low roof-deck’s temperature mainly include an increase of its thermal resistance or using a ventilated roof-deck cavity.

2. Methods

2.1. Selection of Studies and Attic Designs

We searched for studies on the hygro-thermal performance of cold attics in Europe and North America and found 151 relevant scientific papers and technical reports. However, many of these publications were focused only on energy, thermal performance, or modelling, and only 28 dealt with moisture performance [2,3,4,5,6,7,8,9,10,11,12,13,14,15,16,17,18,19,20,21,22,23,24,25,26,27,28,29]. From this set of studies, we further excluded those that did not contain enough information for the intended analysis. Studies had to include at least the location, attic geometry, roof-deck and ceiling assemblies, interior–attic airflow, exterior–attic airflow, and moisture performance of the attic air or roof sheathing for at least 3 months during the critical cold season. If we found more than one study by the same authors with similar results, only one representative was retained. In the end, 10 studies remained [2,3,4,5,6,7,8,9,10,11].
From these studies, we then selected particular attic designs. We sought to cover the widest range of different designs with reasonable limits. If similar designs with similar results related to a single study were found, only one representative was taken. Finally, a set of 31 main and 7 supplementary designs was established (see Table 5). The supplementary designs were not included in the main comparison for different reasons, such as a measurement period that was too short, the application of constant boundary conditions instead of real climate conditions, the use of adaptive ventilation of an attic, and case of an outside standalone roof without an interior space below.

2.2. Table of Attic Designs

Table 5 presents a set of information characterising the selected attic designs. The first column specifies their identification numbers in ascending order according to the year of the study’s publication. The second and third columns list specifications of the original studies and the types of the studies. Types are “E” (experimental setup exposed to local weather), “E–lab” (experimental setup exposed to conditions in a climatic chamber), “C” (a computational study), and “I” (in situ measurements). In the next columns of the table we specify the boundary conditions of the attic designs. The fourth and fifth columns include the location and climate zone classification (according to [36]), while the sixth column specifies the conditions in the interior space below the attic. Columns 7–12 state the design parameters listed in Section 2.3. The last two columns present the “moisture-related consequences” and suggested “moisture-risk level”. The “moisture-related consequences” column provides brief information on the worst moisture or microbiological conditions found within the attic. Studies usually did not state whether the particular design was moisture-safe but usually provided enough information about the attic’s moisture performance. Since such information was provided in many different forms, the stated consequences in the table have different quantities, units, etc. Finally, the “moisture-risk level” presented in the last column represents the level of risk evaluated by the authors of this paper (see Section 2.4 Moisture-risk evaluation).
The attic designs in Table 5 are sorted from top to bottom according to the values of their suggested key parameters (see Section 2.3). The highest priority is the interior–attic air change rate from the lowest to the highest, the second is the vapour permeance of the roof from the most to the least permeable, and the third is the exterior–attic air change rate from the lowest to the highest (see Table 5). Seven supplementary designs are located below the main 31 and are distinguished by cells with grey backgrounds.
None of the studies provided the precise values of all suggested parameters. Therefore, many of these parameters had to be calculated using different assumptions. In Table 5, the values typed in regular black text are the exact values stated in the original study. The values typed in black italics are the values that were calculated directly according to the information presented in the study. For instance, if the study provided an attic floor plan, the floor area was calculated and typed in black italics. Black italics were used also when the values were calculated using commonly-known material properties. Since such values are not precise, they are always accompanied with circa “ca.”. Finally, values that are presented in blue italics were calculated using more complex assumptions, although they are still based on the information provided by the original studies. Most common assumptions are listed in Section 2.3, while others are specified in the footnotes of Table 5. Two values in Table 5 are based only on the author’s best estimations. Such values are accompanied by the word “estimated”.

2.3. Comparative Parameters

Since the moisture balance of the attic is based on moisture transport across its surrounding constructs, the comparative parameters clearly must be the air and vapour permeance of these constructs and the interior–attic and exterior–attic ventilation rates.
In terms of the thermal balance of the attic, the ratio of the thermal resistance of the insulated ceiling construction (at least around 3.3 m2K/W, according to the selected studies) and the ordinary uninsulated roof (ca. 0.3 m2K/W) results—during the cold season—in an attic air temperature around 1–2 °C higher than the outdoor air, even if the attic is unventilated. This was also proven by in situ measurements [1]. Therefore, at least for the selected set of attic designs, the heat transport parameters seem not to be very important for the comparison process. However, few of them are included as illustrative.
Finally, 3 key parameters and 4 less important parameters were suggested. The parameters and reasons for their selection are listed below.

2.3.1. Real Interior–Attic Air Change Rate

As the interior–attic airflow can affect the moisture performance of the attic the most, it should be the first key parameter. However, this parameter cannot be characterized by the ceiling air permeance under the reference pressure difference, since crucial is the real airflow rate under the building operations, which depend, except for ceiling airtightness, on many other factors. The risky interior–attic moisture input is also affected by the volume of the attic—obviously, there will be a higher moisture risk within a volumetrically smaller attic than within a larger one given the same moisture input. Therefore, the first suggested key parameter is the real interior–attic air change rate under the building operation (nint–att (h−1)). This quantity is related to the attic volume instead of the interior volume. In Table 5, we additionally specify the real interior–attic volumetric flux (Qint–att (l/s/m2)) in brackets under the air change rate value.
If the study provided ceiling airtightness only under a specified pressure difference, the “real” value was (in adequate cases) calculated considering an interior overpressure of 4 and 2 Pa for ventilated and unventilated attics, respectively. For this calculation, a power law with the flow exponent L = 0.67 was adopted. Values calculated in this way are accompanied in Table 5 with one star (*) and two stars (**), respectively.

2.3.2. Ceiling Equivalent Air Layer Thickness

Although the interior–attic moisture input by diffusion is much less important compared with the input by airflow, this parameter should not be underestimated. The ceiling equivalent air layer thickness (sd,ceil (m)) was, therefore, chosen as the next parameter in Table 5. If no information about the vapour permeability of the ceiling layers was provided in the study, the calculations were performed using the commonly known material properties. If the ceiling contained an air-barrier (mostly PE foil) as the only dominant vapour-retarding layer, the ceiling sd–value was considered 10 m.

2.3.3. Ceiling Thermal Transmittance

Ceiling thermal transmittance (Uceil (W/m2/K)) was also adopted to characterize the ceiling construction. Value includes the surface heat transfer coefficients on both faces.

2.3.4. Roof-Deck Equivalent Air Layer Thickness

Vapour permeance of the roof can play an important role in an attic’s hygro-thermal performance, especially when the attic is unventilated. The equivalent air layer thickness of the roof (sd,r.deck (m)) was, therefore, considered as the second key parameter. For single-skin roof with asphalt shingles, the value of 200 m was uniformly considered. For double-skin roof with ventilated roof-deck cavities, only the vapour resistance of the lower deck was considered. The sd–value of the underlay foil/felt was commonly specified in the studies. For studies including only the general information that PE foil was used, an sd–value = 10 m was considered. The sd–value of the plywood sheathing of an unspecified thickness was presumed for ca. 80 %RH to be 1.2 m. The spruce roof decking (19 mm) was assumed to have an sd–value = 0.5 m.

2.3.5. Exterior–Attic Air Change Rate (Attic Ventilation Rate)

Ventilation of the attic by outdoor air is usually the most commonly discussed parameter when studying proper cold attic design. Therefore, the attic exterior–attic air change rate under real conditions (next–att (h−1)) is the third key parameter. Due to the various forms of this parameter provided by the original studies, the values presented in Table 5 were calculated using different assumptions, which are mostly described in the footnotes of the table. In relevant cases, the values were stated as averages within the heating season.
For attic ventilation, there is also a well-known ventilation rule of 1:300 (or also 1:150). This rule is based on a study from 1939 [52] and remains satisfactorily useful at present. This rule represents the ratio of the total area of all attic vents to the attic floor area. A ratio of 1:300 should provide enough natural ventilation to keep the attic safe from moisture. In Table 5, we also specify such ratios when enough information was found in the original study. These ratios are presented in curly brackets under the exterior–attic air change rate values.

2.3.6. Presence of a Ventilated Roof-Deck Cavity

A ventilated roof-deck cavity inhibits propagation of extreme temperatures of the upper surface of the roof to its lower surface, and therefore, also prevents the extremes of relative humidity from acting on the lower (inner-attic) surface. The ventilated cavity can also remove the moisture transported from the attic through the lower deck of the roof and can thus play an important role in the overall hygro-thermal performance of the attic. The presence of such cavity is, therefore, the last chosen comparative parameter.

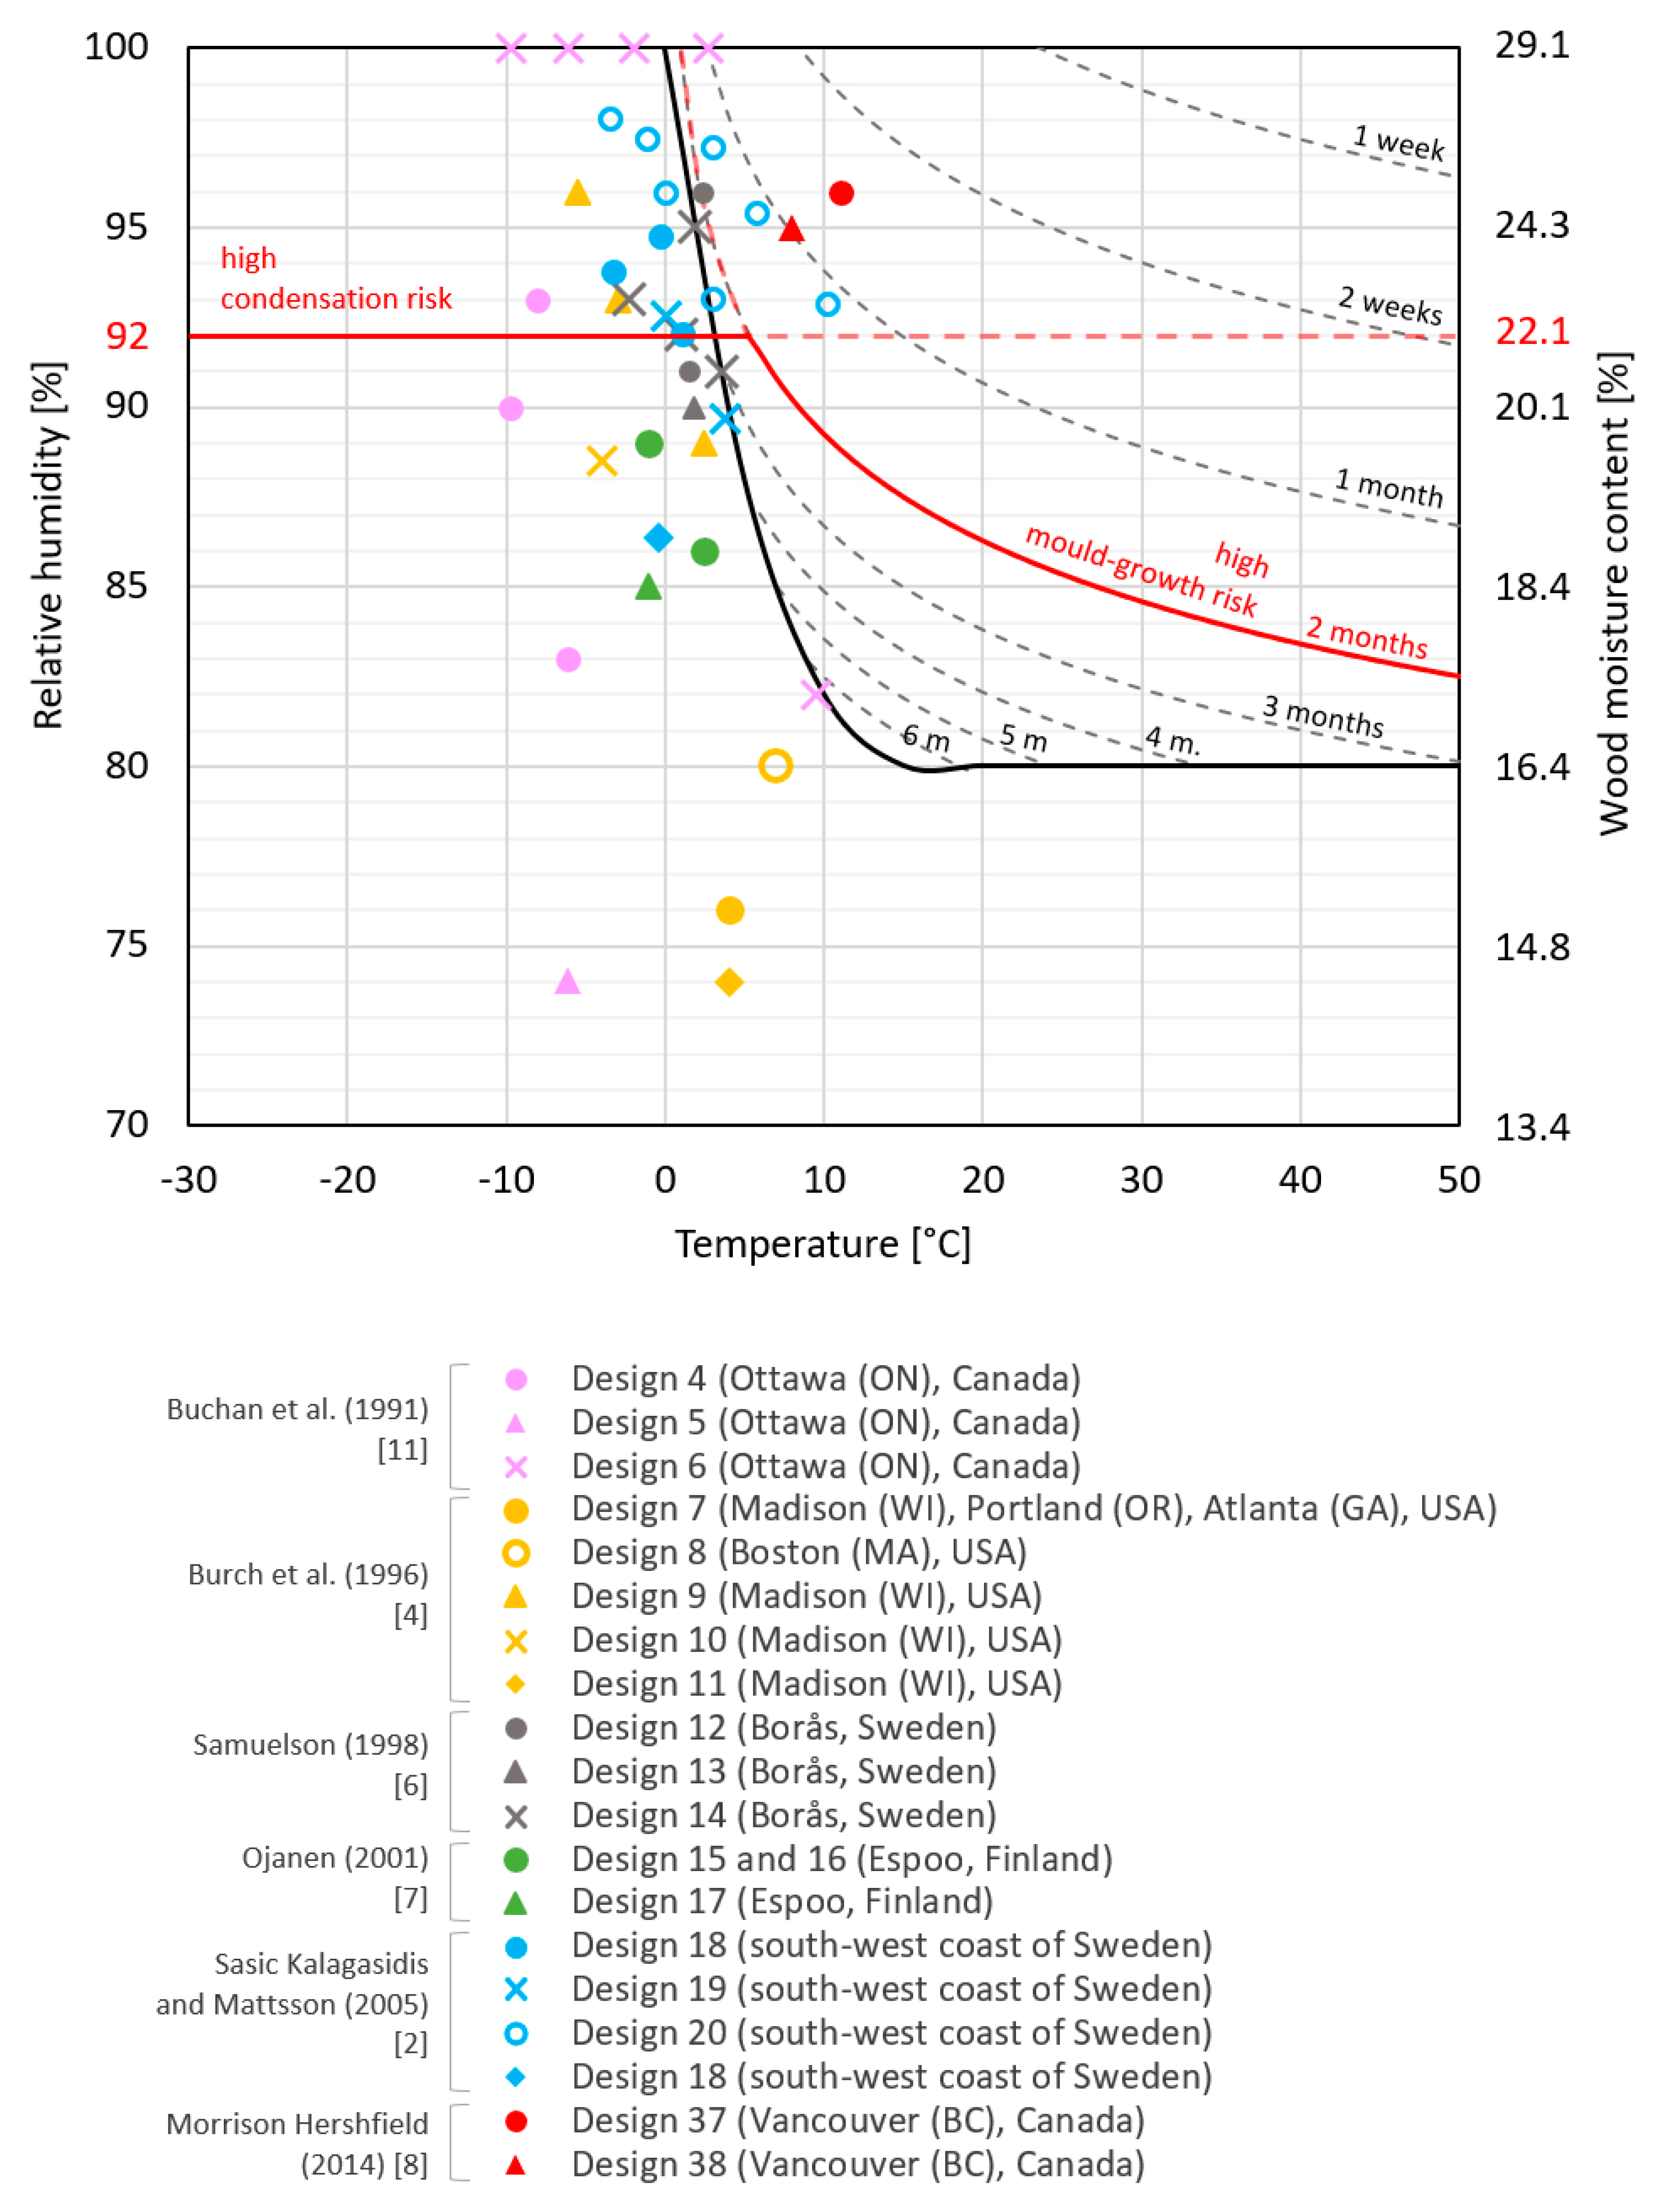
2.4. Moisture-Risk Evaluation

Moisture safeness is essential information when searching for a suitable cold attic design. However, almost none of the selected studies provided this information. Studies presented data on different moisture-related quantities, such as relative humidity, sheathing moisture content, amount of condensate, or mould index, but those are usually not enough in terms of the overall moisture safeness of the attic. Even without any condensation, there is still the possibility of mould growth. Thus, even a design with no reported condensation cannot be considered moisture-safe without providing more information. On the other hand, the mould-growth risk does not exclude condensation or frost formation, especially in periods of temperature below the freezing point where mould growth models usually assume no growth. Although the moisture risk caused by condensation without mould growth is rare, such conditions were reported by in situ measurements in California [53]. A similar situation can occur when condensation takes place on non-biodegradable materials. Then, the condensed water can leak into other constructs potentially causing further biodegradable, mechanical, or visual damage. Therefore both, mould-growth risk and high-condensation risk, should be considered in moisture-risk evaluation processes.
Vereecken et al. [54] summarized the different mould-growth models used in the building physics sector. One of the most commonly used models remains the VTT model [55,56]. Although this model was found not to work satisfactorily in some cases [53,57], in many cases, it gives sufficiently reliable results [58] and has been adopted by many scientists in the field. This model was also adopted by ANSI/ASHRAE [59]. We used the original VTT model [55] as the basis of the proposed moisture-risk evaluation process.
Figure 6 shows the proposed moisture-risk chart. The left axis represents the relative humidity, while the right axis presents the corresponding equilibrium wood moisture content. The relation between the two is determined by the sorption isotherm of spruce wood presented in [60]. The horizontal axis represents the temperature. The centre of the chart features a solid bold black line. This line connects the conditions (combinations of relative humidity and temperature) that are suitable for mould growth if applied for an infinite time period (as suggested by the authors of the VTT model). This line splits the chart into two areas. The area on the top-right includes the conditions suitable for mould growth. The more top and right the conditions are, the shorter the time period for moulds to start grow. The dashed black lines represent conditions for which a mould index equal to 1 (starting spore germination) is reached at the labelled time period. The chart plots datapoints of the worst monthly-averaged conditions found within each attic design. If the datapoint lies on or above the 1-month-period line, the moulds started to grow within this single month and the design is, therefore, labelled as mould-growth risky (see datapoints of designs 37 and 38). To remain cautious, we considered designs to be risky even if their datapoints lay on or above the 2-month-period line (highlighted in red).
The chart also shows a red horizontal line at 92% relative humidity, which equals to equilibrium wood moisture content ca. 22.1%. The area above this line is suggested to be a zone with a high-condensation risk. Although condensation can be present even in attics of lower values of monthly-averaged relative humidity, a limited amount of condensation does not necessarily cause moisture problems. Indeed, we found a value of 92% to be high enough to develop designs whose datapoints that lay above that value as moisture-risky due to condensation.
Into the chart, we plotted the datapoints from 19 main and 1 supplementary design. Designs whose studies reported a mould index or the amount of condensate were not possible to plot. The chart presents at least one datapoint related to one design. However, we attempted to plot all datapoints (the averages of all months) that lay in the risk zones. Thus, in some cases, more datapoints are related to a single design.
The original studies often provided daily, weekly, or monthly averaged courses or moisture-related quantities. The monthly averages were obtained by averaging the values or by the best estimates from the provided charts. If no temperature data were provided, those were estimated using the climate charts of the location according to [61] and by increasing the obtained outdoor temperature by 1 and 2 °C for ventilated and unventilated attic designs, respectively.
We not only evaluated the designs as moisture-safe or -risky but also specified the level of risk. The levels are (0)—moisture-safe and (1–3)—moisture-risky, where the higher the number, the higher the risk. This scale was found to be practical to provide a deeper understanding of the topic. Designs whose worst data points lay below the hi-condensation-risk line and also below the mould-growth-risk line were labelled as moisture-safe (0). Designs whose data points lay above the mould-growth-risk line or above the high-condensation-risk line were stated as at risk of moisture. If only one datapoint was found within the risk zones, the design was labelled as (1). The level of risk was further increased with each additional datapoint found in the risk zones. If the point lay in the intersection of both risk zones, it was labelled as (2). Designs whose datapoints lay on or above the 1-month-period line were labelled as (3).
Designs that were not possible to plot in the chart were those that provide mould indices and sheathing condensation amounts. Designs with a known mould index according to [55] or [56] were sorted into moisture-risk classes as follows: MI < 1 labelled (0), 1 ≤ MI < 2 labelled (1), 2 ≤ MI < 3 labelled (2), and MI ≥ 3 labelled (3). The moisture safeness of studies that provided the amount of condensate on sheathing within a year were evaluated as follows. Since the amount of condensate was usually the annual total, we suggested that one half of it is formed within a short time period. Then, if such an amount was calculated to cause an increase of 2% in the wooden sheathing moisture content, the attic was labelled as risky. If the sheathing was 20 mm thick, the risky amount of condensate was ca. 170 g/m2. Since this value is suggested to be half of the total annual amount, attics with amounts higher than 350 g/m2/year were labelled as (1). Twice the amount indicates risk level (2), and three times the amount equals risk level (3).

2.5. Groups of Similar Attic Designs

To determine whether some attic designs are moisture-safe for the whole target region, one must find several such designs that all perform safely. However, no rule states what designs can be considered mutually similar. For this purpose, we applied the borders of the previously suggested three key parameters to obtain the general groups of attic designs. Table 6 summarizes these groups for the main 31 designs. Each design is represented by its number and its evaluated level of moisture risk in brackets. The suggested ranges of the key parameters comprising the borders between the groups and the reasons for their selection are listed below.

2.5.1. Real Interior–Attic Air Change Rate

Based on the ranges in [9,14,39], the airtightness requirements for passive houses [62], and information from in situ measurements [63], the ranges of the reference interior–attic air change rates were determined to have a 50 Pa pressure difference. Based on this value, we calculated the values for a 4 Pa pressure difference using the power law with a flow exponent of 0.67. The results were the border values of the real air change rates caused by interior–attic air leakage under building operations. Notably, a value of 4 Pa does not indicate that this pressure difference must be present across the ceiling in all buildings under operation—it is just a value adopted to quantify the borders of nint–att. The proposed ranges are given in Table 2.

2.5.2. Roof-Deck Equivalent Air Layer Thickness

The ranges of values of the roof-deck equivalent air layer thickness were determined according to the values found within the selected attic designs. The proposed ranges are given in Table 3.

2.5.3. Exterior–Attic Air Change Rate

The ranges of exterior–attic air change rate were selected according to the values of the selected attic designs and author’s best assumptions. The proposed ranges are given in Table 4.

3. Results

Table 5 shows that among the 31 main designs, seven were implemented using experimental measurements, 4 using in situ measurements, and 20 by numerical computations. The selected designs were tested in 6 countries—the USA, Canada, Sweden, Finland, the United Kingdom, and Germany. Nine of them were located in North America and 22 in Europe, while nine (29% of all designs) were located in Sweden, another nine in the UK, and 13 in other countries. Most of the main designs are located in the Cfb climate zone (20 designs), while 10 are in the Dfb zone and one is in the Cfa zone. However, these designs are often located very close to the border of the two climate zones, so these numbers cannot be considered firm (even less so when taking into account the present climate changes). Twenty-one designs are ventilated while 10 are not.
The range of the real interior–attic air change rate (nint–att) within the main designs is 0–1.25 h−1, with an average value of 0.20 h−1 (related to attic volume). The ceiling equivalent air layer thickness (sd,ceil) is in the range of 0.3–11 m, with average value 6.5 m. The ceiling thermal transmittance is in the range of 0.077–0.24 W/m2/K, with average value of 0.14 W/m2/K (within the main designs). There are large differences in the other parameters depending on whether the attic is unventilated and vapour-permeable or ventilated. Therefore, the average values are not relevant here. The equivalent air layer thickness of the roof (sd,r.deck) is 0.02–200 m, where the lowest value represents the vapour-permeable underlay felt of a double-skin roof with a ventilated cavity, and the highest value represents a roof consisting of wooden boards with roofing paper and asphalt shingles. The range of the exterior attic air change rate (next–att) is 0.1–32 h−1 under building operations. For unventilated attics, this range is generally around 0.1–0.2 h−1 and around 4–18 h−1 for ventilated attics.
In Figure 6 can be seen moisture-risk chart with plotted datapoints of the most unfavourable monthly averaged hygro-thermal conditions found within the selected attic designs. In the chart can be seen datapoints of 19 main and 1 supplementary design. There can be seen 10 moisture-safe and 9 moisture-risky designs. All of the risky designs lay above the high-condensation-risk line, while five of them lay also above the mould-growth-risk line. Datapoint of three designs lay above the 1-month-period line, which makes them highly moisture risky.
In Table 6 can be seen suggested groups of attic designs. The main selected 31 designs are sorted into the groups represented by their identification numbers and, in brackets, their evaluated moisture-risk levels. Most of the designs (17) felt into the group of “heavy” real interior–attic air change rate, 11 in “extremely low” group and 3 into “medium” group, while none of the selected cold attic designs fits into the group of “low” real interior–attic air change rate (see Table 6).

4. Discussion

Table 5 demonstrates that the attic design with no airflow from the interior with a highly vapour-permeable roof and negligible ventilation by outdoor air can perform moisture-safely (designs 31 and 17). Moisture-safe were found also designs with even less vapour-permeable roofs (sd = 0.5 and 1.2 m); (designs 13 and 21). Slightly contradicting can be the design with a variable roof permeability (sd = 0.6–4.6 m) that was found to be highly moisture-risky (design 30). It is, therefore, possible that the critical sd–value lies somewhere in this range. If the roof is even more vapour-tight (sd = 40 m), the moisture risk increases (design 29). However, when the attic becomes ventilated, excessive moisture is removed by less humid outdoor air, and the design behaves safely again (design 28 and 11). This conclusion is not universally true since very similar designs were labelled as risky (designs 14, 12, 24). However, these designs are all located in the south-west of Sweden, which is one of the critical maritime areas.
So far, this discussion focused on designs that have little or no interior–attic airflow. In Table 6, it can be seen that almost none of the selected designs are in the range of the suggested “low” or “medium” interior–attic air change rate. Therefore, the remainder of the discussion is based mostly on designs with a “high” interior–attic air change rate.
When the same ventilated design with a highly vapour-tight roof that was found to be moisture-safe (design 28) has a higher interior–attic air change rate (ca. 0.18 h−1) in the same location, an attic ventilation rate of ca. 3.3 h−1 is no longer sufficient to keep the attic moisture-safe (see design 35). However, when the interior humidity drops from 40–70% within a year (design 35) to 30–60%, ventilation becomes sufficient again (designs 36 and 5). This indicates that keeping the indoor humidity within reasonable limits can be important, particularly when a higher interior–attic airflow is present. Similar design with higher ventilation rate (ca. 9 h−1) was also found to be moisture-safe even with higher interior humidity levels (designs 7, 8, 10, 15). On the other hand, when the ventilation is low, such design are highly moisture-risky (design 9). An unventilated attic with a highly vapour-permeable roof can also be moisture-safe when the same (or an even higher; ca. 0.27 h−1) interior–attic air change rate is present (designs 16 and 32). However, when the attic is located in the south-west of Sweden, it remains moisture-risky whether ventilated or not (designs 23, 20, 18, 19). Nevertheless, even in this area, ventilation helps the attic lower its moisture level to some extent when medium or high interior–attic airflow is present, even though this does not solve the problem completely (compare designs 20, 18, 19). It is also interesting that some of these designs (18 and 19) were found to be risky according to the moisture-risk chart, even though their calculated mould indices are well below the mould-growth value.
Designs with interior–attic air change rates of 0.36 h−1 and higher were found to be moisture-risky regardless of their other design parameters (designs 34, 33, 37, 6, 4, 22). However, up to a ca. 0.4 h−1 interior–attic air change rate, increasing attic ventilation helps lower attic moisture risk, despite not eliminating the risk (design 4).
Based on the designs, it can be confirmed that the maritime areas are more problematic than the inland areas of the target region. Besides the south-west area of Sweden, the south-west coast of Canada also has similar problems with ventilated attics [8,29]. Since North America traditionally uses highly vapour-tight single skin roofs, the authors in [8] noted that it is questionable whether the attics in this area should be ventilated or not, because both options can lead to unfavourable moisture conditions within the attic. Besides in situ measurements in real attics, moisture-risky conditions were also found on a reference standalone roof exposed to outdoor conditions. This roof was moreover insulated to eliminate undercooling of the lower surface by sky radiation. This experiment resulted in visible mould growth on the underside of the sheathing (supplementary design 38). Similarly, by comparing designs 7 and 8 from [4], higher moisture content can be observed for the wooden sheathing in an attic located in Boston (a maritime city) compared to the other three inland areas of the US.
By analysing Table 5, we also found that there is often a thin line between moisture-safe and moisture-risky designs depending on the suggested parameters. This could be one of the reasons why this topic is still not satisfactorily solved and why seemingly the same types of attics located in the same conditions can perform differently.
Table 6 presents the main groups of attic designs according to their real interior–attic air change rates. Among the selected designs, almost none belong to the “low” or “medium” interior–attic air change rate groups. However, since it is almost impossible to achieve the suggested range of an “extremely low” air change rate in building practice, the target should be the “low” or “medium” groups. This gap provides room for possible future investigations.
Studies on the hygro-thermal performance of cold attics were likely performed primarily in areas with historically recorded moisture problems. Therefore, the sample set is possibly not distributed evenly across the whole target region and, consequently, lacks information on non-problematic areas. Nevertheless, the previous analysis of Table 5 seems to answer the main question of this study, even it is bonded with many uncertainties.

5. Conclusions

The goal of this paper was to determine whether it is possible to determine one or more moisture-safe cold attic designs suitable for the humid climates of Europe and North America (see Figure 4). By undertaking a thorough comparison of 38 cold attic designs from 10 studies, it was found that, despite many uncertainties, such a design is likely possible to define.
It can be summarized that if the interior–attic air change rate under building operations is sufficiently low (ca. under 0.18 h−1), all current practice designs (see Figure 1) can be moisture-safe. However, the ventilation of traditional North American cold attics with a single-skin vapour-tight roof should be at least 4 h−1; for this purpose, the ventilation rule of 1:150 seems to work satisfactorily. Common European cold attics are less susceptible for moisture problems thanks to their double-skin roofs with ventilated cavities that inhibit undercooling of the lower skin by sky radiation. The ventilated cavity also inhibits summer overheating and helps prevent ice-dams. If the lower skin of the roof has high vapour resistance (ca. sd > 10 m), the attic should also be ventilated. However, the lower the vapour resistance is, the less ventilation is needed, unless the lower skin is highly vapour-permeable (ca. sd < 0.1 m) and the attic can be moisture-safe even without any ventilation. Thus, in the inland areas of the target region, both ventilated and unventilated cold attic designs can be moisture-safe if the previously stated requirements are met. It also seems that the colder the climate is, the more advantageous the use of a ventilated attic becomes.
The maritime areas of the region are often more humid and have usually fewer sunshine hours, which together lead to higher moisture risk within ventilated cold attics. Even if the ceiling’s construction is sufficiently tight, ventilation using outdoor air can cause moisture problems (i.e., the Vancouver region or south-west Sweden). Therefore, an unventilated attic with vapour permeable roof could be advantageously used in such areas. In the most problematic cases, the design can be combined with an adaptive ventilation system as suggested by studies from Sweden [9,12,35].
It was found that there is a gap in the attic designs tested in previous studies. This gap includes designs with a ca. 0.04–0.18 h−1 interior–attic air change rate under real building operations. Such designs, moreover, seem to be the targets in modern and future building practices. Therefore, we suggest that future studies be focused on these designs.
Although the climate zones could shift in the future, the results of this study should remain valid for the suggested climate zone in the target cultural area.

Author Contributions

Writing—original draft preparation and methodology, J.R.; writing—review and editing, K.S.; writing—review and editing and supervision, J.T.; writing—review and editing, P.K. All authors have read and agreed to the published version of the manuscript.

Funding

This research received no external funding.

Acknowledgments

This work was supported by the Ministry of Education, Youth and Sports within National Sustainability Programme I (NPU I), project No. LO1605—University Centre for Energy Efficient Buildings—Sustainability Phase.

Conflicts of Interest

The authors declare no conflict of interest.

References

  1. Richter, J. Cold Attics in Humid Cold and Temperate Climate. Ph.D. Thesis, Czech Technical University in Prague, Prague, Czech Republic, 2020. [Google Scholar]
  2. Kalagasidis, A.S.; Mattsson, B. Modelling of moisture conditions in a cold Attic space. In Proceedings of the 26th AIVC Conference, Brussels, Belgium, 21–23 September 2005. [Google Scholar]
  3. Rowley, F.B.; Algren, A.B.; Lund, C.E. Condensation of Moisture and its Relation to Building Construction and Operation. In Bulletin of the University of Minnesota; University of Minnesota Digital Conservancy: Minneapolis, MN, USA, 1941; Available online: http://hdl.handle.net/11299/124254 (accessed on 27 July 2020).
  4. Burch, D.M.; Tsongas, G.A.; Walton, G.N. Mathematical Analysis of Practices to Control Moisture in the Roof Cavities of Manufactured Homes, NISTIR 5880; National Institute of Standards and Technology: Gaithersburg, MD, USA, 1996.
  5. Holm, A.; Lengsfeld, K. Hygrothermal Performance of Ventilated Cold Roofs—An Experimental Study. In Proceedings of the 11th Canadian Conference on Building Science and Technology, Banff, AB, Canada, 21–23 March 2007. [Google Scholar]
  6. Samuelson, I. Hygrothermal performance of attics. Therm. Envel. Build. Sci. 1998, 22, 132–145. [Google Scholar] [CrossRef]
  7. Ojanen, T. Thermal and moisture performance of a sealed cold-roof system with a vapor-permeable underlay. In Proceedings of the Exterior Envelopes of Whole Buildings VIII, Clearwater Beach, FL, USA, 2–7 December 2001. [Google Scholar]
  8. Hershfield, M. Attic Ventilation and Moisture Research Study—Final Report; Homeowner Protection Office: Burnaby, BC, Canada, June 2014. Available online: https://www.bchousing.org/research-centre/library/building-science-reports/attic-ventilation-moisture-research-study (accessed on 27 July 2020).
  9. Hagentoft, C.-E.; Sasic Kalagasidis, A.; Nilsson, S.F.; Thorin, M. Mould growth control in cold attics through adaptive ventilation. In Proceedings of the 8th Nordic Symposium on Building Physics, Copenhagen, Denmark, 16–19 June 2008. [Google Scholar]
  10. Essah, E.; Sanders, C.; Baker, P.; Sasic Kalagasidis, A. Condensation and moisture transport in cold roofs: Effects of roof underlay. Build. Res. Inform. 2009, 37, 117–128. [Google Scholar] [CrossRef]
  11. Buchan Lawton Parent Ltd. Survey of Moisture Levels in Attics (No. BLP File No. 2497); Canada Mortgage and Housing Corporation Research Division: Ottawa, ON, Canada, 1991. [Google Scholar]
  12. Hagentoft, C.-E.; Sasic Kalagasidis, A. Mould Growth Control in Cold Attics through Adaptive Ventilation: Validation by Field Measurements. In Proceedings of the 12th International Conference on Performance of the Exterior Envelopes of Whole Buildings, Clearwater Beach, FL, USA, 1–5 December 2010. [Google Scholar]
  13. Essah, E. Domestic cold pitched roofs in the UK—Effects of using different roof insulation materials. Int. J. Vent. 2012, 11, 281–286. [Google Scholar] [CrossRef]
  14. Hagentoft, C.-E.; Sasic Kalagasidis, A. Moisture safe cold attics—Assessment based on risk analyses of performance and cost. In Proceedings of the 10th Nordic Symposium on Building Physics, Lund, Sweden, 15–19 June 2014. [Google Scholar]
  15. Bjarløv, S.P.; Johnston, C.J.; Hansen, M.H. Hygrothermal conditions in cold, north facing attic spaces under the eaves with vapour-open roofing underlay in a cool, temperate climate. Build. Environ. 2016, 95, 272–282. [Google Scholar] [CrossRef]
  16. Hansen, T.; Moeller, E.B. Hygrothermal performance of cold ventilated attics above different horizontal ceiling constructions—Field survey. Build. Environ. 2019, 165. [Google Scholar] [CrossRef]
  17. Uvsløkk, S. Moisture and temperature conditions in cold lofts and risk of mould growth. In Proceedings of the 7th Symposium on Building Physics in the Nordic Countries, Reykjavik, Iceland, 13–15 June 2005. [Google Scholar]
  18. Nielsen, A.; Morelli, M. Measured temperature and moisture conditions in the roof attic of a one-and-a-half story house. Energy Procedia 2017, 132, 789–794. [Google Scholar] [CrossRef]
  19. Arfvidsson, J.; Harderup, L.-E. Moisture Safety in Attics Ventilated by Outdoor Air. In Proceedings of the 7th Symposium on Building Physics in Nordic Countries, Reykjavik, Iceland, 13–15 June 2005. [Google Scholar]
  20. Johansson, P.; Bok, G.; Ekstrand-Tobin, A. Mould Growth in Attics and Crawlspaces. In Proceedings of the 9th Nordic Symposium on Building Physics, Tampere, Finland, 29 May–2 June 2011; pp. 891–898. [Google Scholar]
  21. Desjarlais, A.; Miller, W.; Railkar, S.; Chich, A. Energy and Moisture Performance of Attic Assemblies. In Proceedings of the RCI Building Envelope Technology Symposium, Phoenix, AZ, USA, 22–23 October 2012; pp. 29–38. [Google Scholar]
  22. Nik, M.V.; Sasic Kalagasidis, A.; Kjellström, E. Assessment of hygrothermal performance and mould growth risk in ventilated attics in respect to possible climate changes in Sweden. Build. Environ. 2012, 55, 96–109. [Google Scholar] [CrossRef]
  23. Harderup, L.-E.; Arfvidsson, J. Moisture Safety in Cold Attics with Thick Thermal Insulation. Archit. Eng. 2013, 19, 265–278. [Google Scholar] [CrossRef]
  24. Prahl, D.; Shaffer, M. Moisture Risk in Unvented Attics Due to Air Leakage Paths; U.S. Department of Energy, Energy Efficiency & Renewable Energy: Washington, DC, USA, 2014.
  25. Mundt-Petersen, S.O.; Harderup, L.-E. Predicting hygrothermal performance in cold roofs using a 1D transient heat and moisture calculation tool. Build. Environ. 2015, 90, 215–231. [Google Scholar] [CrossRef]
  26. Kurkinen, K. Case Study of a Cold Attic in a Pitched Roof with Minimal Ventilation. Energy Procedia 2017, 132, 466–471. [Google Scholar] [CrossRef]
  27. Ge, H.; Wang, R.; Baril, D. Field measurements of hygrothermal performance of attics in extreme cold climates. Build. Environ. 2018, 134, 114–130. [Google Scholar] [CrossRef]
  28. Forest, T.W.; Walker, I.S. Attic Ventilation and Moisture. In Final Report Prepared for Canada Mortgage and Housing Corporation; Canada Mortgage and Housing Corporation: Ottawa, ON, Canada, 1993; Available online: ftp://ftp.cmhc-schl.gc.ca/chic-ccdh/Research_Reports-Rapports_de_recherche/Older11/Ca1%20MH%2093A78%20v.%201_w.pdf (accessed on 18 May 2020).
  29. Finch, G.; LePage, R.; Ricketts, L.; Higgins, J.; Dell, M. The Problems with and Solutions for Ventilated Attics. In Proceedings of the 30th RCI International Convention and Trade Show, RCI Inc., San Antonio, TX, USA, 20–25 March 2015; pp. 203–216. Available online: http://rdh.com/wp-content/uploads/2015/05/The-Problems-with-and-Solutions-or-Ventilated-Attics-GFINCH.pdf (accessed on 18 May 2020).
  30. Hens, H. Applied Building Physics: Boundary Conditions, Building Performance and Material Properties, 1st ed.; Ernst & Sohn: Berlin, Germany, 2010; ISBN 9783433029626. [Google Scholar]
  31. Stamisol. Available online: https://www.stamisol.com/en/about-stamisol/history.html (accessed on 18 January 2020).
  32. Janssens, A. Reliable Control of Interstitial Condensation in Light-Weight Roof Systems: Calculation and Assessment Methods. Ph.D. Thesis, KU Leuven, Leuven, Belgium, 1998. [Google Scholar]
  33. Solař, J. Problematika Nadměrné Vlhkosti U Střešních Plášťů Šikmých A Strmých Střech, TZB-Info. 2012. Available online: https://stavba.tzb-info.cz/strechy/8852-problematika-nadmerne-vlhkosti-u-stresnich-plastu-sikmych-a-strmych-strech (accessed on 30 April 2020). (In Czech).
  34. Gullbrekken, L.; Kvande, T.; Jelle, B.P.; Time, B. Norwegian Pitched Roof Defects. Buildings 2016, 6, 24. [Google Scholar] [CrossRef] [Green Version]
  35. Hagentoft, C.-E.; Sasic Kalagasidis, A. Drying potential of cold attic using natural and controlled ventilation in different Swedish climates. Procedia Eng. 2016, 146, 2–7. [Google Scholar] [CrossRef] [Green Version]
  36. Kottek, M.; Grieser, J.; Beck, C.; Rudolf, B.; Rubel, F. World map of the Köppen-Geiger climate classification updated. Meteorol. Z. 2006, 15, 259–263. [Google Scholar] [CrossRef]
  37. Beck, H.E.; Zimmermann, N.E.; McVicar, T.R.; Vergopolan, N.; Berg, A.; Wood, E.F. Present and future Köppen-Geiger climate classification maps at 1-km resolution. Sci. Data 2018, 5, 180214. [Google Scholar] [CrossRef] [PubMed] [Green Version]
  38. Rose, W.B.; TenWolde, A.A. Venting of Attics and Cathedral Ceilings. ASHRAE J. 2002, 44, 26–33. [Google Scholar]
  39. Lstiburek, J. Understanding Attic Ventilation. Build. Sci. Dig. 2006, 102, 1–23. [Google Scholar]
  40. Walker, I.S.; Forest, T.W. Field Measurements of Ventilation Rates in Attics. Build. Environ. 1995, 30, 333–347. [Google Scholar] [CrossRef]
  41. Richter, J. Risk of Condensation in Unheated Attic Spaces. Master’s Thesis, Czech Technical University in Prague, Prague, Czech Republic, 2013. (In Czech). [Google Scholar]
  42. Less, B.; Walker, I.S.; Levinson, R. A Literature Review of Sealed and Insulated Attics—Thermal, Moisture and Energy Performance; LBNL-1006493; Lawrence Berkeley National Lab: Berkeley, CA, USA, 2016. [Google Scholar] [CrossRef] [Green Version]
  43. Adan, O.C.G.; Samson, R.A. Fundamentals of Mould Growth in Indoor Environments and Strategies for Healthy Living; Wageningen Academic Publishers: Wageningen, The Netherlands, 2011; ISBN 978-90-8686-135-4. e-ISBN 978-90-8686-722-6. [Google Scholar] [CrossRef]
  44. Rychtera, M.; Němcová-Machová, B.; Genovová, E. Atmospheric Microbial Corrosion of Technical Materials and Its Prediction; Academia. Edice: Prague, Czech Republic, 1974. (In Czech) [Google Scholar]
  45. Johansson, P. Critical Moisture Conditions for Mould Growth on Building Materials. Ph.D. Thesis, Lund University, Lund, Sweden, 2012. [Google Scholar]
  46. Dix, N.J.; Webster, J. Fungal Ecology; Chapman & Hall: London, UK, 1995; p. 549, ISBN 978-94-010-4299-4 (print) 978-94-011-0693-1 (online). [Google Scholar]
  47. Shigo, A.L. Biological of decay and wood quality. In Biological Transformation of Wood by Microorganisms; Liese, W., Ed.; Springer: Berlin, Germany; New York, NY, USA, 1975; pp. 1–15. [Google Scholar]
  48. Sedlbauer, K. Prediction of Mold Fungus Formation on the Surface of and Inside Building Components. Ph.D. Thesis, Stuttgart University, Stuttgart, Germany, 2001. [Google Scholar]
  49. Platt, S.D.; Martin, C.J.; Hunt, S.M.; Lewis, C.W. Damp housing, mould growth, and symptomatic health state. BMJ 1989, 298, 1673–1678. [Google Scholar] [CrossRef] [Green Version]
  50. Piecková, E.; Jesenská, Z. Microscopic fungi in dwellings and their health implications. Ann. Agric. Environ. Med. 1999, 6, 1–11. [Google Scholar]
  51. Tywoniak, J.; Svoboda, Z.; Matuška, T. ČSN 730540-2—Thermal Protection of Buildings—Section 2: Requirements; Office for Technical Standardization, Metrology and Testing: Prague, Czech Republic, 2011. (In Czech) [Google Scholar]
  52. Rowley, F.B.; Algren, A.B.; Lund, C.E. Condensation of Moisture and its Relation to Building Construction and Operation. ASHRAE Trans. 1939, 44, 1115. [Google Scholar]
  53. Walker, I.S.; Less, B.D. Measured Moisture Performance of Sealed and Insulated Attics with Permeable Insulation in California homes. In Proceedings of the Thermal Performance of the Exterior Envelopes of Buildings XIV, Clearwater Beach, FL, USA, 9–12 December 2019; ASHRAE: Atlanta, GA, USA, 2019; pp. 774–782. [Google Scholar]
  54. Vereecken, E.; Roels, S. Review of mould prediction models and their influence on mould risk evaluation. Build. Environ. 2012, 51, 296–310. [Google Scholar] [CrossRef] [Green Version]
  55. Hukka, A.; Viitanen, H.A. A mathematical model for mould growth on wooden material. Wood Sci. Technol. 1999, 33, 475–485. [Google Scholar] [CrossRef]
  56. Viitanen, H.A.; Ojanen, T. Improved model to predict mold growth in building materials. In Proceeding of the Thermal Performance of the Exterior Envelopes of Whole Buildings, ASHRAE THERM X, Clearwater, FL, USA, 4–8 December 2007. [Google Scholar]
  57. Vereecken, E.; Vanoirbeek, K.; Roels, S. Towards a more thoughtful use of mould prediction models: A critical view on experimental mould growth research. J. Build. Phys. 2015, 39, 102–123. [Google Scholar] [CrossRef]
  58. Glass, S.V.; Gatland, S.D., II; Ueno, K.; Schumacher, C.J. Analysis of Improved Criteria for Mold Growth in ASHRAE Standard 160 by Comparison with Field Observations. In Advances in Hygrothermal Performance of Building Envelopes: Materials, Systems and Simulations; Mukhopadhyaya, P., Fisler, D., Eds.; ASTM STP1599; ASTM International: West Conshohocken, PA, USA, 2017; pp. 1–27. [Google Scholar] [CrossRef]
  59. ANSI/ASHRAE Standard 160-2009. Criteria for Moisture-Control Design Analysis in Buildings; American Society of Heating, Refrigerating and Air-Conditioning Engineers: Atlanta, GA, USA, 2009; Available online: https://www.techstreet.com/standards/ashrae-160-2016?product_id=1939166 (accessed on 27 July 2020).
  60. Ross, R.J. Wood Handbook: Wood as An Engineering Material, General Technical Report FPL–GTR–190; Forest Products Laboratory, USDA: Madison, WI, USA, 2010.
  61. Climate-Data. Available online: https://en.climate-data.org/info/sources/ (accessed on 9 January 2020).
  62. Passive House Institute. Available online: https://passiv.de/en/02_informations/02_passive-house-requirements/02_passive-house-requirements.htm (accessed on 22 January 2020).
  63. Walker, I.S.; Wilson, D.J. Field Validation of Algebraic Equations for Stack and Wind Driven Air Infiltration Calculations. HVAC R Res. J. 1998, 4, 119–139. [Google Scholar] [CrossRef]
  64. National Air Barrier Association. Available online: https://www.naba.ca/air_barriers/materials.php (accessed on 22 January 2020).
Figure 1. Glossary scheme of a cold attic with typical North American and European roof-deck assemblies.
Energies 13 03856 g001
Figure 2. (a) Mould growth on wooden sheathing; (b) droplets of condensate on the PE (polyethylene) underlay foil and wetted mineral wool insulation.
Energies 13 03856 g002
Figure 3. Frost formation on a wooden truss above an improperly sealed crack in the ceiling air- and vapour barrier.
Energies 13 03856 g003
Figure 4. Humid climates of Europe and North America (“Cf” and “Df”) according to the Köppen–Geiger classification and depicting the locations of the selected cold attic designs according to their original studies (roughly redrawn from [36]).
Energies 13 03856 g004
Figure 5. Scheme of heat and moisture transport within a cold attic.
Energies 13 03856 g005
Figure 6. Moisture-risk chart (monthly averages of the worst moisture–temperature conditions within the attic).
Energies 13 03856 g006
Table 1. Köppen–Geiger climate classification (according to [36]).
Main ClimatePrecipitationTemperatureClassification
warm temperatefully humidhot summerCfa
warm temperatefully humidwarm summerCfb
snowfully humidhot summerDfa
snowfully humidwarm summerDfb
snowfully humidcool summerDfc
Table 2. Classes of the real interior–attic air change rate.
Classnint–att (h−1)
extremely low leakage0.00–0.04
low leakage0.04–0.10
medium leakage0.10–0.18
high leakage>0.18
Table 3. Classes of the roof-deck equivalent air layer thickness.
Classsd,r.deck (m)
vap.-permeable0.02–0.3
vap.-medium-permeable0.6–2.6
vap.-tight≥10
Table 4. Classes of the exterior–attic air change rate.
Classnext–att (h−1)
unventilated attic0.0–0.3
slightly ventilated attic0.6–3.3
ventilated attic≥4
Table 5. Table of the attic designs.
Design No.StudyStudy TypeAttic Location
and Period of Test (If Provided)
Köppen–Geiger Climate Class. According to [33]Interior ConditionsAttic Design ParametersMoisture-Related
Consequences
Moisture-Risk Level
nint–att
(h−1)
(Qint–att)
(l/s/m2)
sd,ceil
(m)
Uceil
(W/m2/K)
sd_r.deck
(m)
Presence of Roof-Deck
Cavity. Y—yes, N – no
next–att
(h−1)
{Ventilation Ratio}
31Essah et al. (2009) [10]CUnited KingdomCfb20–25 °C
40–70 %RH
(according to high occupancy in the mentioned standard)
n50 = 5 h−1
(1 year sim.)
0ca. 0.5 #eca. 0.150.02Yestimated
ca 0.1
no intentional openings
(the roof leakage flow rate is several orders of magnitude lower than intentional ventilation)
2 kg/year
of condensate on the attic underlay
(ca. 26 g/m2/year)
(0)
13Samuelson (1998) [6]EBorås, Sweden
(1994–1995)
Cfbca. 17–24 °C
31–55 %RH
(1 year meas.)
0ca. 100.077ca. 1.2Yca. 0.2 #a
unventilated
max monthly avg.
RH = 90 %
(1.8 °C)
(December)
(0)
14Samuelson (1998) [6]EBorås, Sweden
(1994–1995)
Cfbca. 17–24 °C
31–55 %RH
(1 year meas.)
0ca. 100.077ca. 1.2Yca. 32 ***
natural eave ventilation
{ca. 1:84}
max monthly avg.
RH = 95 %
(1.9 °C)
(December)
(2)
21Sasic Kalagasidis and Mattsson (2005) [2]CSouth-west coastal area of Sweden
(wind exposure—city)
Cfb22 °C
40–70 %RH
(1 year sim.)
exhaust—supply vent. (out 120 m3/h — in 90%)
0ca. 11ca. 0.077ca. 0.6Ymean
0.1
(unventilated design)
Mould index
= 0.001 #,#d
(four year simulation)
(0)
30Essah et al. (2009) [10]CUnited KingdomCfb20–25 °C
40–70 %RH
(according to high occupancy in the mentioned standard)
n50 = 5 h−1
(1 year sim.)
0ca. 0.5 #eca. 0.15moisture dependent 0.6–4.6Yestimated
ca 0.1
no intentional openings
(the roof leakage flow rate is several orders of magnitude lower than intentional ventilation)
66 kg/year
of condensate on the attic underlay
(ca. 870 g/m2/year)
(2)
12Samuelson (1998) [6]EBorås, Sweden
(1994 – 1995)
Cfbca. 17–24 °C
31–55 %RH
(1 year meas.)
0ca. 100.077ca. 10Ymechanical
2 h−1
max monthly avg.
RH = 96 %
(2.4 °C)
(December)
(2)
24Hagentoft et al. (2008) [9]CGothenburg region, SwedenCfb30–60 %RH;
— balanced ventilation
(1 year sim.)
0ca. 10ca. 0.10ca. 12Yca. 22 ***
(130 h−1 at 50 Pa p. dif.)
Mould index = 1.35 #
(total of
11 weeks in 90–100 %RH
and 0–5 °C;
5 weeks in 80–90 %RH
and 5–15 °C;
3 weeks in 70–80 %RH
and above 15 °C)
(1)
29Essah et al. (2009) [10]CUnited KingdomCfb20–25 °C
40–70 %RH
(according to high occupancy in the mentioned standard)
n50 = 5 h−1
(1 year sim.)
0ca. 0.5 #eca. 0.1540Yestimated
ca 0.1
no intentional openings
(roof leakage flow rate is several orders of magnitude lower than intentional ventilation)
83 kg/year
of condensate on the attic underlay
(ca. 1100 g/m2/year)
(3)
28Essah et al. (2009) [10]CUnited KingdomCfb20–25 °C
40–70 %RH
(according to high occupancy in the mentioned standard)
n50 = 5 h−1
(1 year sim.)
0ca. 0.5 #eca. 0.1540Yca. 4.6 #k
{ca. 1:170}
(28 h−1 at 50 Pa p.dif.)
(20 mm openings along the eaves)
0 kg/year
of condensate on the attic underlay
(0)
11Burch et al. (1996) [4]CMadison (WI),
USA
Dfb20–24 °C
ca. 20–60%
(1 year sim.)
0ca. 2.6ca. 0.24ca. 200Nca. 9 #b
{1:300}
Highest weekly
avg. MC of north roof sheathing (within 1 year sim.)
= 14%
(0)
17Ojanen (2001) [7]EEspoo, Finland
(1998 – 1999)
Dfb22 °C
ca. 35 %RH
(6 month meas.)
20Pa interior overpress.
ca. 0.001 **
(ca. 0.0002 **)
ca. 10ca. 0.15ca. 0.02Yca. 0.1 #i
(no intentional vents)
max weekly
MC = 18%
(6 months meas.)
(0)
5
Buchan et al. (1991) [11]
IOttawa (ON), CanadaDfb18–24 °C
40–60 %RH
ca. 0.11
(ca. 0.03)
ca. 0.4ca. 0.19ca. 200Nca. 3
{1:490}
max weekly averaged MC = 15.5%(0)
35Essah et al. (2009) [10]CUnited KingdomCfb20–25 °C
40–70 %RH
(according to high occupancy in the mentioned standard)
n50 = 2 h−1
(1 year sim.)
0.18 *
(0.05 *)
ca. 10ca. 0.1540Yca. 3.3 #k
{ca. 1:340}
(ca. 20 h−1 at 50 Pa p.dif.)
(10 mm openings along the eaves)
43 kg/year
of condensate on the attic underlay
(ca. 560 g/m2/year)
(1)
36Essah et al. (2009) [10]CUnited KingdomCfb20–25 °C
30–60 %RH
(according to normal occupancy in the mentioned standard)
n50 = 2 h−1
(1 year sim.)
0.18 *
(0.05 *)
ca. 10ca. 0.1540Yca. 3.3 #k
{ca. 1:340}
(ca. 20 h−1 at 50 Pa p.dif.)
(10 mm openings along the eaves)
4 kg/year
of condensate on the attic underlay
(ca. 53 g/m2/year)
(0)
16Ojanen (2001) [7]EEspoo, Finland
(1998–1999)
Dfb22 °C
ca. 35 %RH
(1 year meas.)
(simulated moisture gain by water vessel within the attic)
Simulated by moisture source
0.19#m
(0.04)#m
real.
ca. 0.001 **
(ca. 0.0002 **)
ca. 10ca. 0.15ca. 0.02Yca 0.1 #i
(no intentional vents)
max weekly
MC = 21%
(1 year meas.)
(0)
15Ojanen (2001) [7]EEspoo, Finland
(1998–1999)
Dfb22 °C
ca. 35 %RH
(1 year meas.)
(simulated moisture gain by water vessel within attic)
Simulated by moisture source
0.19#m
(0.04)#m
real.
ca. 0.001 **
(ca. 0.0002 **)
ca. 10ca. 0.15ca. 10Yca. 10#a
natural eaves (+ridge)
max weekly
MC = 21%
(1 year meas.)
(0)
9Burch et al. (1996) [4]CMadison (WI),
USA
Dfb20–24 °C
ca. 20–60%
(1 year sim.)
ca. 0.21#g
(ca.
0.016#g)
ca. 2.6ca. 0.24ca. 200Nca. 1 #b
by leakages
highest weekly
avg. MC of north roof sheathing (within 1 year sim.)
= 28%
(2)
7Burch et al. (1996) [4]CMadison (WI),
Portland (OR), Atlanta (GA);
USA
Csb
Cfa
Dfb
20–24 °C
ca. 20–60%
(1 year sim.)
ca. 0.21#g
(ca.
0.016#g)
ca. 2.6ca. 0.24ca. 200Nca. 9 #b
{1:300}
highest weekly
avg. MC of north roof sheathing (within 1 year sim.)
= 16%
(0)
8Burch et al. (1996) [4]CBoston (MA);
USA
Dfb20–24 °C
ca. 20–60%
(1 year sim.)
ca. 0.21#g
(ca.
0.016#g)
ca. 2.6ca. 0.24ca. 200Nca. 9 #b
{1:300}
highest weekly
avg. MC of north roof sheathing (within 1 year sim.)
= 18%
(0)
10Burch et al. (1996) [4]CMadison
(WI),
USA
Dfb20–24 °C
ca. 45–60%
(1 year sim.)
ca. 0.21#g
(ca.
0.016#g)
ca. 2.6ca. 0.24ca. 200Nca. 9 #b
{1:300}
highest weekly
avg. MC of north roof sheathing (within 1 year sim.)
= 25%
(0)
23Hagentoft et al. (2008) [9]CGothenburg region, SwedenCfb30–60 %RH;
— balanced ventilation
(1 year sim.)
0.22
(0.06)
(annual average)
ca. 10ca. 0.10ca. 12Yca. 22 ***
(130 h−1 at 50 Pa p. dif.)
Mould index
= 3.24 #
(total of
12 weeks in 90–100 %RH
and 0–5 °C;
6 weeks in 80–90 %RH
and 5–15 °C;
3 weeks in 70–80 %RH
and above 15 °C)
(3)
20Sasic Kalagasidis and Mattsson (2005) [2]CSouth-west coastal area of Sweden
(wind exposure — city)
Cfb22 °C
40–70 %RH
(1 year sim.)
exhaust—supply ventilation (out 120 m3/h — in 90%)
ca. 0.25 #j
(ca. 0.08)
(heating season avg.)
ca. 11ca. 0.077ca. 0.6Ymean
0.1
(unventilated design)
Mould index
= 4.9 #,#d
(four year simulation)
(3)
18Sasic Kalagasidis and Mattsson (2005) [2]CSouth-west coastal area of Sweden
(wind exposure — city)
Cfb22 °C
40–70 %RH
(1 year sim.)
exhaust—supply ventilation (out 120 m3/h — in 90%)
ca. 0.25#j
(ca. 0.08)
(heating season avg.)
ca. 11ca. 0.077ca. 0.6Ymean 2.2
(natural eave ventilation)
total of
15 weeks in 90–100 %RH
and 0–10 °C;
4 weeks in 80–90 %RH
and 0–10 °C;
1.8 weeks in 80–90 %RH
and 10–20 °C
Mould index
= 0.25 #,#d
(four year simulation)
(2)
19Sasic Kalagasidis and Mattsson (2005) [2]CSouth-west coastal area of Sweden
(wind exposure — open area)
Cfb
22 °C
40–70 %RH
(1 year sim.)
exhaust—supply ventilation (out 120 m3/h — in 90%)
ca. 0.25#j
(ca. 0.08)
(heating season avg.)
ca. 11ca. 0.077ca. 0.6Ymean 13.9
(natural eave ventilation)
total of
11 weeks in 90–100 %RH
and 0–10 °C;
7 weeks in 80–90 %RH
and 0–10 °C;
4 weeks in 80–90 %RH
and 10–20 °C
Mould index
= 0.33#,#d
(four year simulation)
(1)
32Essah et al. (2009) [10]CUnited KingdomCfb20–25 °C
40–70 %RH
(according to high occupancy in mentioned standard)
n50 = 5 h−1
(1 year sim.)
0.27 **
(0.07 **)
ca. 0.5 #eca. 0.150.02Yestimated
ca 0.1
no intentional openings
(roof leakage flow rate is several orders of magnitude lower than intentional ventilation)
17 kg/year
of condensate on the attic underlay
(ca. 220 g/m2/year)
(0)
34Essah et al. (2009) [10]CUnited KingdomCfb20–25 °C
40–70 %RH
(according to high occupancy in the mentioned standard)
n50 = 5 h−1
(1 year sim.)
0.36 *
(0.1 *)
ca. 0.5 #eca. 0.150.02Yca. 4.6 #k
{ca. 1:170}
(28 h−1 at 50 Pa p.dif.)
(20 mm openings along the eaves)
175 kg/year
of condensate on the roof underlay
(ca. 2300 g/m2/year)
(3)
33Essah et al. (2009) [10]CUnited KingdomCfb20–25 °C
40–70 %RH
(according to high occupancy in the mentioned standard)
n50 = 5 h−1
(1 year sim.)
0.36 *
(0.1*)
ca. 0.5 #eca. 0.1540Yca. 4.6 #k
{ca. 1:170}
(28 h−1 at 50 Pa p.dif.)
(20 mm openings along the eaves)
207 kg/year
of condensate on the attic underlay
(ca. 2700 g/m2/year)
(3)
37Morrison Hershfield (2014) [8]IVancouver (BC), Canada
(2011/2012)
Cfb24.1 °C
30.7 %RH
(winter 2011/2012 averages)
ca. 0.38
(ca. 0.11)
ca. 10.5ca. 0.12ca. 200Navg. 4.5
ca. 1 - 8
(depending on measurement method)
{1:232}
baffle vents
Mould index
= ca. 4 #
(observed and also calculated),
worst weekly combination of temperature and moisture content of east sheathing was ca. 13 °C; 25 %MC
(3)
6Buchan et al. (1991) [11]IOttawa (ON), CanadaDfb18–21 °C
40–60 %RH
ca. 0.66
(ca. 0.18)
ca. 0.3ca. 0.28ca. 200Nca. 4.4
{1:250}
max weekly averaged MC = 70.0%(3)
4Buchan et al. (1991) [11]IOttawa (ON), CanadaDfb18–23 °C
30–50 %RH
ca. 0.70
(ca. 0.15)
ca. 0.5ca. 0.17ca. 200Nca. 11
{1:180}
max weekly averaged MC = 23.5%(1)
22Holm and Lengsfeld (2007) [5]EHolzkirchen
Germany
(12/2003)
Cfb20–22 °C
50–60 %RH
(3 months meas.)
1.25
(0.16)
ca. 10estimated
ca. 0.13
0.22Y
(non-continuous cavity)
ca. 18***
{ca. 1:154}
3 mm eave openings and 20 mm ridge opening
At 11 time points (from Jan. to March), a total of 138 g of condensate was wiped from an area of 0.06 m2 of the underlay foil
(i.e., 2300 g/m2)
maximum of a single wiping was
ca. 30 g/0.06m2
(i.e., 500 g/m2),
measured moisture contents of wooden rafters – in weekly averages ca.
23 %MC in 4 °C;
22 %MC in 5 °C;
19 %MC in 8 °C;
(3)
3Rowley et al. (1941) [3]E–lab.Conditioned chamber−21 °C (condi.chamb.)constant.
21 °C
40 %RH
(5 days meas.)
ca. 0.05 **
(ca. 0.019 **)
ca. 0.3ca. 0.52ca. 200Nca 0.3 #a
by leakages
(no vents)
ca. 52 g/m2/24h
of condensate on underlay sheathing
-
2Rowley et al. (1941) [3]E–lab.Conditioned chamber−21 °C
(condi.chamb.)
constant.
21 °C
40 %RH
(6 days meas.)
ca. 0.08 *
(ca. 0.03 *)
ca. 0.3ca. 0.52ca. 200Nca. 4 #a
{ca. 1:98}
ca. 12 g/m2/24h
of condensate on underlay sheathing
-
1Rowley et al. (1941) [3]E–lab.Conditioned chamber−21 °C
(condi.chamber)
constant.
21 °C
40 %RH
(ca. 2 day meas.)
ca. 0.37 *
(ca. 0.14 *)
ca. 0.2ca. 0.52ca. 200Nca. 3 #a
{ca. 1:98}
avg. ca. 75 g/m2/24 h
of condensate on underlay sheathing
-
27Hagentoft et al. (2008) [9]CGothenburg region, SwedenCfb30–60 %RH;
— balanced ventilation
(1 year sim.)
0ca. 10ca. 0.10ca. 12Yca. 0.6#f
+ 1 h−1 when adaptive ventilation is running
(unintentional 7 h−1 at 50 Pa p. dif.)
Mould index = 0.00#
(total of
0 weeks in 90–100 %RH
and 0–5 °C;
0 weeks in 80–90 %RH
and 5–15 °C;
0 weeks in 70–80 %RH
and above 15 °C)
(0)
25Hagentoft et al. (2008) [9]CGothenburg region, SwedenCfb30–60 %RH;
— balanced ventilation
(1 year sim.)
ca. 0.1 #c
(ca. 0.03#c)
(annual average)
ca. 10ca. 0.10ca. 12Yca. 0.1#f
+ 1 h−1 when adaptive ventilation is running
(unintentional 1 h−1 at 50 Pa p. dif.)
Mould index = 1.03#
(total of
8 weeks in 90–100 %RH
and 0–5 °C;
2 weeks in 80–90 %RH
and 5–15 °C;
0 weeks in 70–80 %RH
and above 15 °C)
(1)
26Hagentoft et al. (2008) [9]CGothenburg region, SwedenCfb30–60 %RH;
— balanced ventilation
(1 year sim.)
ca. 0.1 #c
(ca. 0.03#c)
(annual average)
ca. 10ca. 0.10ca. 12Yca. 0.1#f
+ 5 h−1 when adaptive ventilation is running
(unintentional 1 h−1 at 50 Pa p. dif.)
Mould index = 0.02#
(total of
1 weeks in 90–100 %RH
and 0–5 °C;
0 weeks in 80–90 %RH
and 5–15 °C;
0 weeks in 70–80 %RH
and above 15 °C)
(0)
38Morrison Hershfield (2014) [8]IVancouver (BC),
Canada
(2011/2012)
Cfbexterior conditions
ca. 3–10 °C; 80–95 %RH
no ceiling (roof deck exposed to outdoor cond.)no ceiling
(roof deck exposed to outdoor cond.)
no ceiling (roof deck exposed to outdoor cond.)ca. 200Nfully ventilated (roof deck exposed to outdoor cond.)Mould index
= ca. 4#
(observed and also calculated),
worst weekly combination of temperature and moisture content of east sheathing was ca. 9 °C; 24 %MC
(3)
Text style and colour:
black regular—values stated sharply in original study
black italics—values calculated directly based on information in original study, or values calculated using common material properties
blue italics—values calculated by combining information from original studies and a set of other assumptions (better specified in chapter “Methods” or by note in their upper index)
bold—values of the suggested three key parameters
Cell background colour:
green—refers to the moisture-risk level (0)
yellow—refers to the moisture-risk level (1)
pink–lab—refers to the moisture-risk level (2)
red—refers to the moisture-risk level (3)
grey—grey backgrounded are cells with 7 supplementary designs that are not included in the main comparison of the rest 31 main designs
Study type:
C—computational study
E—experimental study
E–lab—experimental study under laboratory conditions
I—in situ measurement
Parameters:
nint–att—real interior–attic air change rate under operations (experimental, real, or numerically simulated, related to attic volume) (h−1)
Qint–att—real volumetric flux across the ceiling construction under operation (experimental, real, or numerically simulated) (l/s/m2)
sd,ceil—equivalent air layer thickness of the ceiling construction (m)
Uceil—thermal transmittance of the ceiling construction (W/m2/K)
sd_r.deck—equivalent air layer thickness of the roof (m)
presence of r.deck cavity—Y (yes), N (no)
next–att—real attic air change rate by ventilation with outdoor air (h−1)
{vent. ratio}—ratio of the total area of attic ventilation openings and attic floor area (supplementary information based on the well-known 1:300 rule for attic ventilation)
Moisture-risk level—level of moisture risk: (0)—no risk (green background); (1)—low risk (yellow background); (2)—medium risk (pink background); (3)—high risk (red background)
Other:
MC—moisture content (%)
Notes:
#—according to VTT mould growth model (1999) [55]
*—values calculated for 4 Pa interior overpressure using the power law with the exponent 0.67
**—values calculated for 2 Pa interior overpressure using the power law with the exponent 0.67
***—Air change is calculated for wind speed of 2.5 m/s and wind pressure coefficients (0.25) and (−0.5) on the opposite sides (thus, the total pressure difference across the opposite attic vents is 2.8 Pa). The pressure difference across the inlet openings is assumed to be half of the value (1.4 Pa). For orifice flow, the discharge coefficient is considered as 0.6, the flow exponent is 0.5, and the air density is 1.21 kg/m3. Then, the airflow (m3/s) is ca. 0.9 times the opening area (m2).
#a—estimated according to the specified ventilation regime and values of other studies considering the particular experimental design of each study
#b—evaluated for wind speed of 2.5 m/s according to the chart provided in the study
#c—annual average of ceiling leakage is quantified only for unventilated attics; for well-sealed attics, we consider ca. half the values of unventilated attics
#d—calculated by the authors of this paper using data provided by prof. Sasic Kalagasidis (the VTT mould growth model (1999) [55] was used for calculation)
#e—no information on the vapour barrier was found within the study
#f—calculated using the power law with a flow exponent of 0.67 and a pressure difference of 1.4 Pa (corresponding to the surrounding wind speed of ca. 2.5 m/s; see note ***)
#g—based on the many data provided in this study (since the main set of provided equations was found to be incorrect)
#h—based on the assembly specifications and determined air permeance values for air-barriers without any joints [64]
#i—calculated based on the provided air-permeability data of the underlay, multiplying the value by 3x and using the power law with a flow exponent of 0.67 and a pressure difference of 1.4 Pa
#j—evaluated based on the chart provided within the study
#k—calculated based on the stated air change rate at a 50 Pa pressure difference using the orifice flow equation for the 1.4 Pa pressure difference (see note ***)
#l—calculated based on the set of equations provided within the original study (the building air change rate = 5 or 2 h−1; parameter b = 0.25)
#m—Based on 1 g/h/m2 (of the ceiling area) being provided to the attic (an interior 7 g/m3 concentration of water vapour was considered).
Table 6. Table of suggested attic design groups with the 31 main attic designs.
Real Interior–Attic Air Change Rate ClassRoof-Deck Vapour Permeance ClassExterior–Attic Air Change Rate ClassAttic Design No. and Evaluated Moisture Risk (in Brackets)
extremely lowpermeableunventilated17(0), 31(0)
slightly ventilated
ventilated
medium permeableunventilated13(0), 30(2), 21(0)
slightly ventilated
ventilated14(2)
vapour-tightunventilated29(3)
slightly ventilated12(2)
ventilated11(0), 28(0), 24(1)
low permeableunventilated
slightly ventilated
ventilated
medium permeableunventilated
slightly ventilated
ventilated
vapour-tightunventilated
slightly ventilated
ventilated
medium permeableunventilated
slightly ventilated
ventilated
medium permeableunventilated
slightly ventilated
ventilated
vapour-tightunventilated
slightly ventilated36(0), 5(0), 35(1)
ventilated
heavypermeableunventilated16(0), 32(0)
slightly ventilated
ventilated34(3), 22(3)
medium permeableunventilated20(3)
slightly ventilated18(2)
ventilated19(1)
vapour-tightunventilated
slightly ventilated9(2)
ventilated7(0), 8(0), 10(0), 15(0), 4(1), 6(3), 33(3), 23(3), 37(3)

