Article

Effect of Oxygen for Enhancing the Gas Storage Performance of Activated Green Carbon

1
Department of Physics, Incheon National University, Incheon 22012, Korea
2
Intelligent Sensor Convergence Research Center, Incheon National University, Incheon 22012, Korea
3
Department of Energy and Chemical Engineering, Incheon National University, Incheon 22012, Korea
4
Research Center for Materials Analysis, Korea Basic Science Institution, Daejeon 34144, Korea
*
Author to whom correspondence should be addressed.
Hyun-Seok Jang and Chang Yeon Lee contributed equally to this work.
Energies 2020, 13(15), 3893; https://doi.org/10.3390/en13153893
Submission received: 30 June 2020 / Revised: 21 July 2020 / Accepted: 28 July 2020 / Published: 30 July 2020
(This article belongs to the Section B: Energy and Environment)

Abstract

:
We investigated the gas storage capacity of thermally carbonized and chemically activated Phyllostachys bambusoides (PB), which is a nature-derived green carbon with an organic porous structure. Samples were thermally treated at 900 °C for 24 h, and then were chemically activated with different amounts of KOH. The pore distribution, surface area, and H2 storage capacity were measured by N2 and H2 gas sorption, up to 847 mmHg (1.13 bar) at 77 K. The CO2 storage capacity was measured up to 847 mmHg (1.13 bar) at 298 K. The maximum gas storage was shown in the sample activated with 6 times gravimetric ratio of chemical agent. It reached 1.86 wt% for H2 and 3.44 mmol/g for CO2. We used multilateral analysis methods (XRD, XPS, Raman spectroscopy, and scanning electron microscope) to identify the factors influencing gas sorption. We found that the amount of oxygen groups influence the enhancement of gas storage capacity. Moreover, the results showed that PB-based porous activated carbon has the potential to be used as a multirole gas storage material.

1. Introduction

As concerns about global warming and the depletion of conventional energy resources continue to increase, growing attention has been focused on the development of gas storage materials for hydrogen and carbon dioxide [1,2,3,4,5,6]. Carbon-based materials have been investigated for possible use in both fields. In the case of hydrogen storage, since porous carbon materials are light in weight and have fast kinetics due to physisorption [7,8,9,10,11], they have an advantage compared with current hydrogen storage technologies such as low-temperature liquid storage, metallic alloys, and chemical hydrides [5,12,13,14]. The same advantages make porous carbon materials suitable for capturing other types of gas, such as carbon dioxide (CO2) [4,5,14,15,16,17,18,19,20,21].
It is well known that the specific surface area and pore size are the important factors for enhancing the gas storage capacity [14,22,23,24,25,26,27,28]. To increase surface area and make proper sized pores, a chemical activation process using potassium hydride (KOH) as a chemical agent has been employed [28,29,30,31]. In the activation process, the carbon frame is etched due to the intercalation of the potassium compounds and oxidation. Then, CO2 production from K2CO3, which is the subsequent reactant, above 700 °C contributes to the further development of pore distribution via carbon gasification [7,32]. This process results in a large surface area which enhances storage capability. In addition, the optimum interlayer distance has also been reported to increase storage capacity [26,27,33,34].
Here, we report that the oxygen groups in carbon-based materials play a role for enhancing the adsorption of both H2 and CO2. It was achieved with chemical activated green carbon prepared from carbonized Phyllostachys bambusoides (PB). The surface area, structure, and morphology were investigated with Brunauer-Emmett-Teller (BET) analysis, Raman spectroscopy, X-ray photoelectron spectroscopy (XPS), X-ray diffraction (XRD), and scanning electron microscopy (SEM). We found that the gas-sorption ability cannot be explained by surface area, interlayer distance, and morphology. The oxygen groups on the graphitic layer are closely related to the gas storage capacity. This result may help bring the field one step further to understanding the gas sorption mechanism in carbon-based materials.

2. Materials and Methods

2.1. Materials and Carbonization

Pristine PB was cut into 50-mm long and 5-mm width sticks. The PB sticks were cleansed two times by sonication in acetone, ethanol, and de-ionized (DI) water for 30 min to remove unexpected residue, such as dust. After cleaning, the samples were dried at room temperature under atmospheric conditions. Then, the PB sticks were carbonized in a tube furnace by thermal treatment. The PB sticks were thermally treated at 900 °C in a N2 atmospheric condition. The treatment temperature was increased by 5 °C min−1 from room temperature to 900 °C and maintained for 24 h. The PB900 was ground to investigate their structure and gas sorption properties.

2.2. Chemical Activation and Neutralization

Chemical activation was only performed on the carbonized PB treated at 900 °C (PB900), which showed the highest hydrogen storage performance compared to PB treated at other temperatures; 2 g of ground PB900 was mixed with different amounts of chemical agent (KOH) flake (8, 12, and 16 g). The resulting samples were named R4 (Ratio 4, 8 g of KOH), R6 (Ratio 6, 12 g of KOH), and R8 (Ratio 8, 16 g of KOH), respectively. Using DI-water, the mixtures were blended uniformly. The solutions were dried in N2, at 70 °C, and then the samples were ground. The ground mixture was thermally treated in a tube furnace at 750 °C, under N2 atmosphere. The treatment temperature was increased by 5 °C min−1 from room temperature to the target temperature and maintained for 1.5 h. The chemically activated sample was dissolved using DI-water to neutralize it. Dissolved samples were centrifuged to isolate the aqueous chemical agents. This aqueous solution was replaced with new DI-water and the sample was centrifuged at 8000 rpm for 3 h. This process was repeated until the solution was completely neutralized.

2.3. Characterization

The neutralized sample was dried and ground. The structure and chemical species of the samples were investigated by X-ray diffraction (XRD, Rigaku, SmartLab, Japan), Raman spectroscopy (Witec, Alpha-300, Germany), and X-ray photoelectron spectroscopy (XPS, ULVAC, PHI-5000 VersaProbe III, Japan). The surface area, pore distribution, and hydrogen and CO2 storage capacity were characterized by gas analyzer (ASAP 2020, Micromeritics, USA.). The morphology of the samples was observed using a scanning electron microscope (SEM, JEOL, JSM-7800F, Japan).

3. Results and Discussion

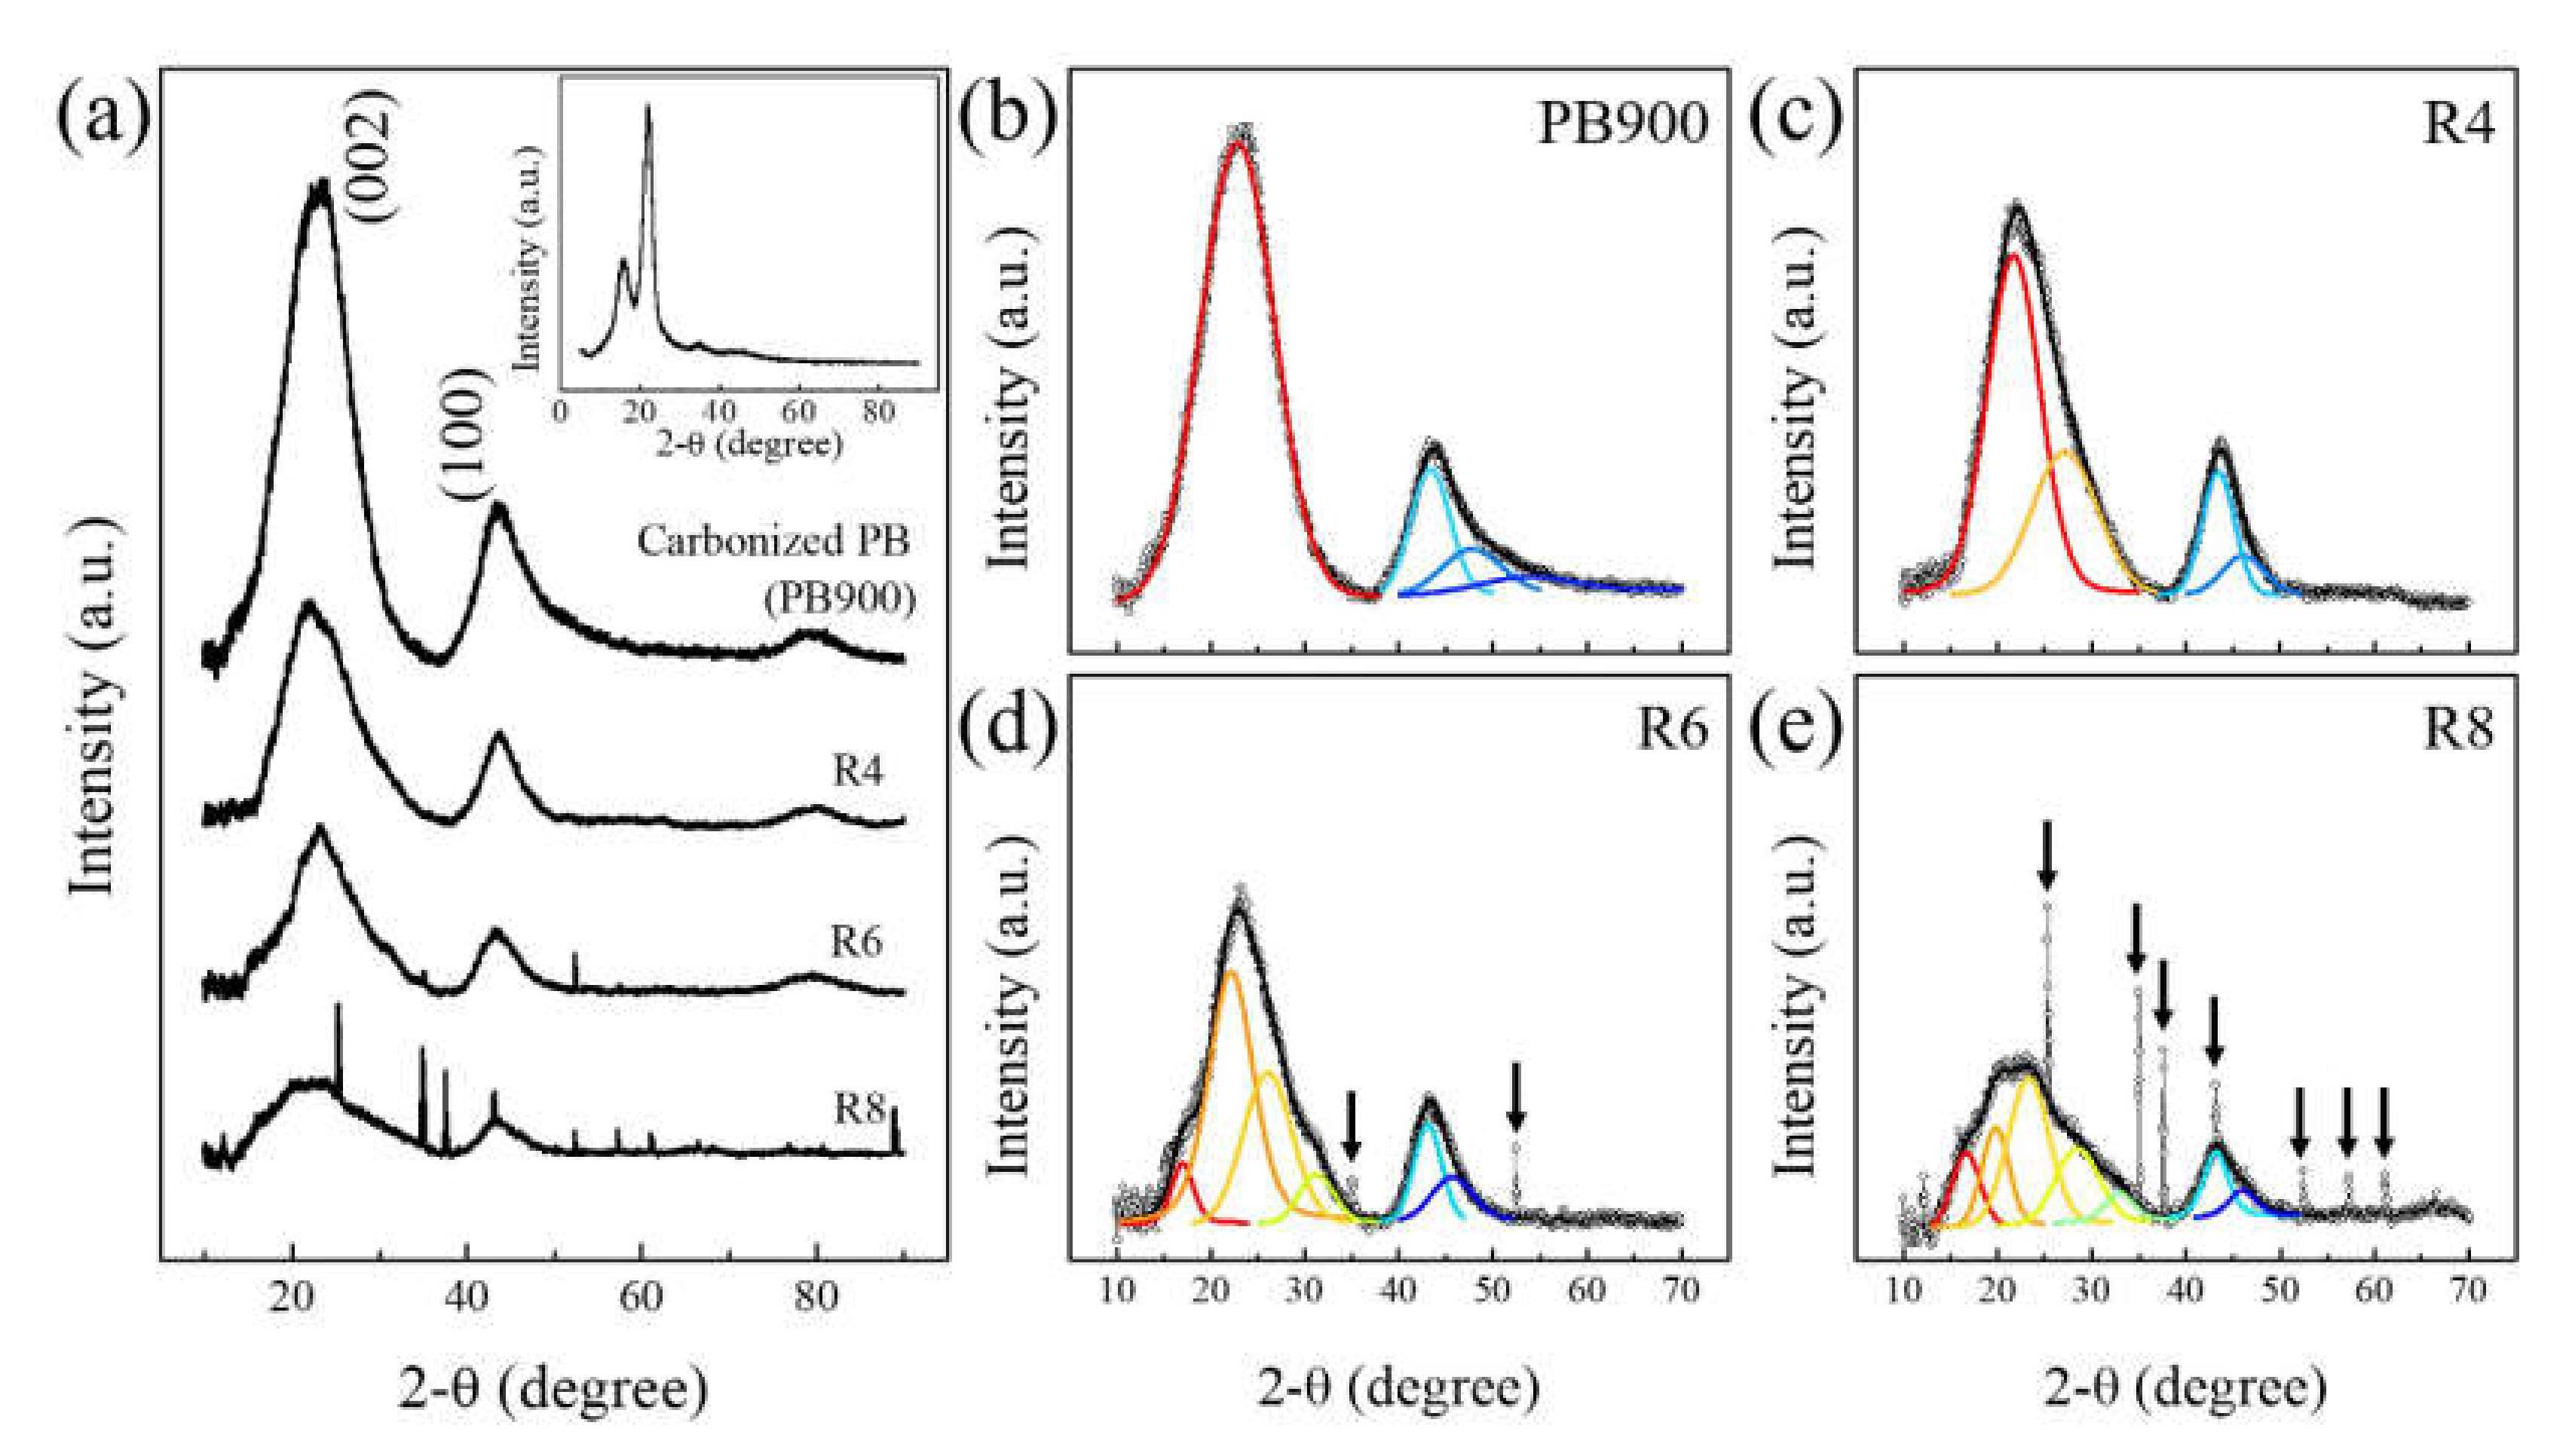
3.1. Structural Investigation With XRD, and Raman Spectroscopy

PB is a perennial plant in the bamboo subfamily of Poaceae composed of biological fibers containing cellulose chains. Cellulose, hemicellulose, and lignin are the main components of the cellulose chain in PB. Due to its structural and chemical characteristics, PB has a porous structure and high tensile strength [35]. Pyrolysis of the cellulose chain using thermal treatment causes a change in the PB structure. During thermal treatment, the cellulose changes into thin porous carbon sheets by disintegration and rearrangement, while lignin and hemicellulose are pyrolyzed [36]. The structural changes in the PB depend on the thermal treatment temperature. Among the samples treated at 800, 900, 1000, and 1100 °C, PB900 showed the maximum specific surface area and hydrogen storage capacity [37]. This result was well consistent with the previous reports [38,39]. Accordingly, we chose PB900 as the pristine material for chemical activation.
The structure of the activated PB was investigated by XRD and Raman spectroscopy. Figure 1 shows the XRD patterns and fitted profiles of the PB900, R4, R6, and R8 samples. The inset in Figure 1a shows the XRD pattern of pristine PB; (002) and (100) peaks are shown in all samples, but their intensities differ. As the amount of KOH increased, the intensity of both peaks decreased. Here, we focused on the (002) peak. The height of the (002) peak from the background is defined as R, which is the parameter used to identify the aligned carbon layers [40] (See Figure 2). Values of R from PB900, R4, R6, and R8 were 1.75, 1.18, 1.11, and ~1.00, respectively.
The number of sub-peaks in the (002) peak increased with the increasing amount of chemical agent. As shown in Figure 1b–e, the numbers of sub-peaks increased from 1 for PB900 to 5 for R8. In the sample PB900 (Figure 1b), there is a single (002) peak at 22.86° corresponding to a d-spacing of 3.89 Å. The information on the other samples is presented in Table 1. The existence of various interlayer distances is due to the amorphization of PB900 by the chemical activation. In other words, the structural modulation is induced by etching and collapse processes.
This behavior was also observed in the Raman study. The inset in Figure 3a shows the normalized Raman spectrum of pristine PB. The two peaks at 1600 and 2948.2 cm−1 correspond to the typical feature of lignin [40,41]. As shown in Figure 3a, the Raman spectrum has D, G, and 2D peaks, which are consistent with the previous studies of carbon materials [42,43,44]. In more detail, the G and D peaks consist of the first-order bands of G, D (D1), D2, D3, and D4 as shown in Figure 3b–e.
G and D relevant bands originate from the highly ordered ideal graphitic lattice (E2g vibrational mode) and the disorder of the graphitic lattice (A1g vibrational mode), respectively [45,46,47,48]. Among the relevant D peaks, the D2 band at 1670 cm-1 which is observed on the shoulder of the G band, corresponds to the graphitic lattice mode of E2g symmetry like G band, but indicates disorder on the surface carbon layer [46,49]. Due to the collapse of the graphitic sheet structure, the ratio of the integrated areas of the G band and D2 band (ID2/IG) decreases as the ratio of KOH increases. The D3 band, which appears at 1500 cm−1, is specifically related to an amorphous carbon structure [49,50,51]. The ratio of the integrated areas of the G band and D3 band (ID3/IG) increased to 1.16, 1.20, 1.41, and 1.48, as the amount of chemical agent increased. The ratio of total disordered defects in the structure (ID-Total/IG) also increased to 5.26, 5.29, 5.43, and 5.72 with the increase in chemical agent (peak details are in Table 2). These results indicate that the disordered carbon structure becomes larger due to the chemical agent.

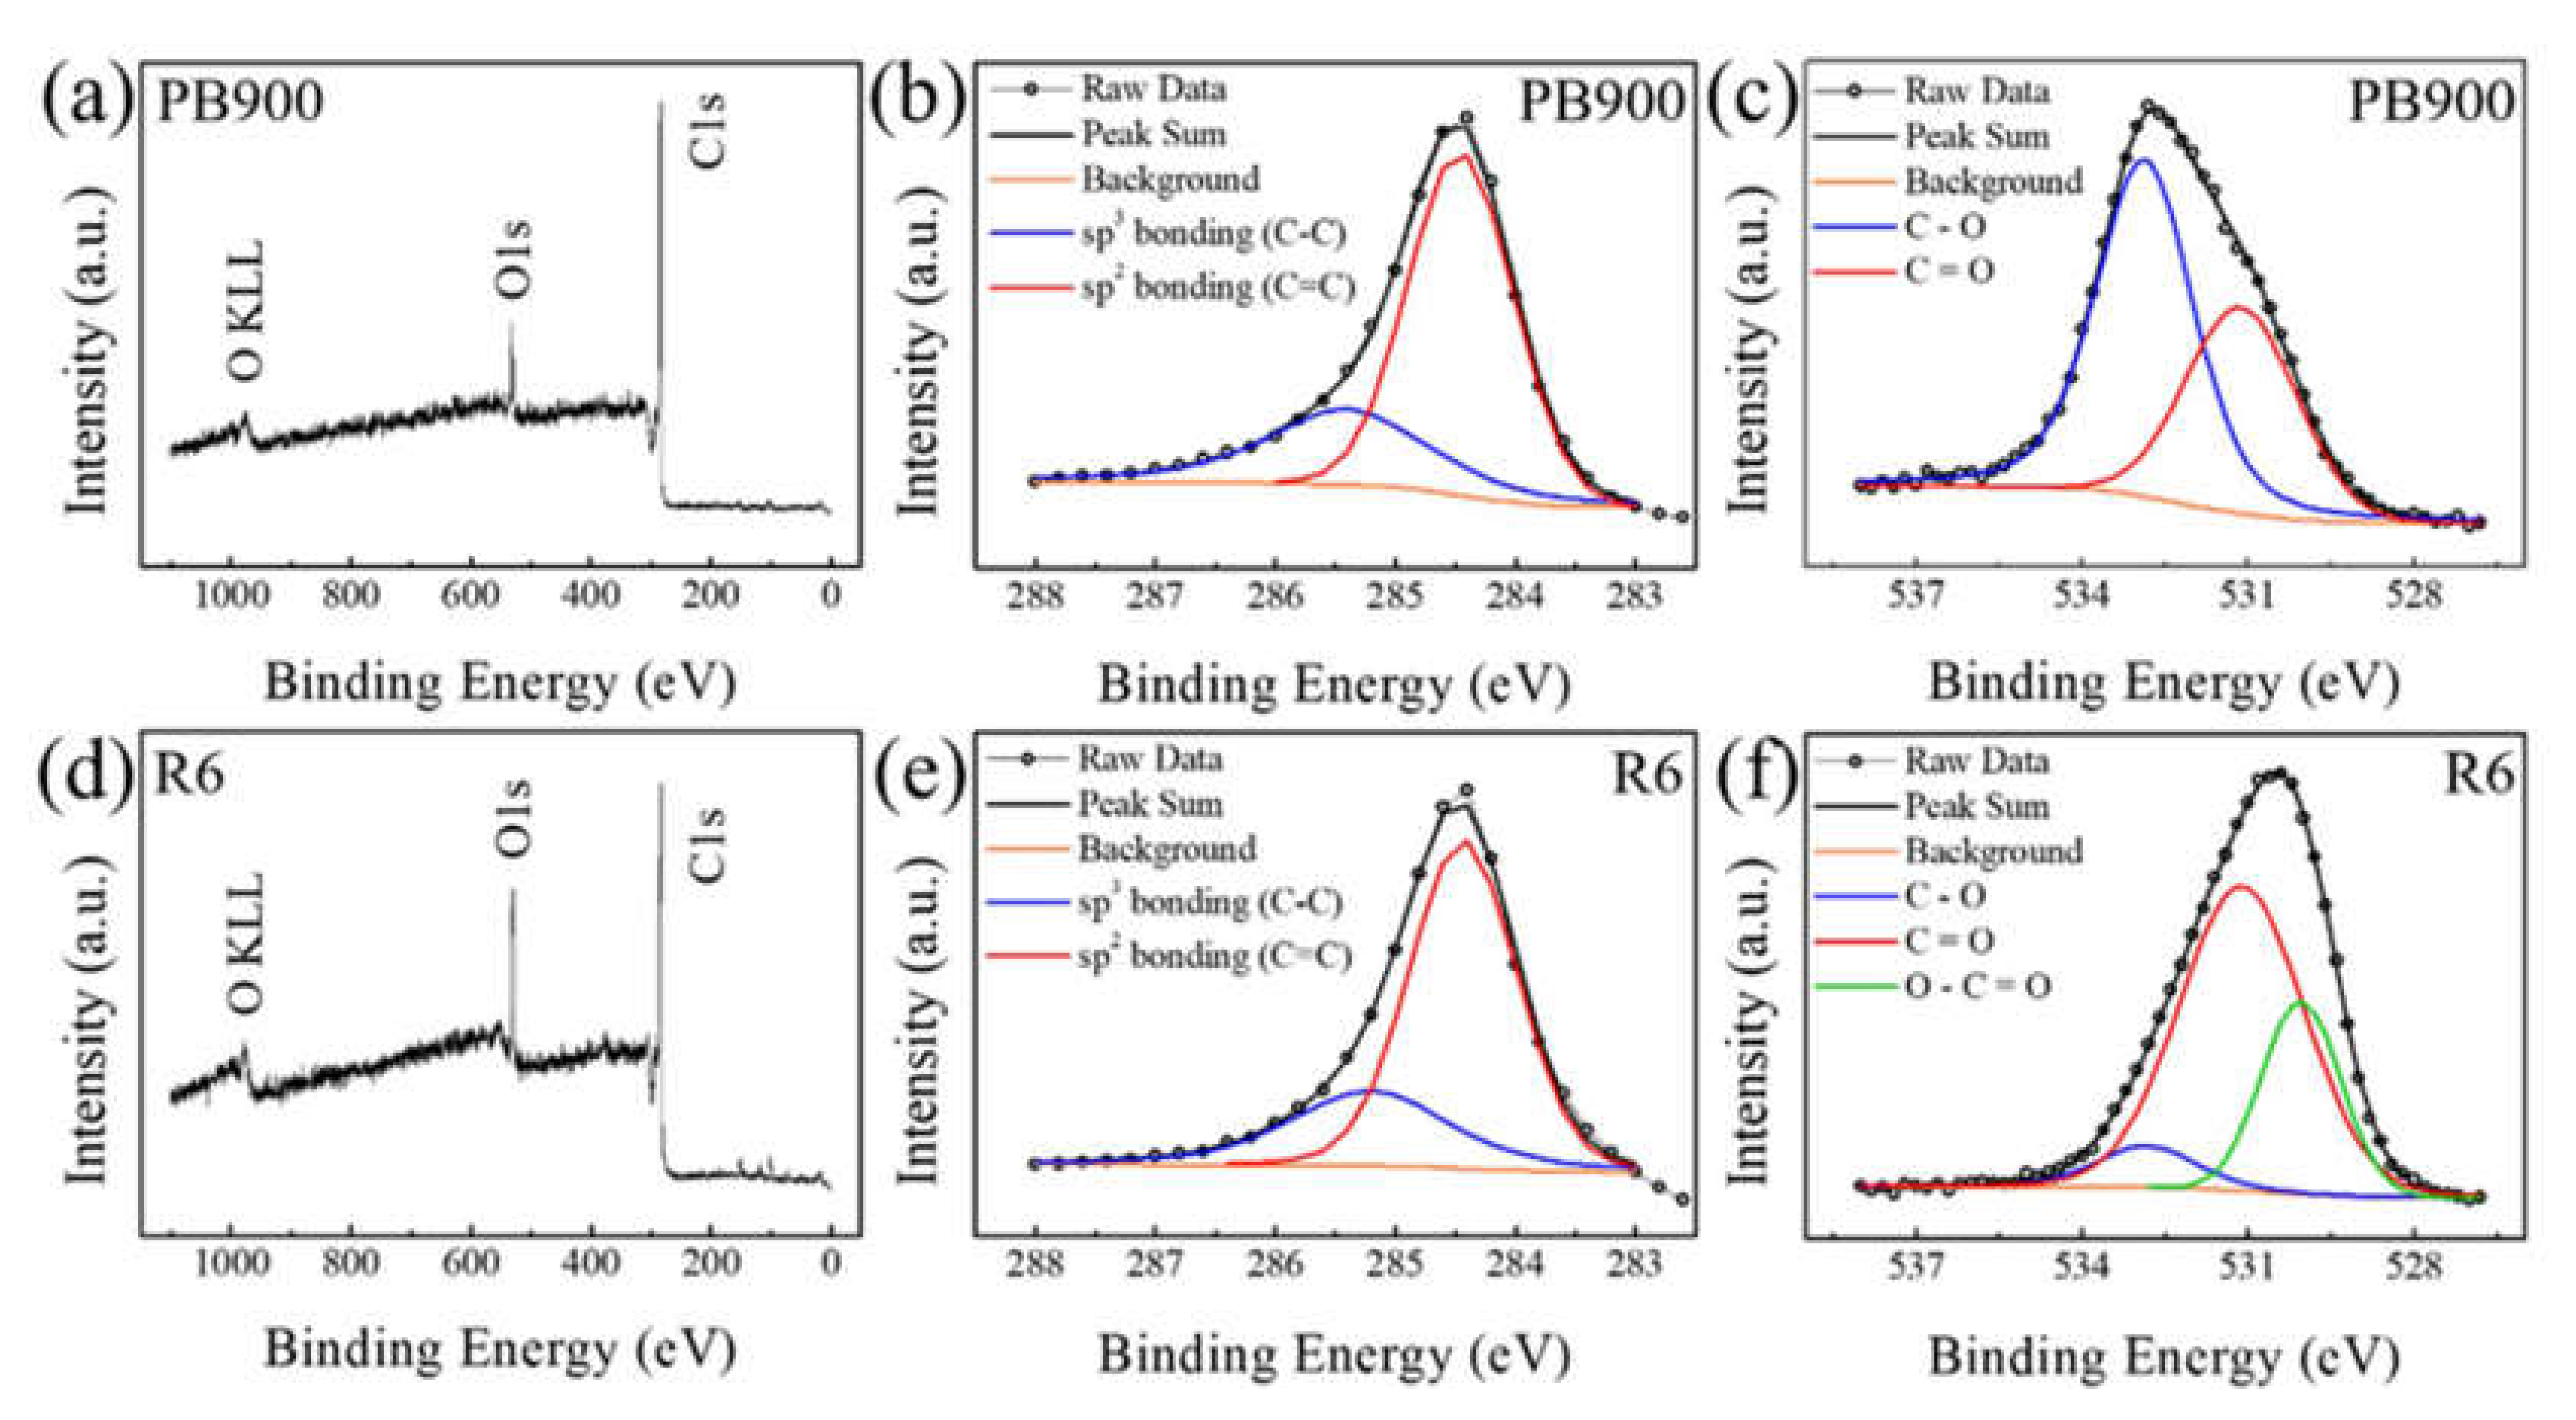
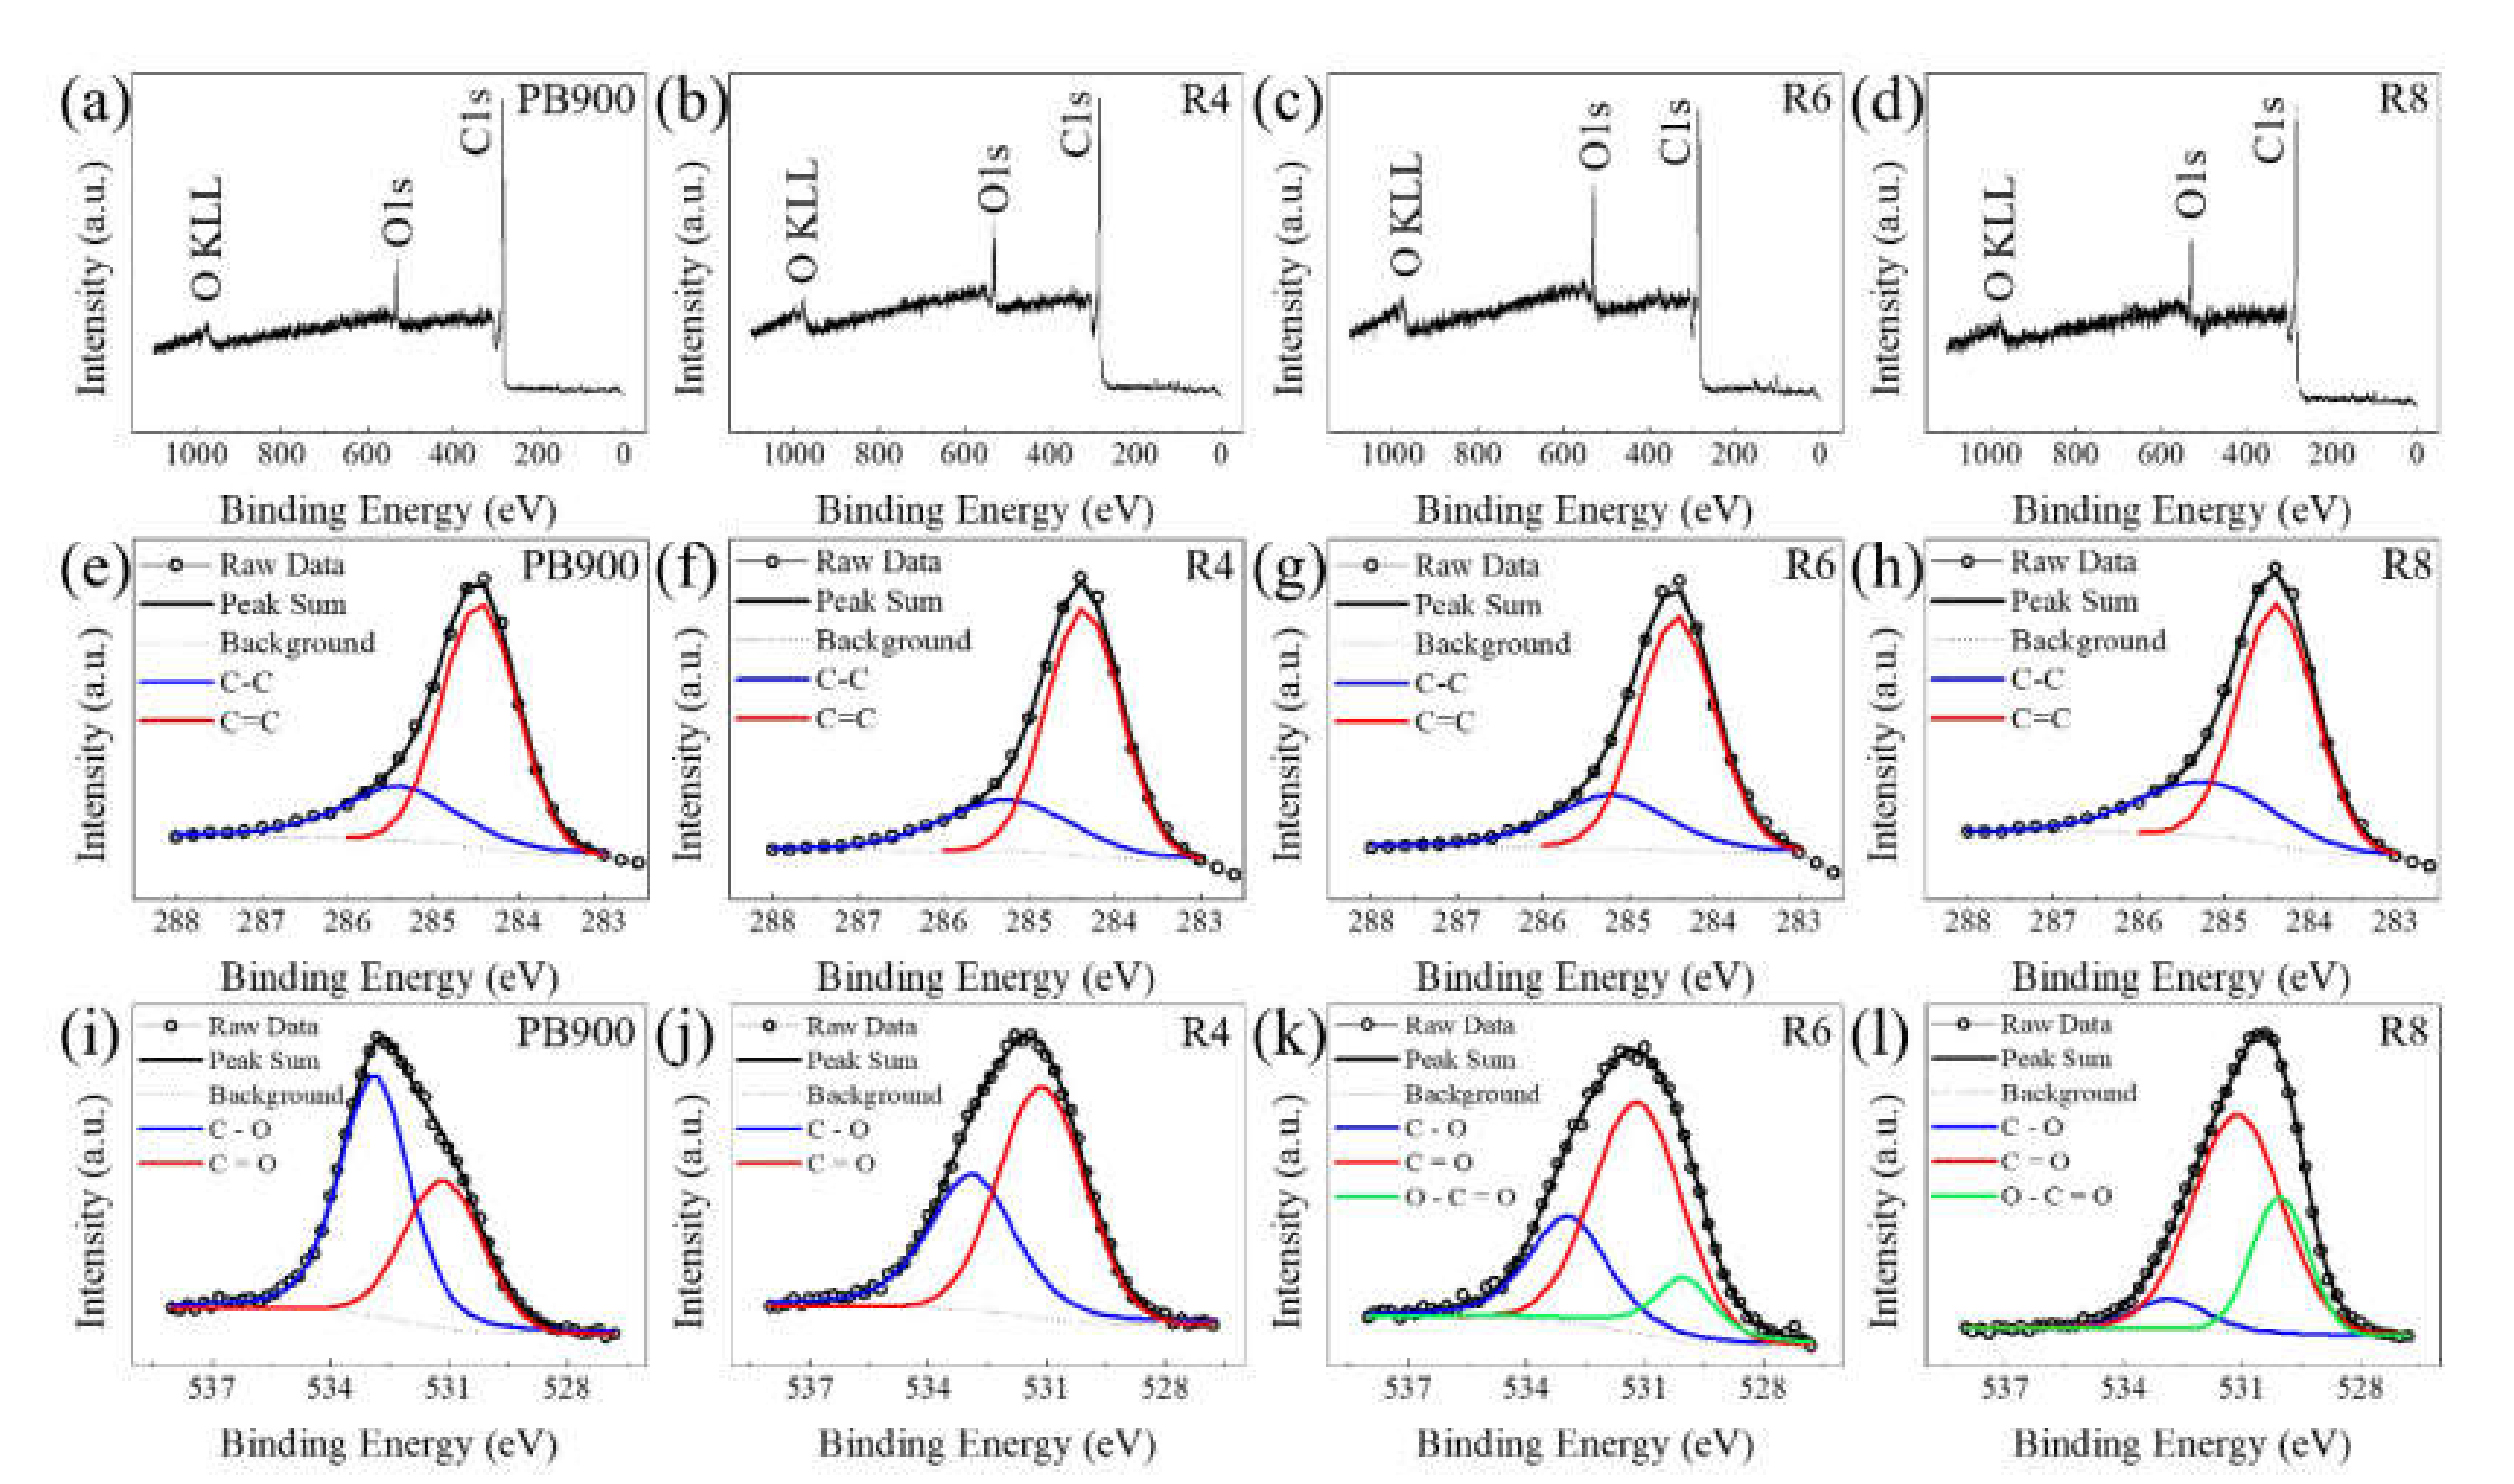
3.2. X-ray Photoelectron Study before and after Chemical Activation

Figure 4 depicts the XPS survey and fitted spectra of the PB900 and R6 samples (data for all samples are in Figure 5). As shown in Figure 4a,d, PB900 and R6 contain mainly C and O. Figure 4b,e are the XPS Cls peaks of PB900 and R6, respectively. sp2 (C=C), and sp3 (C-C) bonding were observed and each chemical species were barely changed (peak position, full width at half maximum (FWHM), and atomic concentration) after the chemical activation process. Figure 4c,f are the XPS O1s peaks for PB900 and R6, respectively. C-O, and C=O species were observed in PB900 and O–C=O species additionally appear in the R6 (Table 3). These three types of bonds are respectively from the phenol and ether groups, carbonyl groups, and lactone groups [52,53,54,55]. The appearance of lactone groups is probably due to the attachment of oxygen atoms in the vacancies of the collapsed graphitic structure. The atomic concentration ratio of oxygen increases when the sample has been chemically activated (Table 4). It is worth noting that the maximum oxygen ratio was observed in sample R6, but not in sample R8. The results indicate that the chemical activation process using a specific amount of KOH increases the surface oxygen groups.

3.3. Surface Structure and Gas Adsorption Using BET Analysis

Porous carbon structure develops due to the chemical activation process (see Table 5). The specific surface areas (SBET) of R4, R6, and R8 are 590, 842, and 1150 m2/g, respectively. It is well known that the gas sorption capacity increases as the surface area increases. In the result of the pore size distribution (PSD) obtained from the density functional theory (DFT) method, every sample shows the highest distribution between 5–7 Å of pore width (1.89 cm3/g at 0.68 Å for R8, 1.36 cm3/g at 0.68 Å for R4, 1.16 cm3/g at 0.68 Å for R6, and 0.65 cm3/g at 0.64 Å for PB900). We found that the maximum capacity reaches 1.86 wt% (77 K, 847 mmHg) for H2, and 3.44 mmol/g (298 K, 847 mmHg) for CO2. These results surpassed the capacity of the previously commercialized porous activated carbon (PAC, 1.23 wt% at 1 bar/77 K for H2, and 2.1 wt% at 313 K for CO2) [17,29], but their capacity is lower than the results observed for chemically activated bamboo species in previous studies (2.74 wt% at 1 bar/77 K for H2, and 4.5 mmol/g at 1 bar/298 K for CO2) [56,57]. However, we focused on finding other factors for enhancing the storage capacity. Interestingly, the maximum storage capacity was exhibited in R6, but not R8, even though the surface area of R8 is larger than that of R6 (See Figure 6). This shows that the surface area does not completely reflect the gas sorption capability. Hence, we investigated the other factors related to the strange capacity.
First, we focused on the (002) peak in the XRD results. The R6 and R8 samples developed 5.10 and 5.53 Å of interlayer distance. Previously, it was reported that 5.0–7.0 Å of interlayer distance was the optimum interlayer distance for H2 adsorption in carbon materials [26,27,58,59,60,61,62]. Second, we assumed that the morphology also affected the storage capacity. Therefore, the morphology of the sample was studied with SEM. Figure 7 shows the SEM image of the PB900, R4, R6, and R8 samples. The overall particle size decreased with increasing chemical agent (Figure 7a–d). For sample R8, no particles over 100 um were observed. The magnified images are presented in Figure 7e–h. Note that exfoliation of thin carbon sheets was observed in sample R6 (Figure 7g), before the sample was broken to the small pieces shown in R8 (Figure 7h). However, these two factors, interlayer distance and morphology of the samples, do not provide the appropriate information of enhancing storage capacity in R6.
Finally, we considered the amount of oxygen groups, because the theoretical investigation for the interaction between hydrogen and oxygen on the graphite basal plane was reported [63]. In the XPS results, we found that O–C=O bond appeared only in R6 and R8. Note that the maximum amount of oxygen groups is shown in R6 and the amount of O–C=O species (integrated area) in R6 is larger than that of R8 (Table 3). Water solubility is determined by the different amount of oxygen groups. Hence, we dispersed the samples in DI water (see Figure 8). To determine solubility, 5 mg of each sample was diluted with 400 mL of DL water and sonicated for 3 h, and then put on the table for 12 h. The highest solubility was shown in R6. As mentioned above, this result is attributed to the largest amount of oxygen groups in R6 and show that the oxygen functional groups, especially O–C=O bond on the graphitic basal plane, are one of the factors for enhancing the gas storage capacity.

4. Conclusions

In summary, PB-based PAC was prepared using thermal treatment and KOH-based chemical activation. The chemically activated PB-based PAC samples were basically composed of carbons. However, their amorphous structure increased after chemical activation, and this tendency increased when the amount of chemical agent was increased in the chemical activation process. The chemical composition and the structural characteristics were confirmed by XPS, Raman spectroscopy, XRD, and BET analysis. The maximum H2 and CO2 uptake 1.86 wt% (1.13 bar, 77 K) for H2 and 3.44 mmol/g (1.13 bar, 298 K) for CO2 were exhibited by sample R6. We established that the amount of oxygen groups, especially the lactone groups, play a very important role in enhancing both H2 and CO2 uptake of nanoporous carbon. The surface area, interlayer distance, and the morphology of the samples effect gas storage capacity, but this should be studied in details in our further investigations. We therefore suggest that the oxygen groups on the graphitic layer can also have an effect on increasing the gas sorption capacity.

Author Contributions

B.H.K. and H.-S.J. conceived and designed the experiment; H.-S.J., J.W.J., W.T.J., W.G.H., S.M.L., and H.K., performed the investigation, experiments, and data analysis; B.H.K. and H.-S.J. wrote the original draft; B.H.K., C.Y.L., and J.M. reviewed and corrected the manuscript. All authors have read and agreed to the published version of the manuscript. The total research process was supervised under the administration of B.H.K.

Funding

This research was funded by the Incheon National University Research Granted in 2017-0491.

Conflicts of Interest

The authors declare no conflict of interest.

References

  1. US DOE. The Fuel Cell Technologies Office Multi-Year Research, Development, and Demonstration Plan; Technical Report; US Department of Energy: Washington, DC, USA, 2016. [Google Scholar]
  2. Elam, C.C. IEA Agreement on the Production and Utilization of Hydrogen; USA Annual Report; National Renewable Energy Laboratory: Golden, CO, USA, 1996. [Google Scholar]
  3. Satyapal, S.; Petrovic, J.; Read, C.; Thomas, G.; Ordaz, G. The US Department of Energy’s National Hydrogen Storage Project: Progress towards meeting hydrogen-powered vehicle requirements. Catal. Today 2007, 120, 246–256. [Google Scholar] [CrossRef] [Green Version]
  4. Hao, G.P.; Li, W.C.; Lu, A.H. Novel porous solids for carbon dioxide capture. J. Mater. Chem. 2011, 21, 6447–6451. [Google Scholar] [CrossRef]
  5. Rashidi, N.A.; Yusup, S. An overview of activated carbons utilization for the post-combustion carbon dioxide capture. J. CO2 Util. 2016, 13, 1–16. [Google Scholar] [CrossRef]
  6. D’Alessandro, D.M.; Smit, B.; Long, J.R. Carbon dioxide capture: Prospects for new materials. Angew. Chem. Int. Ed. 2010, 49, 6058–6082. [Google Scholar] [CrossRef] [Green Version]
  7. Lozano-Castello, D.; Calo, J.M.; Cazorla-Amoros, D.; Linares-Solano, A. Carbon activation with KOH as explored by temperature programmed techniques, and the effects of hydrogen. Carbon 2007, 45, 2529–2536. [Google Scholar] [CrossRef]
  8. Teng, H.; Hsu, L.Y. High-porosity carbons prepared from bituminous coal with potassium hydroxide activation. Ind. Eng. Chem. Res. 1999, 38, 2947–2953. [Google Scholar] [CrossRef]
  9. Ströbel, R.; Garche, J.; Moseley, P.T.; Jörissen, L.; Wolf, G. Hydrogen storage by carbon materials. J. Power Sources 2006, 159, 781–801. [Google Scholar] [CrossRef]
  10. Nijkamp, M.G.; Raaymakers, J.E.M.J.; Van Dillen, A.J.; De Jong, K.P. Hydrogen storage using physisorption–materials demands. Appl. Phys. A 2001, 72, 619–623. [Google Scholar] [CrossRef] [Green Version]
  11. Dillon, A.C.; Heben, M.J. Hydrogen storage using carbon adsorbents: Past, present and future. Appl. Phys. A 2001, 72, 133–142. [Google Scholar] [CrossRef]
  12. Patel, H.A.; Byun, J.; Yavuz, C.T. Carbon dioxide capture adsorbents: Chemistry and methods. ChemSusChem 2017, 10, 1303–1317. [Google Scholar] [CrossRef]
  13. Choi, S.; Drese, J.H.; Jones, C.W. Adsorbent materials for carbon dioxide capture from large anthropogenic point sources. Chemsuschem Chem. Sustain. Energy Mater. 2009, 2, 796–854. [Google Scholar] [CrossRef] [PubMed]
  14. Sevilla, M.; Al-Jumialy, A.S.M.; Fuertes, A.B.; Mokaya, R. Optimization of the pore structure of biomass-based carbons in relation to their use for CO2 capture under low-and high-pressure regimes. ACS Appl. Mater. Interfaces 2018, 10, 1623–1633. [Google Scholar] [CrossRef] [PubMed]
  15. Singh, G.; Lakhi, K.S.; Sil, S.; Bhosale, S.V.; Kim, I.; Albahily, K.; Vinu, A. Biomass derived porous carbon for CO2 capture. Carbon 2019, 148, 164–186. [Google Scholar] [CrossRef]
  16. Zhang, X.Q.; Li, W.C.; Lu, A.H. Designed porous carbon materials for efficient CO2 adsorption and separation. New Carbon Mater. 2015, 30, 481–501. [Google Scholar] [CrossRef]
  17. Sreńscek-Nazzal, J.; Narkiewicz, U.; Morawski, A.W.; Wróbel, R.J.; Michalkiewicz, B. Comparison of optimized isotherm models and error functions for carbon dioxide adsorption on activated carbon. J. Chem. Eng. Data 2015, 60, 3148–3158. [Google Scholar] [CrossRef]
  18. Sreńscek-Nazzal, J.; Narkiewicz, U.; Morawski, A.W.; Wróbel, R.; Gęsikiewicz-Puchalska, A.; Michalkiewicz, B. Modification of Commercial Activated Carbons for CO2 Adsorption. Acta Phys. Pol. A 2016, 129, 394–401. [Google Scholar] [CrossRef]
  19. Sreńscek-Nazzal, J.; Kiełbasa, K. Advances in modification of commercial activated carbon for enhancement of CO2 capture. Appl. Surf. Sci. 2019, 494, 137–151. [Google Scholar] [CrossRef]
  20. Casco, M.E.; Martínez-Escandell, M.; Silvestre-Albero, J.; Rodríguez-Reinoso, F. Effect of the porous structure in carbon materials for CO2 capture at atmospheric and high-pressure. Carbon 2014, 67, 230–235. [Google Scholar] [CrossRef] [Green Version]
  21. Jimenez, V.; Ramírez-Lucas, A.; Diaz, J.A.; Sanchez, P.; Romero, A. CO2 capture in different carbon materials. Environ. Sci. Technol. 2012, 46, 7407–7414. [Google Scholar] [CrossRef]
  22. Xia, Y.; Yang, Z.; Zhu, Y. Porous carbon-based materials for hydrogen storage: Advancement and challenges. J. Mater. Chem. A 2013, 1, 9365–9381. [Google Scholar] [CrossRef]
  23. Liu, Y.; Zhang, Z.; Wang, T. Enhanced hydrogen storage performance of three-dimensional hierarchical porous graphene with nickel nanoparticles. Int. J. Hydrog. Energy 2018, 43, 11120–11131. [Google Scholar] [CrossRef]
  24. Jia, Y.; Sun, C.; Cheng, L.; Wahab, M.A.; Cui, J.; Zou, J.; Zhu, M.; Yao, X. Destabilization of Mg–H bonding through nano-interfacial confinement by unsaturated carbon for hydrogen desorption from MgH2. Phys. Chem. Chem. Phys. 2013, 15, 5814–5820. [Google Scholar] [CrossRef] [Green Version]
  25. Zlotea, C.; Oumellal, Y.; Hwang, S.J.; Ghimbeu, C.M.; de Jongh, P.E.; Latroche, M. Ultrasmall MgH2 nanoparticles embedded in an ordered microporous carbon exhibiting rapid hydrogen sorption kinetics. J. Phys. Chem. C 2015, 119, 18091–18098. [Google Scholar] [CrossRef]
  26. Kim, B.H.; Hong, W.G.; Yu, H.Y.; Han, Y.K.; Lee, S.M.; Chang, S.J.; Moon, H.R.; Jun, Y.; Kim, J.H. Thermally modulated multilayered graphene oxide for hydrogen storage. Phys. Chem. Chem. Phys. 2012, 14, 1480–1484. [Google Scholar] [CrossRef] [PubMed] [Green Version]
  27. Kim, B.H.; Hong, W.G.; Moon, H.R.; Lee, S.M.; Kim, J.M.; Kang, S.; Jun, Y.; Kim, H.J. Investigation on the existence of optimum interlayer distance for H2 uptake using pillared-graphene oxide. Int. J. Hydrog. Energy 2012, 37, 14217–14222. [Google Scholar] [CrossRef]
  28. Wang, J.; Kaskel, S. KOH activation of carbon-based materials for energy storage. J. Mater. Chem. 2012, 22, 23710–23725. [Google Scholar] [CrossRef]
  29. Wang, H.; Gao, Q.; Hu, J. High hydrogen storage capacity of porous carbons prepared by using activated carbon. J. Am. Chem. Soc. 2009, 131, 7016–7022. [Google Scholar] [CrossRef]
  30. Otowa, T.; Nojima, Y.; Miyazaki, T. Development of KOH activated high surface area carbon and its application to drinking water purification. Carbon 1997, 35, 1315–1319. [Google Scholar] [CrossRef]
  31. Sircar, S.; Golden, T.C.; Rao, M.B. Activated carbon for gas separation and storage. Carbon 1996, 34, 1–12. [Google Scholar] [CrossRef]
  32. Lillo-Ródenas, M.A.; Juan-Juan, J.; Cazorla-Amorós, D.; Linares-Solano, A. About reactions occurring during chemical activation with hydroxides. Carbon 2004, 42, 1371–1375. [Google Scholar] [CrossRef]
  33. Kim, J.M.; Hong, W.G.; Lee, S.M.; Chang, S.J.; Jun, Y.; Kim, B.H.; Kim, H.J. Energy storage of thermally reduced graphene oxide. Int. J. Hydrog. Energy 2014, 39, 3799–3804. [Google Scholar] [CrossRef]
  34. Shin, D.S.; Hong, W.G.; Jang, H.S.; Kim, H.J.; Kim, B.H. Optimum interlayer distance for hydrogen storage in pillared-graphene oxide determined by H2 pressure-dependent electrical conductance. Int. J. Hydrog. Energy 2018, 43, 16136–16140. [Google Scholar] [CrossRef]
  35. Khalil, H.P.S.A.; Bhat, I.U.H.; Jawaid, M.; Zaidon, A.; Hermawan, D.; Hadi, Y.S. Bamboo fibre reinforced biocomposites: A review. Mater. Des. 2012, 42, 353–368. [Google Scholar] [CrossRef]
  36. Genovese, M.; Jiang, J.; Lian, K.; Holm, N. High capacitive performance of exfoliated biochar nanosheets from biomass waste corn cob. J. Mater. Chem. A 2015, 3, 2903–2913. [Google Scholar] [CrossRef]
  37. Jang, H.S.; Mun, J.; Hong, W.G.; Lee, S.M.; Jeon, J.W.; Lee, C.Y.; Kim, H.J.; Kim, B.H. The performance of green carbon as a backbone for hydrogen storage materials. Int. J. Hydrog. Energy 2020, 45, 10516–10522. [Google Scholar] [CrossRef]
  38. Bhuiyan, M.T.R.; Hirai, N.; Sobue, N. Changes of crystallinity in wood cellulose by heat treatment under dried and moist conditions. J. Wood Sci. 2000, 46, 431–436. [Google Scholar] [CrossRef]
  39. Cho, S.Y.; Yun, Y.S.; Lee, S.; Jang, D.; Park, K.Y.; Kim, J.K.; Kim, B.H.; Kang, K.; Kaplan, D.L.; Jin, H.J. Carbonization of a stable β-sheet-rich silk protein into a pseudographitic pyroprotein. Nat. Commun. 2015, 6, 7145. [Google Scholar] [CrossRef]
  40. Liu, Y.; Xue, J.S.; Zheng, T.; Dahn, J.R. Mechanism of lithium insertion in hard carbons prepared by pyrolysis of epoxy resins. Carbon 1996, 34, 193–200. [Google Scholar] [CrossRef]
  41. Agarwal, U.P. Raman imaging to investigate ultrastructure and composition of plant cell walls: Distribution of lignin and cellulose in black spruce wood (Picea mariana). Planta 2006, 224, 1141–1153. [Google Scholar] [CrossRef]
  42. Zhan, D.; Ni, Z.; Chen, W.; Sun, L.; Luo, Z.; Lai, L.; Yu, T.; Wee, A.T.S.; Shen, Z. Electronic structure of graphite oxide and thermally reduced graphite oxide. Carbon 2011, 49, 1362–1366. [Google Scholar] [CrossRef]
  43. González, Z.; Botas, C.; Álvarez, P.; Roldán, S.; Blanco, C.; Santamaría, R.; Granda, M.; Menéndez, R. Thermally reduced graphite oxide as positive electrode in vanadium redox flow batteries. Carbon 2012, 50, 828–834. [Google Scholar] [CrossRef] [Green Version]
  44. Wollbrink, A.; Volgmann, K.; Koch, J.; Kanthasamy, K.; Tegenkamp, C.; Li, Y.; Richter, H.; Kämnitz, S.; Steinbach, F.; Feldhoff, A.; et al. Amorphous, turbostratic and crystalline carbon membranes with hydrogen selectivity. Carbon 2016, 106, 93–105. [Google Scholar] [CrossRef]
  45. Tuinstra, F.; Koenig, J.L. Raman spectrum of graphite. J. Chem. Phys 1970, 53, 1126–1130. [Google Scholar] [CrossRef] [Green Version]
  46. Al-Jishi, R.; Dresselhaus, G. Lattice-dynamical model for graphite. Phys. Rev. B 1982, 26, 4514. [Google Scholar] [CrossRef]
  47. Wang, Y.; Alsmeyer, D.C.; McCreery, R.L. Raman spectroscopy of carbon materials: Structural basis of observed spectra. Chem. Mater. 1990, 2, 557–563. [Google Scholar] [CrossRef]
  48. Sadezky, A.; Muckenhuber, H.; Grothe, H.; Niessner, R.; Pöschl, U. Raman microspectroscopy of soot and related carbonaceous materials: Spectral analysis and structural information. Carbon 2005, 43, 1731–1742. [Google Scholar] [CrossRef]
  49. Cuesta, A.; Dhamelincourt, P.; Laureyns, J.; Martinez-Alonso, A.; Tascón, J.D. Raman microprobe studies on carbon materials. Carbon 1994, 32, 1523–1532. [Google Scholar] [CrossRef]
  50. Jawhari, T.; Roid, A.; Casado, J. Raman spectroscopic characterization of some commercially available carbon black materials. Carbon 1995, 33, 1561–1565. [Google Scholar] [CrossRef]
  51. Dippel, B.; Heintzenberg, J. Soot characterization in atmospheric particles from different sources by NIR FT Raman spectroscopy. J. Aerosol Sci. 1999, 30, S907–S908. [Google Scholar] [CrossRef]
  52. Boehm, H.P. Surface oxides on carbon and their analysis: A critical assessment. Carbon 2002, 40, 145–149. [Google Scholar] [CrossRef]
  53. Zhou, J.H.; Sui, Z.J.; Zhu, J.; Li, P.; Chen, D.; Dai, Y.C.; Yuan, W.K. Characterization of surface oxygen complexes on carbon nanofibers by TPD, XPS and FT-IR. Carbon 2007, 45, 785–796. [Google Scholar] [CrossRef]
  54. Zielke, U.; Hüttinger, K.J.; Hoffman, W.P. Surface-oxidized carbon fibers: I. Surface structure and chemistry. Carbon 1996, 34, 983–998. [Google Scholar] [CrossRef]
  55. Boehm, H.P. Some aspects of the surface chemistry of carbon blacks and other carbons. Carbon 1994, 32, 759–769. [Google Scholar] [CrossRef]
  56. Zhao, W.; Luo, L.; Wang, H.; Fan, M. Synthesis of bamboo-based activated carbons with super-high specific surface area for hydrogen storage. BioResources 2017, 12, 1246–1262. [Google Scholar] [CrossRef] [Green Version]
  57. Wei, H.; Deng, S.; Hu, B.; Chen, Z.; Wang, B.; Huang, J.; Yu, G. Granular bamboo-derived activated carbon for high CO2 adsorption: The dominant role of narrow micropores. ChemSusChem 2012, 5, 2354–2360. [Google Scholar] [CrossRef]
  58. Gogotsi, Y.; Portet, C.; Osswald, S.; Simmons, J.M.; Yildirim, T.; Laudisio, G.; Fischer, J.E. Importance of pore size in high-pressure hydrogen storage by porous carbons. Int. J. Hydrog. Energy 2009, 34, 6314–6319. [Google Scholar] [CrossRef]
  59. Rzepka, M.; Lamp, P.; De la Casa-Lillo, M.A. Physisorption of hydrogen on microporous carbon and carbon nanotubes. J. Phys. Chem. B 1998, 102, 10894–10898. [Google Scholar] [CrossRef] [Green Version]
  60. Singh, R.; Pantarotto, D.; Lacerda, L.; Pastorin, G.; Klumpp, C.; Prato, M.; Bianco, A.; Kostarelos, K. Tissue biodistribution and blood clearance rates of intravenously administered carbon nanotube radiotracers. Proc. Natl. Acad. Sci. USA 2006, 103, 3357–3362. [Google Scholar] [CrossRef] [Green Version]
  61. Aga, R.S.; Fu, C.L.; Krčmar, M.; Morris, J.R. Theoretical investigation of the effect of graphite interlayer spacing on hydrogen absorption. Phys. Rev. B 2007, 76, 165404. [Google Scholar] [CrossRef]
  62. Cabria, I.; López, M.J.; Alonso, J.A. Hydrogen storage capacities of nanoporous carbon calculated by density functional and Møller-Plesset methods. Phys. Rev. B 2008, 78, 075415. [Google Scholar] [CrossRef]
  63. Jelea, A.; Marinelli, F.; Ferro, Y.; Allouche, A.; Brosset, C. Quantum study of hydrogen–oxygen–graphite interactions. Carbon 2004, 42, 3189–3198. [Google Scholar] [CrossRef]
Figure 1. (a) XRD patterns of PB, PB900, R4, R6, and R8. XRD (002) sup-peak profile fittings of samples (b) PB900, (c) R4, (d) R6, and (e) R8. The other peaks (arrows) come from the Si and SiO2 substrate.
Energies 13 03893 g001
Figure 2. Definition of R value obtained from (002) peak of XRD pattern.
Energies 13 03893 g002
Figure 3. (a) Normalized Raman spectra of samples PB, PB900, R4, R6, and R8. Sub-peak fitting of the D and G regions for samples (b) PB900, (c) R4, (d) R6, and (e) R8.
Energies 13 03893 g003
Figure 4. XPS results of PB900 and R6. (a) XPS survey, (b) C1s, and (c) O1s of PB900. (d) XPS survey, (e) C1s, and (f) O1s of R6.
Energies 13 03893 g004
Figure 5. XPS results of samples. XPS survey of (a) PB900, (b) R4, (c) R6, and (d) R8. C1s region fitted spectra of (e) PB900, (f) R4, (g) R6, and (h) R8. O1s region fitted spectra of (i) PB900, (j) R4, (k) R6, and (l) R8.
Energies 13 03893 g005
Figure 6. Gas sorption properties of samples. (a) Hydrogen storage capacity at 77 K and (b) carbon dioxide storage capacity at 298 K as a function of absolute pressure up to 847 mmHg (1.13 bar). (c) Relation between gas storage capacity and SBET.
Energies 13 03893 g006
Figure 7. SEM images of samples. Low-magnification SEM image of (a) PB900, (b) R4, (c) R6, and (d) R8. High magnification SEM Image of (e) PB900, (f) R4, (g) R6, and (h) R8.
Energies 13 03893 g007
Figure 8. The optical image of PB900 and activated PB after dispersion. The highest solubility is shown in R6.
Energies 13 03893 g008
Table 1. XRD (002) sub-peak information of samples.
SamplePeak Position (2Ɵ, °)FWHM (2Ɵ, °)d-Spacing (Å)
PB90022.869.253.89
R421.576.474.12
26.518.723.36
R617.383.505.10
22.345.283.98
26.276.073.39
31.254.672.86
R816.015.015.53
20.035.244.43
23.844.913.73
27.015.953.29
31.524.962.84
Table 2. Peak details of D and G region sub-peak fitted profiles obtained from Raman spectroscopy.
BandParametersPB900R4R6R8
GRaman shift (cm−1)1589159115871587
FWHM (cm−1)71.5375.2372.0466.45
Integrated Area51.4349.4551.1544.92
DD (D1)Raman shift (cm−1)1348134413401338
FWHM (cm−1)152.2147.9148.1142.0
Integrated Area125.2122.5126.9124.3
ID/IG2.432.482.482.77
D2Raman shift (cm−1)1662167216691663
FWHM (cm−1)94.2165.7986.0760.59
Integrated Area10.827.947.915.36
ID2/IG0.210.160.150.12
D3Raman shift (cm−1)1513150915111511
FWHM (cm−1)129.9141.8150.1151.1
Integrated Area59.5459.3572.2766.67
ID3/IG1.161.201.411.48
D4Raman shift (cm−1)1211122712091215
FWHM (cm−1)298.0292.9292.4287.2
Integrated Area75.0371.9570.7560.45
ID4/IG1.461.461.381.35
Table 3. Peak details of chemical species fitted profiles obtained from XPS results.
Element (Chemical Species Indication)ParametersPB900R4R6R8
CSp3 (C−C)Position (eV)285.4285.3285.2285.2
FWHM (eV)1.591.771.571.90
Integrated Area1207.11308.4915.9759.1
Concentration (%)22.42 (30.06)18.90 (29.03)16.45 (28.72)19.59 (30.33)
Sp2 (C=C)Position (eV)284.5284.4284.4284.4
FWHM (eV)1.031.031.051.05
Integrated Area2808.63198.42273.51744.0
Concentration (%)52.16 (69.94)46.21 (70.97)40.83 (71.28)45.02 (69.67)
OC−OPosition (eV)532.9532.9532.8532.9
FWHM (eV)2.072.562.122.36
Integrated Area856.51004.2188.8385.9
Concentration (%)15.91 (62.59)14.51 (41.58)3.39 (7.94)9.96 (28.15)
C=OPosition (eV)531.1531.1531.1531.2
FWHM (eV)2.362.582.662.67
Integrated Area511.91411.21577.8784.7
Concentration (%)9.51 (37.41)20.39 (58.42)28.34 (66.32)20.25 (57.24)
O–C=OPosition (eV)--530.0530.0
FWHM (eV)--1.681.84
Integrated Area--612.3200.3
Concentration (%)--11.00 (25.74)5.17 (14.61)
The values in bracket of concentration indicate the “In-region concentration” of species.
Table 4. Atomic concentrations in PB900, R4, R6, and R8 obtained from XPS results (%).
Element (Primary Region)PB900R4R6R8
C (C1s)74.5865.1157.2864.61
O (O1s)25.4234.8942.7235.39
Table 5. Pore structure of samples confirmed by BET analysis. (SBET: Specific surface area by BET plot, Vt-mic: Micropore volume by t-plot (<2 nm), Vmeso: Mesopore volume, Vtot: Total pore volume, Davg*: Average pore diameter by BET plot (4 V/A), Avg. WHK: Average pore diameter by H-K method (<2 nm)).
SampleSBET (m2/g)Vt-Mic (cm3/g)Vmeso (cm3/g)Vtot (cm3/g)Davg* (nm)Avg. WHK (nm)H2 Uptake (wt%) at 77 KCO2 Uptake (mmol/g) at 298 K
PB9006800.260.030.291.710.551.352.20
R45900.210.010.221.600.541.482.98
R68420.430.050.482.260.561.863.44
R811500.430.030.461.300.581.823.34

