1. Introduction
The scroll compressor was invented by Leon Creux in 1905 [
1]. The compression process of this device is the relative contact between two spiral curves. A major issue in the design is the shape of the scroll, which has a significant impact on compression performance. Numerous researchers contributed to the development of the design technique for the scroll shape [
2,
3,
4,
5,
6,
7,
8,
9,
10]. Each scroll curve was defined as a circular involute, which is a practical and a classical method to predict its dynamic behavior. Based on the arbitrary initial angle of the involute, the scroll shape is represented by the derivation of each scroll curve from the radius of curvature, parameterized with the angle. Using this process, mathematical expressions for the scroll wrap, operating chamber volume, and leakage area were proposed [
11].
If the involute shape of the scroll is determined, the pressure, temperature, and mass flow rate within each chamber volume generated by the contact points of the static and orbiting scrolls can be predicted using the conservation equations. Many geometric design techniques for scroll compressors were introduced in published research articles and patents [
10,
11,
12]. Although several unique scroll geometries including the square spiral [
3] and hybrid wrap [
4] were proposed in previous studies, most investigations focused on the interpolation curves using basic circle involutes. In particular, these studies mainly considered geometric design techniques to develop the relationship between volume and leakage as a function of the orbital angle [
5]. Blunier et al. [
12] presented a mathematical model that described the operation of the scroll compressor. They also proposed a novel method for the design of the shape of a scroll wrap (represented by a circular involute) using the symmetry of the circular involute. Hirano et al. [
13] and Lee and Wu [
14] conducted studies on the perfect meshing profile (PMP) of a scroll compressor, a design with zero clearance volume. Qiang and Liu [
15] developed a compression process model based on an integral equation for the scroll mechanism. Wang et al. [
16] introduced a general mathematical formulation for scroll wraps, working chamber volume, and leakage areas, based on discretional initial angles of the involute of scroll compressors. Consequently, they derived a general relation that incorporated suction, compression, and discharge. Yanagisawa et al. [
17] presented a mathematical model for the chamber volume of a scroll, and they achieved excellent agreement with experimental results. Liu et al. [
18] presented a graphical and mathematical method for creating a modified design of the scroll wrap. Bell et al. [
19] proposed a mathematical model for geometric shape considering the wall thickness of the scroll as the main variable.
To predict the thermodynamic performance of the scroll compressor or expander, a few analytical models were proposed. Blunier et al. [
11] used mass and energy conservation equations to express the pressure, temperature, and mass flow changes over time, using the ideal gas state equation. However, their model may not apply to refrigerants under high pressure. In general, the ideal gas model is not suitable for refrigeration systems because refrigerants typically behave non-ideally given that they operate at high pressure and are involved in transcritical processes. Dutta et al. [
20] described mass and energy conservation equations using a control volume approach to predict the temperature and pressure inside a scroll and, thus, to investigate the influence of liquid refrigerant injection and heat transfer from the wall. In general, refrigerant injection of scroll compressors is a technique that bypasses a portion of the discharge gas to a suction port to prevent wet compression. These investigators utilized the correlations for convective heat transfer coefficient to estimate the heat transfer terms. Chen et al. [
21] combined mass and energy balances for an open control volume to express temperature and mass as functions of the orbital angle, and they utilized the equation of state for a real gas to determine pressure. Since the differential equations for the temperature and mass include the angular velocity, the influence of the compressor frequency could be estimated.
Chen et al.’s thermodynamic model [
21] was adopted in several studies [
22,
23,
24,
25,
26,
27]. These thermodynamic models are commonly used; however, a few were modified to account for refrigerant injection [
23,
24,
25]. Although these models are very useful tools for the prediction of the performance scroll compressors, a few salient points should be noted. Firstly, in the differential equation for temperature variation over the orbiting angle (
θ),
dT/
dθ, a partial derivative term [
] was included as a parameter, which implies that there is a change of pressure with respect to temperature at a constant specific volume. This term must be initially assumed at
θ = 0 to initiate the numerical solution process. For
θ > 0, after initiation, the refrigerant temperature inside the reference chamber at the current orbital angle step should be determined by
, which was calculated at the previous orbit angle step. Unless the refrigerant is an ideal gas, as in Dutta et al. [
20], this term may cause significant deviation because the refrigerant in a compressor usually experiences a wide range of pressures, temperatures, and specific volumes. Secondly, the pressure was determined using the equation of state, considering
p =
p (
T,
v). Therefore, the pressure value is solely dependent on the accuracy of this equation, for which the valid range is usually limited. Thirdly, the governing differential equations were obtained as a function of the rotation angle. This is useful for expressing the dynamic behavior of a single compressor, but direct application to predict the transient performance of entire systems is inconvenient. This aspect was studied extensively by many researchers [
28].
In this study, a mathematical approach is introduced to address the aforementioned limitations of the thermodynamic model that is widely applied to the scroll compressor. The geometric model of the scroll compressor is considered to be well developed, and a suitable model can be found in the literature. Therefore, emphasis is placed on the derivation of the transient governing equations for the mass, temperature, and pressure of the refrigerant in a scroll compressor, based on a unique approach using generalized thermodynamic relations. In addition, the validation of the prediction results is provided.
2. Geometry and Force Analysis of the Scroll Compressor
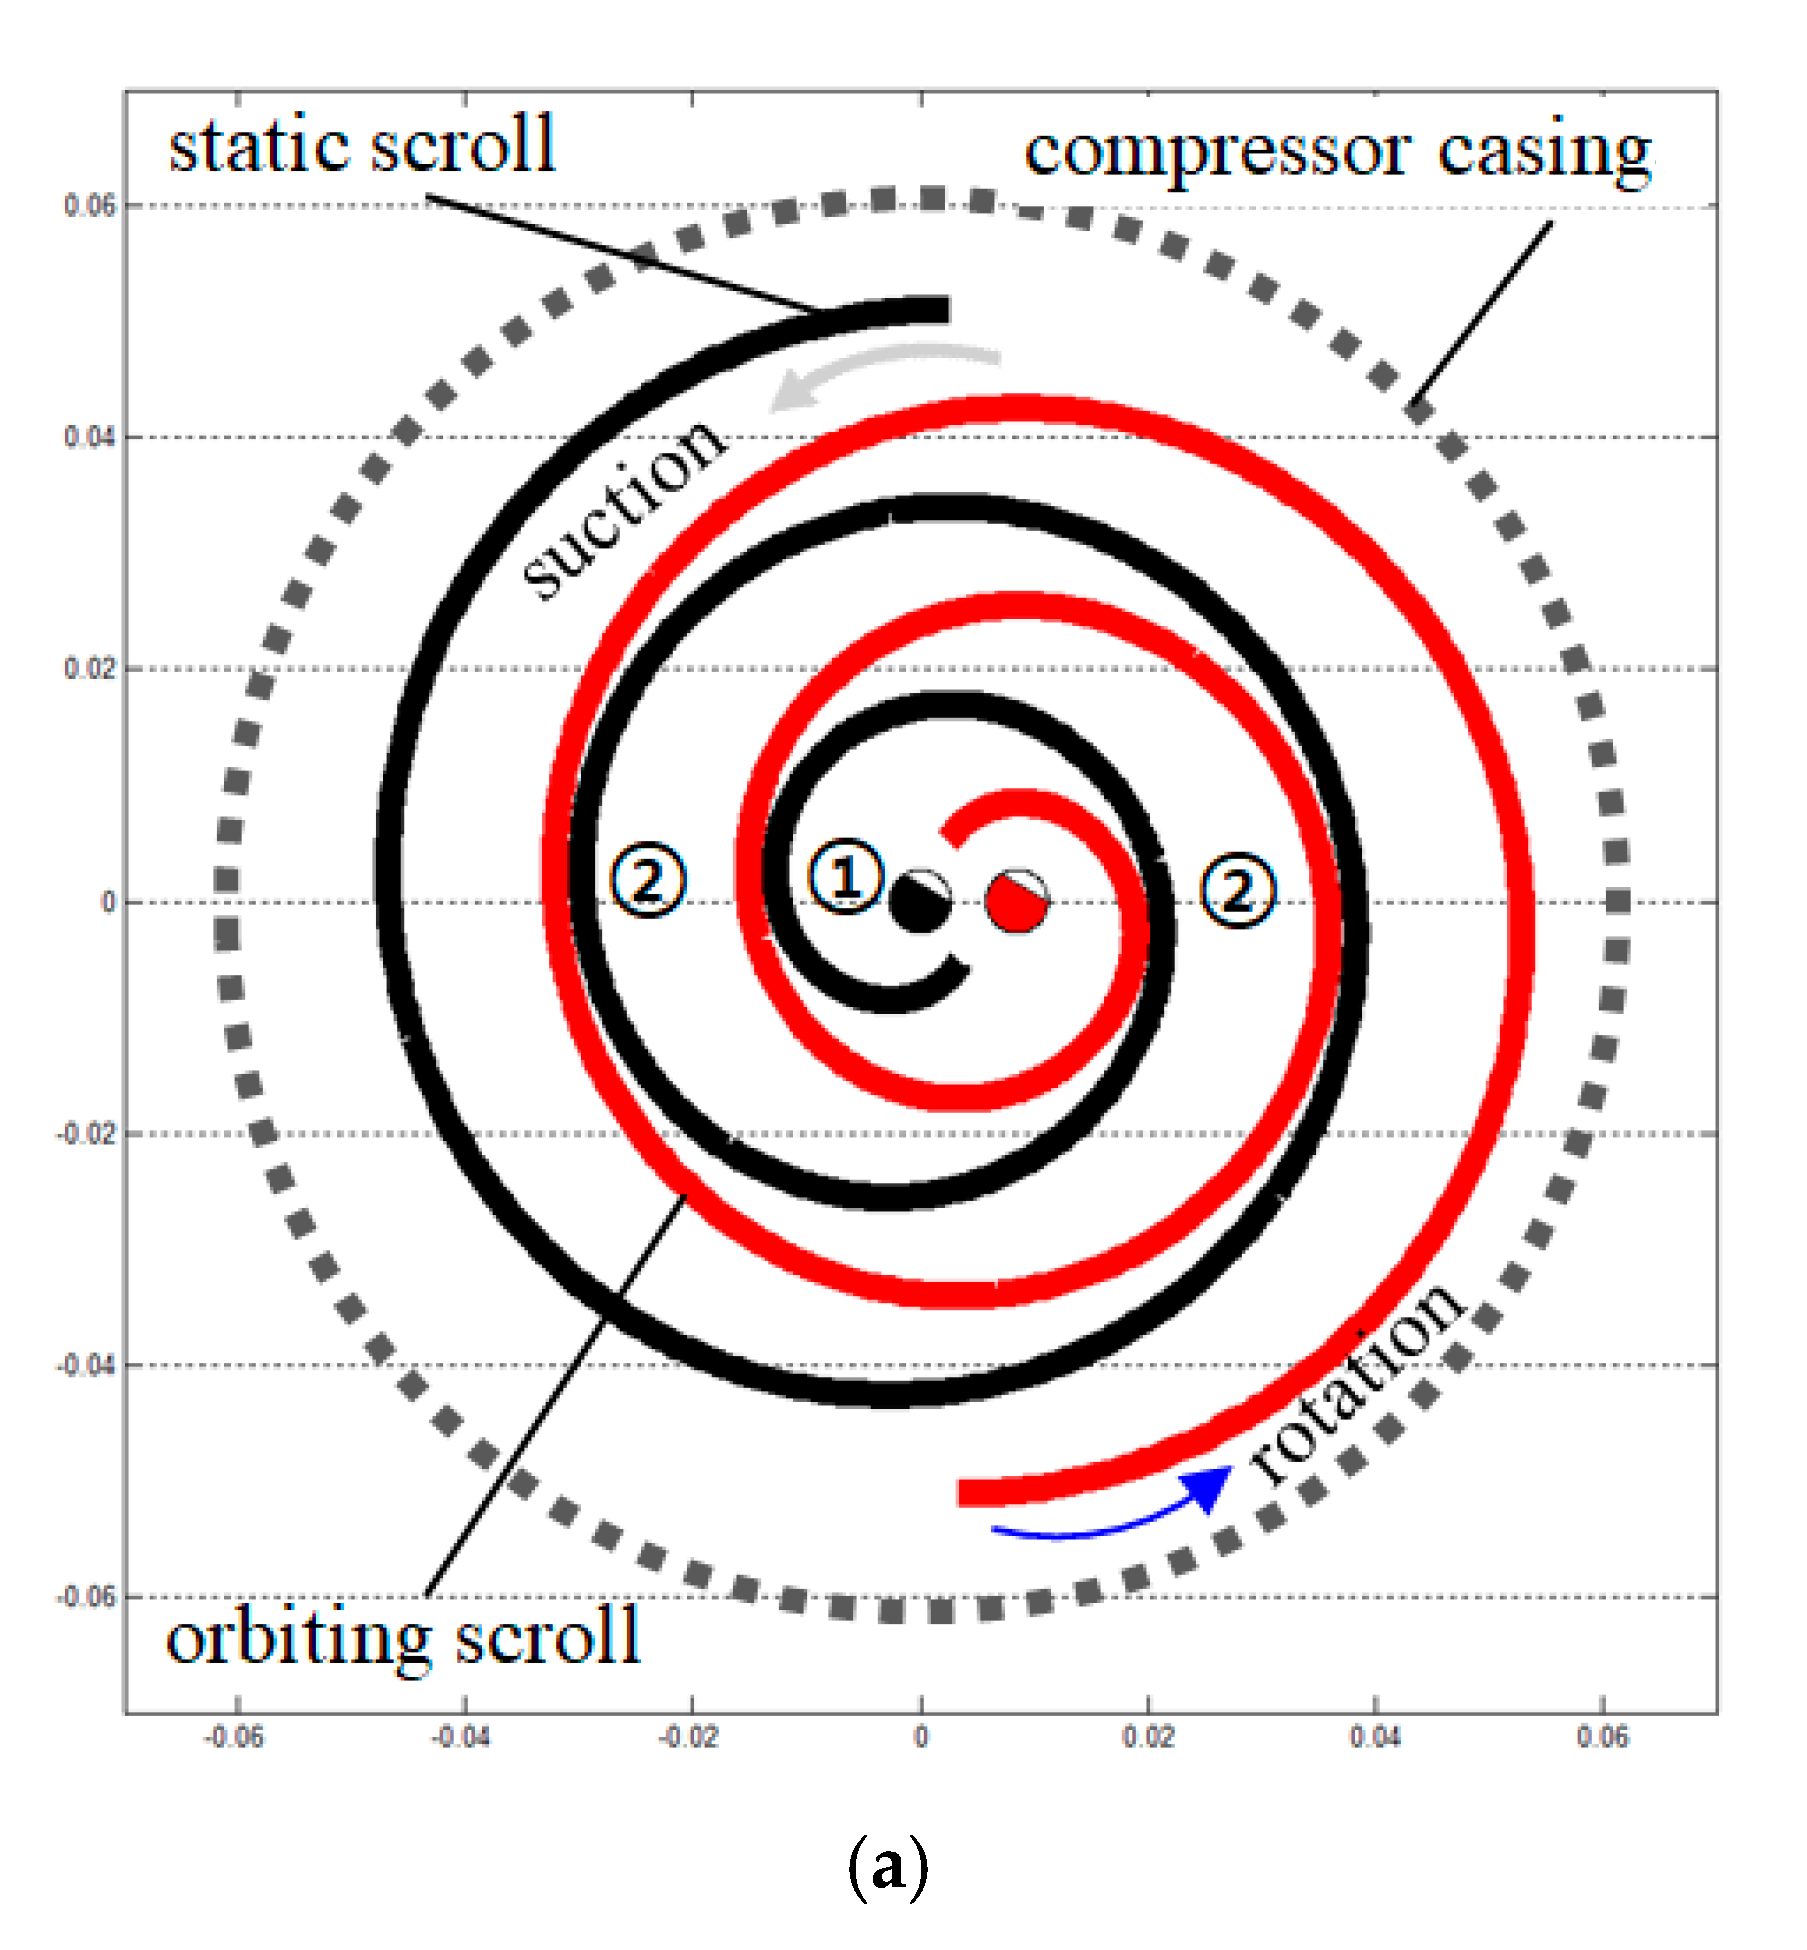
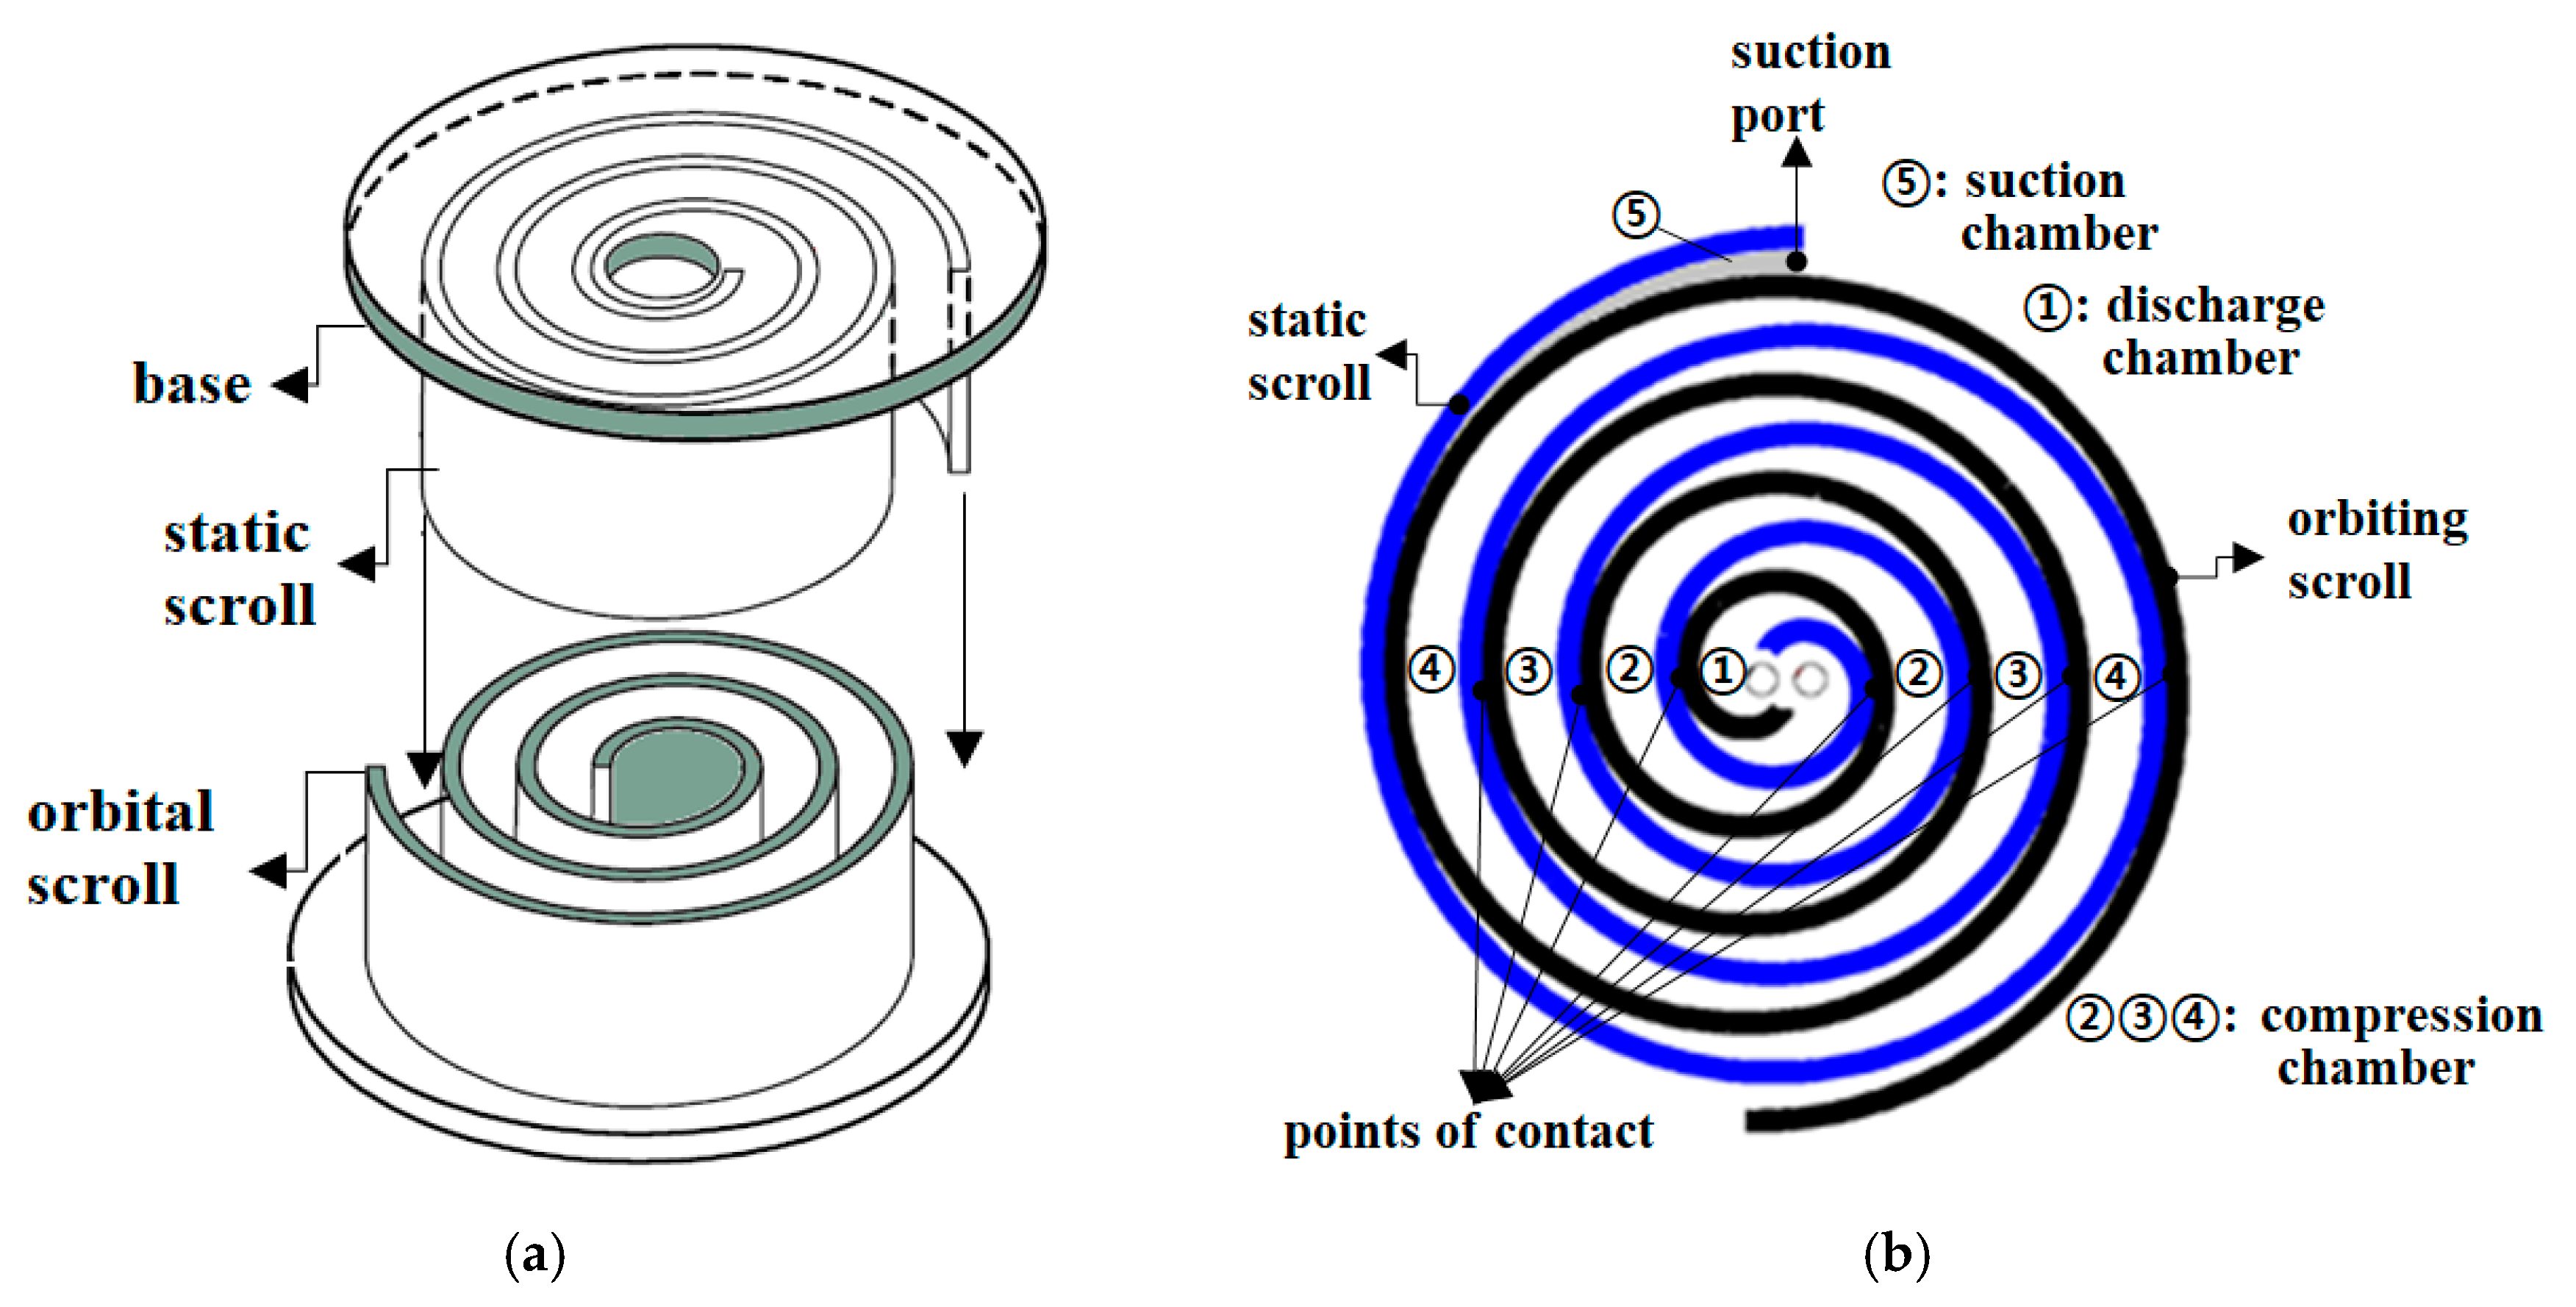
The geometric design of a scroll is the main characteristic that determines the scroll compressor’s performance. A scroll is conceptually an independent metal strip machined into an involute curve. As shown in
Figure 1a, this device consists of a static (or fixed) scroll and an orbiting scroll. On one side, the static scroll is fixed on a flat base, and the orbiting scroll, which is placed on a rotating plate, is inserted from the other side. Both scrolls are geometrically identical, but their basic circles are eccentric with an offset distance. Typically, the scroll located at the top is fixed to the frame or compressor casing, whereas the scroll located at the bottom moves in an orbital pattern due to the eccentricity of the motor shaft, with a rotational center that is aligned to the static scroll.
Figure 1b illustrates the evolution of the suction chamber, compression chamber, and discharge chamber. The void space created by the two scrolls consists of a suction chamber volume in which the refrigerant is driven into the scroll set, a compression chamber volume enclosed by the two scroll wraps, and a discharge chamber volume in which the refrigerant is forced to exit the scroll set through the center region. As the orbiting scroll eccentrically rotates around the shaft, the volume of the refrigerant intercepted by the compression chamber continues to decrease (e.g.,
V④ >
V③ >
V② >
V①) and high-pressure compression is achieved until final discharge.
The shape of the scroll can be represented by the involute of a circle, as depicted in
Figure 2. By definition, the distance between points on the involute and any point on the tangent of the basic circle is constant.
As such, each of the static and orbiting scrolls is defined by two involutes (inner and outer ones) that are developed around a basic circle with a radius R and are offset by a constant distance.
In this study, the geometric modeling of the scroll compressor was based on Reference [
6]. This reference considered a scroll expander, for which the geometric modeling method for the scroll is the same as that of the compressor. However, it was considered that the rotating direction of the orbiting scroll of the compressor should be opposite to that of the expander. Geometric models based on suction, compression, and discharge volumes were presented by Ma et al. [
6], wherein a method for obtaining the contact points of the static scroll and the orbiting scroll was described in detail.
As shown in
Figure 2, the thickness of the scroll wrap is usually determined by the definition of the initial angles (α
o and
αi) of the outer and inner involutes. Any axial position of the involutes can be expressed based on the angles (
φo and
φi) of the inner and outer involutes, as well as the initial angles of the inner and outer involute functions [
16]. Numerous studies on the geometry of scrolls considered new calculations for the volume of the suction, compression, and discharge chambers, including the interaction of static and orbiting arcs based on the initial and involute angles of the involute.
To predict the force generated by the gas pressure, a unit normal vector must be defined for the inner and outer involutes of the orbiting scroll. The elements of a unit normal vector for a typical discretized curve can be defined as Equation (1) [
29].
As shown in Equation (1), there are unit normal vectors in the
x and
y directions at arbitrary points on the curve, and these normal vectors are inversely related to each other. For an orbiting scroll, since the direction of the unit normal vector is the direction of the pressure force, the unit normal vector is chosen so that it points toward the scroll wrap. The unit normal vector for the inner and outer involutes of the orbiting scroll is defined by Equation (2) [
19].
Similarly, the unit normal vector for the static scroll is expressed as follows:
As shown in Equations (1) and (2), the components of the unit normal vector for a parameterized curve are represented as a general mathematical expression (Equation (1)). There are two unit normal vectors for a given point on the curve (x and y components). As shown in Equation (1), the unit vectors have the same size, but their directions are reversed by the product of −1. As a result, Equation (1) was defined as a unit vector that points toward the inside and the outside (see Equation (2)). For the involutes of the orbiting scroll, the direction of the unit normal vector was chosen to face the scroll wrap because the force of the pressure acts in the direction of the scroll wrap.
Given that the direction of the unit normal vector points toward the orbiting scroll wrap and the pressure vector and the unit normal vector coincide, the differential force vector acting on the orbiting scroll can be defined as Equation (4).
where
is the height of the scroll, and Equation (4) can be defined as the force per unit length.
The total force per unit length for the
x and
y directions that act on the inner spiral curve of the orbiting scroll is denoted by Equation (5), defined as the sum of the differential forces as follows:
where
is the total number of discretized involute angles.
From Equatuib (5), the net force acting on the wrap of the orbiting scroll is defined by Equation (6).
Figure 3 depicts the geometric model of the scrolls generated using MATLAB 2015a. The positions of the static and orbiting scrolls are shown for four different orbital angles during 360 degrees of rotation. When the scroll compressor is in operation, the orbiting scroll rotates counterclockwise along the circular orbit with a radius equal to the eccentricity between the two basic circles (see
Figure 1b).
Figure 3 represents the operation cycle of the scroll compressor with the evolution of the compression chamber (② in the figure) and the discharge chamber (① in the figure). The refrigerant is sucked through the suction port (see also
Figure 1b) at the inlet of the static scroll. The orbital angle (
θ) is defined as the angle between the line that connects the centers of the basic circles of the static and orbital scrolls and the horizontal axis.
When
θ = 0 or 2π rad, as in
Figure 3a, the discharge chamber and two compression chambers are denoted by ① and ②, respectively, for convenience. The suction chamber is defined as the open volume near the suction port between the static and orbiting scroll wraps. It can be observed that the volume of the compression chamber continues to decrease as the orbital angle increases to π/2, π, and then 3π/2, as it is driven toward the center of the scrolls. When
θ = π/2, as shown in
Figure 3b, a new compression chamber (③) is created. This chamber was previously the suction chamber in
Figure 3a, but the definition was changed because it is completely enclosed by the static and orbiting scroll wraps due to the increase of the orbiting angle. When the orbital angle reaches 2π rad, both scrolls resume their initial positions and a geometric cycle is completed. The refrigerant achieves the desired high pressure after undergoing a few cycles. As the volume of the compression chamber reaches its minimum value near the center region, it is driven in the normal direction toward the discharge chamber. If the orbital scroll rotates in the opposite direction (clockwise) and the location of the suction and discharge chambers are interchanged, the effect of expanding the working fluid can be observed, as in a scroll expander [
6].
4. Results and Discussion
To validate the time step size, its influence on the predicted discharge pressure and temperature was investigated as summarized in
Figure 6. As shown in Equation (18), the time step (
dt) was calculated from the step of the orbital angle (
dθ). In
Figure 6, the calculated discharge pressure and discharge temperature were compared with each other in (a) and (b), respectively, for five different
dθ values from 1 × 10
−3 to 12 × 10
−3 degrees. Orbital angle steps larger than 12 × 10
−3 degrees resulted in divergence of the calculation results.
It is evident from the figure that, as the orbital angle step (
dθ) increases, the initiation time is earlier, and the duration of the compression process is reduced as predicted. As shown in
Figure 6, a considerable amount of time is required for the calculation as
dθ decreases and the discharge pressure is kept constant, regardless of whether
dθ is in the steady state (discharge process). Therefore, the orbital angle step (
dθ) should be determined by considering the calculation time and experimental results. The orbital angle step of 1 × 10
−3 degrees yielded values that were closest to the experiment results, as shown in
Figure 7. For all calculation results that followed, therefore,
dθ assumed a value of 1 × 10
−3 degrees, which corresponded to a time step size of 0.02 ms. In
Figure 6a, the predicted initiation time of the compression process was 5.67 ms when
dθ = 1 × 10
−3 degrees. In addition, the changes in the predicted discharge pressure were less than 7 kPa among the tested five
dθ values, indicating that the discharge pressure was not significantly affected by the step size of the orbital angle. In
Figure 6b, the discharge temperature was varied from 94 °C to 100.2 °C, resulting in a difference of 6 °C for the entire investigated
dθ range. Overall, a larger step size of the orbital angle resulted in a lower discharge temperature and discharge pressure being predicted.
Figure 7 compares the prediction results for the discharge pressure according to the orbital angle using the experimental results of Wang et al. [
23]. The input conditions for the suction pressure and temperature, in this case, were 324.4 kPa and 4.8 °C, respectively, as shown in
Table 1.
As denoted in
Figure 7, the basic cycle of the scroll compressor consists of a suction process, a compression process, and a discharge process. The discharge pressure remained low and constant during the suction process, increased exponentially during the compression process, and remained constant at a higher pressure during the discharge process. It was observed that the compression process began when the orbital angle reached approximately 323° in the experiment, as well as in the prediction model. The discharge process began when the orbital angle reached 881° in the experiment and 1048° in the prediction, resulting in an error of approximately 167°, a 19% relative error between the experimental and predicted values. Regarding the value of the discharged pressure, the error between the experimental and the prediction results was less than 1% during the suction process. During the compression process, however, the prediction results were higher than the experiment results by up to 17.2% (based on the absolute pressure) at the maximum value. During the discharge process, the pressure obtained based on the experimental and the prediction model was 1517 kPa and 1574 kPa, respectively, indicating that the prediction result was higher by less than 3.14% (based on the absolute pressure).
Overall, the pressure predicted using the presented model reliably agreed with the experimental values during the suction and discharge processes. However, large (approximately 17%) errors were observed for the pressure during the compression process as well as the orbital angle at which the discharge process began.
Figure 8 represents the discharge temperature according to the orbital angle predicted by the presented model compared to the results obtained by Wang et al. [
23]. The figure shows that the presented model exhibits a similar behavior compared to that of Wang et al.
Similar to the discharge pressure, the discharge temperature remained constant during the suction process, exponentially increased during the compression process, and remained constant at a higher temperature during the discharge process. The compression process began when the orbital angle was approximately 362° according to Wang et al.’s result, which corresponded with the prediction of the presented model. In addition, the discharge process began when the orbital angle was 913° in Wang et al.’s result, but 1139° for the prediction based on the present modeled. This resulted in an error of approximately 226°, a 25% relative error between the two values. Regarding the value of the discharged temperature, the relative error was less than 1% during the suction process. However, the results for the presented model were higher than those reported in the reference by up to 4.1% during the compression and discharge processes. The prediction of the discharged temperature during the entire cycle was in good agreement with Wang et al.’s result.
It is noted in
Figure 7 and
Figure 8 that the presented model produced significantly different predictions, particularly for the orbital angle (and corresponding time) for the termination of the compression process (i.e., the initiation of the discharge process). The presented model predicted an exponential and smooth transition from the compression to discharge processes, whereas the experimental data revealed a sudden transition for the same processes. As shown in
Figure 6 and
Figure 7, in the discharge process, the predicted results did not exhibit overshoot of pressure and temperature due to over-compression, unlike the experimental results. It was determined that the relative errors for the discharge pressure and orbiting angle were large. As noted in previous studies [
30], over-compression depends on the dimensions of the outlet port, shape, and mass flowrate.
To solve Equations (11) and (16) simultaneously, the volume change rate over time
must be obtained using the geometric motion equation. As indicated in
Figure 3, there were two compression chambers, and they were named compression chambers 1 and 2 for convenience. Compression chamber 1 is adjacent to the suction chamber, whereas compression chamber 2 is close to the discharge chamber.
Figure 9a shows the rate of the volume change of compression chambers 1 and 2, whereas
Figure 9b shows the volumes of the two compression chambers over time. The input geometric parameters are presented in
Table 1. As shown in
Figure 9a, the rate of volume change exhibited a 10
−3 m
3/s order. The volume change rate of compression chambers 1 and 2 ranged from −3.74 × 10
−4 m
3/s to 2.97 × 10
−3 m
3/s, and the period was approximately 0.011 ms. The volume change dV/dt in
Figure 9a shows the rate of increase of decrease of the volume [
6]. The volume changed from positive (the increase of the cavity volume) to negative (the decrease of the cavity volume). The volume of compression chamber 1 ranged from 70 cm
3 to 45 cm
3 with a period of 0.011 ms.
In contrast, the volume of compression chamber 2 ranged from 76 cm
3 to 46 cm
3 with the same period as compression chamber 1. A detailed description of the volume change in the scroll chamber resulting from the shaft rotation was described in detail in Reference [
6].
Figure 10 shows the variation of temperature and pressure of compression chambers 1 and 2 over time. As can be seen in the figure, the compression process began at approximately 6 ms. The pressure and temperature of compression chamber 1, which was adjacent to the suction chamber, were calculated to be slightly less than those of compression chamber 2, by approximately 3 °C and 39 kPa, respectively. Since the calculation for the thermodynamic model was performed in the order of the suction chamber, compression chamber 1, compression chamber 2, and discharge chamber, the temperature and pressure were relatively higher for the regions that were closer to the discharge chamber. As such, the volume of a chamber was treated as a control, and an algorithm was utilized such that calculations were performed sequentially from the suction chamber to the discharge chamber.
Figure 11 illustrates the mass flow rate of the refrigerant as a function of time for two different compressor frequencies of 30 Hz and 40 Hz. The mass flow rate was predicted using Equations (20) and (21). In the figure, the mass flow rate increases as the compressor frequency increases, and it varies with a constant period. Since the total leakage area,
A, in Equations (20) and (21) includes the leakage areas in the flank and radial directions, the mass flow rate exhibited a periodic variation.
For a compressor frequency of 30 Hz, the mass flow rate varied between 0.023 kg/s and 0.044 kg/s with a constant period. For a compressor frequency of 40 Hz, the mass flow rate varied periodically between 0.025 kg/s and 0.046 kg/s.
Figure 12 represents the discharge temperature over time when the compressor frequency was varied from 30 Hz to 60 Hz, with 10-Hz increments. As the compressor frequency was increased, an earlier initiation time of the compression process was predicted. When a steady state was achieved, the discharge temperature for the compressor frequency of 60 Hz was approximately 0.9 °C higher than that for the compressor frequency of 30 Hz. The compression process was initiated at 5.8, 4.9, 3.9, and 2.4 ms for the input conditions of 30, 40, 50, and 60 Hz respectively.
Figure 13 shows the variation of discharge pressure over time as the compressor frequency was varied from 30 Hz to 60 Hz for the same increments. As the compressor frequency was increased, an earlier initiation time of the compression process was predicted as shown in
Figure 13. When the steady state was reached, the discharge pressures at 30 Hz and 60 Hz were calculated to be 1571 kPa and 1574 kPa respectively, resulting in a difference of only 3 kPa. Based on the results shown in
Figure 12 and
Figure 13, the discharge temperature and pressure of the compressor were not significantly affected by the frequency. This is evident in the case when the compressor is not installed in a system but operated by itself, because the pressure and the temperature in the suction chamber would be held at a constant value at different frequencies.
Figure 14 shows the variation of the discharge temperature over time when the suction chamber inlet pressure was varied from 3 bar to 5 bar. The suction chamber inlet pressure and temperature were utilized as the input conditions. The suction chamber inlet temperature is defined as the saturation temperature for the input pressure. It can be estimated, based on the figure, that the saturation temperatures for the pressures of 3, 4, and 5 bar are −14 °C, −6 °C, and 0.7 °C respectively, which were calculated using the REFPROP software. The figure shows that the earlier initiation time of the compression process was predicted when a higher pressure was applied at the suction chamber inlet. The initiation times of the compression process were predicted to be 8.52, 4.45, and 2.8 ms for the suction chamber inlet pressures of 3, 4, and 5 bar, respectively. As the suction chamber inlet pressure was increased, the discharge temperature increased due to the increase of the corresponding saturation temperature. For the suction chamber inlet pressures of 3, 4, and 5 bar, the steady-state temperatures of the compression process were calculated to be 75, 82.2, and 95.1 °C, respectively.
As shown in
Figure 8,
Figure 10,
Figure 12 and
Figure 14, the oscillations of the temperature and pressure are predicted, and they were evaluated to be dependent on rotational speed and inlet pressure.
Figure 15 represents the variation of the discharge pressure over time when the suction chamber inlet pressure was varied from 3 to 5 bar. The input conditions were the same as in
Figure 14. In
Figure 15, it is evident that, as the suction chamber inlet pressure increases, the earlier initiation time of the compression process is predicted, and the discharge pressure increases accordingly. For the suction chamber inlet pressures of 3, 4, and 5 bar, the steady-state pressures of the compression process were calculated to be 1548, 1678, and 1795 kPa, respectively.
Figure 16 illustrates the variation of the force acting on the spiral line of the scroll over time as a function of the suction chamber inlet pressure. This force was predicted using Equation (6) and exhibited periodic variation. As shown in the figure, as the suction chamber inlet pressure increases, the force per unit length acting on the scroll increases. This is because the pressure difference among the different volumes increases relative to the inlet pressure. As can be seen in
Figure 14, the differences between the suction chamber inlet pressure and the discharge pressure were 1230, 1255, and 1284 kPa for the inlet pressures of 3, 4, and 5 bar, respectively. This indicates that the pressure difference increased as the suction chamber inlet pressure increased. For this reason, the force increased proportionally to the increase of the inlet pressure. When the suction chamber inlet pressure was 3 bar, the force varied periodically from 5.44 kN/m to 9.05 kN/m. The force periodically varied from 5.17 to 9.15 kN/m for the suction chamber inlet pressure of 4 bar, and it varied from 4.97 to 9.22 kN/m for the inlet pressure of 5 bar.


