Article

Effects of Geometric Parameters on the Physical Mechanisms of Supersonic Fluidic Oscillators

College of Energy and Power Engineering, Nanjing University of Aeronautics and Astronautics, Nanjing 210016, China
*
Author to whom correspondence should be addressed.
Energies 2020, 13(15), 3919; https://doi.org/10.3390/en13153919
Submission received: 11 June 2020 / Revised: 30 July 2020 / Accepted: 30 July 2020 / Published: 31 July 2020

Abstract

:
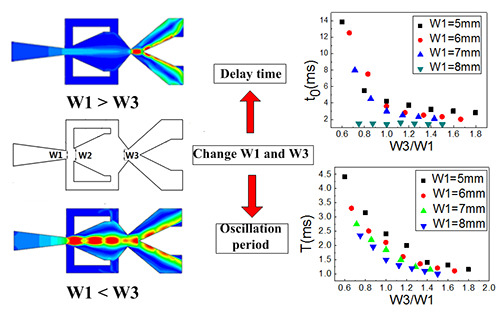
This paper considers supersonic oscillators, in which the widths of the power nozzle and throat are the significant geometric parameters in characterizing the different internal flow characteristics. Supersonic fluidic oscillators with different power nozzle and throat widths are studied through time-dependent numerical computations. Two characteristic parameters, namely the delay time for the initiation of oscillation t0 and the oscillation period T, are selected to describe the physical mechanisms of the various oscillators. The Mach numbers and streamlines at different times are also used to investigate the flow characteristics. The results show that, when the power nozzle exit width is much smaller than the inlet width of the mixing chamber, the delay time decreases as the throat width increases. Changing the throat width of the oscillator does not significantly affect the delay time t0 when the power nozzle exit width is equal to the inlet width of the mixing chamber. The oscillation period decreases gradually as the oscillator throat width increases. It is found that there exists a critical throat width which determines whether the oscillators work.

Graphical Abstract

1. Introduction

Fluidic oscillator is a kind of fluid device which can produce alternating or sweeping jets by inputting a certain pressure of working fluid. The flow can also exit alternately through discrete outlets. The oscillations are solely based on the unique spatial configuration of the device. In recent years, scholars have found that fluidic oscillators have great potential for applications in noise suppression [1], combustion [2], flow separation control [3], and drag control [4]. There are many kinds of fluidic oscillators. According to their different internal structures, they can be divided into wall-attachment [5], jet-interaction [6], and cavity resonating [7] fluidic oscillators. The working mechanism of wall-attached fluid oscillators is shown in Figure 1. The jet flows into the mixing chamber through the power nozzle, and Kelvin–Helmholtz instabilities then cause the main jet to deflect to either side wall (known as the Coanda effect). Part of the fluid is then turned into the feedback channel, which diverts the flow in the opposite direction. The recirculation bubble makes the incoming mainstream to the other side of the mixing chamber, causing a pulse jet at two outlets.
Many studies have investigated wall-attached jet oscillators. Yanrong et al. [8] found that, at low Reynolds number, the oscillation frequency increases nonlinearly with any increase in the jet velocity. Similarly, Gosen et al. [9] found that the oscillation frequency increases with the increase of jet Mach number and reached a limit value when the Mach number of the jet reached 1. Wu et al. [10] reported that, when the main jet flowed out along one of the exits, the other exit was subjected to a backflow due to the formation of a low-pressure region in the mixing chamber. Bernhard et al. [11] discovered that the recirculation bubble in the mixing chamber is an important factor in the oscillation of the jet. According to their findings, a portion of the main jet was diverted into the feedback channel back to the inlet of the device. The recirculation bubble grows in size and propagates downstream. The oscillating frequency is affected by the size and position of the recirculation bubble. Gokoglu et al. [12,13] tried to increase the velocity of the jet from subsonic to supersonic. All of these papers above reveal the working mechanisms of subsonic jet oscillators. When the jet in the oscillator is in a subsonic state, the delay time of oscillation is decided by the velocity of the jet and the velocity of sound. In the supersonic case, the delay time is no longer affected by the velocity of the jet. Raman et al. [14] studied an ultrasonic oscillator with a rectangular nozzle. They found that, when the Mach number in the oscillator reaches 1.58, the jet becomes symmetrically attached to the wall on both sides and stops oscillating. By increasing the short-edge length of the rectangular nozzle, the Mach number of the oscillating jet could be raised to 1.8.
The deflection characteristics of the wall jet element are related to its geometric structure and the fluid Reynolds number, and the low-pressure eddy current induces the main jet to attach to the wall. Many studies on oscillators are limited to subsonic cases. Incompressible liquids are often used in low-Mach-number environments. The oscillator can be applied to flow control, such as delay of separation of boundary layer, supersonic flow mixing, and flow direction control for vectored thrust. With an increase in the need for flow-controlled fluid oscillators, the outlet velocity of the jet should be increased, which will lead to high oscillation frequencies. The high oscillatory frequencies are very challenging for experimental measurements. To simplify the experiments and reduce the oscillation frequency, the working fluid may be changed from air to water [15] or the size of the oscillator may be increased to reduce the outlet velocity to an incompressible low speed [16]. Therefore, there are few studies on supersonic jet oscillators. At present, the mechanism of oscillation and the development of supersonic flow in the mixing chamber for supersonic oscillators are not sufficiently clear. This paper describes the numerical calculations and analysis of supersonic wave-attached wall-type oscillators with different structures. Several geometric variations are formed by changing the widths of the power nozzle and the throat, allowing the effect of the geometric parameters on the physical mechanisms of the oscillator to be comprehensively explored.

2. Oscillator Structure and Numerical Method

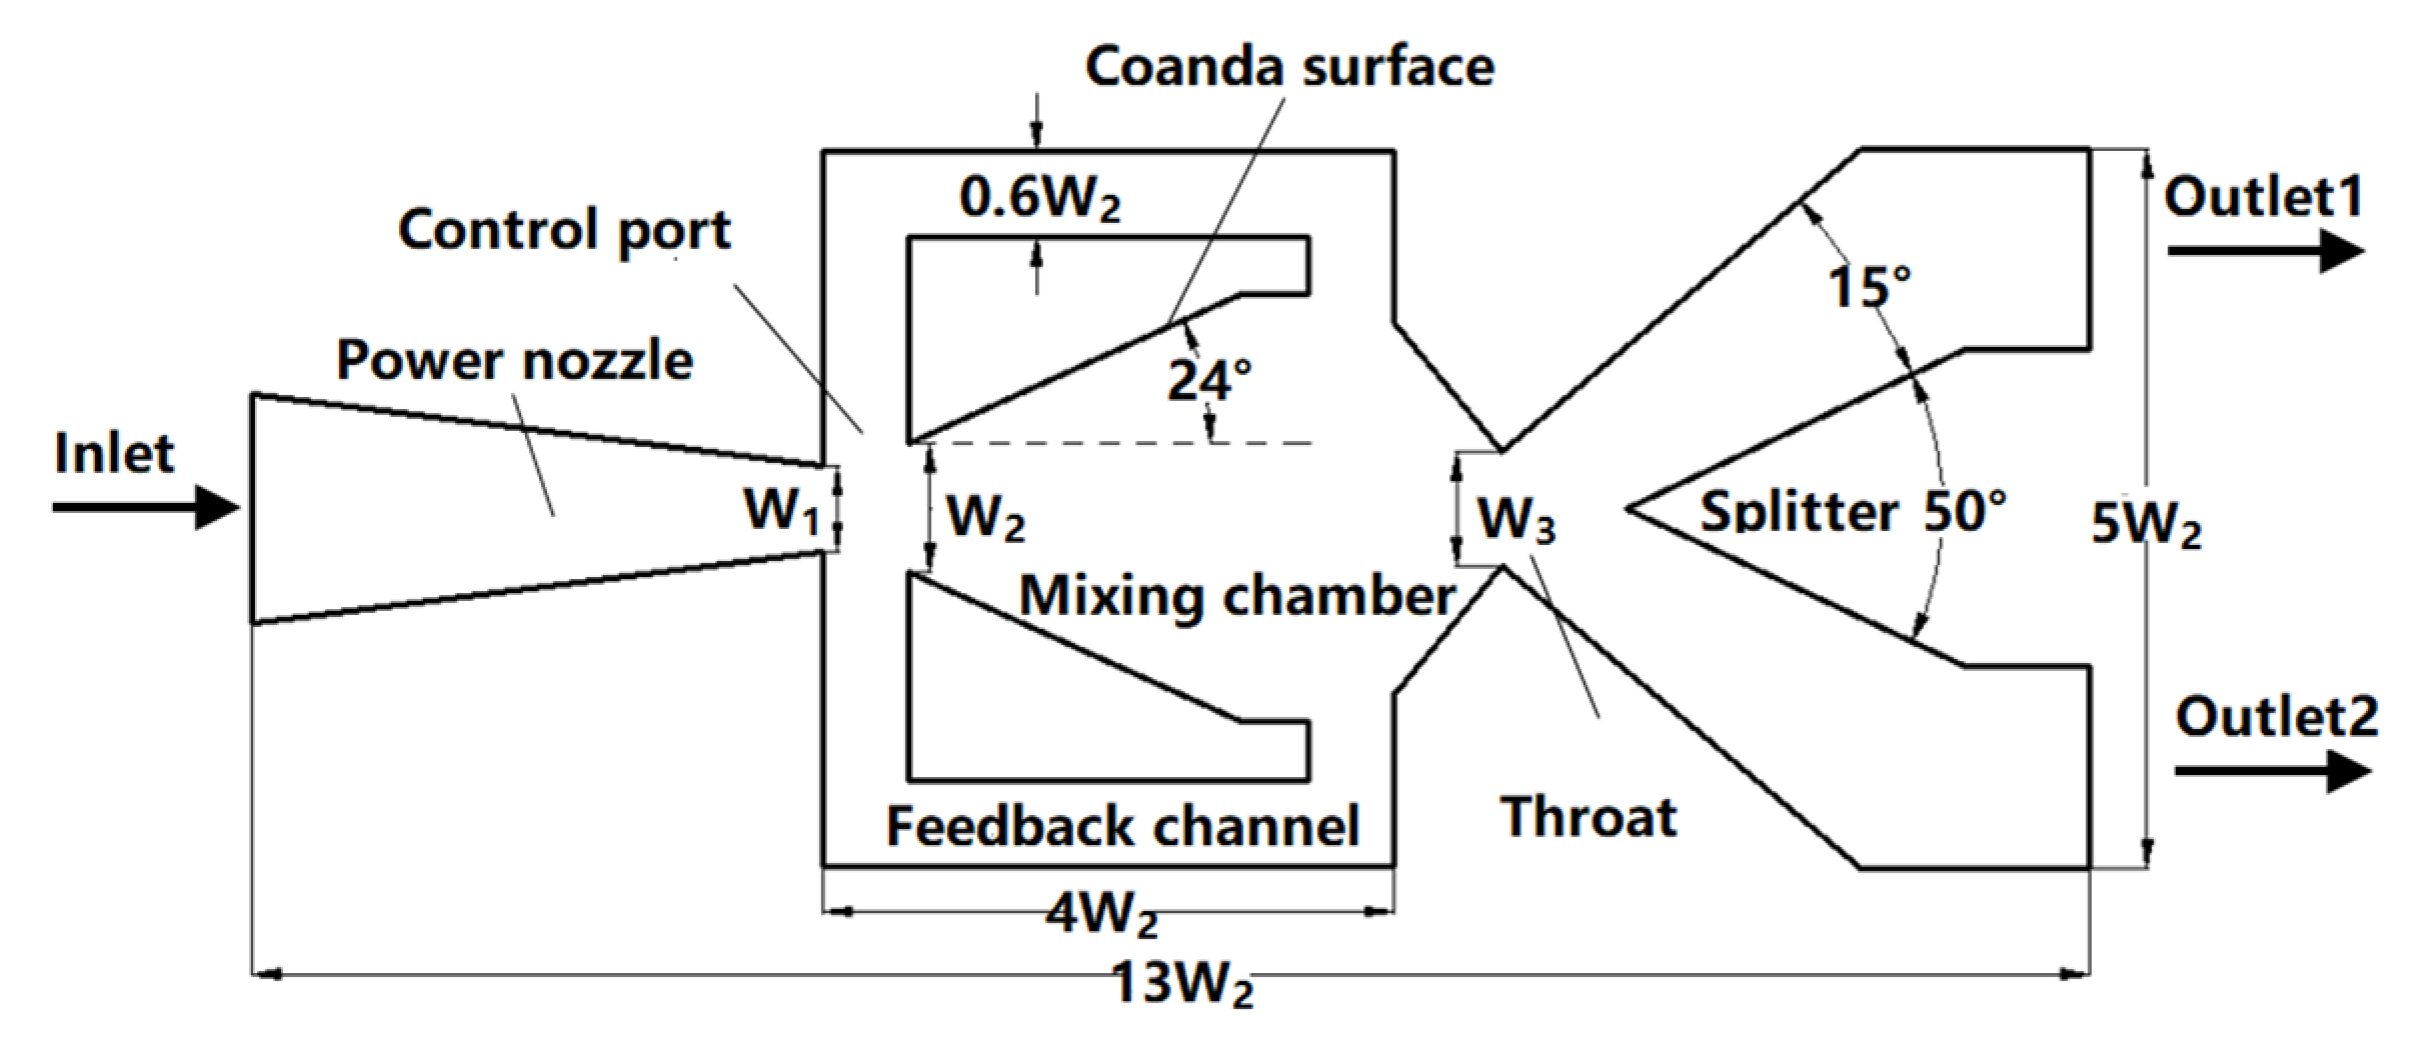
The baseline geometry was selected from [11]. The geometry and dimensions of the wall-attached jet oscillator considered in this paper are shown in Figure 2. The power nozzle exit width is W1 and the inlet width of the mixing cavity is W2.
The expansion angle of the Coanda surface on both sides of the mixing chamber is 24°. The width of the outlet of the mixing cavity (i.e., the throat) is W3. The width of the feedback channel is 6 mm. The external angle of the split wedge (splitter) is 50°, and the expansion angle of the two channels separated by the split wedge is 15°. The whole oscillator measures 129 mm in length and is 50 mm wide. By changing the nozzle width W1 (varying from 5 to 8 mm) and throat width W3 (varying from 3 to 15 mm), series of physical models are obtained. In this paper, the different models are numbered according to the values of W1 and W3, e.g., M5, 3 indicates that W1 = 5 mm and W3 = 3 mm. The W2 is fixed throughout the text at 10 mm. W1 and W3 are normalized by W2.
All simulations were carried out using FLUENT 16. The simulation was two-dimensional. A second-order implicit discretization in time was selected for the unsteady numerical simulation. The flow equations were discretized by a second-order upwind scheme. Previous studies have shown that it can provide stability for supersonic flows and captures shocks well [13]. Spatial gradients were reconstructed by a least-squares cell-based method. The time step was set to 1 × 10⁻⁶ s, and the residual errors of all physical quantities were maintained below 1 × 10⁻⁴.
The working fluid was air; it was assumed to be ideal gas. At the beginning of the power nozzle, there was a pressure inlet under conditions of 3.67 atm and 298 K. The two outlets were open to the ambient environment. We used isentropic relationships to calculate the flow condition. Under isentropic conditions, the ratios of the temperature (T0) and pressure (p0) at the inlet to the respective flow exit temperature (T)) and pressure (p) at the outlet are related to the Mach number (Ma) as follows:
T 0 / T = 1 + ( γ     1 ) / 2   Ma 2
p 0 / p = [ 1 + ( γ     1 ) / 2   Ma 2 ] γ / ( γ     1 )
where γ is the ratio of the specific heat at constant pressure to specific heat at constant volume. Assuming that p∞, the ambient pressure, is 1 atm, and the fluid is air (γ = 1.4), when pressured with 3.67 atm at the inlet, the Mach number at the outlet can reach 1.5 when the gas is perfectly expanded.
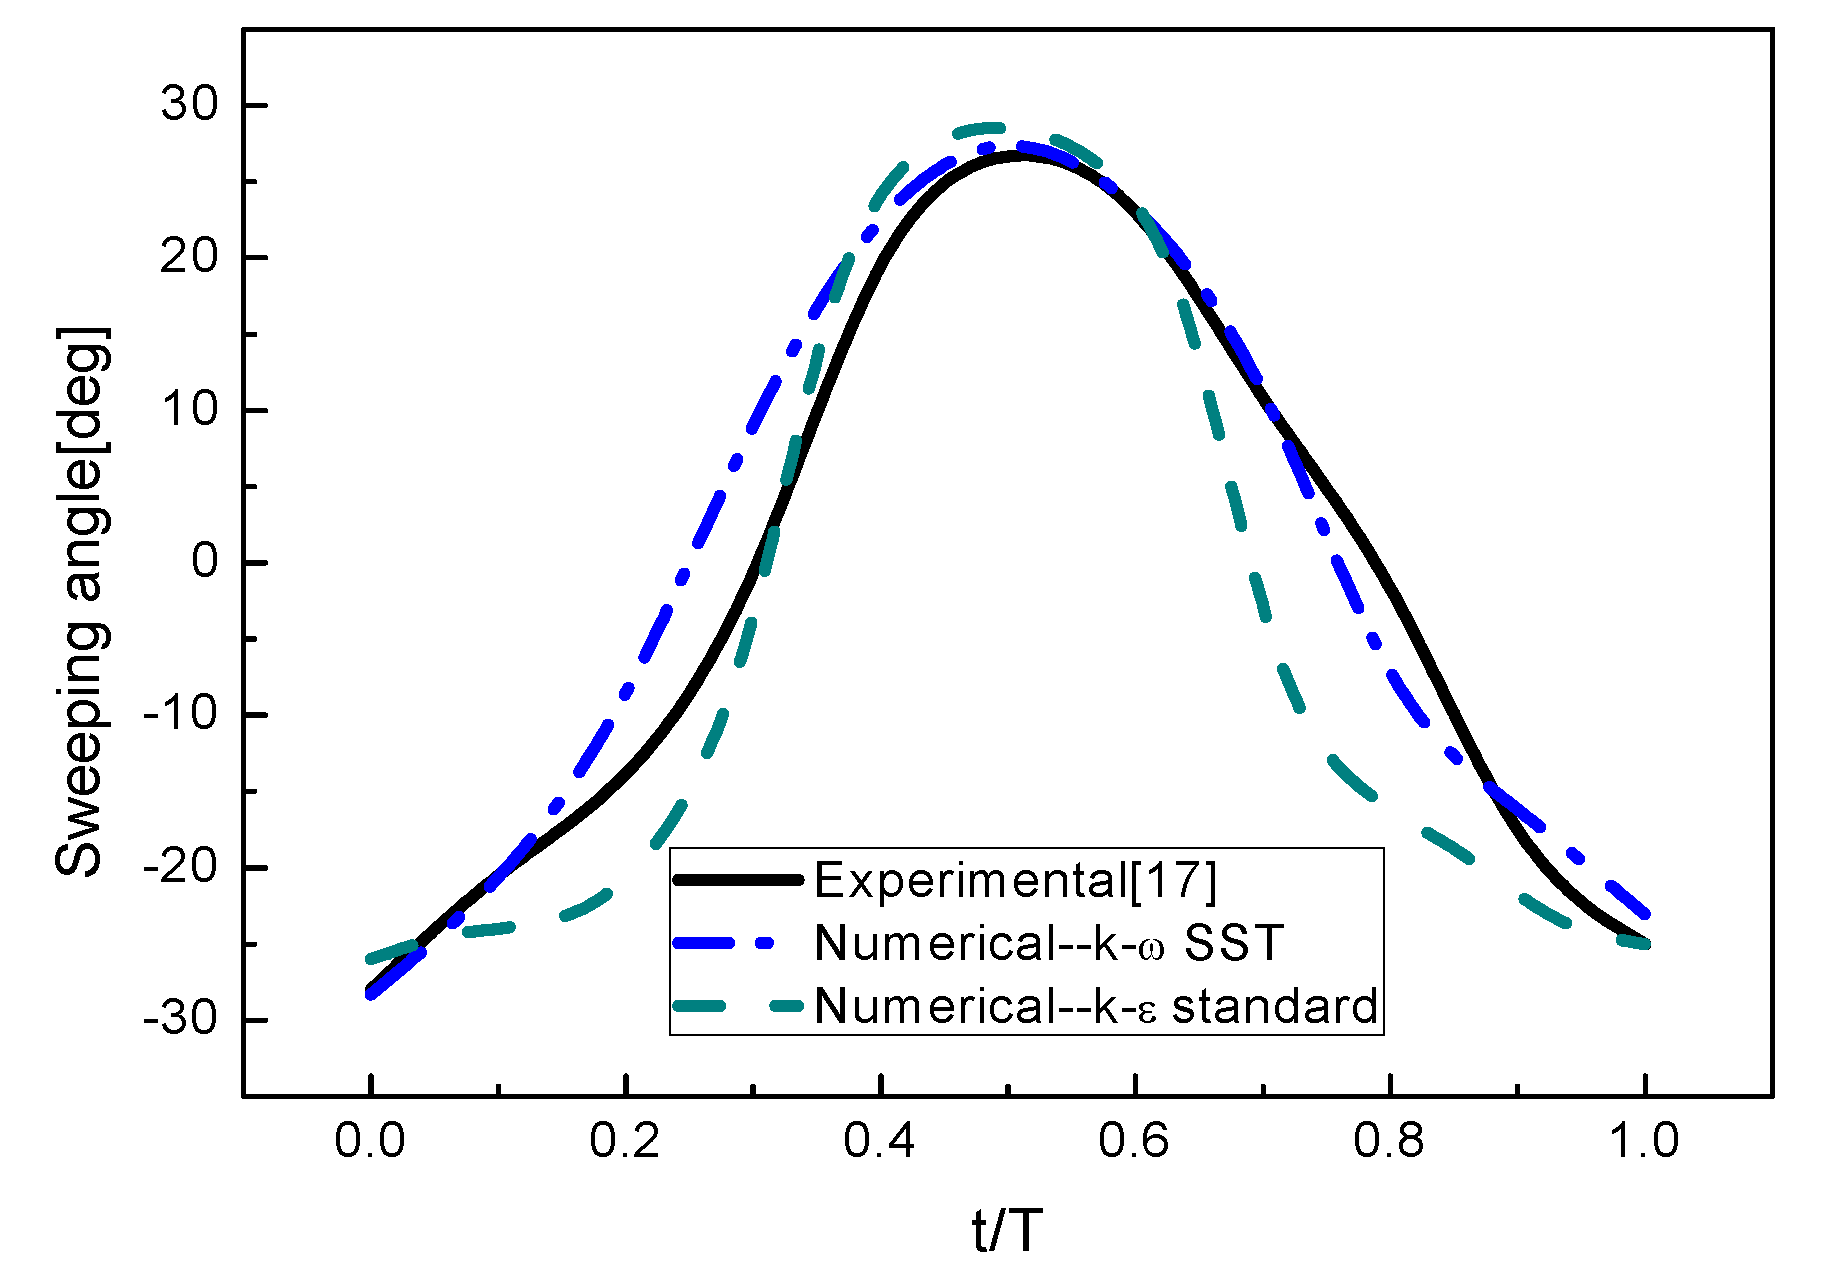
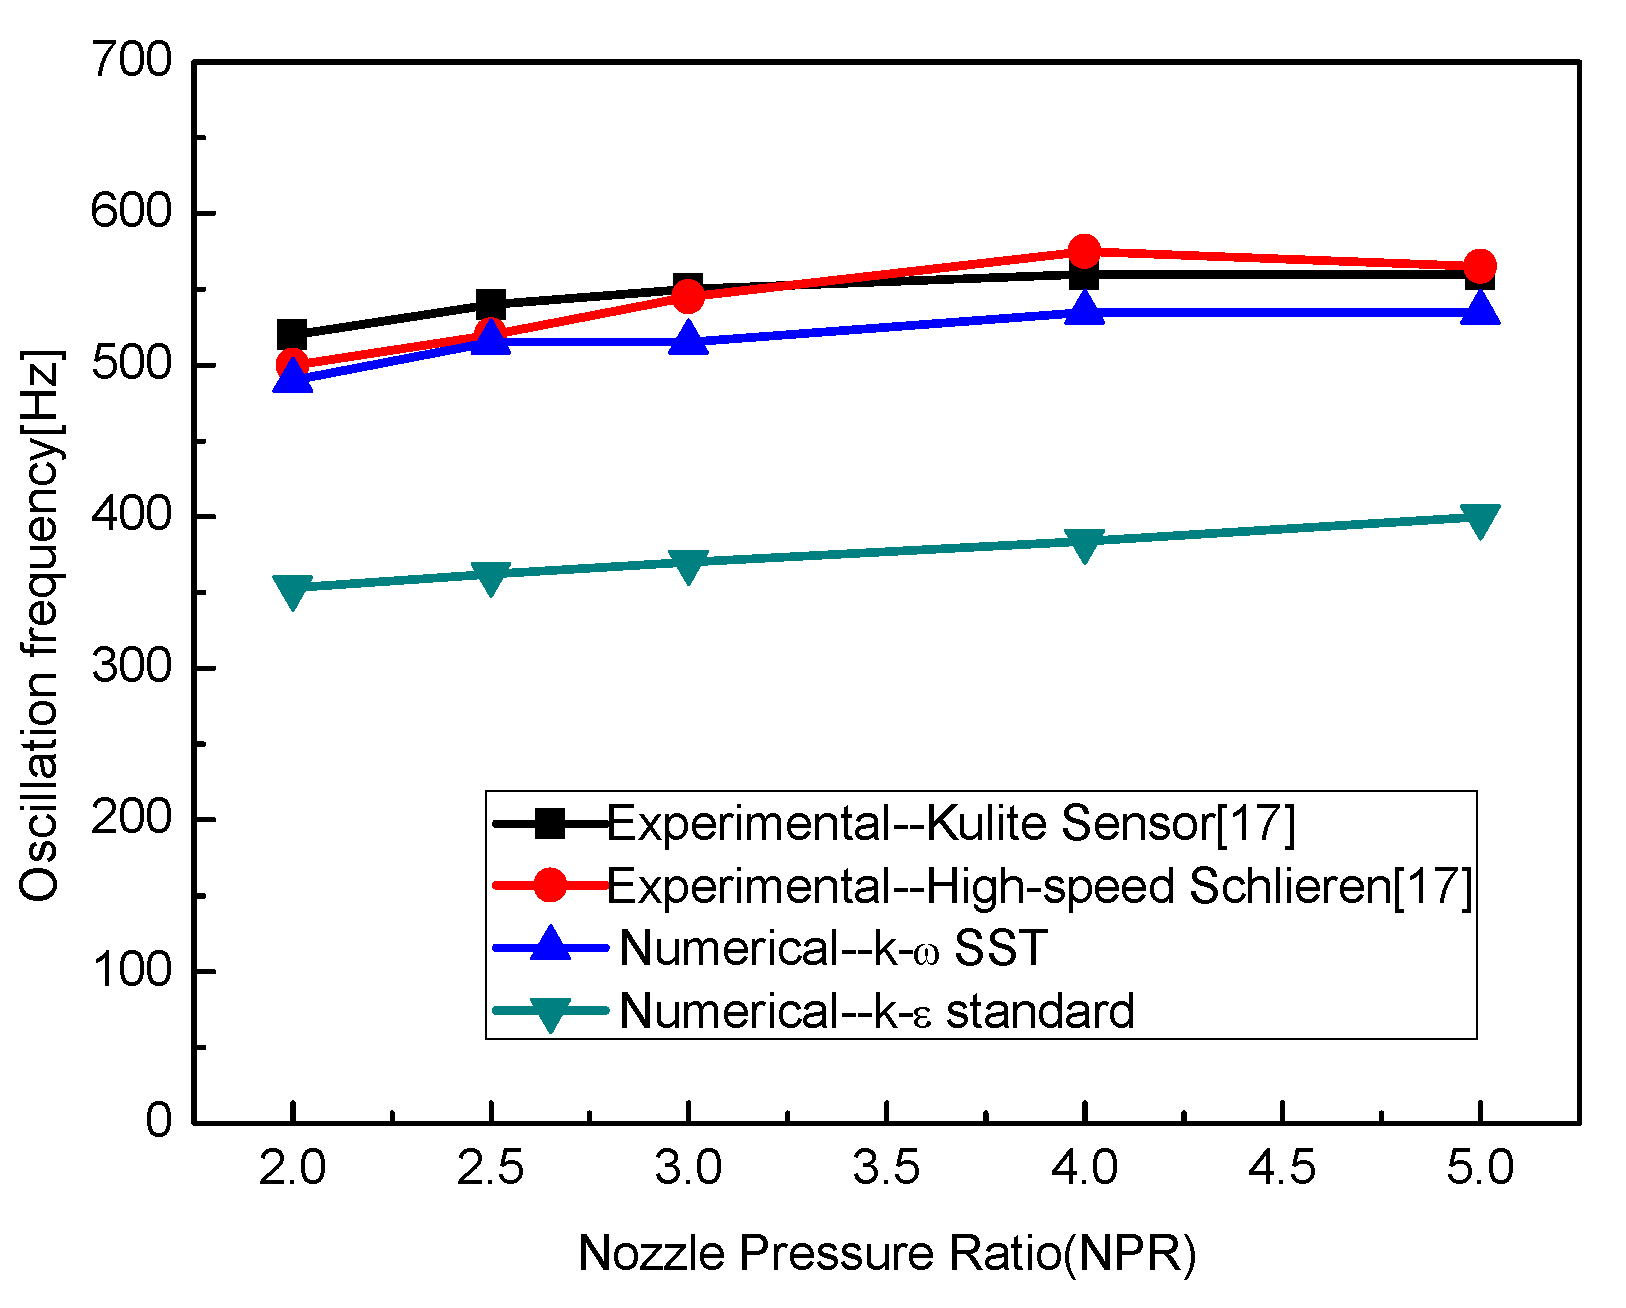
For the cases considered in this paper, the average velocities at the section of W2 are in the range of 130–580 m/s. The working fluid is air, which is assumed to be ideal gas. Hence, the Reynolds numbers are in the range of 93,000–350,000. The Reynolds number is large enough to assume fully turbulent flow. The turbulence model plays a decisive role in the numerical results. To validate the accuracy of the turbulence model, two different approaches were tested, namely the k-ε standard model and the k-ω shear-stress transport (SST) model. The unsteady computational results using the k-ω SST and k-ε standard turbulence model were compared to the available experimental data [17]. The geometric size of the calculated model was consistent with the experimental model. The nozzle pressure ratio (NPR) is defined as the ratio of supplied pressure to ambient pressure. All tests were carried out under supersonic jet conditions with NPR values from 2 to 5. In [17], quantitative measurements of the sweeping jet angle at the oscillator exit are achieved using the Canny edge-detection method via the Schlieren images. The sweeping jet centerline is calculated using the straight line between the center of the selected pixel masses and the center of the nozzle throat, and it is defined as the sweeping jet angle. The maximum jet sweeping angle is determined by averaging the maximum values of the sweeping angle in each period in the wave pattern. Figure 3 shows the variation of sweeping angle with time over one period. Compared with the computational results using the k-ε standard turbulence model, the k-ω SST turbulence model provided better agreement with the experimental results [17]. The oscillation frequencies under different NPRs were simulated and compared results with results in [17], as shown in Figure 4. In addition to the frequency results from FFT of the pressure signal, the frequency results of the high-speed Schlieren visualization are also presented, which are estimated by measuring the periods from peak to peak in the jet sweeping angle. The accuracy of the frequency results from FFT has an uncertainty error of ±0.2% due to the multiple time-band selections and ±2% repeatability errors. FFT and Schlieren provide similar frequency results that are within about 3%. The oscillation frequency approaches the saturation limit in the supersonic flow regime. This narrower frequency band characteristic of the supply pressure is a feature of the supersonic sweeping jet [12,13]. The variation in frequency is consistent with the experimental results. The computational results given by the k-ω SST turbulence model are closer to the experimental results than those of the k-ε standard turbulence model. Additionally, in a previous study, Oliver et al. [18] investigated a fluidic oscillator numerically. By comparing the numerical simulation results with the experimental results, they found that the SST model can accurately calculate the oscillation frequency. The flow field structure is in good agreement with the experimental results. Therefore, all the numerical investigations reported in this paper are based on the k-ω SST turbulence model.

3. Results and Analysis

3.1. Effect of Power Nozzle Exit Width and Throat Width on the Delay Time

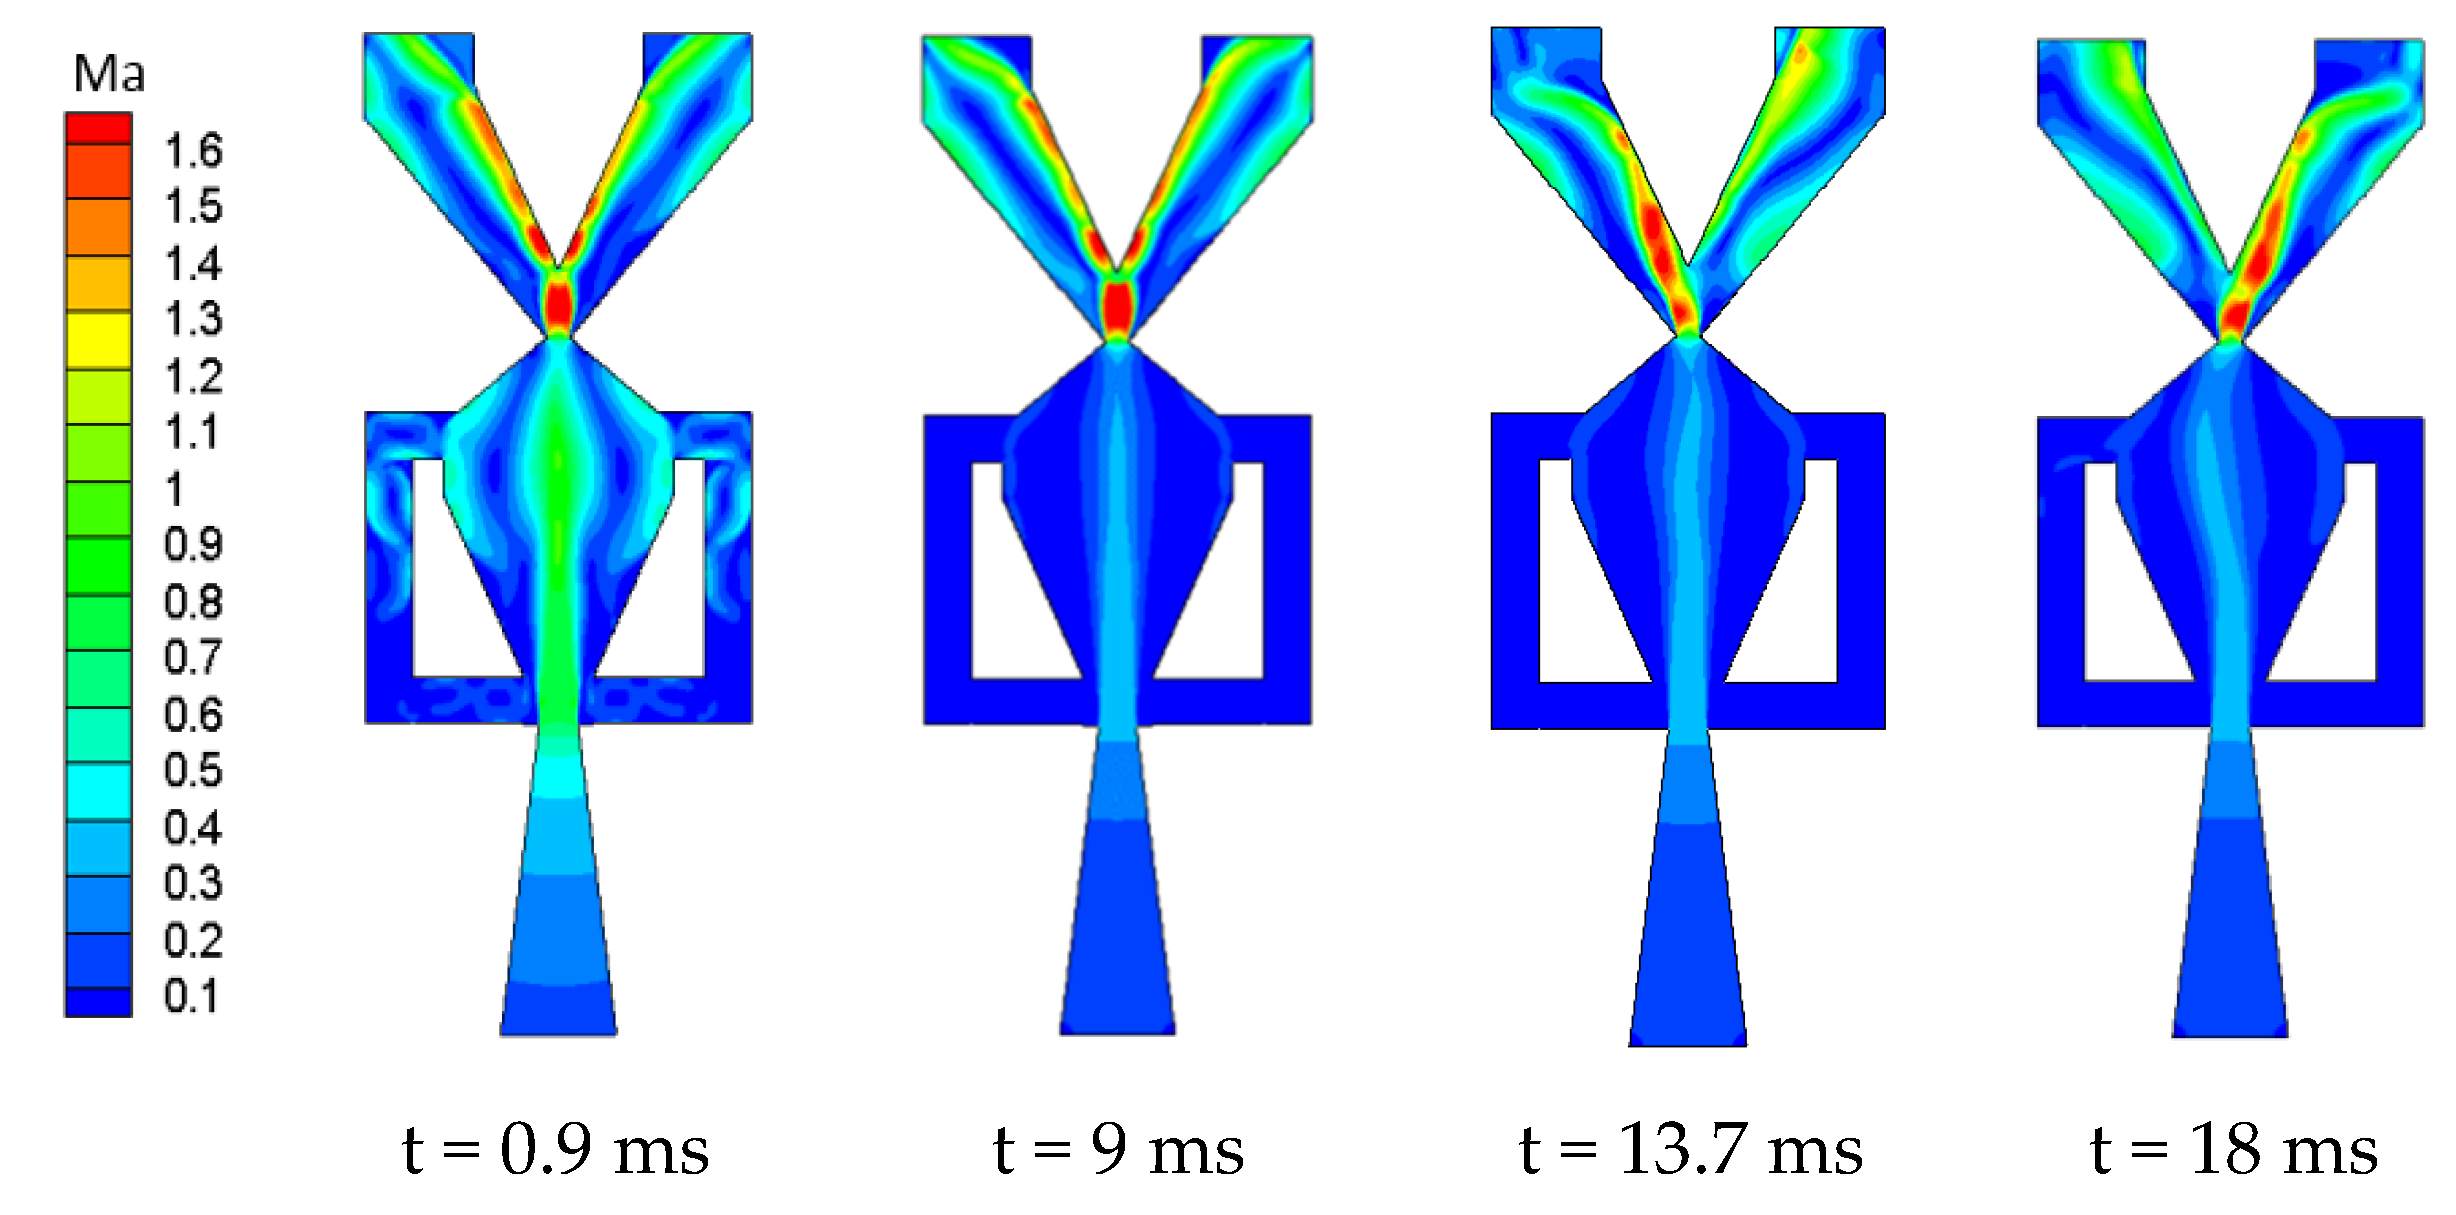
The delay time (t0) is a working parameter of the oscillator. It represents the period of time during which the working fluid flows into the oscillator until the fluid deflects in the mixing chamber. There is a throat in this oscillator. When W1 > W3, the throat was located at W3; the upstream flow of the throat is subsonic. Thus, the jet Mach number at the power nozzle exit is less than 1. The fluid in the mixing chamber is also subsonic. When W3 > W1, the throat was located at W1; the downstream flow of the throat is supersonic. The jet Mach number at the power nozzle exit is equal to 1. The fluid in the mixing chamber is also supersonic. Figure 5 shows the Mach number distribution of model M5, 3 at different times. At t = 0.9 ms, the main jet flows through the power nozzle into the mixing chamber. At this point, the whole flow field is centrosymmetric, and most of the fluid flows out from the throat. Under the action of the splitter, the main jet flows to the two outlets with an equal flow rate. A small portion of the fluid begins to flow into the feedback channel (which is not yet full). Because the narrowest area of the model is at the throat (width of 3 mm), the upstream jet of the throat is subsonic, and the maximum Mach number of the jet in the mixing chamber is 0.9. The jet downstream of the model accelerates to Mach 1.6. At t = 9 ms, the flow field is still centrosymmetric. The increase of pressure in the mixing chamber and the feedback channel causes the maximum value of the Mach number of the jet in the mixing chamber to decrease to 0.5. At t = 13.7 ms, the jet in the mixing chamber begins to oscillate. This means the delay time t0 for this case is 13.7 ms. At t = 18 ms, the jet in the mixing chamber deflects to the left wall, and most of the jet flows through the throat to the right outlet.
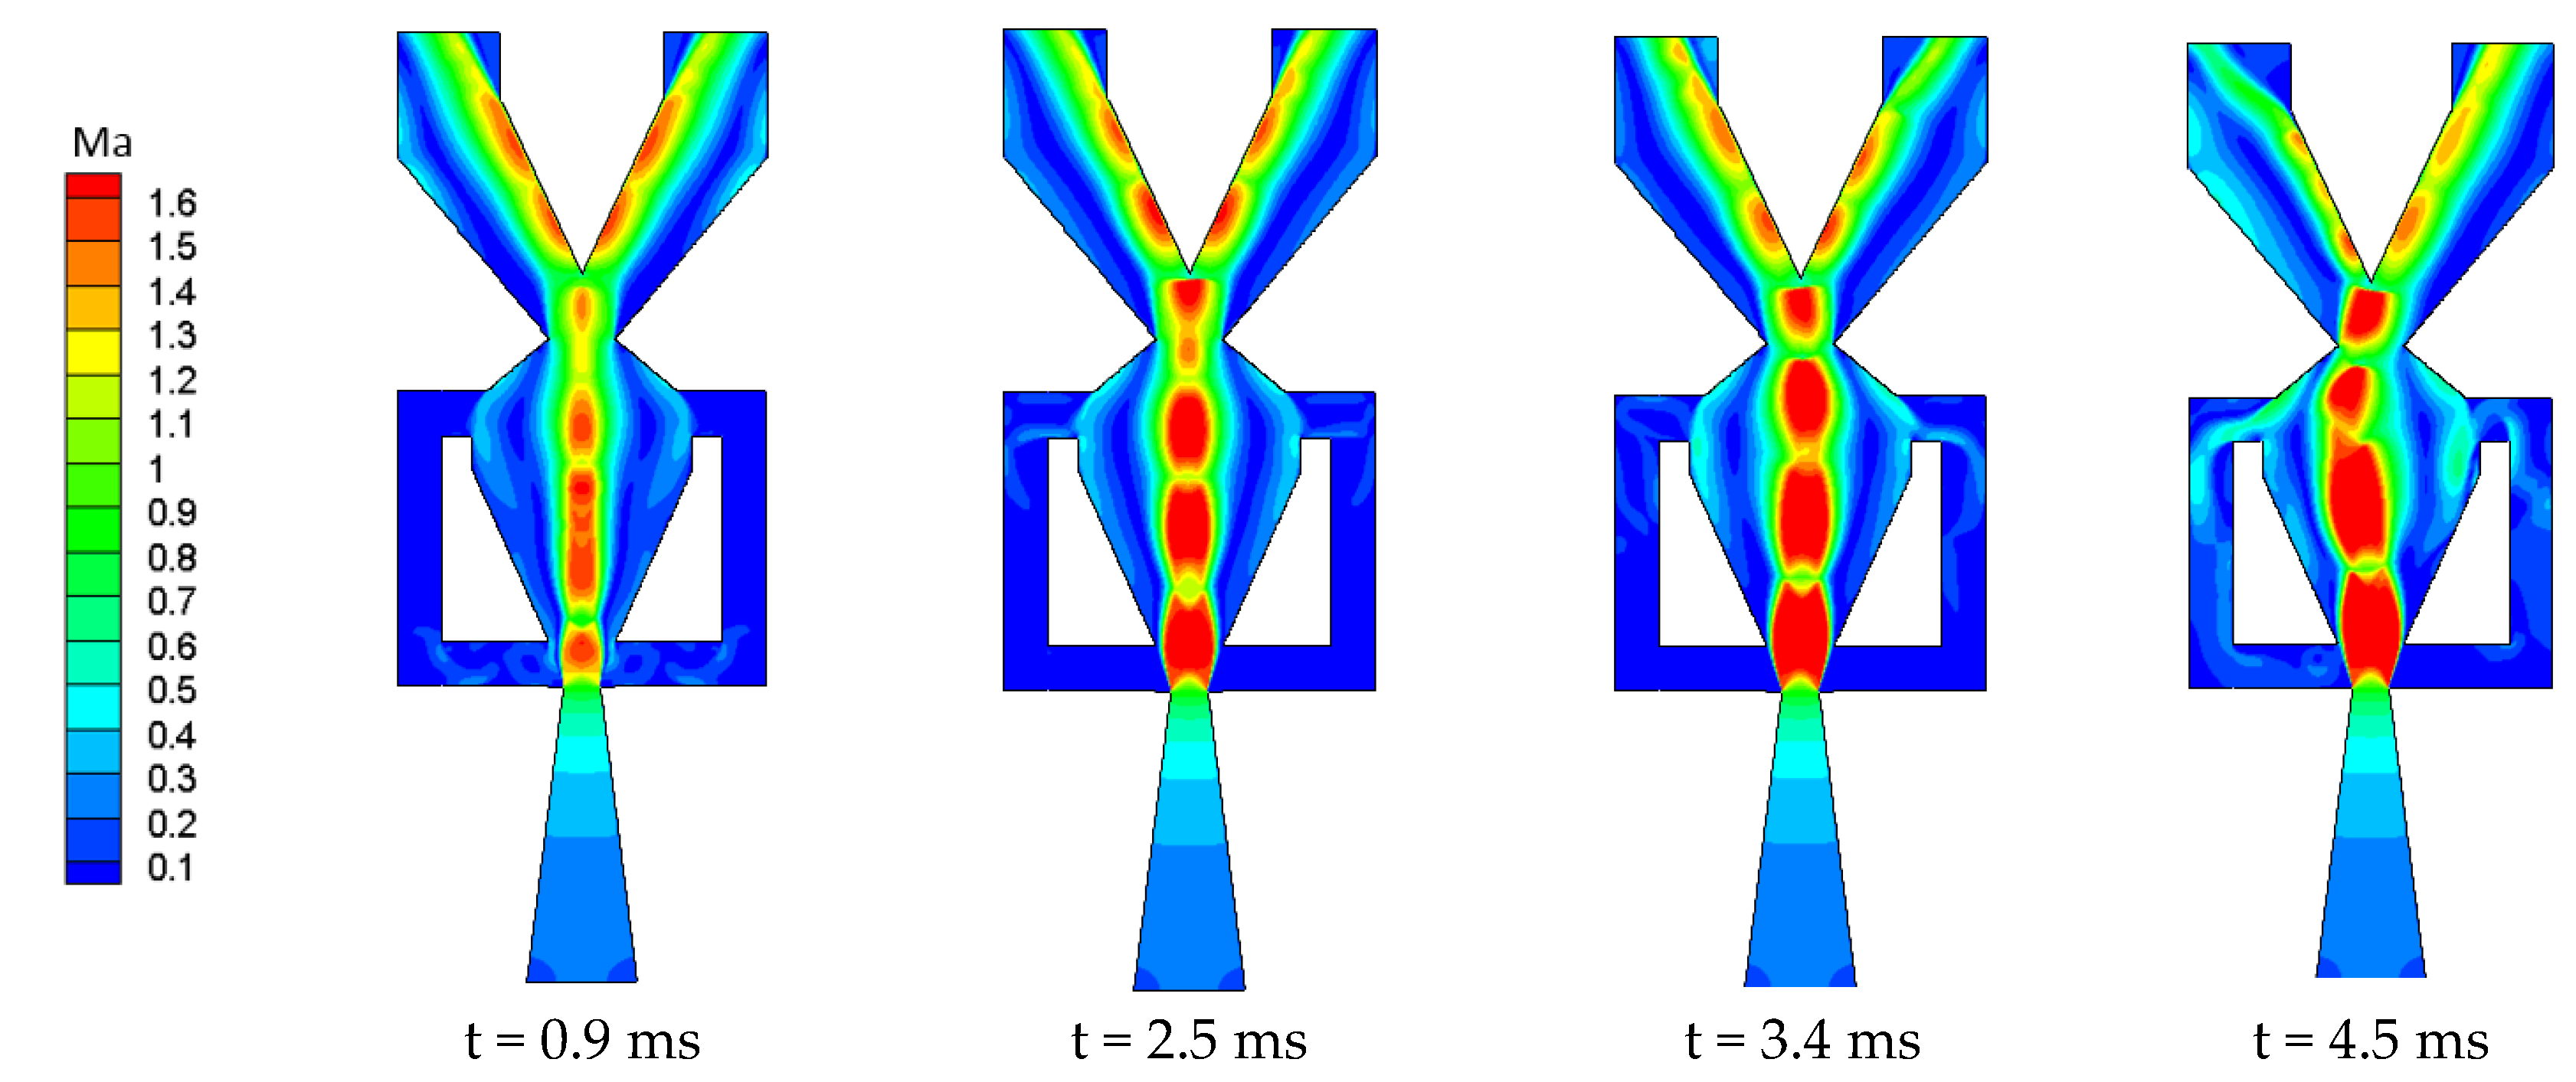
Figure 6 shows the Mach number distribution of model M5, 9 at different times. The W3 (9 mm) of the model is larger than the power nozzle exit width (5 mm) (in fact, W1 is the throat in this case). At t = 0.9 ms, the fluid expands rapidly after flowing through the nozzle with the smallest flow cross-section, and the maximum Mach number in the mixing chamber is 1.5. The whole flow field is centrosymmetric. At t = 2.5 ms, the jet undergoes many expansion and compression processes. The Mach number in the mixing chamber is greater than 1.6, the width of the jet after the expansion is basically the same as the width of the inlet of the mixing chamber, and the jet is closer to the side walls. The jet is more prone to attach to the side walls under small disturbances, which may lead to a decrease in the delay time. At t = 3.4 ms, the jet begins to deflect and the flow field becomes asymmetrical; this occurs 10.3 ms earlier than in model M5, 3. At t = 4.5 ms, the jet deflection amplitude increases and the flow enters the feedback channel.
When W1 = 6 and 7 mm, the development law describing the starting time of the oscillator is similar to that for W1 = 5 mm as W3 increases. By comparing the Mach number distributions of models M5, 3 and M5, 9, it can be seen that, when W3 < W1, the mixing chamber jet is in the subsonic state before the periodic oscillation, and the Mach number decreases with time. The width of the jet core also decreases. Supersonic jets are produced downstream of the throat. When W3 > W1, the jet in the mixing chamber is supersonic. The width of the main jet increases with any increase in W3, whereas the delay time t0 decreases as W3 increases.
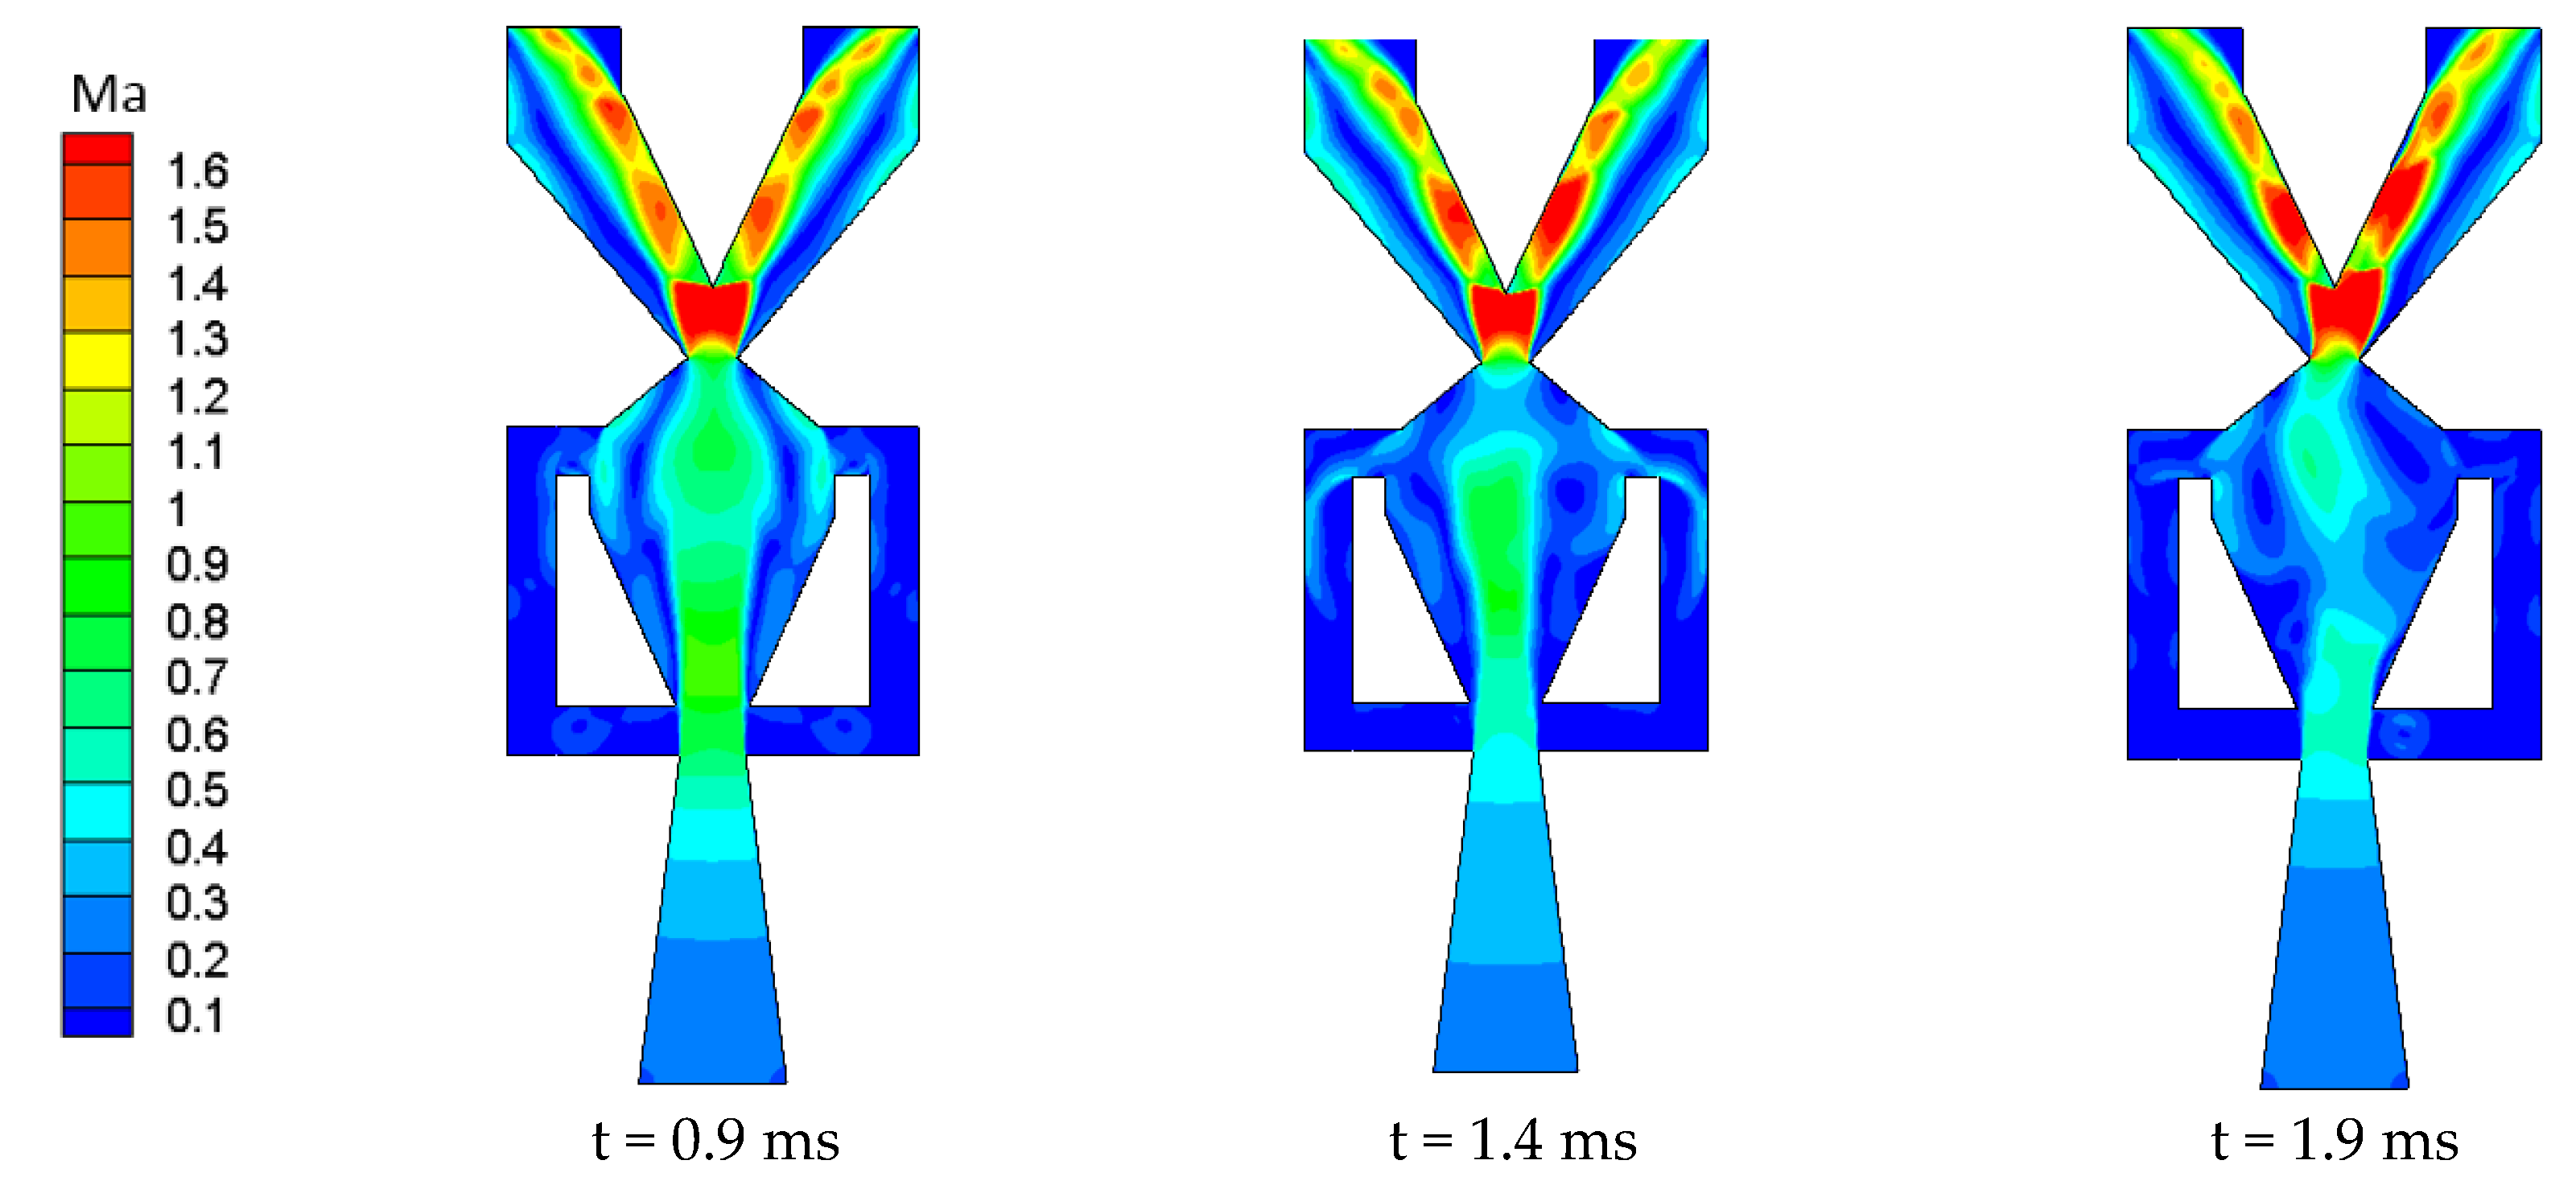
Figure 7 shows the Mach number distribution of model M8, 6 (i.e., when W1 is close to W2) at different times. At t = 0.9 ms, the center of the flow field is symmetrical, and the width of the main jet is close to W2. The main jet is very close to the side wall, meaning that the jet can easily become attached to the wall under a small disturbance. At t = 1.4 ms, the jet in the oscillator begins to deflect. At this point, the throat is the narrowest part of the oscillator, and the Mach number of the jet in the mixing chamber is less than 1. At t = 1.9 ms, the jet is attached to the right wall, the Mach number of the main jet in the mixing chamber has decreased, and the flow rate of the right outlet is beginning to increase.
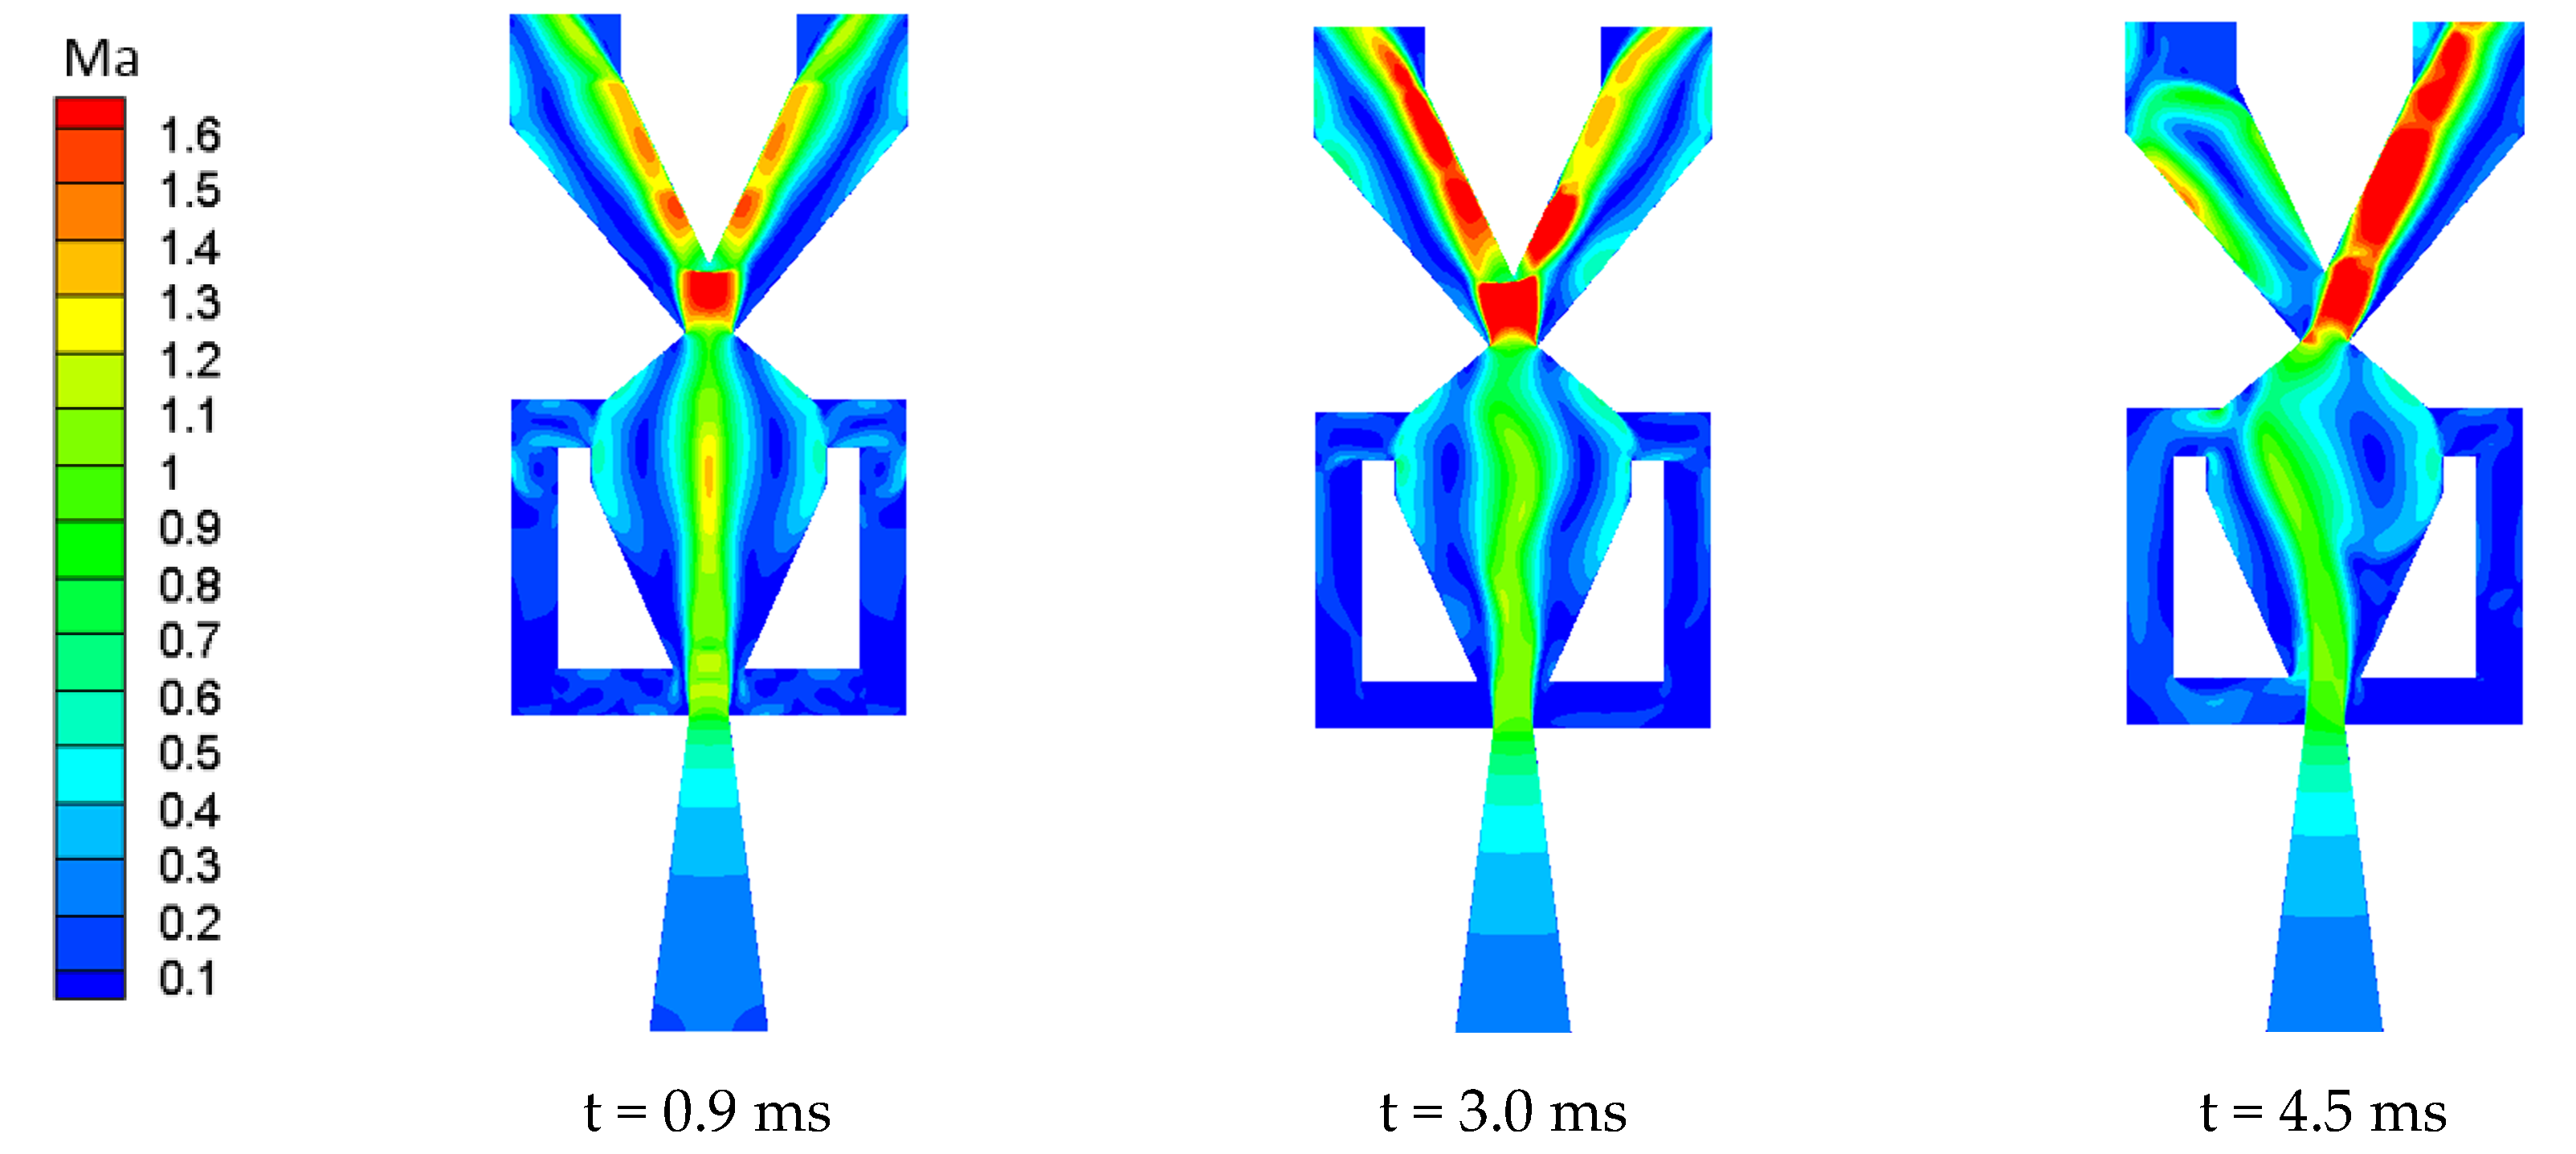
Figure 8 shows the Mach number distribution of model M5, 6 at different times. At t = 0.9 ms, the center of the flow field is symmetrical, and the width of the main jet is close to W2. The jet width is smaller than that in Figure 7, which makes it more difficult for the jet to attach to the mixing chamber wall. At t = 3.0 ms, the jet in the oscillator begins to deflect, which is delayed by 1.6 ms compared with model M8, 6. At t = 4.5 ms, the jet is attached to the left wall, evidently.
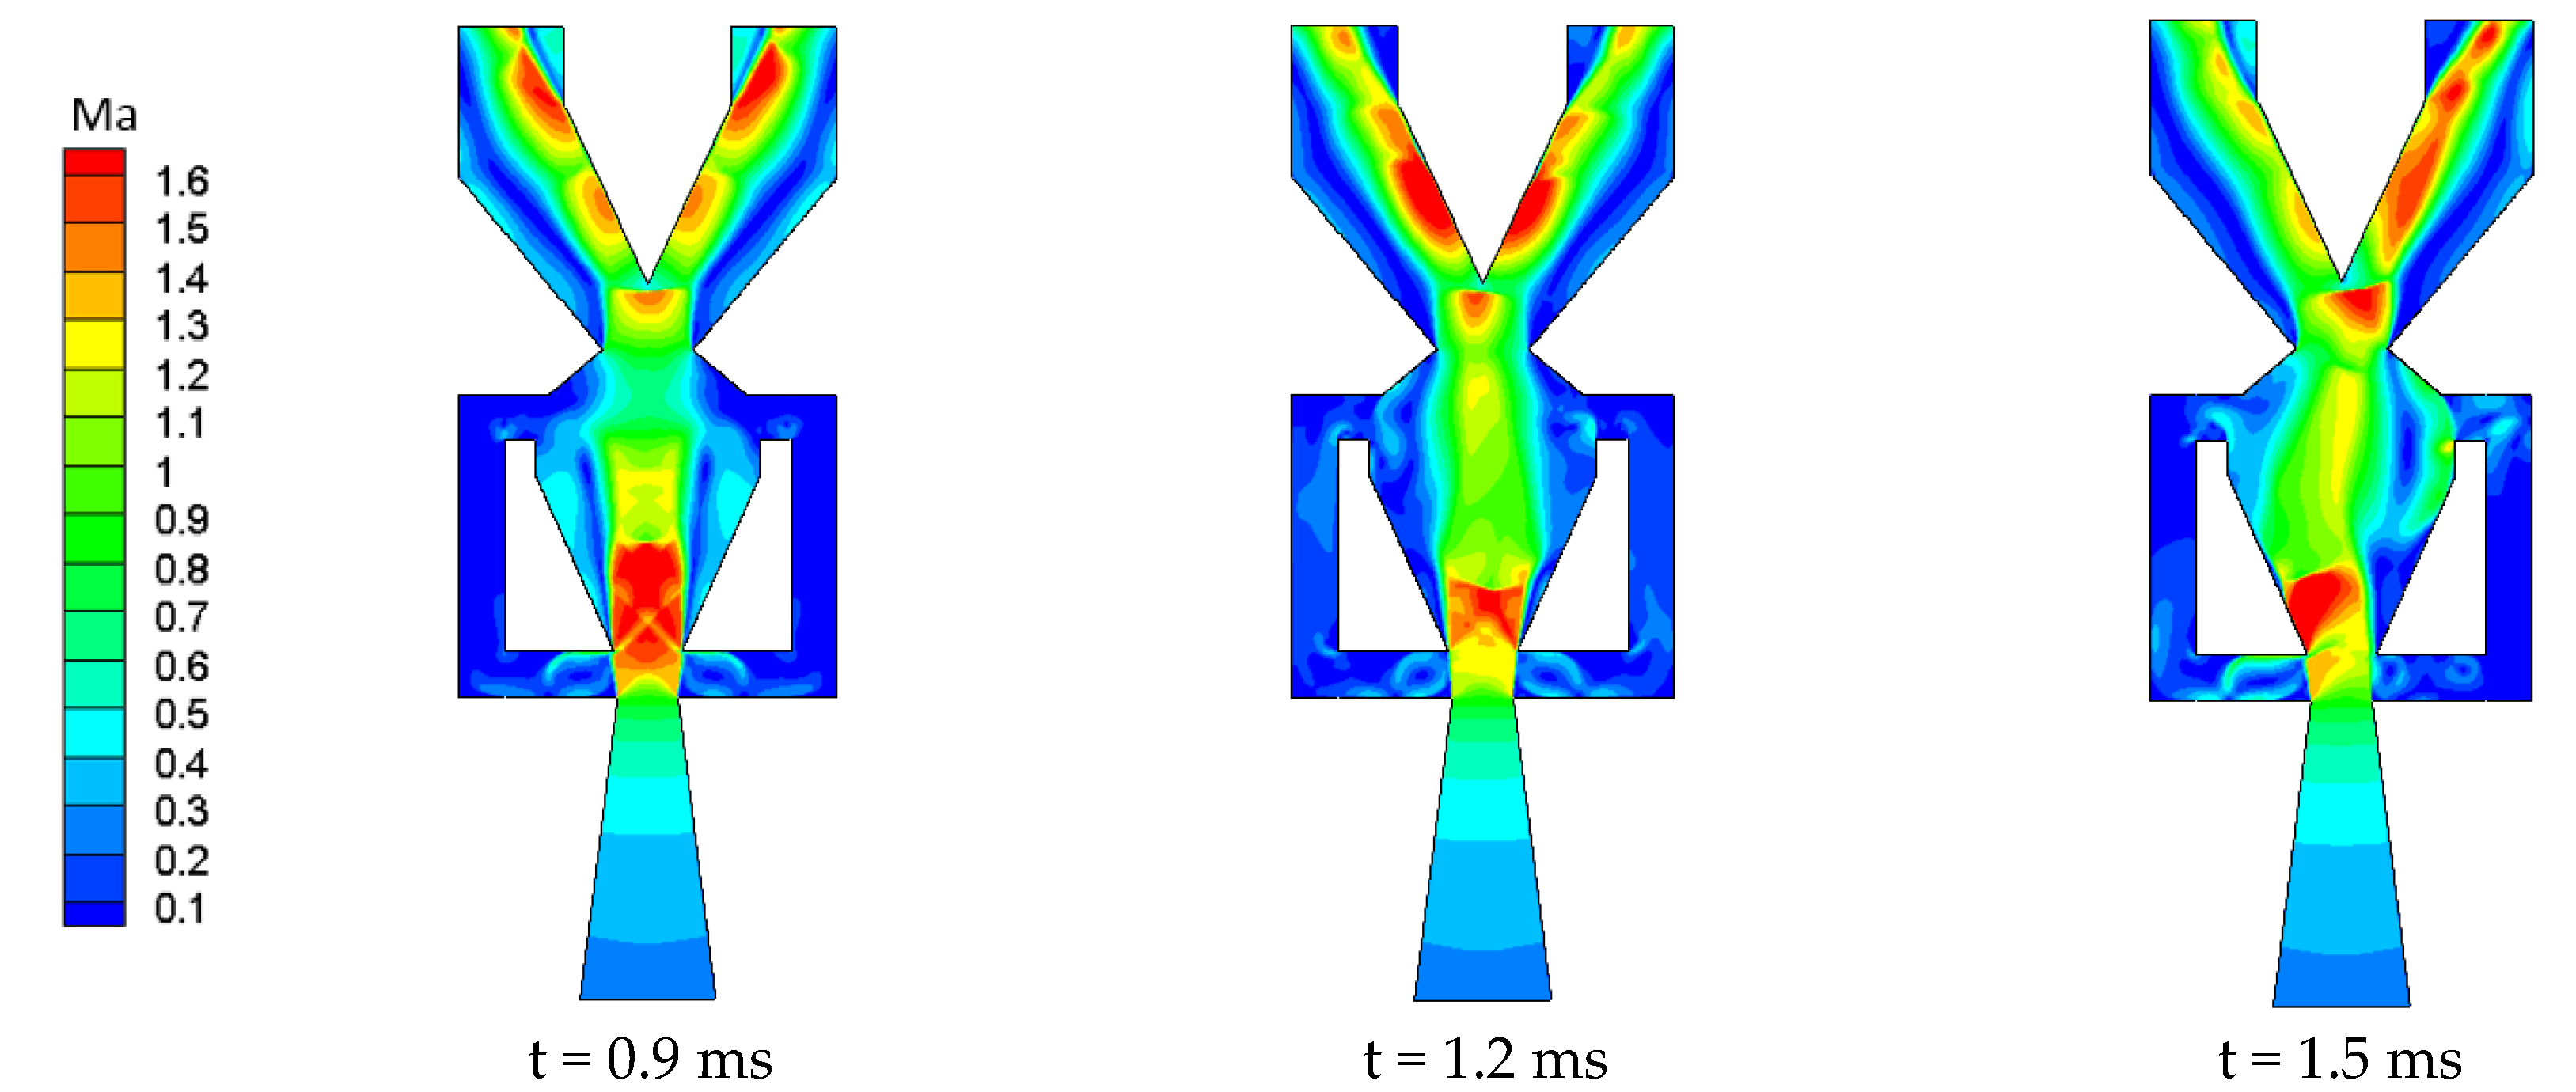
Figure 9 shows the Mach number distribution of model M8, 12 at different times. At t = 0.9 ms, alternating expansion and compression waves can be observed in the mixing cavity. Under the limitation of the inlet W2 of the mixing cavity, part of the jet moves toward the control port of the feedback channel. A deflection of the main jet is observed at t = 1.2 ms, at which point the jet width is still larger than that at the inlet of the mixing chamber W2. At t = 1.5 ms, the jet has obviously attached to the left wall of the mixing chamber. Figure 7 and Figure 9 illustrate the difference of flow characteristics while the fluid is subsonic and supersonic in the oscillating cavity, respectively.
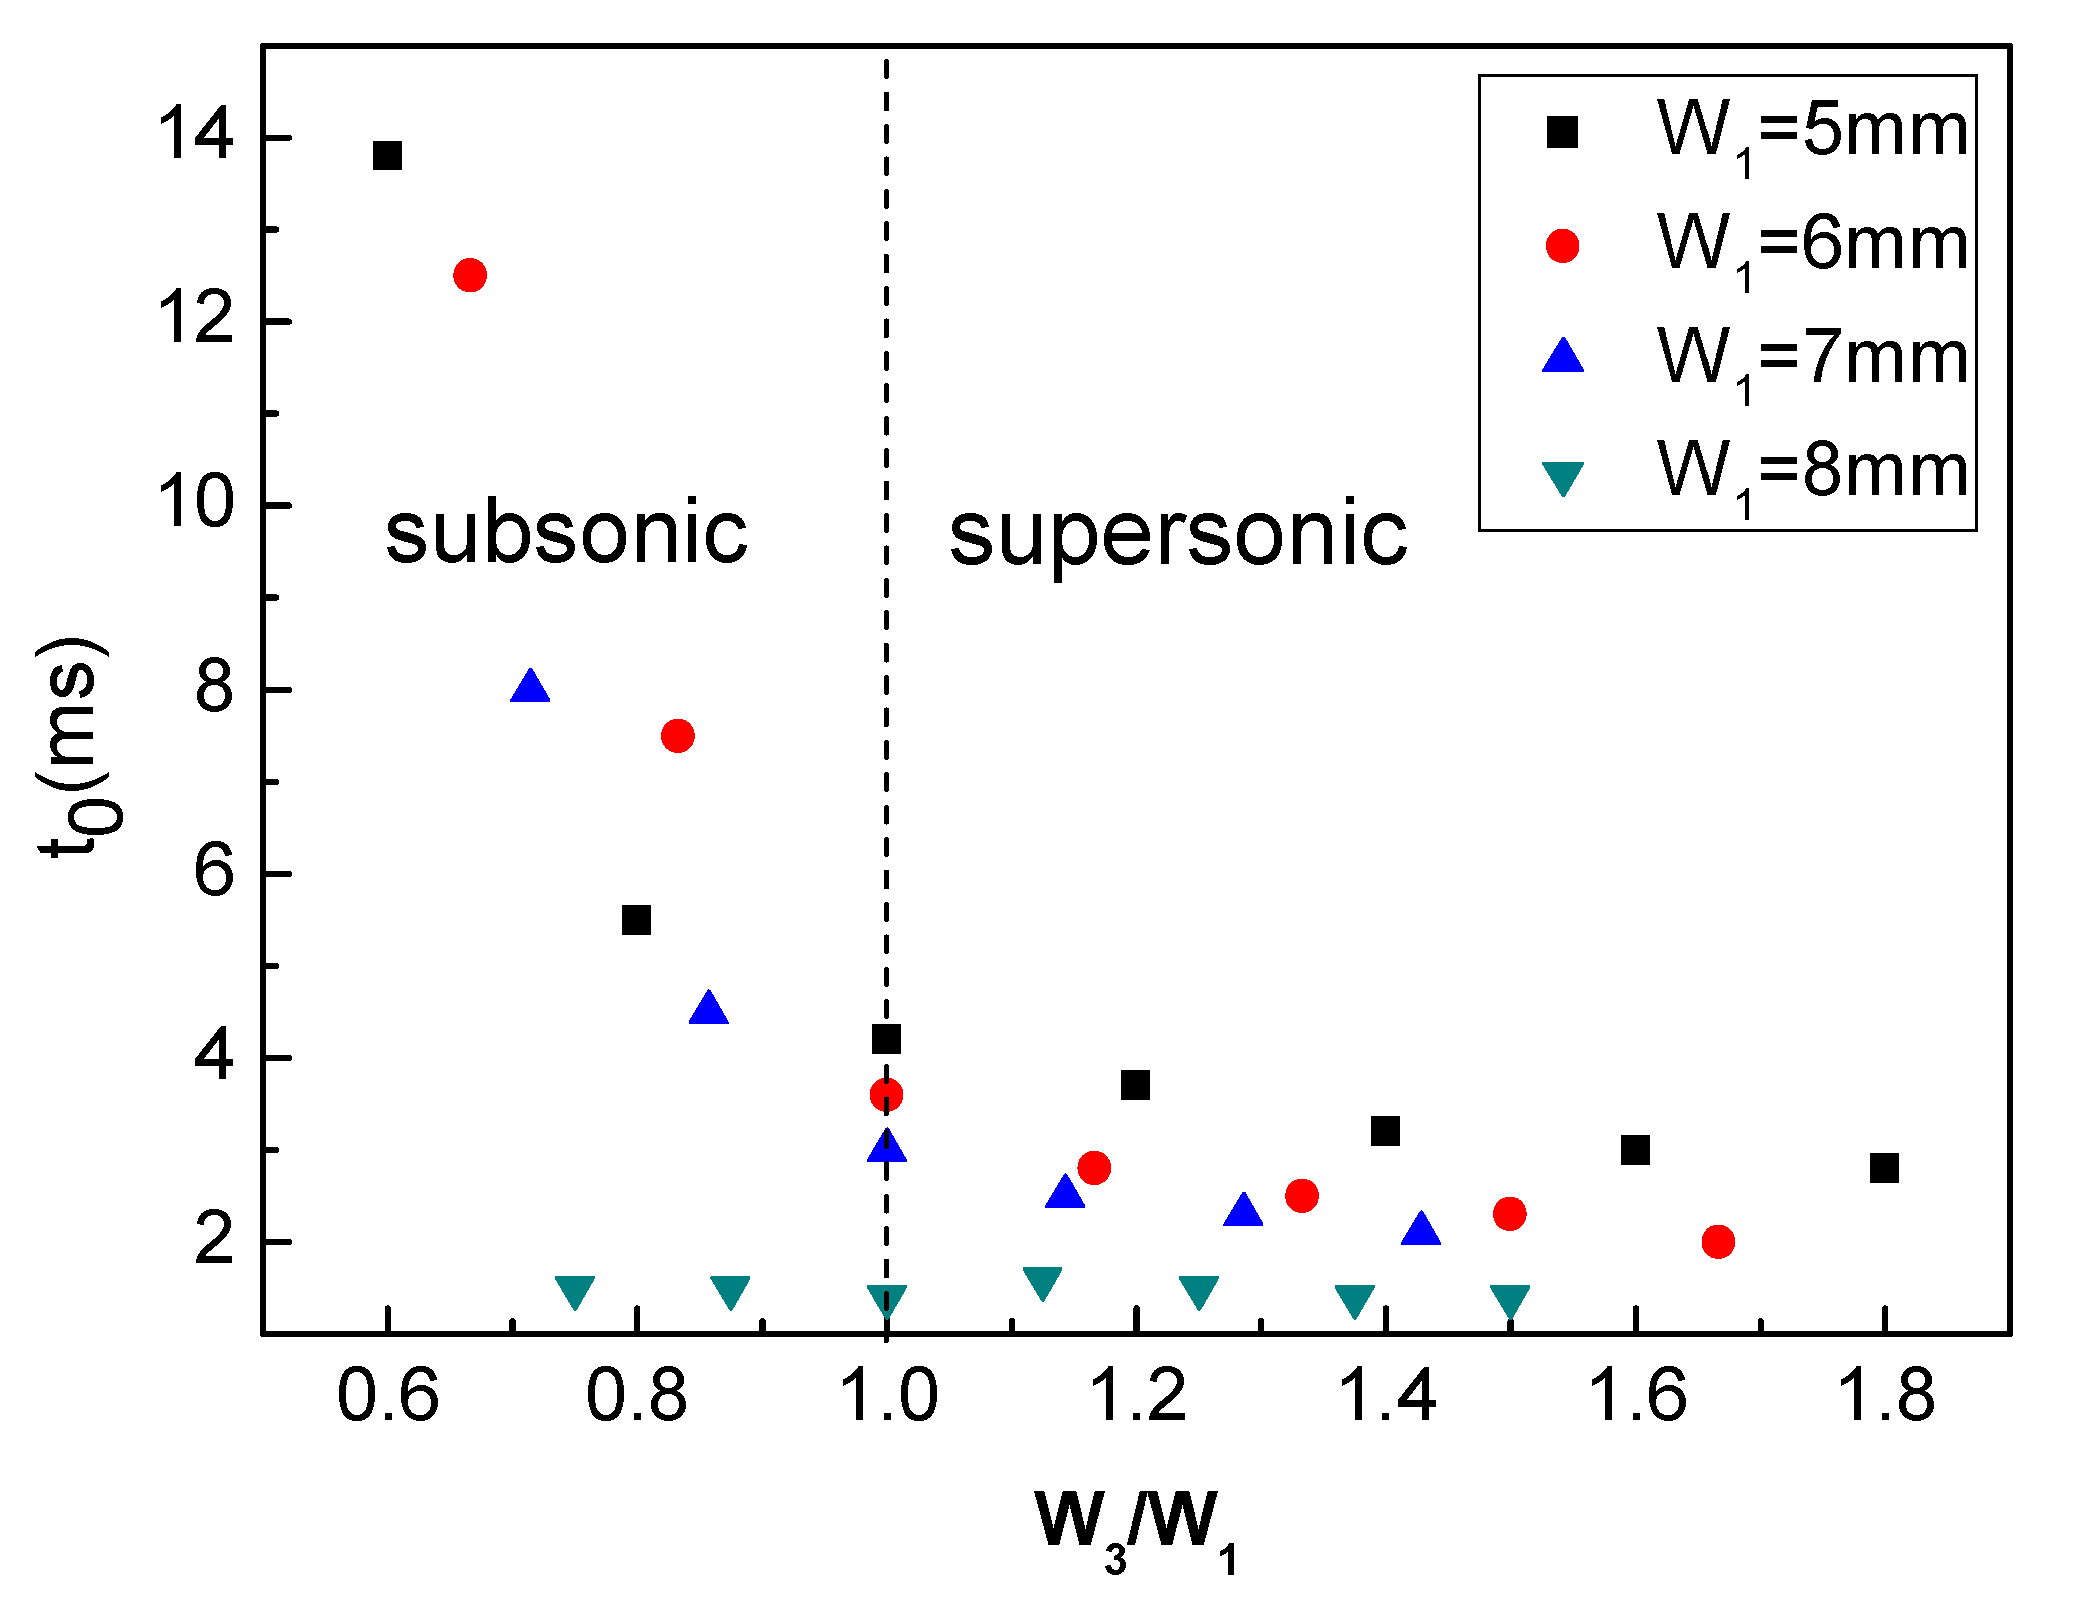
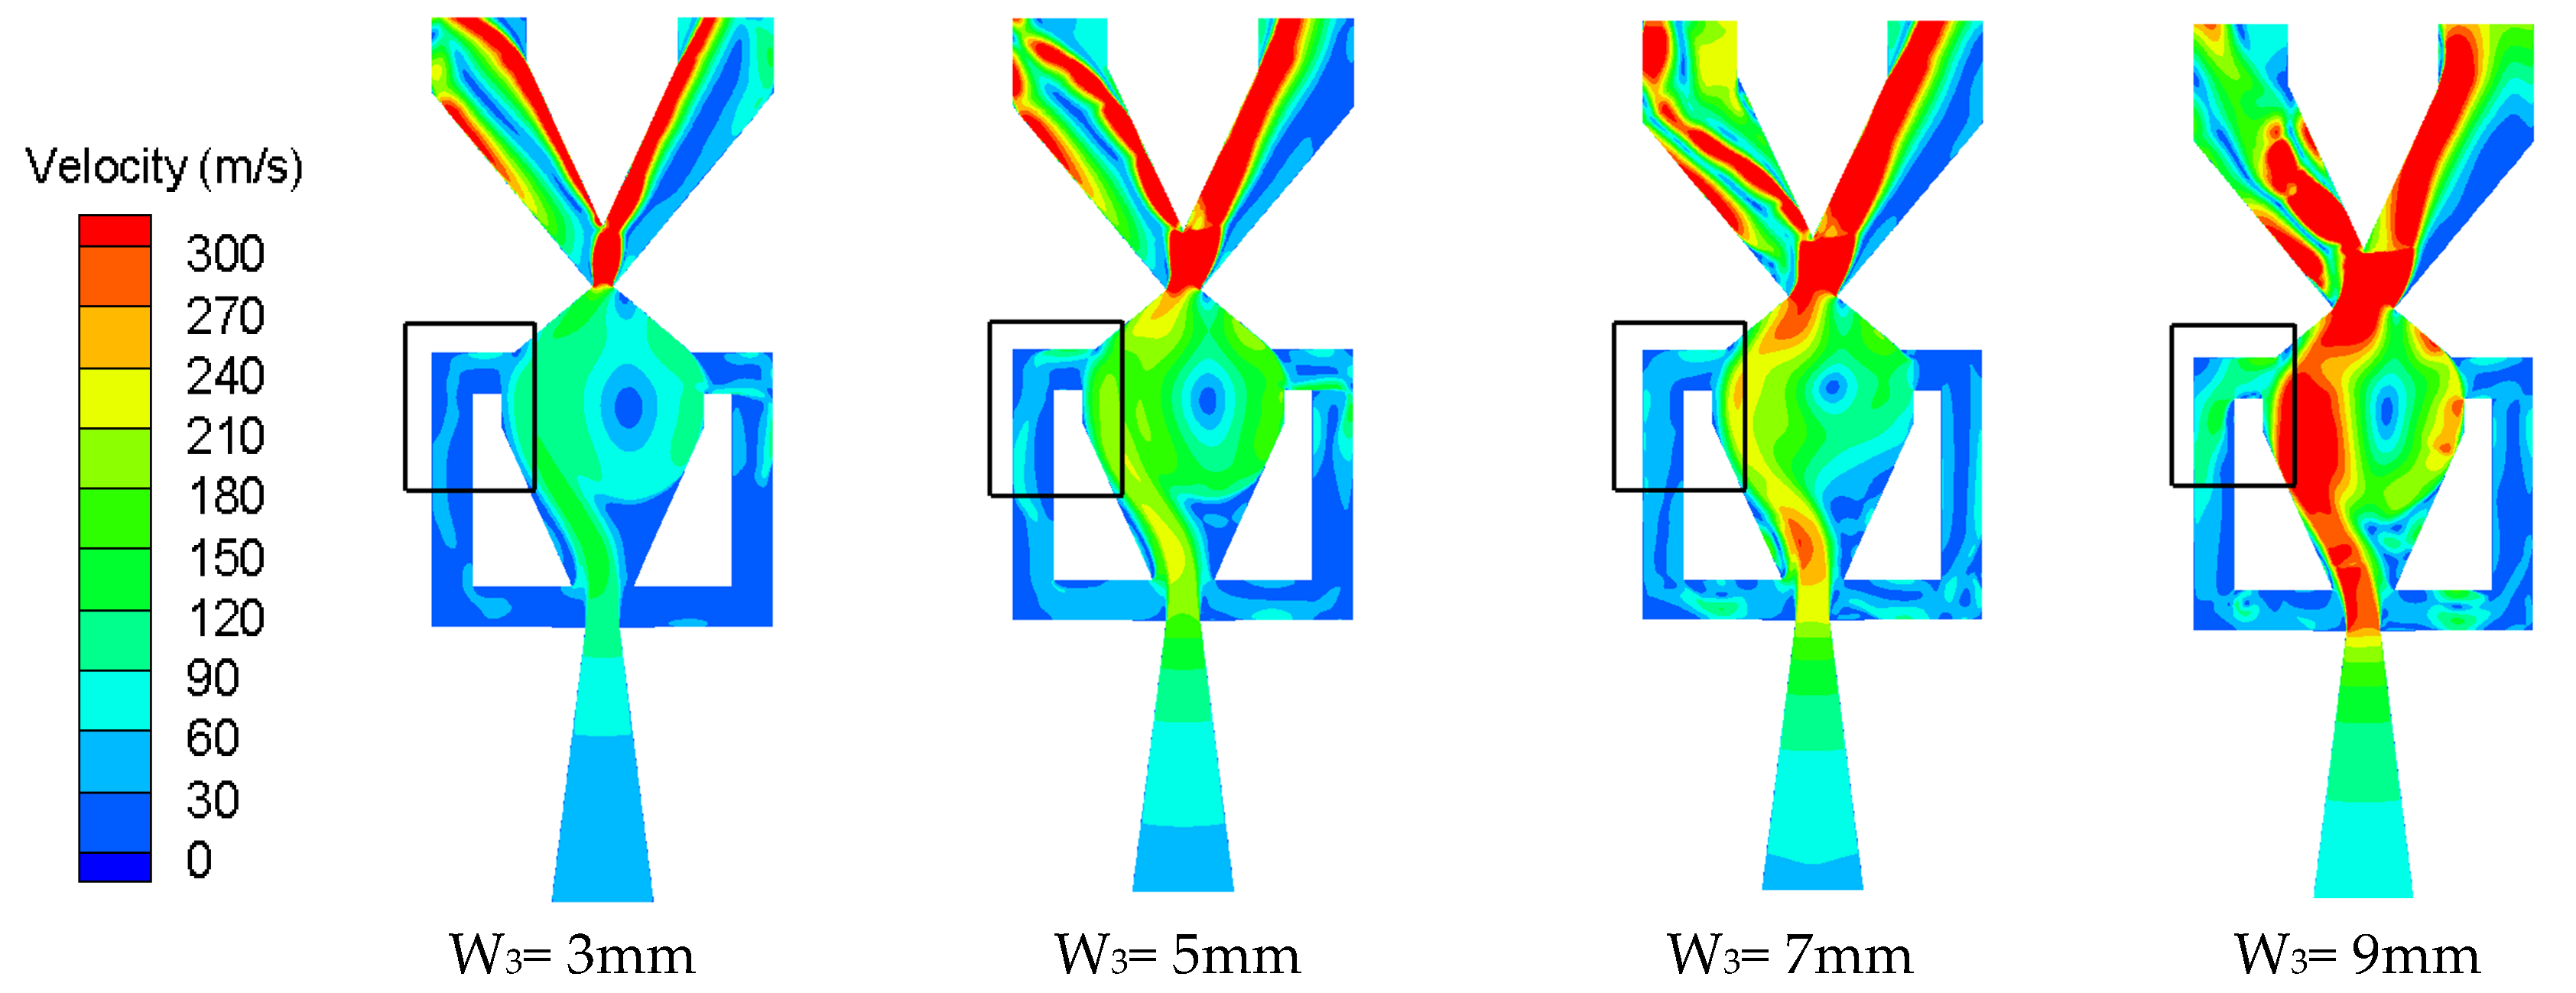
The oscillator delay time t0 is shown in Figure 10. When W3/W1 > 1, there was subsonic jet in the mixing chamber. When W3/W1 > 1, there is a supersonic jet in the mixing chamber. For oscillators with W1 = 5–7 mm, a change in W3 produces a similar variation in the delay time, that is, as W3 increases, t0 gradually decreases, with the rate of decrease initially being fast before slowing down. This phenomenon is due to the change of fluid in the mixing chamber from subsonic to supersonic. For the jet oscillator with W1 = 8 mm, increases in W3 have little effect on the delay time t0, which remains at approximately 1.4 ms. When W1 = 5 mm, with the increase of W3, the subsonic flow in the mixing chamber converts to supersonic flow because of the change of throat position. The value of W3 where the flow speed in the mixing chamber changes from subsonic to supersonic is 5 mm. Therefore, the feedback flow has faster velocity to form the steady oscillation, which can be observed in Figure 11.

3.2. Activation Mechanism of Oscillator

For all cases with fixed W1, W3 changed from 3 to 15. The numerical results show that the jet cannot oscillate after W3 increases above a certain value, which is regarded as the critical value. In this paper, the corresponding W3 at which the jet is no longer oscillating is called the critical throat width, Wcr. Table 1 presents the Wcr values corresponding to different W1.
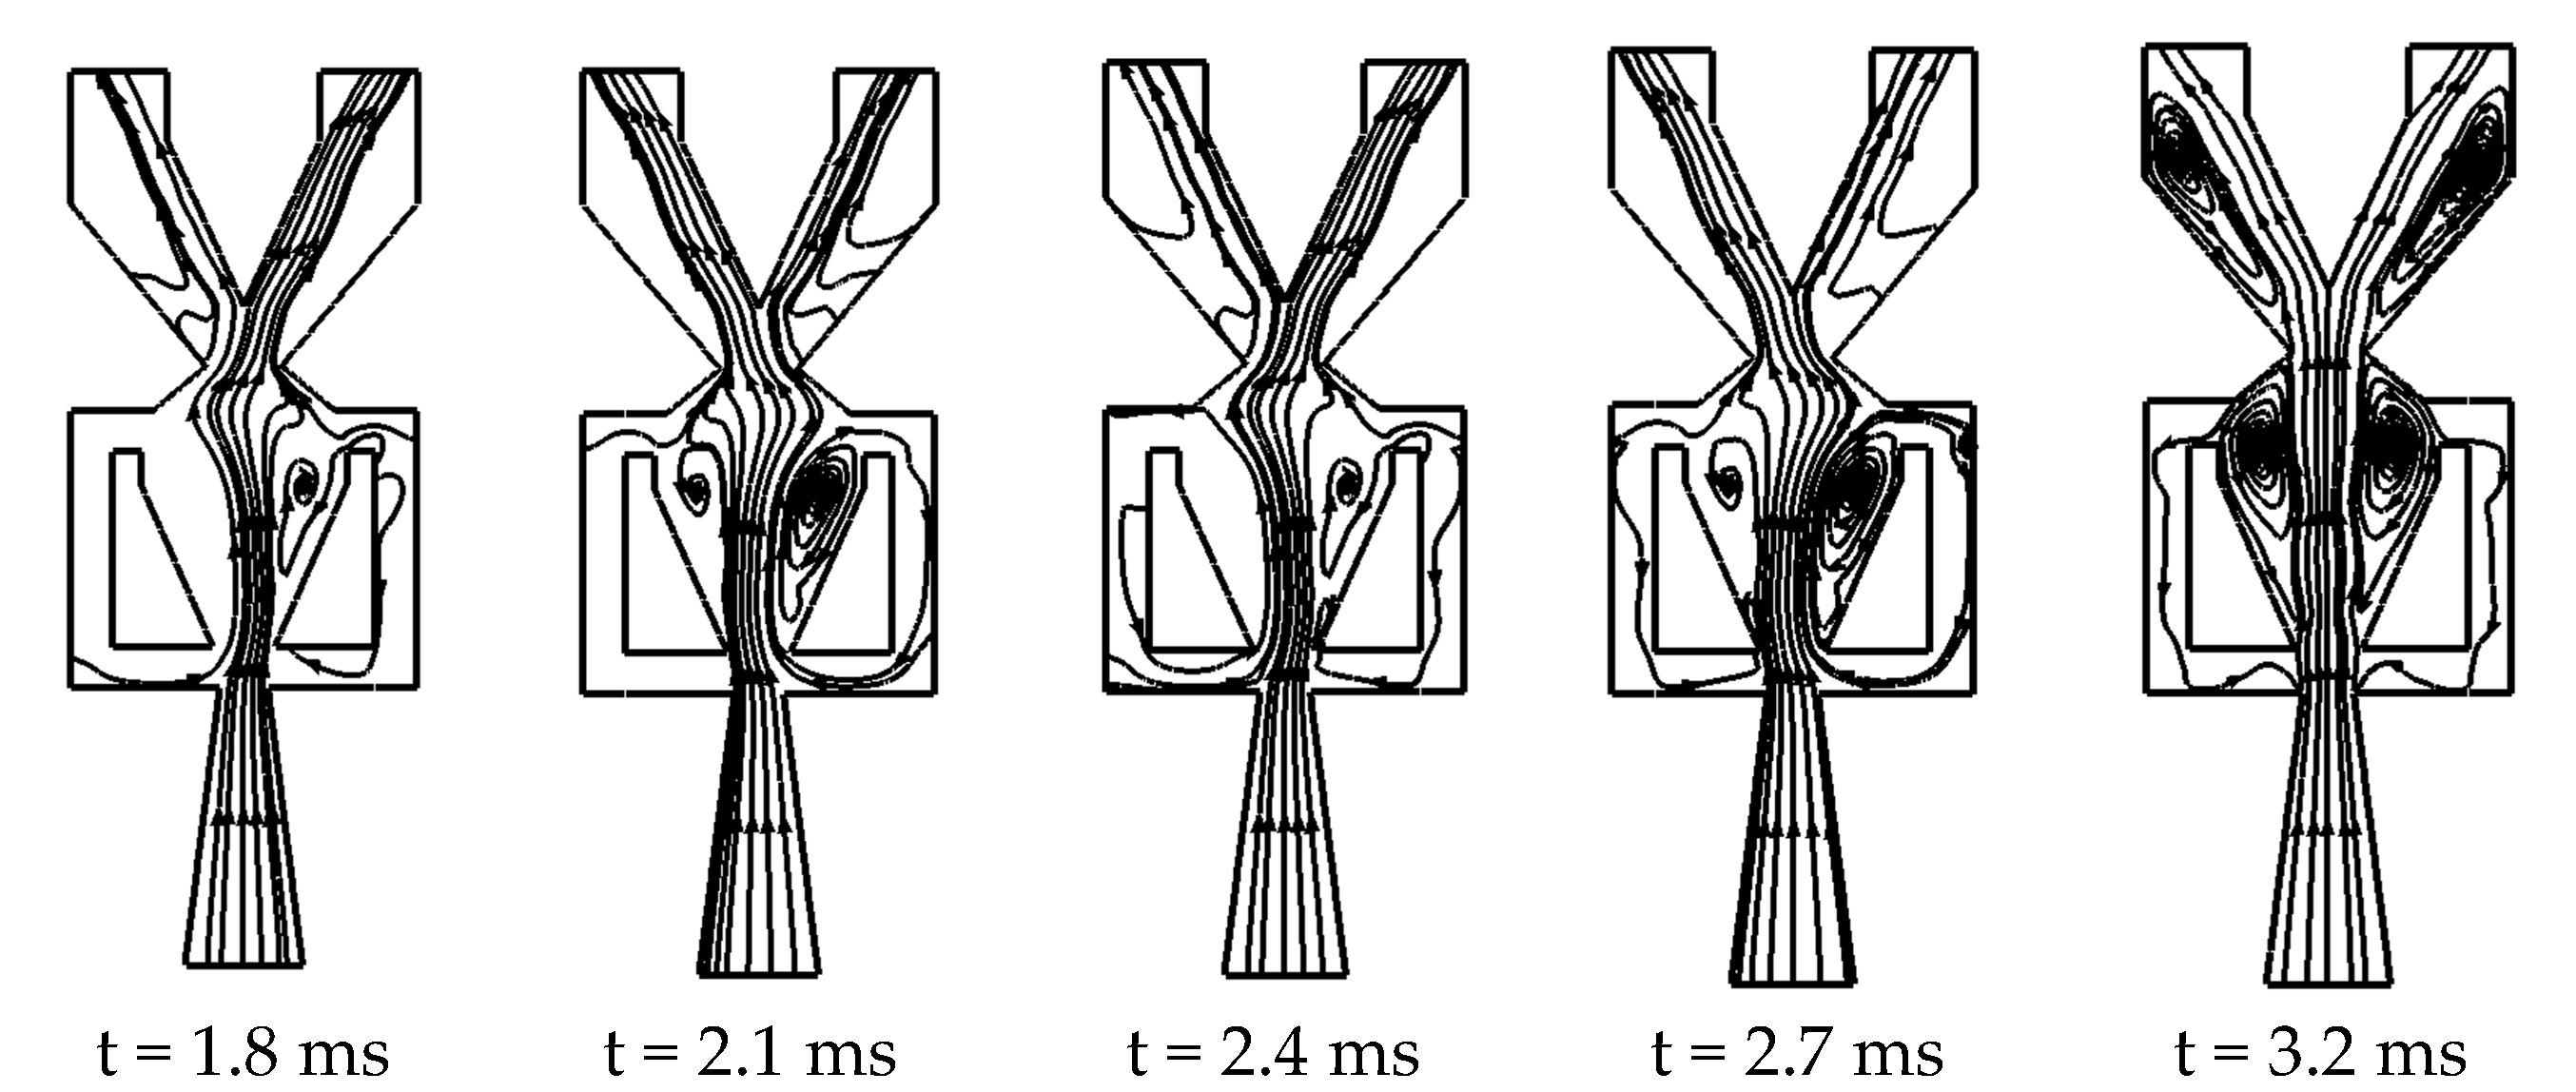
Figure 12 shows the streamline distribution of model M7, 10 from the beginning of the jet to the time of the steady oscillation. At t = 2.1 ms, the main jet is centered in the mixing chamber. The two same recirculation bubbles arise. At t = 2.9 ms, the jet in the mixing chamber is obviously deflected to the right. At t = 3.2 ms, part of the fluid is flowing into the right feedback channel. At t = 3.4 ms, the jet in the mixing chamber is completely attached to the left wall, and a large recirculation bubble is produced between the jet and the right wall. The jet is “squeezed” onto the left wall, which is beneficial to the formation of the periodic oscillating jet. At t = 4.9 ms, the main jet has become fully attached to the left wall.
Figure 13 shows the streamline distribution of model M7, 11 at different times. At t = 1.8 ms, the jet in the mixing chamber deflects to the left under the action of small disturbances. Compared with model M7, 10, the increase in throat width W3 intensifies the expansion of the jet in the mixing chamber, and the jet flow rate increases after expansion. More feedback flow is required to change the deflection direction, thus this increase in expansion is disadvantageous to the oscillation of the jet. At the same time, the rapid expansion causes the jet width to become greater than W2, and a small part of the jet flows into the control ports on both sides. For the convenience of description, this small part of the fluid is called the “countercurrent”; this hinders the feedback flow acting on the main jet. At t = 2.1 ms, the jet in the mixing chamber slightly deflects to the right, the deflection angle increases slightly, and an increased countercurrent flows into the right control port. As W3 increases, the jet flows out from the throat more easily. This means there is less fluid flowing into the feedback channel. Between t = 2.4 ms and t = 2.7 ms, the jet in the mixing chamber is deflected several times, and the angle of deflection gradually decreases. At t = 3.2 ms, the jet in the mixing chamber stops oscillating. Figure 12 illustrate the oscillating process from the beginning of the jet deflection to the formation of steady oscillation. Figure 13 show the reason the oscillator (M7, 11) cannot work.

3.3. Effect of Power Nozzle Exit Width and Throat Width on the Oscillation Period

Sweeping time (tc) is the fluid switching time from the one side wall of the mixing chamber to the other side wall. When the jet is completely attached to one side wall, it will stay on the wall for a short time until there is enough energy at the outlet of the feedback channel to deflect it to the other side. The stay time is the wave propagation time in the feedback channel (tc). The oscillation frequency f can be expressed as:
f = ( 2 t s + 2 t c ) 1
The propagation velocity of the expansion and compression waves is equal to the speed of sound, thus tc is determined by the length of the feedback channel and the local sound velocity. If all the inlet gas parameters are fixed, the sound velocity and the feedback length of the different oscillators will be equal, thus the propagation time tc will remain unchanged. Hence, the oscillation period is determined by the sweeping time ts.
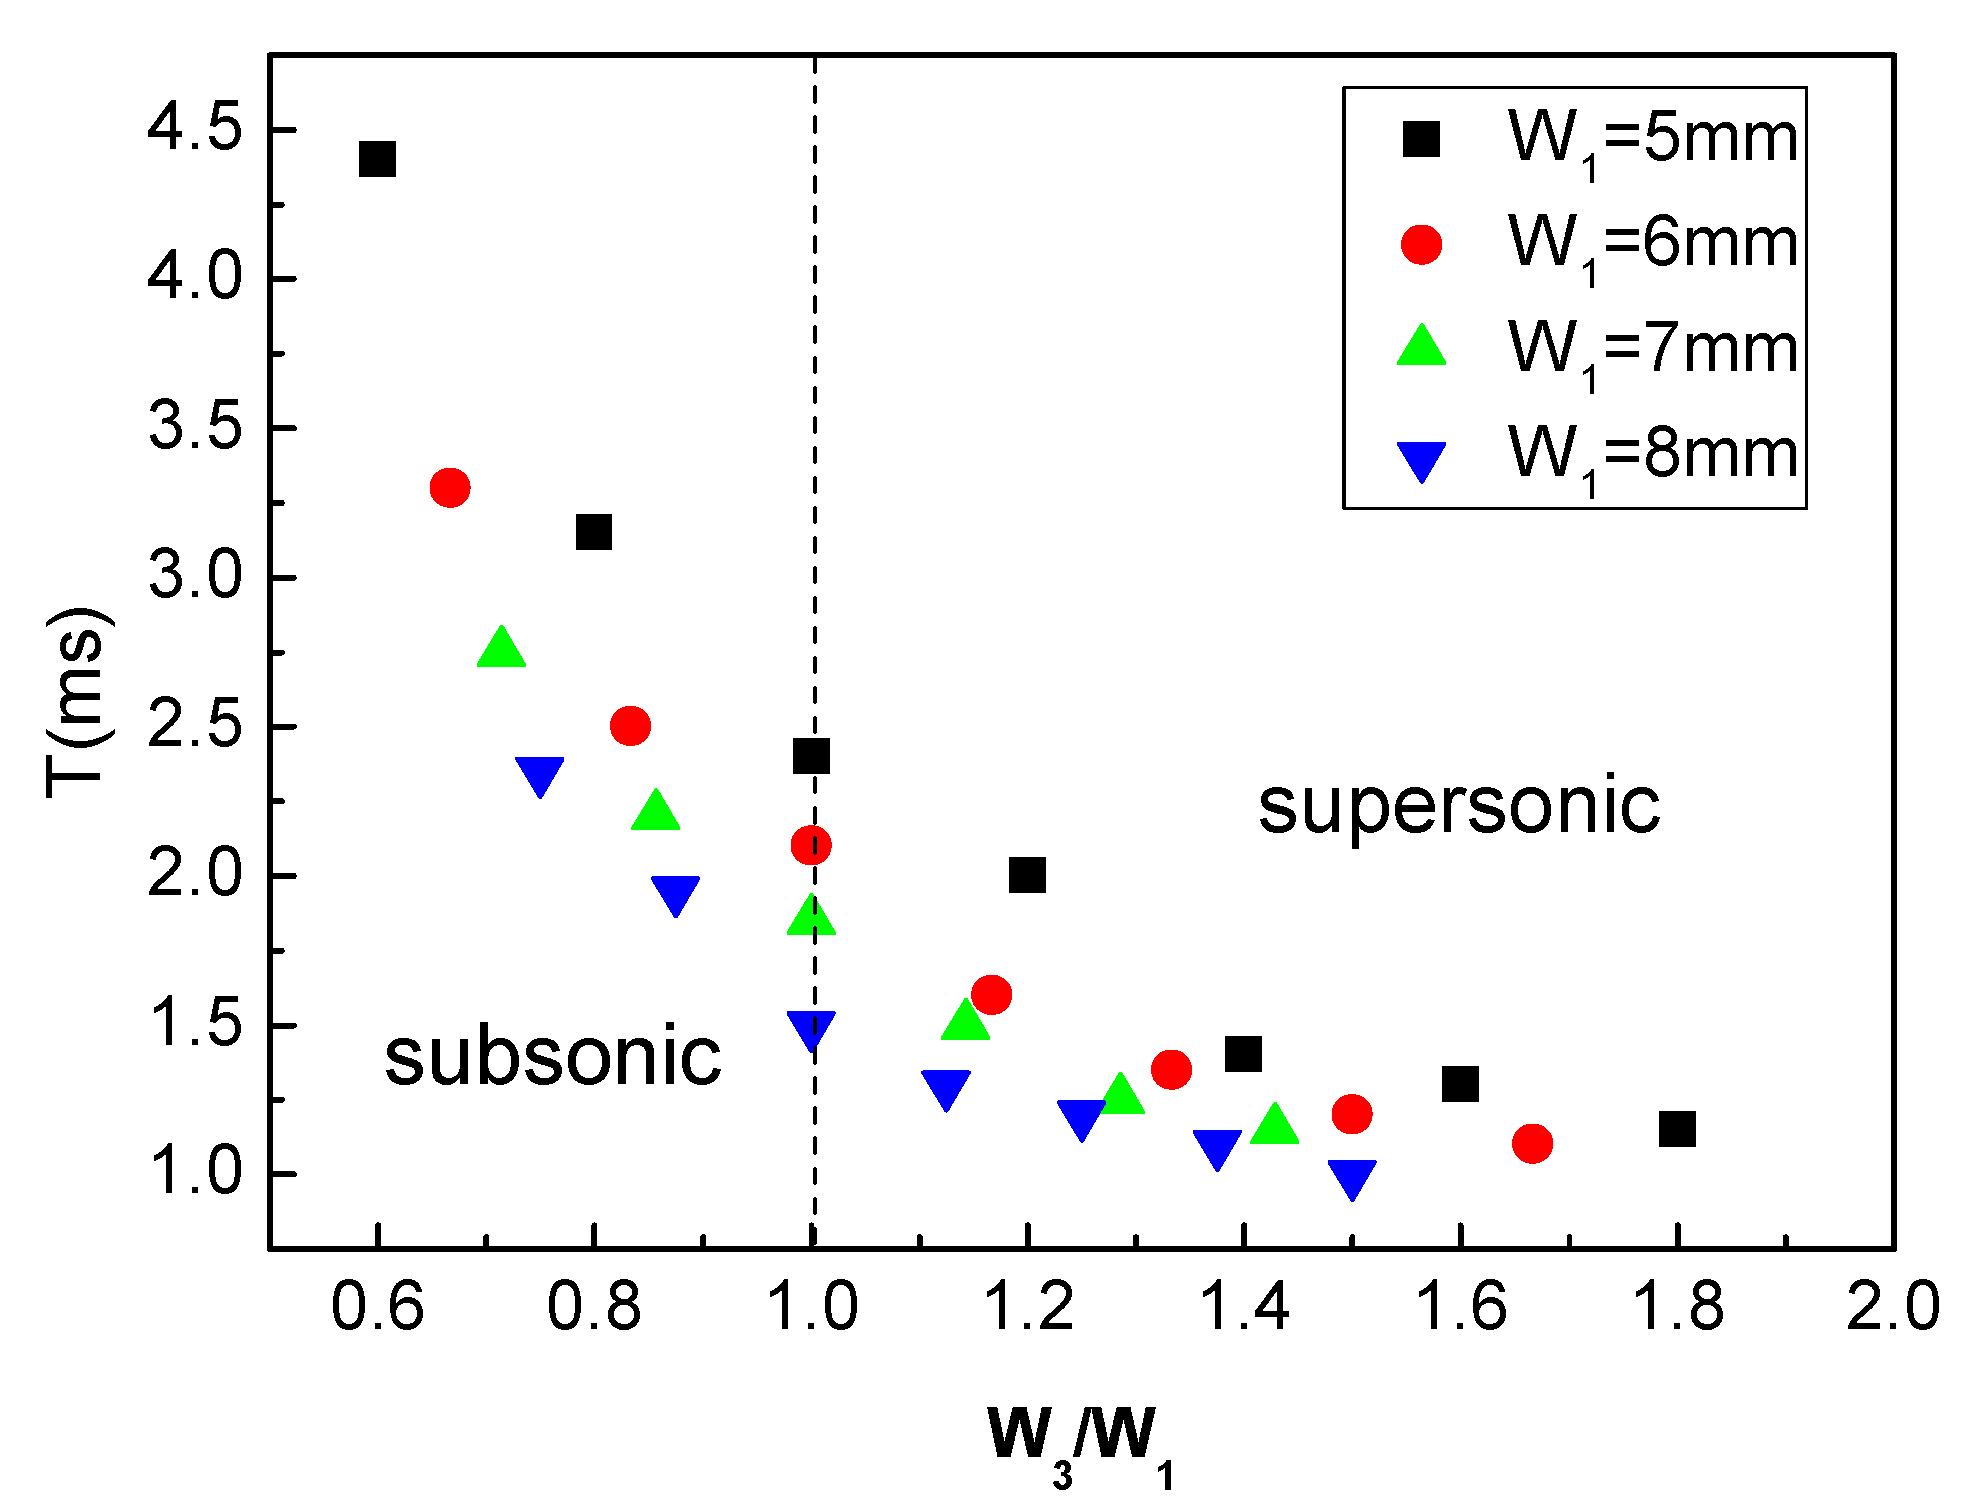
Figure 14 shows the oscillation periods of different oscillator models that produce stable oscillations. The oscillation period gradually decreases as the throat width W3 increases, but the rate of decrease is becoming smaller. This phenomenon is due to the change of fluid in the mixing chamber from subsonic to supersonic. In addition, for a constant W3, the oscillation period decreases as W1 becomes smaller. Bigger width of the main jet not only decrease the delay time, but also increase the oscillation frequency. Because the main jet is more prone to attach to both side walls, the sweeping time is reduced.
Comparing Figure 10 and Figure 14, while t0 becomes insensitive to W1 as W1 increases to greater than 8 mm, T is sensitive to W1. The delay time (t0) represents the period of time during which the working fluid flows into the oscillator until the fluid is attached to either side wall in the mixing chamber. The wider jet is more easily attached to the wall. Thus, the delay time is related to the jet width. When W3 is fixed, with the increase of W1, the jet width increases and the jet is more easily attached to the wall, thus the delay time is shorter. When W1 increases to greater than 8 mm, the jet width is very close to the inlet width of the mixing chamber W2, which makes the jet easy to attach to the wall under only small disturbance. Therefore, t0 becomes insensitive to W1 as W1 increases to greater than 8 mm. When the fluid forms a steady oscillation, the oscillation period T is mainly determined by the jet velocity. When W3 is fixed, the jet velocity decreases as W1 increases. Thus, T is sensitive to W1. The jet velocity increased quickly then slowly as W3/W1 increases. For example, for models M5,3, M5,5, M5,7, and M5,9, the average velocities at W1 are 100, 180, 246, and 262 m/s respectively. When W3 increased from 3 to 5 mm, the velocity has increased 80 m/s. However, when W3 increased from 7 to 9 mm, the velocity has increased only 16 m/s. When the W1 is fixed, t0 and T are mainly determined by the jet velocity. Thus, t0 and T decline quickly at first and then slowly.
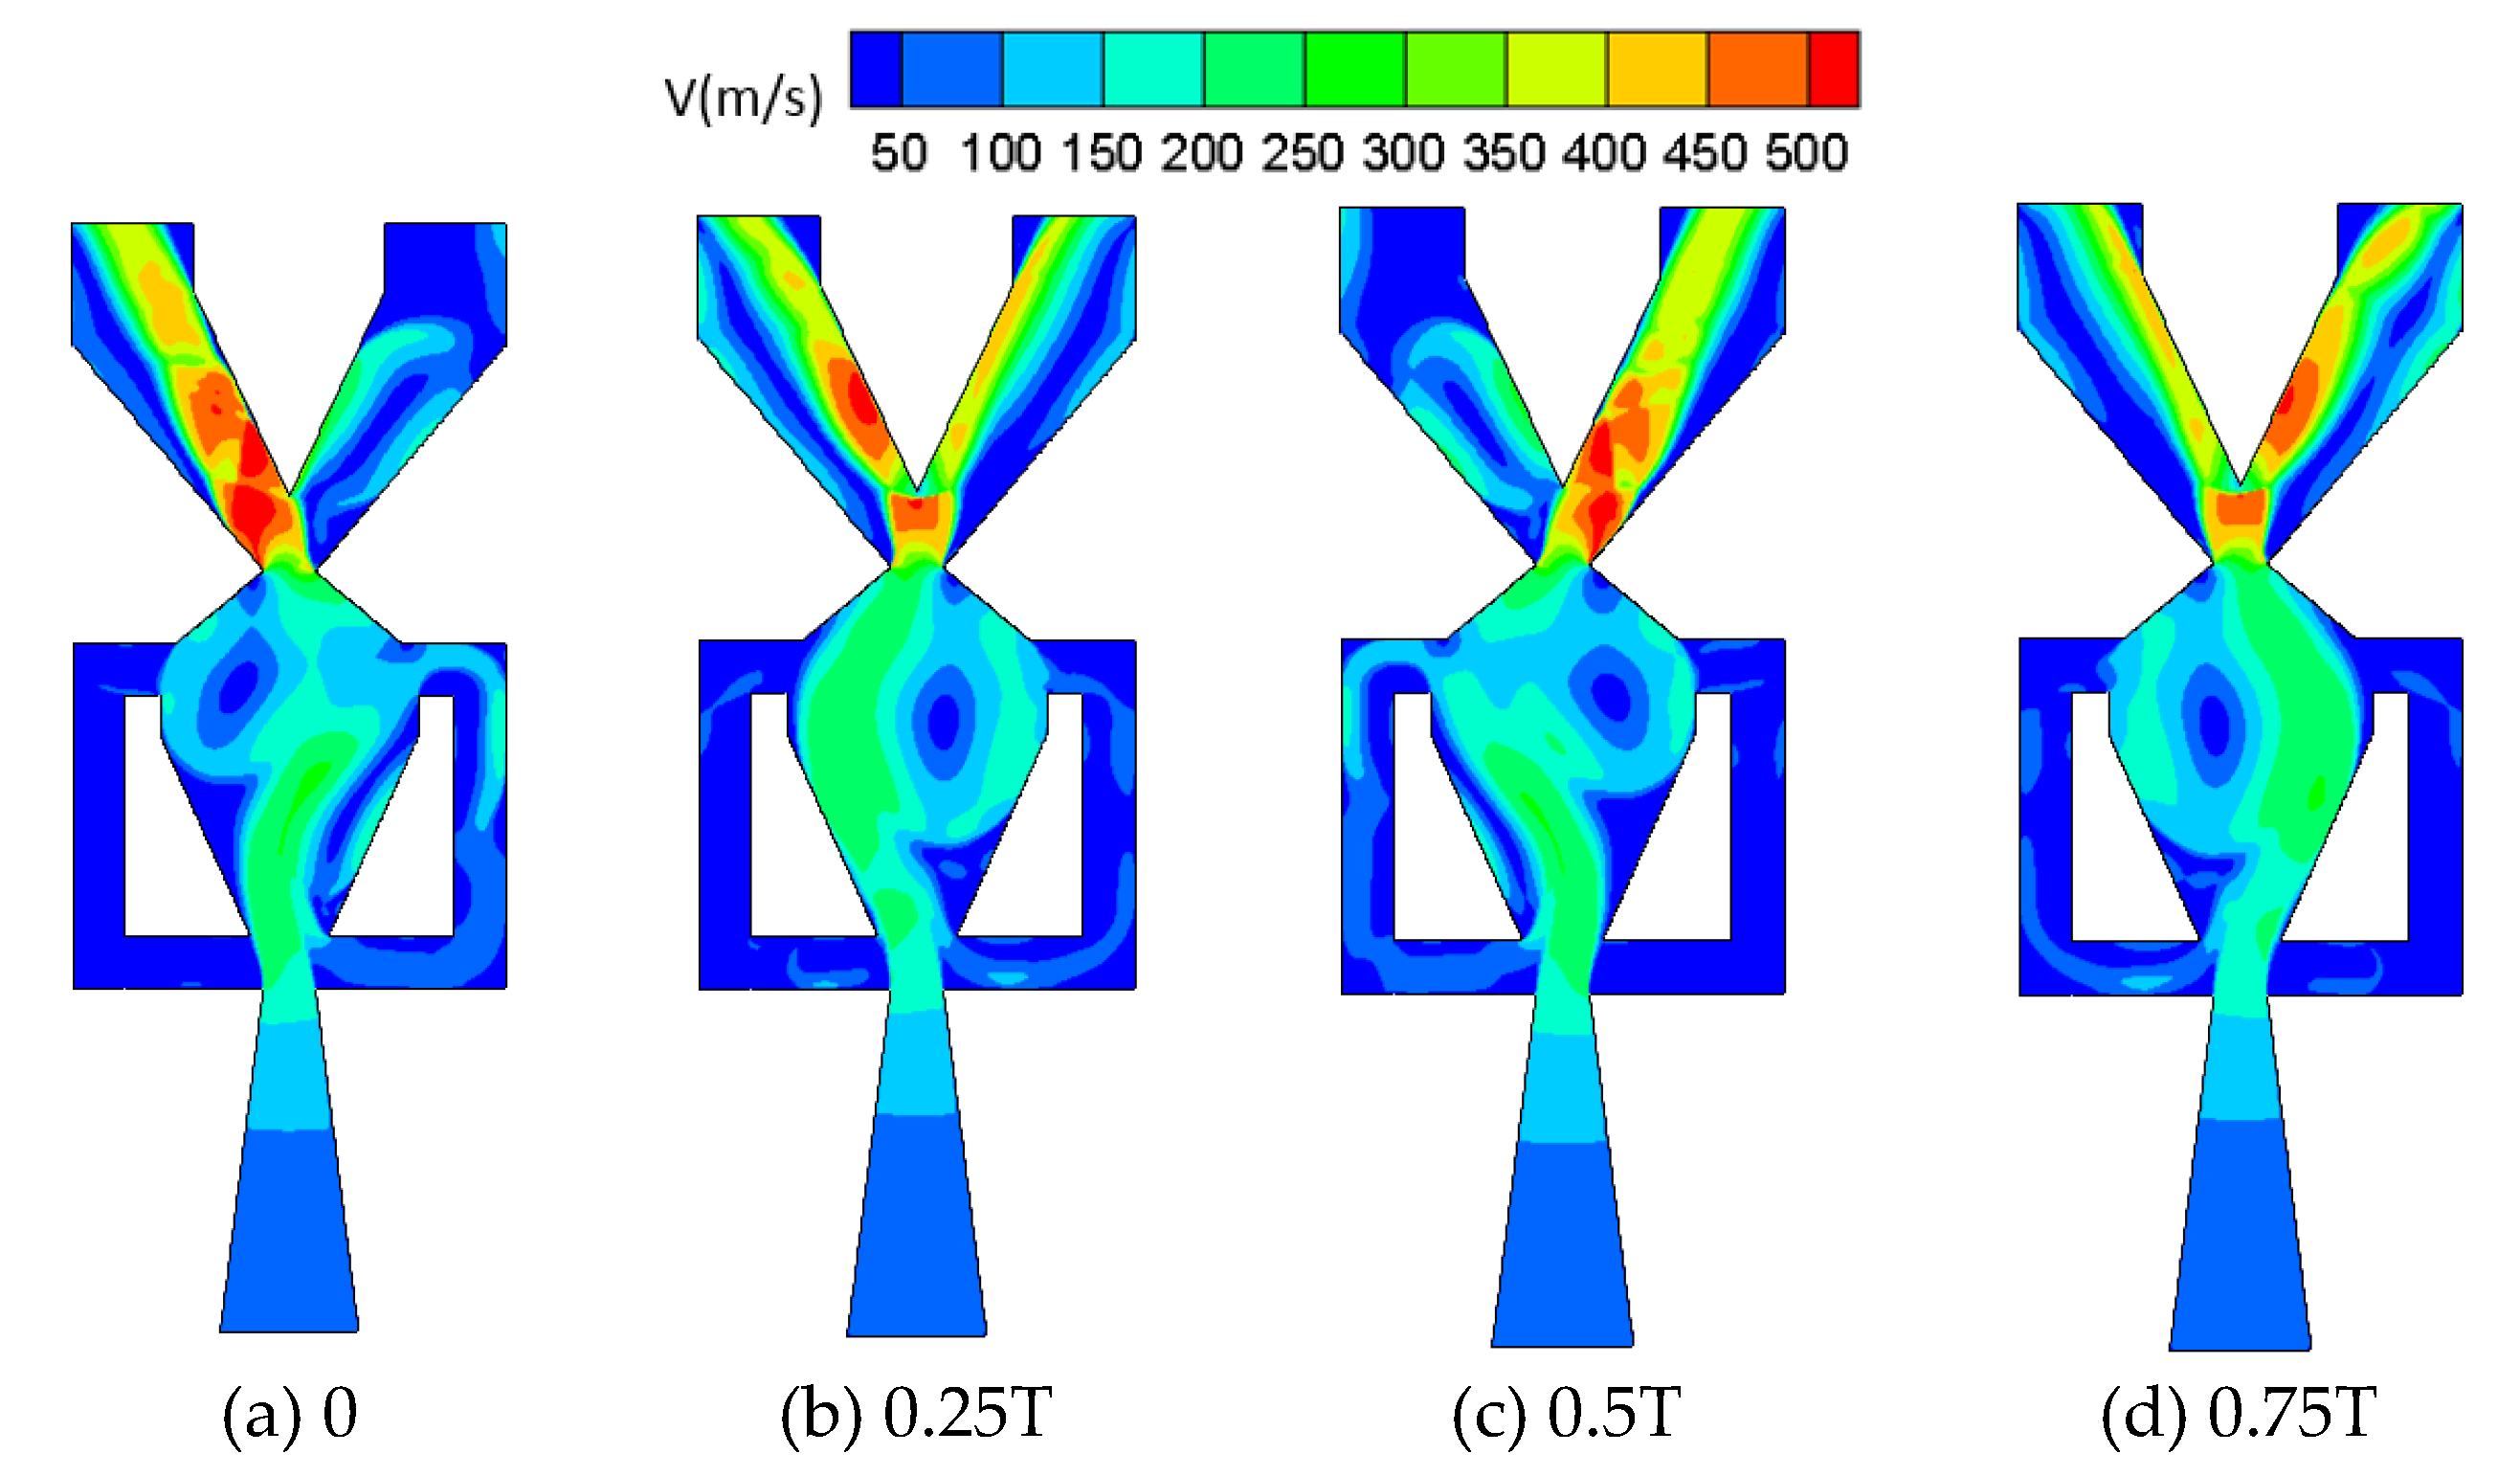
Figure 15 and Figure 16 show the velocity and static pressure variations of the jet over one cycle of model M6, 6, respectively. At t = 0, most of fluid flows out of the left outlets, as shown in Figure 15a. Part of the fluid enters the right feedback channel, which causes the pressure rise inside the right channel, as shown in Figure 15a and Figure 16a. The feedback flows out of the right control port acting on the main jet, allowing the main jet to deflect to the left. At this time, a high-pressure zone (pressure > 2.8 atm) can be observed at the left wall, as shown in Figure 16a, and this zone of high pressure moves downstream along the wall (the direction of motion is marked by the red arrow). At t = 0.25T, the jet has become completely attached to the left wall. The backflow region on the right side of the mixing chamber occupies half the area. The pressure in the right feedback channel decreases and that in the left feedback channel increases, as shown in Figure 16b. The pressure signal is transmitted to the left control port through the left feedback channel. At t = 0.5T, the feedback flow acts on the main jet, which sweeps to the right, and the high-pressure region appears on the right side of the mixing chamber. The pressure and velocity distributions at this moment are exactly the opposite of those at t = 0. The main jet becomes completely attached to the right wall at 0.75 T, and the backflow region on the left side of the mixing chamber reaches its maximum size.

4. Conclusions

Unsteady Reynolds-averaged Navier–Stokes simulations of a fluidic oscillator were performed, allowing the internal flow structure and physical mechanisms of fluidic oscillators to be investigated with various key geometrical parameter values. Numerical analysis was conducted to determine the effects of the power nozzle exit width (W1) and the throat width (W3) on the delay time (t0) and Mach number in the mixing chamber. The findings from this study are as follows:
(1)
In the range of parameters studied in this paper, when the power nozzle exit width (W1) is much smaller than the inlet width of the mixing chamber (W2), the delay time t0 of the oscillator decreases as W3 increases. When W1 is close to W2, the delay time t0 of the oscillator does not change significantly with variations in the throat width.
(2)
When W1 and W2 are held constant, the oscillators studied in this paper have a critical throat width (Wcr). When the width of the throat exceeds this critical value, not enough fluid flows back to the control port through the feedback channel. The jet cannot be deflected to attach to the side wall and no oscillating jet can form.
(3)
When W1 is held constant, the oscillation period gradually decreases as W3 increases, but the rate of decrease becomes progressively smaller. When W3 is held constant, the oscillation period decreases with any reduction in W1.

Author Contributions

Conceptualization, Y.S. (Yongjun Sang) and Y.S. (Yong Shan); Data curation, Y.S. (Yongjun Sang); Formal analysis, Y.S. (Yongjun Sang) and Y.S. (Yong Shan); Funding acquisition, Y.S. (Yong Shan); Investigation, Y.S. (Yongjun Sang) and H.L.; Methodology, X.T. and J.Z. All authors have read and agreed to the published version of the manuscript.

Funding

This research was funded by National Science and Technology Major Project (2017-III-0011-0037).

Conflicts of Interest

The authors declare no conflict of interest.

Nomenclature

T= Time of a stable oscillation period (s)
Ma= Mach number of fluid in the jet oscillator
W1= Power nozzle exit width (mm)
W2= Inlet width of the mixing chamber (mm)
W3= Outlet width of the mixing chamber (mm)
Wcr= Corresponding W3 value when the jet cannot oscillate(mm)
t= Working time of the jet oscillator (s)
tc= Time spent in the feedback channel (s)
t0= Delay time for the initiation of oscillation (s)
f= Frequency of the fluidic oscillator (Hz)
ts= Sweeping time of the oscillator in one period (s)

References

  1. Raman, G.; Raghu, S. Cavity resonance suppression using miniature fluidic oscillators. AIAA J. 2012, 42, 2608–2612. [Google Scholar] [CrossRef]
  2. Guyot, D.; Paschereit, C.O.; Raghu, S. Active combustion control using a fluidic oscillator for asymmetric fuel flow modulation. Int. J. Flow Control 2009, 1, 155–166. [Google Scholar] [CrossRef]
  3. Woszidlo, R.; Wygnanski, I. Parameters governing separation control with sweeping jet actuators. In Proceedings of the 29th AIAA Applied Aerodynamics Conference, Honolulu, HI, USA, 27–30 June 2011. [Google Scholar]
  4. Seifert, A.; Stalnov, O.; Sperber, D.; Arwatz, G.; Palei, V.; David, S.; Dayan, I.; Fono, I. Large trucks drag reduction using active flow control. In Proceedings of the 46th AIAA Aerospace Sciences Meeting and Exhibit, Reno, NV, USA, 7–10 January 2008. [Google Scholar]
  5. Annino, R.; Leone, J. The use of coanda wall attachment fluidic switches as gas chromatographic valves. J. Chromatogr. Sci. 1982, 20, 19–26. [Google Scholar] [CrossRef]
  6. Gregory, J.; Sullivan, J.; Raghu, S. Jet interaction studies in a fluidic oscillator. In Proceedings of the APS Division of Fluid Dynamics Meeting, Chicago, IL, USA, 20–22 November 2005. [Google Scholar]
  7. Bosenberg, W.R.; Drobshoff, A.; Alexander, J.I.; Myers, L.E.; Byer, R.L. Continuous-wave singly-resonant intracavity optical parametric oscillator based on periodically-poled LiNbO3. Optics. Lett. 1998, 23, 837–839. [Google Scholar]
  8. Li, Y.; Someya, S.; Koso, T.; Aramaki, S.; Okamoto, K. Characterization of periodic flow structure in a small-scale feedback fluidic oscillator under low-Reynolds-number water flow. Flow Meas. Instrum. 2013, 33, 179–187. [Google Scholar]
  9. Von Gosen, F.; Ostermann, F.; Woszidlo, R.; Nayeri, C.; Paschereit, C.O. Experimental investigation of compressibility effects in a fluidic oscillator. In Proceedings of the 53rd AIAA Aerospace Sciences Meeting, Kissimmee, FL, USA, 5–9 January 2015.
  10. Wu, X.; Dong, J. Study on the reflux and switching characteristics of a jet-controlled oscillator. Sci. Technol. Eng. 2016, 16, 314–318. [Google Scholar]
  11. Bobusch, B.C.; Woszidlo, R.; Kruger, O.; Paschereit, C.O. Numerical investigations on geometric parameters affecting the oscillation properties of a fluidic oscillator. In Proceedings of the 21st AIAA Computational Fluid Dynamics Conference, San Diego, CA, USA, 24–27 June 2013. [Google Scholar]
  12. Gokoglu, S.; Kuczmarski, M.; Culley, D.; Raghu, S. Numerical studies of a supersonic fluidic diverter actuator for flow control. In Proceedings of the 5th Flow Control Conference, Chicago, IN, USA, 28 June–1 July 2010. [Google Scholar]
  13. Gokoglu, S.; Kuczmarski, M.; Culley, D.; Raghu, S. Numerical studies of a fluidic diverter for flow control. In Proceedings of the 39th AIAA Fluid Dynamics Conference, San Antonio, TX, USA, 22–25 June 2009. [Google Scholar]
  14. Raman, G.; Hailye, M.; Rice, E.J. Flip-flop jet nozzle extended to supersonic flows. AIAA J. 1993, 31, 1028–1035. [Google Scholar] [CrossRef]
  15. Bobusch, B.C.; Woszidlo, R.; Bergada, J.M.; Nayeri, C.N.N.; Paschereit, C.O. Experimental study of the internal flow structures inside a fluidic oscillator. Exp. Fluids 2013, 54. [Google Scholar] [CrossRef]
  16. Gaertlein, S.; Woszidlo, R.; Ostermann, F.; Nayeri, C.N.; Paschereit, C.O. The time-resolved internal and external flow field properties of a fluidic oscillator. In Proceedings of the 52nd AIAA Aerospace Sciences Meeting, National Harbor, MD, USA, 13–17 January 2014. [Google Scholar]
  17. Park, S.; Ko, H.; Kang, M.; Lee, Y. An experimental study of the characteristics of a supersonic fluidic oscillator utilizing the design of experiment. In Proceedings of the AIAA Aviation 2019 Forum, Dallas, TX, USA, 17–21 June 2019. [Google Scholar]
  18. Krüger, O.; Bobusch, B.C.; Woszidlo, R.; Paschereit, C.O. Numerical modeling and validation of the flow in a fluidic oscillator. AIAA J. 2013, 2013–3087. [Google Scholar] [CrossRef]
Figure 1. Working mechanism of wall-attached fluidic oscillator.
Energies 13 03919 g001
Figure 2. Structure and geometric dimensions of the fluidic oscillator.
Energies 13 03919 g002
Figure 3. Sweeping angle over one period.
Energies 13 03919 g003
Figure 4. Effects of NPR on frequency.
Energies 13 03919 g004
Figure 5. Mach number distribution at different times in model M5, 3.
Energies 13 03919 g005
Figure 6. Mach number distribution at different times in model M5, 9.
Energies 13 03919 g006
Figure 7. Mach number distribution at different times in model M8, 6.
Energies 13 03919 g007
Figure 8. Mach number distribution at different times in model M5, 6.
Energies 13 03919 g008
Figure 9. Mach number distributions at different times in model M8, 12.
Energies 13 03919 g009
Figure 10. Delay time of oscillators with different structures.
Energies 13 03919 g010
Figure 11. The velocity of oscillators with different structures.
Energies 13 03919 g011
Figure 12. Distribution of streamlines at different times in model M7, 10.
Energies 13 03919 g012
Figure 13. Distribution of streamlines at different times in model M7, 11.
Energies 13 03919 g013
Figure 14. Oscillation periods of different oscillator structures.
Energies 13 03919 g014
Figure 15. Velocity distributions at different times.
Energies 13 03919 g015
Figure 16. Pressure distributions at different times.
Energies 13 03919 g016
Table 1. Critical throat width of oscillators with different structures.
W1 (mm)5678
Wcr (mm)1010.51113