Abstract
Daylight utilization significantly contributes to energy savings in office buildings. However, daylight integration requires careful design so as to include variations in daylight availability and maintain a balance between factors such as lighting quality and heat gain or loss. Designers with proper planning can not only improve the visual environment and create higher-quality spaces, but simultaneously minimize energy costs for buildings. The utilization of photosensors can exploit the benefits of daylighting by dimming the lighting system, so that no excessive luminous flux is produced, thus leading to energy savings as well as visual contentment. However, the human factor is crucial for the proper function of a lighting control system. Without its acceptance from the users, energy savings can be minimized or even negligible. The objective of this paper is to present a post-occupancy evaluation regarding occupant satisfaction and acceptance in relation to daylighting in offices equipped with automated daylight controls. In addition, the response of the users was compared with lighting measurements that were performed during the post-occupancy evaluation. Three case studies of office buildings with installed daylight-harvesting systems were examined. The age of the occupants was a crucial factor concerning their satisfaction in relation to the lighting levels. Aged users were more comfortable with lighting levels over 500lx, while young users were satisfied with 300lx. The impact of different control algorithms was outlined, with the integral reset algorithm performing poorly. The acceptance of the users for the closed loop systems maintained the expected energy savings of the daylight harvesting technique. Most of the occupants preferred to use daylight as a light source combined with artificial light but having the control to either override or switch it on and off at will. The results shown that a post-occupancy survey along with lighting measurements are significant for making an office environment a humancentric one.
1. Introduction
A significant amount of electricity, namely 17–20%, is consumed by lighting at a global scale [1,2]. In Greece, the respective quotient of the electricity consumed by lighting is 21% [3]. Apart from daylight integration as a means for electric energy reduction [4,5], by examining the daylight zones [6,7,8,9] and redirecting solar radiation [10,11,12,13,14], a lot of research has been conducted for (a) the promotion of renewable energy sources in the building sector [15,16,17,18] and in electrical energy storage systems [19] and (b) the energy savings in exterior places [20,21,22,23,24,25,26,27,28]. LED luminaires have a great impact on the lighting market due to their prominent characteristics such as high energy efficiency and long lifespan and are acknowledged as the prevailing lighting solution in the future [29,30,31,32]. The use of solid-state lighting can contribute to the reduction of energy consumption due to the increased luminous efficacy when compared to traditional light sources (i.e., fluorescent). Consequently, the global market penetration of LED lamps has increased from 9% in 2011 in the European Union and is expected to exceed 70% in the near future [3]. Decision makers in the lighting sector should take into account circular economy features and use of lighting controls [33,34,35,36,37,38,39,40,41,42,43]. Reviewing the literature, it is evident that the installation of daylight-harvesting systems leads to high energy savings [44,45,46]. Despite the proven benefits from daylight, daylight controls are not widely installed in buildings due to the additional costs of equipment, labor, studies for lighting control design, potential training for usage and maintenance. Another factor that impedes the proliferation of daylight controls is the misperception among building contractors that these systems are unreliable, although various studies have highlighted their high reliability [47,48,49,50,51,52]. In order to better understand the operation of photosensor-based daylight-harvesting systems and maximize the benefits of daylight integration, the users’ reaction to these systems must be thoroughly studied.
Building facilities have the sole purpose of accommodating the needs of their users. A post-occupancy evaluation study, abbreviated as POE, is defined as a holistic and rigorous procedure of assessing a building’s performance with regards to its users after its occupation. It can be described as the documentation and review of user satisfaction, space and resources exploitation of an occupied built facility so as to quantify its efficiency and designate critical occupant and building performance issues. It involves both technological as well as human factors [53]. Therefore, it can be considered as a framework which demonstrates the continuous interaction between buildings and the need of the occupants and suggests appropriate measures to optimize the built environment in order to fulfill these needs [54]. POEs are categorized in three types according to their purpose: indicative, investigative and diagnostic [55,56]. Post-occupancy evaluation is characterized by a plethora of benefits. The most important is that it provides feedback for the actual operation of a building [56]. Other benefits include the effective application of building design skills, improvement of building commissioning process, facilitation of building management, accumulation of knowledge concerning building operation, optimization of building efficiency with regards to a variety of both technical characteristics, e.g., a building’s energy or thermal management, its structure and architecture, as well as human characteristics, e.g., occupant’s wellbeing and productivity, opportunities to improve dialogue within design teams and their partners, improvement of existing building regulations and establishment of new more effective regulatory frameworks and policies [53,56]. The advantages of POE are applicable not only to a specific building or facility, but extend further to the building sector overall. A POE provides valuable conclusions, which can be utilized for the establishment guidelines and the adoption of measures that improve a buildings’ performance in existing, as well as future projects [57,58]. The conduction of POE’s enhances knowledge thus steadily improving building indoor environment [59].
Numerous studies have established the correlation between the occupants’ satisfaction and their productivity [58,60,61,62]. Buildings which address efficiently the needs of their users are considered more pleasant [58,63]. Lieman and Bordass [58] have proven that the level of control each user has over his working environment is a critical factor which is able to influence the occupants’ satisfaction and productivity. Another finding of their survey was that users were more satisfied when they worked in an office with the preferred operable windows, rather than offices with automatic ventilation in their working environment systems. An extensive post-occupancy evaluation study [64] has accumulated data from various office buildings and has highlighted the importance of indoor environment quality factors such as air quality, temperature, sound, privacy, etc. Thomas [61] has shown that high levels of daylight, glare and noise control in a work environment can positively affect the occupants’ satisfaction. Choi et al. [65] have performed on-site measurements of indoor environment quality characteristics, as well as occupant surveys and concluded that thermal quality along with lighting adequacy were highlighted as key factors for user satisfaction and wellbeing. Kim and de Dear [66] have compared the satisfaction of employees working in open-plan as well as private offices and deduced that the users of enclosed private offices expressed a higher level of satisfaction with their work environment. The most important factor affecting an occupant’s satisfactions in both types of offices was the amount of individual space available. However, several differences regarding user satisfaction between the two types of offices have been identified. Absence and high level of commotion in open space offices were significant factors that affected employee satisfaction negatively, whereas lighting levels, ease of interaction and comfortable furniture were identified as more significant for the satisfaction of the occupants in private offices. Another POE study by Agha-Hossein et al. [62] has denoted a strong correlation between the productivity and contentment of employees with two groups of variables: (a) interior usage of their workspace which includes office layout and appearance, comfort of furniture, visual and auditory privacy, and (b) physical conditions which include natural and artificial light, air quality and temperature. Filippín et al. [67] have conducted an evaluation study concerning a building in Argentina and quantified its thermal and energy performance which were highly praised by its occupants. Mustafa [59] published a POE study regarding the architecture, accessibility as well as indoor environment quality of a university facility in Iraq. The procedure of POE involved a combination of two sophisticated surveys. The first involved rating by experts and the second was addressed to the users of the building. The results of this study demonstrated that the majority of building environment characteristics, namely a quotient of 88%, is highly associated with the contentment of its occupants. Ponterosso et al. [63] have performed a POE in a “green” building and reached the conclusion that it is important that occupants are able to understand the sustainability features of a building. According to their study, thermal comfort is a profound factor which can affect comfort levels. Moreover, seemingly small details of the indoor environment can induce great impact on the level of comfort experienced by occupants. A large-scale POE study by Park et al. [68], including 1601 workstations in 64 office buildings, utilized measurements of indoor environment quality and occupant surveys. Their objectives were to determine critical indoor environment quality and physical parameters that affect occupant’s satisfaction with regards to thermal quality and indicate correlations between the building systems, the measurements of indoor environment factors and user satisfaction in simultaneous time frames. The researchers [68] deduced that the most important indoor environmental factors affecting occupant satisfaction with regards to thermal quality were air temperature and radiant temperature asymmetry which exists between the two sides of the building’s wall. Respectively, the most significant technical attributes of the building were the size of each working plane, view and the extent of thermal control. Candido et al. [69] aimed to identify key factors that correlate to employees’ contentment, productivity, and wellbeing in open-space office areas while concurrently indicating design similarities in contemporary working environments. The data that were analyzed came from 8827 evaluation studies in office buildings in Australia. The results have proven that maintenance and aesthetics of the building, quality of air, level of sound and commotion, visual comfort were considered among other features as key parameters by the occupants. Göçer et al. [70] documented the results from a dataset comprising of 9794 POE surveys in Australian office buildings. Their conclusions were that open-space office buildings could exploit the advantages of enhanced aesthetics, design of zones that addresses the needs of the work environment, daylight integration and access to an outdoor environment. A recent POE study [71] was conducted in four Swiss green office buildings and employed in situ measurements and occupant surveys in an effort s to demonstrate the factors that maximize users’ comfort. The main finding of the study was that although the observed environmental factors adhered to standards, the indoor conditions did not reach the 80% satisfaction threshold by the users. The occupants designated temperature and air quality as crucial parameters.
As energy audits and surveys in buildings have a significant role [72,73,74,75,76,77,78,79,80], the scope of the proposed research is to emphasize their corresponding role into the lighting systems. The number of POE studies focused only to lighting is limited and this is exactly the basic scope of the proposed method. The collection of POE studies, especially these focusing on the lighting systems, systematically organizes the existing knowledge in the field. In that sense, these studies can provide information on the quality features of the lighting design. In this paper, a post-occupancy evaluation study is performed to document the reactions of the occupants concerning daylight harvesting control systems. The study aims at drawing valuable conclusions concerning the efficiency of lighting systems and daylight controls in an office building. Three office buildings have been examined and a combination of methods has been selected in order to carry out the POE study, namely (a) observation of the lighting system of building, (b) physical measurements regarding the total illuminance on working plane level originating from both daylight and artificial lighting, and (c) an occupant survey was formed that takes into account the occupants’ reaction to daylight, windows and lighting control. An occupant survey was delivered to the users of three office buildings with different daylight harvesting control algorithms in each of them, in order to elucidate their preferences. The results of the study can produce a quality profile of the building based on different user opinions that can be utilized as a model for the evaluation of the lighting systems and controls, as well as to determine the correlation between the performance of these controls, the illuminance measurements and the user’s overall satisfaction and wellbeing.
2. Materials and Methods
This research is based on the occupants’ preferences together with lighting measurements. A questionnaire was designed that can demonstrate user preferences regarding daylight integration and lighting control. Three buildings were selected (A, B and C), each one with different control algorithm (closed loop, open loop and integral-reset control algorithm) in their daylight harvesting control system, in order to investigate their performance. The selection of these buildings was based on two factors: the suitability of the building (i.e., installed lighting control systems) and the availability of users to participate in a survey. The latter is a major problem since by publishing any energy-related results, the value of the buildings might be affected. Thus, there is a reluctance from building owners to participate in surveys or measurement campaigns. A total of 122 people were involved in the questionnaire and an equal number of task areas were measured. Figure 1 shows the methodology used. Lighting measurements combined with the occupants’ preferences were statistically analyzed. Presented in the following paragraphs are the examined buildings, the definition of the questionnaire, the lighting measurement and the statistical analysis procedures.
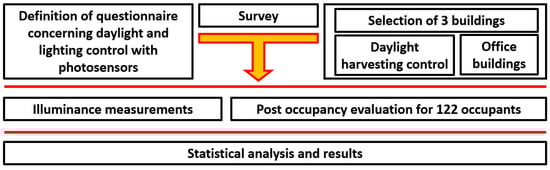
Figure 1.
Diagram of the post-occupancy evaluation method.
2.1. Selection of the Buildings
Three office buildings located in Athens, Greece, were selected. In all buildings, a daylight-harvesting system was installed. Building A (Figure 2) is a 2-storey office building of the tertiary sector in an open plan area. On the first floor there are open plan offices, while on the second floor there are closed office spaces. POE was performed in both floors. Building B (Figure 3) is an 8-storey office building. The sky view to the north is partially obstructed by a three-storey building. The users are located mainly in the perimeter of an open plan space. POE was performed on the 3rd and 4th floor. Building C (Figure 4) is a 4-storey office building. The sky view to the north and south is partially obstructed by two similar height buildings. Floors 2 and 3 were selected for this study. A detailed description of the lighting system and daylight control is presented in Table 1 for each building. In all buildings, all examined areas were used as offices. In the rest floors the activities were different, thus were not taken into account.
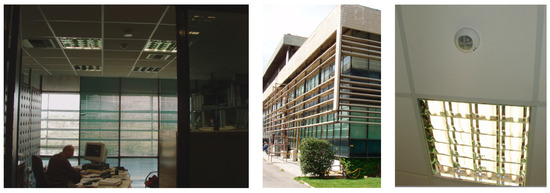
Figure 2.
Interior space (left), exterior façade (middle) and position of the photosensor (right) for Building A.
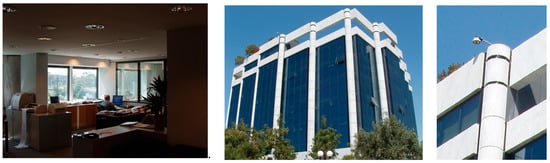
Figure 3.
Interior space (left), exterior façade (middle) and position of the photosensor (right) for Building B.
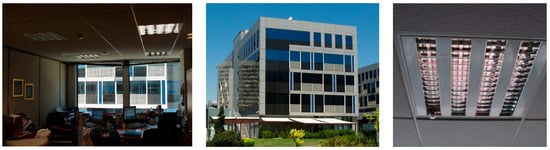
Figure 4.
Interior space (left), exterior façade (middle) and position of the photosensor (right) for Building C.

Table 1.
Technical characteristics of lighting system and daylight harvesting equipment.
2.2. Survey with Questionnaire
Since the main objective of the study concerned daylight integration and control, the occupants that were working in offices placed in the perimetric zone of each building were chosen for the study. The questionnaires were handed to the users that (a) are located in areas with high daylight penetration, (b) their working station was inside the daylight zone according to EN 15,193 [81] (the maximum depth of the daylight zone was 2.5 times the height between the window lintel above the floor and the height of the task area above the floor) and (c) the corresponding lighting system in the daylight zone was controlled using from a daylight-harvesting system. Due to the general personal data protection regulations the questionnaires were filled anonymously and the detailed position of the occupants’ working stations was not recorded, except their age. Figure 5 presents the orientation of the working spaces as a percentage.
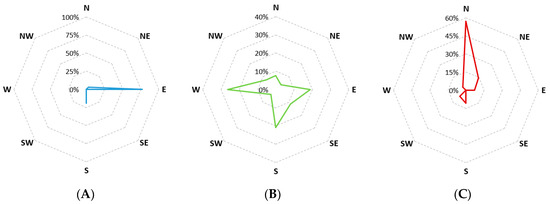
Figure 5.
Position of the occupants’ working planes concerning the orientation of the building façade where the office spaces were located for each examined building (Building A: left, Building B: middle, Building C: right).
The sample of the occupants that were selected, were between 20–60 years old. (Figure 6, right). The questionnaire was completed by a total number of 122 occupants (53 women, 69 men, Figure 6, left). The questions are presented in Table 2. The format of the questionnaire was based mainly on rating scales. Rating scales are used so as to model the respondents’ feedback in a comparative form and are applied in various types of surveys where respondents are expected to assess or classify attributes, such as performance, efficiency, etc. The rating scales are suitable for field research due to their reliability and efficiency for subsequent statistical analysis. Based on the answers, researchers were able to associate a qualitative measure with a certain attribute or feature. The answers were on an ordinal 5-point scale from ‘too much’ to ‘very poor’ and a 3- or 4-point scale, while some questions used a tick box (Table 2). The occupants were not trained or informed before filling the questionnaire, in which simple questions were used. This was a prerequisite for the current research. We believe that any training to the occupants prior the questionnaire could affect their responses, especially their awareness to the lighting controls systems, a crucial factor for their successful implementation in to the buildings.
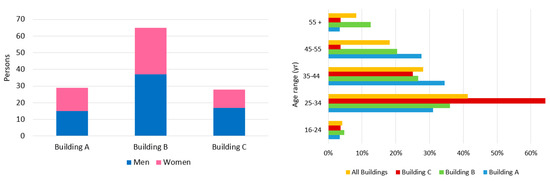
Figure 6.
Number of occupants that completed the POE (left), and their age frequency distribution (right).
Table 2.
The questionnaire given to the occupants of the buildings.
2.3. Survey with Lighting Measurements
During the survey and the evaluation of the questionnaire from the users (Spring time, from 11:00 to 15:00), illuminance measurements were performed. The illuminance measurements are a crucial parameter in a POE survey, because (a) the occupants’ opinion can be verified and (b) the lighting installation is checked as if it is in accordance with EN 12464-1 [82] or the initial lighting design. Special actions should be performed after POE and measurements are concluded. If the space is over illuminated and there are complaints, the redundant luminaires should be removed if possible. On the other hand, a number of luminaires should be added if lighting levels are inadequate. For the measuring procedure, a T-10a Minolta calibrated luxmeter was used (Figure 7). The measuring sensor was placed at a height of 0.8 m, on the working surface of each occupant. The luminaires in the measuring area were all in operation using daylight harvesting control. The measured value was the total illuminance, namely daylight and dimmed artificial lighting levels at the time of the survey.
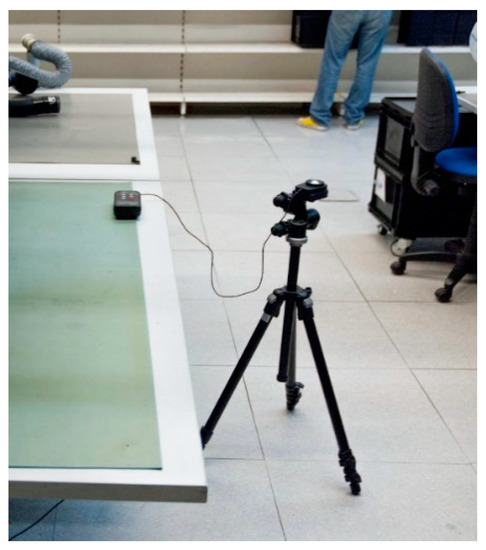
Figure 7.
Illuminance measurement procedure in a lighting survey. A T-10a Minolta calibrated illuminance meter was used for the measurements.
2.4. Statistical Analysis
The survey responses were used to build two types of variables, namely ordinal and dummy. Therefore, the methods for testing the research questions are adjusted on the type of variables incorporated in each one of them. There are two basic methods for testing the associations of variables. When the variables are of ordinal scale, the correlation analysis is conducted. There are two basic correlation coefficients: Pearson and Spearman. Pearson measures the association of variables using their original values while the Spearman coefficient tests the monotonic association based on the rankings of the variables. The first is parametric and is implemented in rather large samples, while the second is a non-parametric one and is implemented on rather small samples [82]. In addition, it can be used when the data are of ordinal scale, which is the case of the present paper [83]. Since, the correlation analyses will consider both the whole sample where observations are quite a lot, as well as on individual buildings, which have smaller samples, the present paper adopts the Spearman correlation analysis. The formula for estimating the Spearman coefficient between two variables y and x is as follows:
where n is the number of cases and di the difference between the ranks of their observation in y and x variables, respectively. The ρ coefficient takes values in the closed interval [−1,1] with values close to 1 denoting a strong positive correlation and values close to −1 a strong negative correlation. Values close to 0 denote a weak correlation of the considered variables [83,84].
On the other hand, when analysis incorporates both ordinal and dummy variables, the non-parametric Mann–Whitney test will be conducted. Mann–Whitney test the null hypothesis that the scores of a variable follow the same distribution over two samples being formulated by the two values of the dummy variable. Similar to Spearman coefficient, the Mann and Whitney statistic U, is computed based on the rankings rather on the actual scores of the variables [83,84]. Then, the statistical significance of the estimation is extracted based on a z normal approximation of the U statistic [85].
3. Results
3.1. Survey
In the first question (Table 2), the occupants ranked the three parameters that are most important for them in making an office environment a pleasant one. In this question, the users indicated what they want mostly and not necessarily what they experience in their office. Visual comfort, thermal comfort and ventilation are ranked as the most desired features with average with average occupants’ preferences 24.6%, 23.8% and 21.3%, correspondingly (Figure 8). On the other hand, in the second question, the occupants voted for what they experience in their offices. These comparable values for the individual examined buildings are shown in Figure 9. The results of occupants’ satisfaction for Buildings B and C related to the most parameters came out very well. Only visual comfort came out well for Building A, because of the lighting control system with photosensors and occupancy sensors.
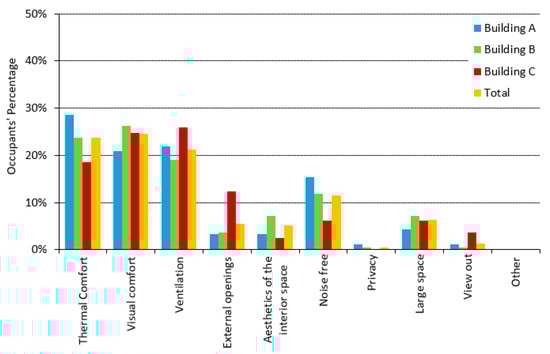
Figure 8.
Results of occupants’ opinion of what they want most from the main parameters that affect the overall comfort in an office building.
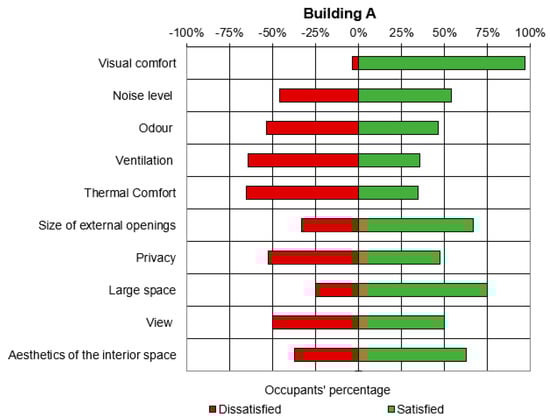
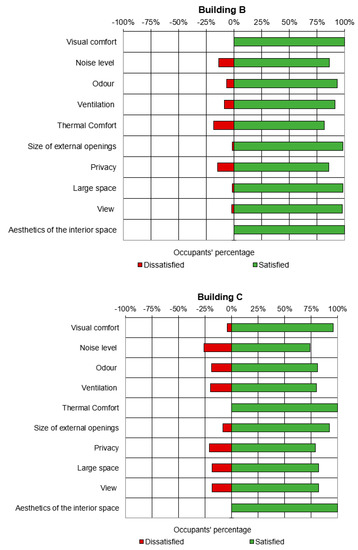
Figure 9.
Satisfaction (green color) and dissatisfaction (red color) of different parameters (Visual comfort, Noise level, Odor, Ventilation, Thermal Comfort, Size of external openings, Privacy, Large space, View, Aesthetics of the interior space) for the examined buildings.
As most of the occupants want to work with both daylight and artificial lighting (Figure 10, left) a daylight-harvesting system is preferable than a simple on-off switch. Thus, every user selected that the existence of an external opening is very or moderately important (Figure 10, right). However, only the users of Building C prefer their workplace to be illuminated solely by daylight, while the majority of the employees of Building A oppose it (Figure 11, left). Most of the occupants reported that there is too much light, not only into the entire area of their offices but also in their working planes. Their answers were almost the same either for their space or desk (Figure 11, right, and Figure 12, left). This is due to the overall and general lighting design using a typical grid. None of the buildings had placement of the luminaires according to the task areas. The occupants of Building A, while reporting high illuminance values for both daylight and artificial lighting (Figure 12, left), they also reported low amounts of daylight reaching their working space (Figure 12, right). This means that in many working positions in Building A, the luminaires above them were emitting their maximum light flux. In this building, the control of solar gains is realized by both external and internal shading systems (Figure 2, middle) which are adversely affecting daylight levels. In open-plan spaces, their use can result in gloomy conditions and hence low daylighting levels. A façade renovation can definitely improve the aforementioned conditions [10,11,12,13,14].
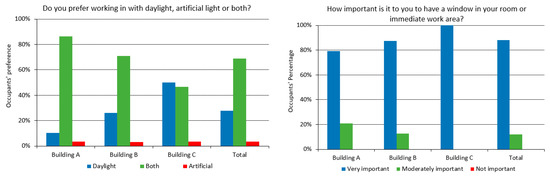
Figure 10.
Results for how the users prefer their lighting conditions (left) and how important is for them to have a window in their office (right).
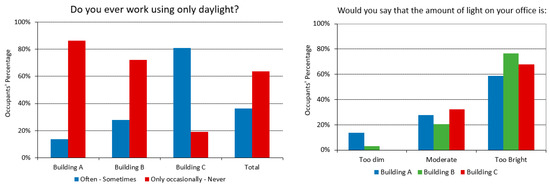
Figure 11.
Results of how often the occupants work using only daylight (left) and the amount of total light on their space (right).
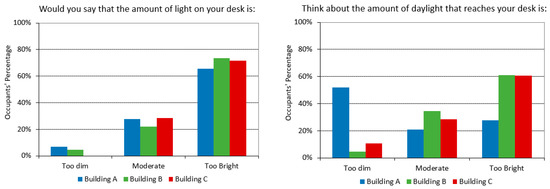
Figure 12.
Results about the amount of total light (left) and daylight only (right) on their desk.
From the total number of the users, 21% of them were not aware of the existence of a daylight harvesting control. The less awareness was recorded in Building C, where 43% of the occupants in that building did not know about the installed photosensors. The users’ responses show different reactions for the occupants of the buildings concerning light controls (Figure 13, Figure 14 and Figure 15). The users of buildings A and B had similar responses concerning the degree of control that the users have over the artificial lighting above their working plane (Figure 13, right). In general, the occupants stated that it is important to be able to control not only the artificial lighting above them (Figure 13, left) but also to control it separately from the advancement areas (Figure 14, right). However, they are highly or moderately satisfied with the degree of control of the lighting system that they have (Figure 14, left). It should be mentioned that daylight harvesting was in an automated mode in all examined buildings. Moreover, both buildings A and B do not offer their users the ability to override lighting controls or perform manual control (almost 90% of the users in buildings A and B; Figure 13, right). On the contrary, Building C offers that ability. For this reason, over 60% of all the users have expressed a strong desire to control the level of artificial lighting (Figure 13, left). Furthermore, while it could generally be expected that the degree for individual control would be high, the reality of control especially in areas with shared control groups, strengthens these convictions (Figure 14, right). Most of the users, over 50% for all the case studies, have the ability to control the amount of daylight that impinges on their working plane (Figure 15) by using the internal blinds (Figure 2 and Figure 4, left) to prevent direct solar radiation.
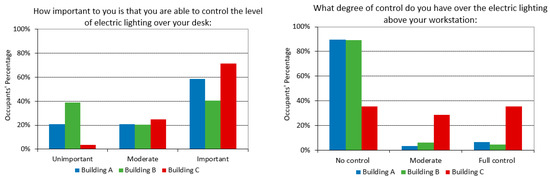
Figure 13.
Results of how important is from the occupants to control the level of artificial lighting over their working plane (left) and in what degree (right).
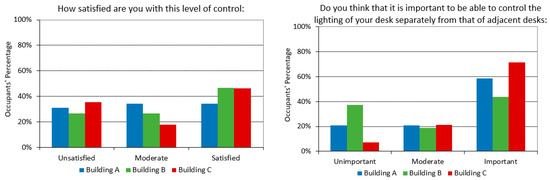
Figure 14.
Preference of occupants for how satisfied they are with their degree of control (left) and how important is from them to control the artificial lighting of their working plane separately from the others (right).
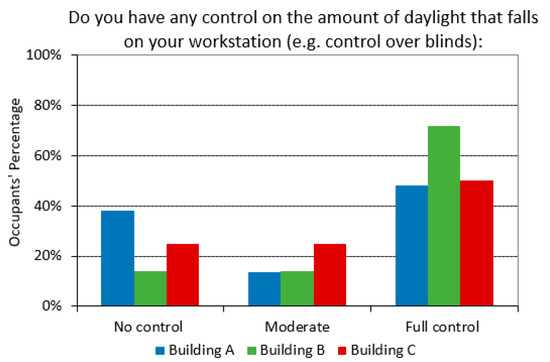
Figure 15.
Preference of occupants for the occupants’ control on the amount of daylight that impinges on their working plane.
3.2. Lighting Measurements and Occupants’ Preferences
According to EN 12464-1 [81], the target illuminance in an office space is 500lx. Figure 16, Figure 17 and Figure 18 present the lighting measurements concerning the installed power per person, glare, the total amount of light and daylight that experience in their space. With the help of an orange (upper limit) and a purple (lower limit) dashed line, a comfort zone of 500 ± 100lx was highlighted [86]. Most of the occupants (67%) are working in spaces with installed power up to 108W per person (Figure 16), emitting light that results from 150l to 883lx in illuminance values.
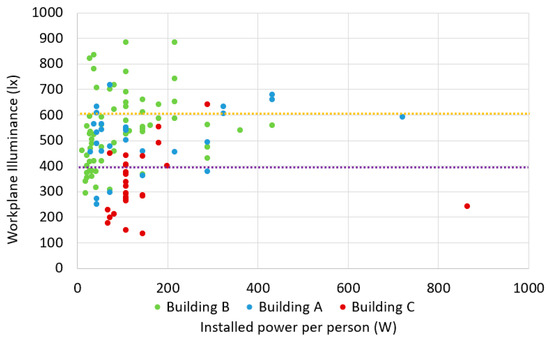
Figure 16.
Illuminance measurements vs. installed power per person.
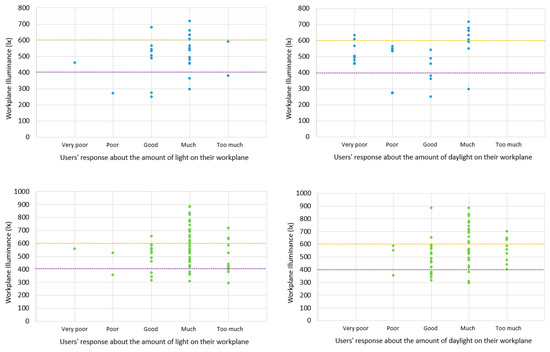
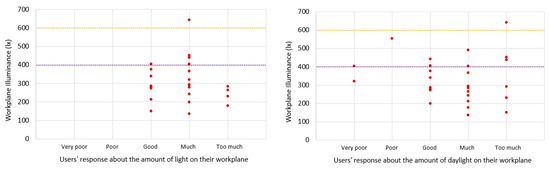
Figure 17.
Occupants’ response for the amount of total lighting levels (left column) and the corresponding daylight on their working plane (right column) in relation to the measured illuminance (Building A: Upper part, Building B: Middle, Building C: Lower part).
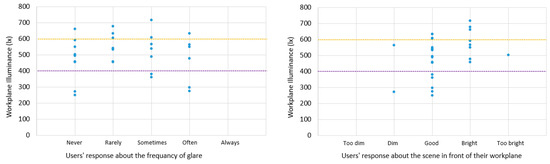
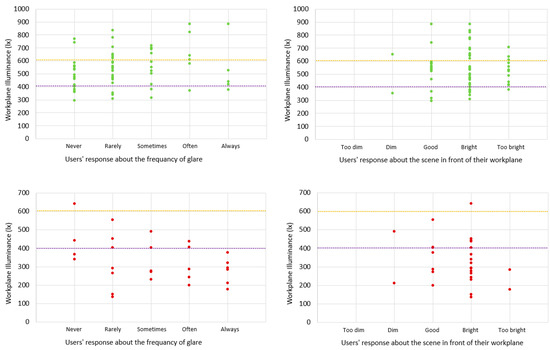
Figure 18.
Responses about the frequency of glare (left column) and the brightness of the scene in front of their working plane (right column) in relation to the measured illuminance (Building A: Upper part, Building B: Middle, Building C: Lower part).
In buildings A and B, the similar responses of the users concerning the amount of total light and daylight (Figure 17) on their working plane indicate that artificial light is dimmed as the total light should include high values of daylight. This is an indicator that the daylight-harvesting system is efficient as there were very few task areas (offices) where the measured total lighting levels were below 400lx. For the same buildings (A and B), evaluating the illuminance measurements, the “good” response of the users is coinciding with the comfort zone (400–600lx), while the “much” response is embodying many values higher than 600lx, especially in Building B. On the other hand, in Building C, while the responses of the occupants between the total light levels and daylight are again similar, the corresponding illuminance measurements are below the comfort zone (400–600lx). Although someone should expect that the occupants will describe this situation as “poor” or “very poor”, they experienced it as “good” or even “too much”.
As glare can be affected by how bright a scene can be, the frequency of glare and the brightness of the external views were examined through the measured lighting levels (Figure 18). There is a debate regarding the selection of an upper illuminance limit above which daylight is not preferable due to glare. While most of the users experienced bright scenes, the frequency of glare was declared from “never” to “sometimes”. Even in Building B, where there are high illuminance values, the same users felt, correctly, that the bright environment as the illuminance values were up to 900lx. However, as noted above, while the glare is related with luminance (cd/m2) distribution rather than illuminance values (lx).
4. Discussion
4.1. Lighting Levels and Age
The occupants’ perception regarding the amount of light on their desk did not correlate with the actual measurements of illuminance in their desk. A Spearman correlation analysis both on the whole sample but also on every individual building basis was performed. All analyses returned low ρ scores and non-statistically significant results indicating that the perceived capacity of lighting differs from the actual amount of illuminance. This could be a factor of the occupants’ age.
In Building A, 45% of the total lighting measurements, both artificial and daylight, were below 500lx (21% below 400lx) and 24% higher than 600lx. A total of 65% of the users responded (Figure 19) that they like their visual environment (Question 6, Table 2), while comparing the lighting system with the other building parameters (Question 2) their satisfaction for the lighting system was much higher. In the same way, in Building B, 38% of the measurements were below 500lx (17% below 400lx) and 28% higher than 600lx mostly due to daylight. 92% of the users liked their visual environment. Lastly, for Building C, 93% of the working stations were under illuminated, below 500lx (68% below 400lx). The measurements verified the problem of the integral reset algorithm used in Building C (Table 1). Even with a proper commissioning this control algorithm shows erratic behavior [34,36,39,40,44].
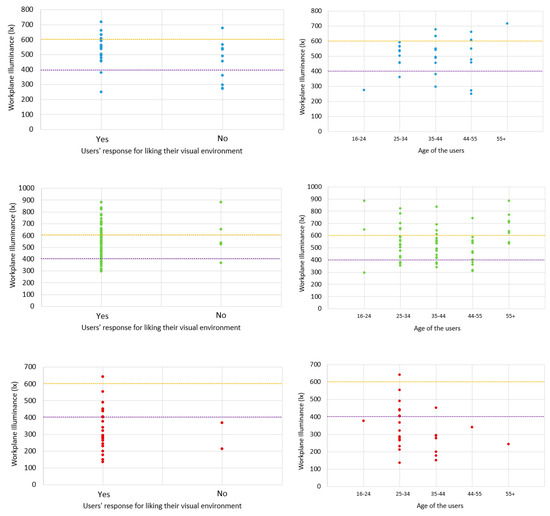
Figure 19.
Illuminance measurements vs. the occupants’ response concerning liking their visual environment (left) and their age (right).
Returning to age, it seems that the young age of the Building C users (mainly 25–34) were not affected by the reduced lighting levels (Figure 20) as 93% of them like their visual environment even if it is dimmed below 400lx in most cases. In Building B, where their users of increased age work (+55, Figure 19), a preference for illuminance values between 559 and 794lx was recorded (Figure 20). Figure 20 shows the average measured illuminance values along with the standard deviation per group age in which the occupants’ response for liking their visual environment was positive. The measured values of negative responses were not taken into account. These results verify the newer edition of EN12464-1 [87], in which, using the scale of illuminance (from 500 to 750lx) the lighting designer can decide if the illuminance levels should be raised by at least one step when working conditions or age require it. However, a high percentage of older staff should be within the specific working area. This is due to the retinal illuminance that decreases as people getting older and can be attributed to the reduction of the pupil size and higher spectral absorption of the crystalline lens. Higher lighting levels are needed also for persons that underwent presbyopic corrections [88].
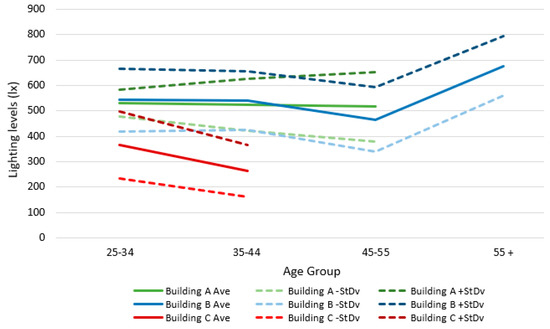
Figure 20.
Illuminance measurements on the users’ desks in regards their age, in which, the occupants’ response for liking their visual environment was positive.
4.2. Total Lighting Levels and Daylight
In Table 3, the estimated Rho coefficients and the respective statistical significance are presented for the three buildings. The results show that the relationship between the two variables is only found statistically significant for Building B. Considering the nature of the two questions (Questions 11 and 12, Table 2) and the fact that Building B is controlled by open loop sensors placed outdoors it is concluded that employees in that building give a positive evaluation to the total quantity of lighting only when they perceive that daylight is sufficient. This relationship is absent in the other buildings, signifying that satisfaction is achieved not only by the provision of daylight but also with artificial light. This raises a question regarding the effectiveness of artificial lighting provision in Building B.
Table 3.
The estimated Spearman Rho coefficients between variables of question 11 (total light) and question 12 (daylight) across the three buildings.
In Building C, the total lighting levels were lower than the corresponding value of 500lx, while there was presence of daylight (Figure 17). As already explained, the integral reset algorithm used in the photosensors of Building C, might be the main reason that artificial lighting was dimmed too much, lower than the necessary lighting levels. Secondly, another reason for the low lighting levels, could be a possible override of the system from the occupants. Due to both reasons, the users of younger age, gave a significant tolerance in visual comfort for achieved lower lighting levels (Figure 20).
4.3. Glare
Most of the users are satisfied with their visual environment with the slight exception of the Building A (Figure 21, left). The use of the external blinds in Building A may dissatisfy some occupants because the deterioration of the view. More than 50% of the occupants consider themselves as insensitive to glare (Figure 22, right). The main sources of glare were the reflections on the monitors either by the artificial lighting systems or the daylight. The employees’ satisfaction of their visual environment was tested by taking into account (a) the abundance of light when they look in front of them (Questions 6 and 7, Table 2) and (b) the frequency of glare incidents (Questions 6 and 8). Variable from question 6 (Is your visual environment pleasing?) is a dummy variable and variables from question 7 (When you look up from your working plane does the scene that your see in front of you seem…) and question 8 (Does glare ever disturb or annoy you?) are of ordinal Likert scale, thus a direct correlation analysis is not feasible. Instead, a Mann–Whitney test is preferred. The Mann–Whitney test for questions 6 and 7 returned a z value of −3.176 which denotes statistical significance at the (<0.01) level. This result shows that when employees consider the light in their front view as adequate (inside the field of view of the human eye looking forward), they tend to show greater satisfaction for their visual environment (including their working surface). The relationship across the three buildings was tested and we acquired statistically significant result only for the Building B. In addition, the results of the test for questions 6 and 8 returned a z value of −0.345 with no statistical significance. Therefore, glare does not seem to affect the visual comfort satisfaction level of employees at the measured illuminance levels. To test for any differences across the buildings three tests were also conducted returning no significant results. Hence, the absence of any relationship between visual satisfaction and glare is confirmed for the whole sample. In addition, user sensitivity to glare was tested by estimating the number of glare incidents that encounter for all buildings (Questions 6 and 8). Since the variable of question 9 is a dummy one, the test will rely on the Mann–Whitney method. The tests performed over all the three buildings returned no statistically significant result. Thus, it is concluded that sensitivity to glare does not influence the judgement of employees regarding the frequency of glare incidents in their work.
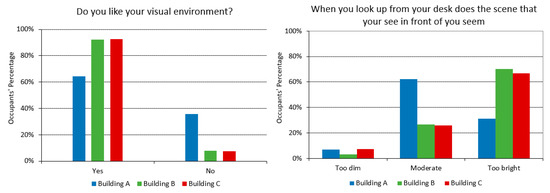
Figure 21.
Occupants’ preference for their visual environment (left) and how dim or bright is the scene in front of them (right).
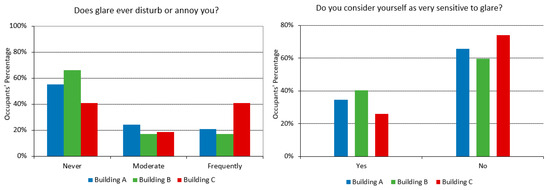
Figure 22.
Results of how frequent the users are disturbed from glare (left) and if they consider themselves sensitive to glare (right).
4.4. Lighting Controls
Figure 13, Figure 14 and Figure 15 show the different reactions of the occupant responses concerning the light controls. The relationship formed among the questions 14–16 (Table 2) and their corresponding variables was examined. This differs across the three buildings because of the different control algorithms (Table 1). For this reason, the pairwise Spearman correlation coefficients were estimated. The estimated ρ coefficients and their statistical significance are presented in Table 4. The estimated correlation coefficient between question 14 and 15 variables acquires statistical significance only when Building B is considered. This means that only in Building B it is both important, from the users, to have ability to control the lighting on their desk area and to be satisfied with the amount of control that they already have. As for the correlation of variables between question 14 and 16, this was found significant in buildings A and B, with the former estimation acquiring higher statistical significance (<0.01 to <0.10 level). For those buildings it seems that a positive relationship does exist between (a) the user’s ability to control the lighting in their desk areas and (b) their satisfaction with the actual level of control. Finally, the third correlation test (between question 15 and 16 variables) yields the exact opposite results, as a strong and statistically significant correlation coefficient is found only for Building C. This finding denotes that the control of lighting and the satisfaction of employees regarding the actual control are correlated only in Building C. Finally, concerning the relationship between the importance on the ability to control lighting on their area, as opposed to the ability to do that separately from the adjacent desks, the correlation analysis returned a rather high rho coefficient (0.659) which was found statistically significant at the (<0.01) level, as expected.
Table 4.
The results of the pairwise Spearman correlation analyses for the variables of question 14 (How important to you is that you are able to control the level of electric lighting over your desk?), question 15 (What degree of control do you have over the electric lighting above your work plane?) and question 16 (How satisfied are you with this level of control?) for the three examined buildings.
5. Conclusions
Buildings are established to be functional and satisfy the needs of their occupants. Hence, the goal of a building cannot be accomplished if its occupants are discontented by its performance. The goal of a post-occupancy evaluation study is to conduct a methodical and thorough assessment of the overall performance attributes of a facility after its occupation, to obtain feedback about a variety of features, such as energy consumption, quality of the indoor environment, occupant’s satisfaction, productivity, etc. The results of a post-occupancy evaluation study are able to elucidate if a building responds to the expectations that were envisaged in the early stages of the design, by appraising the facility’s performance with regards to human aspects such as the occupant’s satisfactions or wellbeing, as well as nonhuman aspects such as metrics of their energy and thermal performance. In this study a questionnaire was generated so as to concentrate on the lighting of the examined buildings and especially on daylight utilization in buildings, where daylight controls with photosensors are installed.
A systematic documentation and analysis of the information gathered from the three examined buildings was conducted and some features that will be exploited in the future were identified. The majority of the occupants have a positive opinion about their lighting quality with the exception of the employees that occupy Building A. The discontentment of the occupants can be attributed to the external blinds that are installed in Building A, which obstruct their view. The users’ strong preference for daylight illumination leads to the conclusion that daylight is more effective in increasing work place morale and providing visual comfort rather than artificial light. Another remark is that visual comfort, temperature and ventilation are evaluated as the most desirable characteristics of indoor environment quality in an office space. Additionally, low levels of noise and spaciousness received high, but not the highest, ranking. It should be noted that the only discontentment related to daylight penetration in buildings is mainly associated with glare, particularly on the computer monitors. Therefore, when designing with a daylight professional must implement all the appropriate measures so as to eradicate any visual discomfort caused by glare.
The lighting measurements along with a post-occupancy evaluation, can form a complete survey concerning the lighting system and can be part of a building energy audit and diagnosis. The users’ satisfaction of their visual environment is in line with the lighting measurements and the corresponding target illuminance (500 ± 100lx, [86]). Two trends concerning their age and the lighting levels were documented. In Building C, the occupants were satisfied even when the lighting levels were lower than the target illuminance of 500lx for an office environment. This is due to the integral reset control algorithm (Building C) that had the poorest behavior from all three buildings since for 93% of the user positions were below 500lx. This of course is related to increased lighting energy savings in Building C, but with illuminances lower than the design illuminance. However, the acceptance rate of the users was high most probably due to their young age. The new edition of prEN12464-1 2019 [87] suggests a step increase of 250lx in office environments for aged users. However, the opposite action, a reduction of illuminance due to young users, does not occur as this reduction was documented in the current research. On the other hand, in Building B, the increased age group of people was satisfied with higher levels of illuminance verifying the recommendations the prEN12464-1 2019 [87]. These recommendations allow lighting professionals adopt an increased task illuminance for older occupants so as to counterbalance the decline of retinal illuminance due to age. This should be applied in specific task areas and note to whole area, as more energy consumption could weigh down the overall building energy equilibrium. Furthermore, the results show that in Building C increased energy savings can be expected since the users prefer lighting levels less than 500lx. A daylight control system can achieve up to 60% [89] energy savings in comparison to a manual control system provided that operates normally. Any erratic behavior could counterbalance the possible energy savings, as the users tend to override it and thus losing a substantial percentage of the energy savings. While the targeted POE for lighting control installations are limited, the erratic behavior of the integral reset control algorithm was verified according to the relative bibliography [36,39,45]. Examining the lighting levels with the satisfaction of the users the results were verified also with previous research [65]. The purpose of the study was mainly to examine the acceptance of control systems by building occupants recording all possible problems caused by their operation. This can be accomplished by a time limited survey. However, if the proposed POE method is performed at different seasons in a year can help to calibrate the daylight-harvesting system properly, maintaining the expected energy savings.
Most occupants praised the integration of automated daylight controls, although they revealed their strong preference towards individual control over the artificial lighting system. In other words, each occupant desires to be able to control his or her individual lighting conditions rather than having to accept lighting levels that are adjusted by others (e.g., lighting professionals) for them, even when the lighting conditions comply with international standards. For the full acceptance of a lighting control system, the occupants should become aware that the system does exist in their working environment. In this survey, 79% of the users knew that a daylight harvesting technique was implemented in their working space. In Building C, the aforementioned percentage dropped to 43%. In this building, lighting control was implemented only in the perimeter zone as a stand-alone solution for every luminaire. Although low illuminance levels were recorded, users did not bother to examine the cause of low illuminance and fix it. The age of the users was an important parameter which affected their tolerance for lower light levels. However, it is still important for the facilitators, to inform and educate the occupants regarding proper use of lighting control systems that are integrated to their building. Furthermore, the quick fluctuation of the dimming levels of the daylight-harvesting system was the most pivotal reason for the discontentment of the lighting system from occupants in all buildings. It is crucial that the commissioning of the system should be performed by a lighting expert [90]. A proper adjustment of the photosensor’s time response could provide solution to this problem in the examined buildings. The proper commissioning of the installed photosensors could maximize energy savings.
The reality is that the occupants will never be satisfied by any daylight-harvesting system unless they have some benefit from it. The results showed that, for all the cases, (a) ease of use of lighting controls, (b) occupant awareness to lighting controls and (c) occupant training concerning lighting controls are of critical importance so as to establish desirable lighting conditions and simultaneously achieve energy savings.
Author Contributions
Conceptualization, L.T.D. and A.T.; Data curation, L.T.D., E.-N.M. and P.A.K.; Formal analysis, L.T.D., S.N., A.K., P.A.K., V.T.K., K.S., E.M. and M.S.; Investigation, L.T.D., E.-N.M., A.K., P.A.K., V.T.K. and K.S.; Methodology, L.T.D.; Supervision, L.T.D. and A.T.; Validation, A.T., K.S., M.S. and S.Z.; Writing—original draft, L.T.D., A.T., E.-N.M. and S.N.; Writing—review and editing, L.T.D., A.T., F.T. and S.Z. All authors have read and agreed to the published version of the manuscript.
Funding
This research received no external funding.
Conflicts of Interest
The authors declare no conflict of interest.
References
- Wagiman, K.R.; Abdullah, M.N.; Hassan, M.Y.; Radzi, N.H.M.; Bakar, A.H.A.; Kwang, T.C. Lighting system control techniques in commercial buildings: Current trends and future directions. J. Build. Eng. 2020, 31, 101342. [Google Scholar] [CrossRef]
- Zissis, G. Energy consumption and environmental and economic impact of lighting: The current situation. In Handbook of Advanced Lighting Technology; Karlicek, R., Sun, C., Zissis, G., Ma, R., Eds.; Springer International Publishing: Cham, Switzerland, 2016; pp. 1–13. [Google Scholar] [CrossRef]
- Grigoropoulos, C.J.; Doulos, L.T.; Zerefos, S.C.; Tsangrassoulis, A.; Bhusal, P. Estimating the benefits of increasing the recycling rate of lamps from the domestic sector: Methodology, opportunities and case study. Waste Manag. 2020, 101, 188–199. [Google Scholar] [CrossRef]
- Mavridou, T.; Doulos, L.T. Evaluation of different roof types concerning daylight in industrial buildings during the initial design phase: Methodology and case study. Buildings 2019, 9, 170. [Google Scholar] [CrossRef]
- Tsangrassoulis, A.; Doulos, L.; Santamouris, M.; Fontoynont, M.; Maamari, F.; Wilson, M.B.; Jacobs, A.; Solomon, J.M.; Zimmerman, A.; Pohl, W.; et al. On the energy efficiency of a prototype hybrid daylighting system. Solar Energy 2005, 79, 56–64. [Google Scholar] [CrossRef]
- Mantzourani, K.; Doulos, L.T.; Kontadakis, A.; Tsangrassoulis, A. The effect of the daylight zone on lighting energy savings. IOP Conf. Ser. Earth Environ. Sci. 2020, 410, 012099. [Google Scholar] [CrossRef]
- Sibley, M.; Peña-García, A. Flat glass or crystal dome aperture? A year-long comparative analysis of the performance of light pipes in real residential settings and climatic conditions. Sustainability 2020, 12, 3858. [Google Scholar] [CrossRef]
- Peña-García, A. Towards total lighting: Expanding the frontiers of sustainable development. Sustainability 2019, 11, 6943. [Google Scholar] [CrossRef]
- Palarino, C. María beatriz piderit, optimisation of passive solar design strategies in Side-lit Offices: Maximising daylight penetration while reducing the risk of glare in different chilean climate contexts. J. Daylighting 2020, 7, 107–121. [Google Scholar] [CrossRef]
- Tsangrassoulis, A.; Doulos, L.; Kontadakis, A.; Drakou, A. A Methodology to Model the Performance of a Dynamic Mirror Light-shelf Based on Solar Radiant Flux Impinging on the Window. In Proceedings of the Building Simulation 2019: 16th IBPSA International Conference and Exhibition (ISBN: 978-1-7750520-1-2), Rome, Italy, 2–4 September 2019; Available online: http://www.ibpsa.org/building-simulation-2019 (accessed on 30 June 2020).
- Kontadakis, A.; Doulos, L.; Mantzourani, A.; Tsangrassoulis, A. Performance assessment of an active sunlight redirection system in areas with different climate: A comparison. IOP Conf. Ser. Earth Environ. Sci. 2020, 410, 012098. [Google Scholar] [CrossRef]
- Kontadakis, A.; Tsangrassoulis, A.; Doulos, L.T.; Topalis, F. An active sunlight redirection system for daylight enhancement beyond the perimeter zone. Build. Environ. 2017, 113, 267–279. [Google Scholar] [CrossRef]
- Eltaweel, A.; Mandour, M.A.; Lv, Q.; Su, Y. Daylight distribution improvement using automated prismatic louvre. J. Daylighting 2020, 7, 84–92. [Google Scholar] [CrossRef]
- Kontadakis, A.; Tsangrassoulis, A.; Doulos, L.T.; Zerefos, S. A review of light shelf designs for daylit environments. Sustainability 2018, 10, 71. [Google Scholar] [CrossRef]
- Arabatzis, G.; Kyriakopoulos, G.; Tsialis, P. Typology of regional units based on RES plants: The case of Greece. Renew. Sustain. Energy Rev. 2017, 78, 1424–1434. [Google Scholar] [CrossRef]
- Kyriakopoulos, G.L.; Arabatzis, G.; Tsialis, P.; Ioannou, K. Electricity consumption and RES plants in Greece: Typologies of regional units. Renew. Energy 2018, 127, 134–144. [Google Scholar] [CrossRef]
- Ntanos, S.; Skordoulis, M.; Kyriakopoulos, G.; Arabatzis, G.; Chalikias, M.; Galatsidas, S.; Batzios, A.; Katsarou, A. Renewable energy and economic growth: Evidence from european countries. Sustainability 2018, 10, 2626. [Google Scholar] [CrossRef]
- Doulos, L.; Santamouris, M.; Livada, I. Passive cooling of outdoor urban spaces. The role of materials. Solar Energy 2004, 77, 231–249. [Google Scholar] [CrossRef]
- Kyriakopoulos, G.L.; Arabatzis, G. Electrical energy storage systems in electricity generation: Energy policies, innovative technologies, and regulatory regimes. Renew. Sustain. Energy Rev. 2016, 56, 1044–1067. [Google Scholar] [CrossRef]
- Doulos, L.T.; Sioutis, I.; Tsangrassoulis, A.; Canale, L.; Faidas, K. Revision of threshold luminance levels in tunnels aiming to minimize energy consumption at no cost: Methodology and case studies. Energies 2020, 13, 1707. [Google Scholar] [CrossRef]
- Papalambrou, A.; Doulos, L.T. Identifying, examining, and planning areas protected from light pollution. The case study of planning the first national dark sky park in Greece. Sustainability 2019, 11, 5963. [Google Scholar] [CrossRef]
- Ardavani, O.; Zerefos, S.; Doulos, L.T. Redesigning the exterior lighting as part of the urban landscape: The role of transgenic bioluminescent plants in Mediterranean urban and suburban lighting environments. J. Clean. Prod. 2020, 242, 118477. [Google Scholar] [CrossRef]
- Doulos, L.T.; Sioutis, I.; Kontaxis, P.A.; Zissis, G.; Faidas, K. A decision support system for assessment of street lighting tenders based on energy performance indicators and environmental criteria: Overview, methodology and case study. Sustain. Cities Soc. 2019, 51, 101759. [Google Scholar] [CrossRef]
- Anthopoulou, E.; Doulos, L.T. The Effect of the Continuous Energy Efficient Upgrading of LED Street Lighting Technology: The Case Study of Egnatia Odos, 2019 2nd ed. In Proceedings of the Balkan Junior Conference on Lighting, Balkan Light Junior 2019, Plovdiv, Bulgaria, 19 September 2019. Abstract number 8883662. [Google Scholar] [CrossRef]
- Doulos, L.T.; Sioutis, I.; Tsangrassoulis, A.; Canale, L.; Faidas, K. Minimizing lighting consumption in existing tunnels using a no-cost fine-tuning method for switching lighting stages according revised luminance levels. In Proceedings of the 2019 IEEE International Conference on Environment and Electrical Engineering and 2019 IEEE Industrial and Commercial Power Systems Europe (EEEIC/I&CPS Europe), Genova, Italy, 11–14 June 2019; pp. 1–6. [Google Scholar] [CrossRef]
- Peña-García, A.; Salata, F.; Golasi, I. Decrease of the maximum speed in highway tunnels as a measure to foster energy savings and sustainability. Energies 2019, 12, 685. [Google Scholar] [CrossRef]
- Galatanu, C.D.; Canale, L.; Lucache, D.D.; Zissis, G. Reduction in light pollution by measurements according to EN 13201 standard. In Proceedings of the 2018 International Conference and Exposition on Electrical and Power Engineering (EPE), Iasi, Romania, 18–19 October 2018; pp. 1074–1079. [Google Scholar]
- Peña-García, A.; S˛edziwy, A. Optimizing lighting of rural roads and protected areas with white light: A compromise among light pollution, energy savings, and visibility. LEUKOS 2019, 16, 147–156. [Google Scholar] [CrossRef]
- Madias, E.-N.D.; Kontaxis, P.A.; Topalis, F.V. Application of multi-objective genetic algorithms to interior lighting optimization. Energy Build. 2016, 125, 66–74. [Google Scholar] [CrossRef]
- Madias, E.D.; Doulos, L.T.; Kontaxis, P.A.; Topalis, F.V. A decision support system for techno-economic evaluation of indoor lighting systems with LED luminaires. Oper. Res. Int. J. 2019. [Google Scholar] [CrossRef]
- Manolis, E.; Doulos, L.T.; Niavis, S.; Canale, L. The impact of energy efficiency indicators on the office lighting planning and its implications for office lighting market. In Proceedings of the 2019 IEEE International Conference on Environment and Electrical Engineering and 2019 IEEE Industrial and Commercial Power Systems Europe (EEEIC/I&CPS Europe), Genova, Italy, 11–14 June 2019; pp. 1–6. [Google Scholar] [CrossRef]
- Doulos, L.T.; Tsangrassoulis, A.; Kontaxis, P.A.; Kontadakis, A.; Topalis, F.V. Harvesting daylight with LED or T5 fluorescent lamps? The role of dimming. Energy Build. 2017, 140, 336–347. [Google Scholar] [CrossRef]
- Adam, G.K.; Kontaxis, P.A.; Doulos, L.T.; Madias, E.N.D.; Bouroussis, C.A.; Topalis, F.V. Embedded microcontroller with a CCD camera as a digital lighting control system. Electronics 2019, 8, 33. [Google Scholar] [CrossRef]
- Bellia, L.; Fragliasso, F. Evaluating performance of daylight-linked building controls during preliminary design. Autom. Constr. 2018, 93, 293–314. [Google Scholar] [CrossRef]
- Bellia, L.; Fragliasso, F. Automated daylight-linked control systems performance with illuminance sensors for side-lit offices in the Mediterranean area. Autom. Constr. 2019, 100, 145–162. [Google Scholar] [CrossRef]
- Bellia, L.; Fragliasso, F.; Stefanizzi, E. Why are daylight-linked controls (DLCs) not so spread? A literature review. Build Environ. 2016, 106, 301–312. [Google Scholar] [CrossRef]
- Beu, D.; Ciugudeanu, C.; Buzdugan, M. Circular economy aspects regarding LED lighting retrofit—From case studies to vision. Sustainability 2018, 10, 3674. [Google Scholar] [CrossRef]
- Bonomolo, M.; Beccali, M.; Lo Brano, V.; Zizzo, G. A set of indices to assess the real performance of daylight-linked control systems. Energy Build 2017, 149, 235–245. [Google Scholar] [CrossRef]
- Doulos, L.; Tsangrassoulis, A.; Topalis, F. Multi-criteria decision analysis to select the optimum position and proper field of view of a photosensor. Energy Convers. Manag. 2014, 86, 1069–1077. [Google Scholar] [CrossRef]
- Topalis, F.V.; Doulos, L.T. Ambient Light Sensor Integration. In Handbook of Advanced Lighting Technology; Springer: Cham, Switzerland, 2017; pp. 607–634. [Google Scholar] [CrossRef]
- Mistrick, R.; Casey, C.; Chen, L.; Subramaniam, S. Computer modeling of daylight-integrated photocontrol of electric lighting systems. Buildings 2015, 5, 449–466. [Google Scholar] [CrossRef]
- Doulos, L.; Tsangrassoulis, A.; Topalis, F. The role of spectral response of photosensors in daylight responsive systems. Energy Build. 2008, 40, 588–599. [Google Scholar] [CrossRef]
- Bertin, K.; Canale, L.; Ben Abdellah, O.; Méquignon, M.-A.; Zissis, G. Life cycle assessment of lighting systems and light loss factor: A case study for indoor workplaces in France. Electronics 2019, 8, 1278. [Google Scholar] [CrossRef]
- Doulos, L.; Tsangrassoulis, A.; Topalis, F. Quantifying energy savings in daylight responsive systems: The role of dimming electronic ballasts. Energy Build. 2008, 40, 36–50. [Google Scholar] [CrossRef]
- Madias, E.N.; Doulos, L.T.; Kontaxis, P.A.; Topalis, F.V. Multicriteria decision aid analysis for the optimum performance of an ambient light sensor: Methodology and case study. Oper. Res. Int. J. 2020. [Google Scholar] [CrossRef]
- Doulos, L.T.; Kontadakis, A.; Madias, E.N.; Sinou, M.; Tsangrassoulis, A. Minimizing energy consumption for artificial lighting in a typical classroom of a Hellenic public school aiming for near zero energy building using LED DC luminaires and daylight harvesting systems. Energy Build. 2019, 194, 201–217. [Google Scholar] [CrossRef]
- Mistrick, R.G.; Thongtipaya, J. Analysis of daylight photocell placement and view in a small office. J. Illum. Eng. Soc. 1997, 26, 150–160. [Google Scholar] [CrossRef]
- Choi, A.S.; Mistrick, R.G. Analysis of daylight responsive dimming system performance. Building Environ. 1999, 34, 231–243. [Google Scholar] [CrossRef]
- Mistrick, R.; Chen, C.; Bierman, A.; Felts, D. A comparison of photosensor-controlled electronic dimming systems in a small office. J. Illum. Eng. Soc. 2000, 29, 66–80. [Google Scholar] [CrossRef]
- Choi, A.S.; Sung, M.K. Development of a daylight responsive dimming system and preliminary evaluation of system performance. Build. Environ. 2000, 35, 663–676. [Google Scholar] [CrossRef]
- Ranasinghe, S.; Mistrick, R. A study of photosensor configuration and performance in a daylighted classroom space. J. Illum. Eng. Soc. 2003, 32, 3–20. [Google Scholar] [CrossRef]
- Mistrick, R.; Sarkar, A. A study of daylight-responsive photosensor control in five daylighted classrooms. Leukos 2005, 3, 51–74. [Google Scholar] [CrossRef]
- Hadjri, K.; Crozier, C. Post-occupancy evaluation: Purpose, benefits and barriers. Facilities 2009, 27, 21–33. [Google Scholar] [CrossRef]
- Nawawi, A.; Khalil, Ν. Post-occupancy evaluation correlated with building occupants’ satisfaction: An approach to performance evaluation of government and public buildings. J. Build. 2008, 4, 59–69. [Google Scholar] [CrossRef]
- Preiser, W.F.E. Post-occupancy evaluation: How to make buildings work better. Facilities 1995, 13, 19–28. [Google Scholar] [CrossRef]
- Li, P.; Froese, T.M.; Brager, G. Post-occupancy evaluation: State-of-the art analysis and state-of-the-practice review. Build. Environ. 2018. [Google Scholar] [CrossRef]
- Zimmerman, A.; Martin, M. Post-occupancy evaluation: Benefits and barriers. Build. Res. Inf. 2001, 29, 168–174. [Google Scholar] [CrossRef]
- Leaman, A.; Bordass, B. Assessing building performance in use 4: The Probe occupant surveys and their implications. Build. Res. Inf. 2001, 29, 129–143. [Google Scholar] [CrossRef]
- Mustafa, F.A. Performance assessment of buildings via post-occupancy evaluation: A case study of the building of the architecture and software engineering departments in Salahaddin University-Erbil, Iraq. Front. Archit. Res. 2017, 6, 412–429. [Google Scholar] [CrossRef]
- Vischer, J. Towards a user-centred theory of the built environment. J. Build. Res. Inf. 2008, 36. [Google Scholar] [CrossRef]
- Thomas, L. Evaluating design strategies, performance and occupant satisfaction: A low carbon office refurbishment. Build. Res. Inf. 2010, 38. [Google Scholar] [CrossRef]
- Agha-Hossein, M.M.; El-Jouzi, S.; Elmualim, A.A.; Ellis, J.; Williams, M. Post-occupancy studies of an office environment: Energy performance and occupants’ satisfaction. Build. Environ. 2013, 69, 121–130. [Google Scholar] [CrossRef]
- Ponterosso, P.; Gaterell, M.; Williams, J. Post occupancy evaluation and internal environmental monitoring of the new BREEAM “Excellent” Land Rover/Ben Ainslie Racing team headquarters offices. Build. Environ. 2018. [Google Scholar] [CrossRef]
- Veitch, J.A.; Charles, K.E.; Farley, K.M.J.; Newsham, G.R. A model of satisfaction with open-plan office conditions: COPE field findings. J. Environ. Psychol. 2007, 27, 177–189. [Google Scholar] [CrossRef]
- Choi, J.H.; Loftness, V.; Aziz, A. Post-occupancy evaluation of 20 office buildings as basis for future IEQ standards and guidelines. Energy Build. 2011, 46, 167–175. [Google Scholar] [CrossRef]
- Kim, J.; de Dear, R. Nonlinear relationships between individual IEQ factors and overall workspace satisfaction. Build Environ. 2012, 49, 33–40. [Google Scholar] [CrossRef]
- Filippín, C.; Larsen, S.F.; Marek, L. Experimental monitoring and post-occupancy evaluation of a non-domestic solar building in the central region of Argentina. Energy Build. 2015, 92, 267–281. [Google Scholar] [CrossRef]
- Park, J.; Loftness, V.; Aziz, A. Post-Occupancy evaluation and IEQ measurements from 64 office buildings: Critical factors and thresholds for user satisfaction on thermal quality. Buildings 2018, 8, 156. [Google Scholar] [CrossRef]
- Candido, C.; Chakraborty, P.; Tjondronegoro, D. The Rise of office design in high-performance, open-plan environments. Buildings 2019, 9, 100. [Google Scholar] [CrossRef]
- Göçer, Ö.; Candido, C.; Thomas, L.; Göçer, K. Differences in occupants’ satisfaction and perceived productivity in high- and low-performance offices. Buildings 2019, 9, 199. [Google Scholar] [CrossRef]
- Pastore, L.; Andersen, M. Building energy certification versus user satisfaction with the indoor environment: Findings from a multi-site post-occupancy evaluation (POE) in Switzerland. Build. Environ. 2019, 150, 60–74. [Google Scholar] [CrossRef]
- Chastas, P.; Theodosiou, T.; Kontoleon, K.J.; Bikas, D. The Effect of embodied impact on the cost-optimal levels of nearly zero energy buildings: A case study of a residential building in Thessaloniki, Greece. Energies 2017, 10, 740. [Google Scholar] [CrossRef]
- Touloupaki, E.; Theodosiou, T. Optimization of external envelope insulation thickness: A parametric study. Energies 2017, 10, 270. [Google Scholar] [CrossRef]
- Balaras, C.A.; Droutsa, K.G.; Dascalaki, E.G.; Kontoyiannidis, S.; Moro, A.; Bazzan, E. Urban sustainability audits and ratings of the built environment. Energies 2019, 12, 4243. [Google Scholar] [CrossRef]
- Droutsa, K.G.; Balaras, C.A.; Lykoudis, S.; Kontoyiannidis, S.; Dascalaki, E.G.; Argiriou, A.A. Baselines for energy use and carbon emission intensities in hellenic nonresidential buildings. Energies 2020, 13, 2100. [Google Scholar] [CrossRef]
- Cholewa, T.; Balaras, C.A.; Nižetić, S.; Siuta-Olcha, A. On calculated and actual energy savings from thermal building renovations–Long term field evaluation of multifamily buildings. Energy and Buildings. 2020, 223, 110145. [Google Scholar] [CrossRef]
- Cholewa, T.; Siuta-Olcha, A.; Balaras, C.A. Actual energy savings from the use of thermostatic radiator valves in residential buildings—Long term field evaluation. Energy Build. 2017, 151, 487–493. [Google Scholar] [CrossRef]
- Pallis, P.; Gkonis, N.; Varvagiannis, E.; Braimakis, K.; Karellas, S.; Katsaros, M.; Vourliotis, P. Cost effectiveness assessment and beyond: A study on energy efficiency interventions in Greek residential building stock. Energy Build. 2019, 182, 1–18. [Google Scholar] [CrossRef]
- Forouli, A.; Gkonis, N.; Nikas, A.; Siskos, E.; Doukas, H.; Tourkolias, C. Energy efficiency promotion in Greece in light of risk: Evaluating policies as portfolio assets. Energy 2019, 170, 818–831. [Google Scholar] [CrossRef]
- Doukas, H.; Nikas, A. Decision support models in climate policy. Eur. J. Oper. Res. 2020, 280, 1–24. [Google Scholar] [CrossRef]
- European Committee for Standardization. European Norm 15193-1: Energy Performance of Buildings—Energy Requirements for Lighting—Part 1: Specifications, Module M9; European Committee for Standardization: Brussels, Belgium, 2017. [Google Scholar]
- European Committee for Standardization. European Norm 12464-1: Light and Lighting—Lighting of Work Places Part 1: Indoor Work Places; European Committee for Standardization: Brussels, Belgium, 2011. [Google Scholar]
- Norusis, M. SPSS 13.0 Statistical Procedures Companion; Prentice Hall Publications: Upper Saddle River, NJ, USA, 2004. [Google Scholar]
- Dodge, Y. The Concise Encyclopedia of Statistics; Springer Science & Business Media: New York, NY, USA, 2008. [Google Scholar]
- Shier, R. Statistics: 2.3 the Mann-Whitney U Test; Mathematics Learning Support Centre: Loughborough University Leicestershire, UK, 2004. [Google Scholar]
- Ministry of Environment and Energy of Greece. Greek Energy efficiency Regulation of Buildings; Greek Government: Athens, Greece, 2017.
- European Committee for Standardization. prEuropean Norm 12464-1: Light and Lighting—Lighting of Work Places Part 1: Indoor Work Places; European Committee for Standardization: Brussels, Belgium, 2019. [Google Scholar]
- Doulos, L.; Panagiotopoulou, E.K.; Taliantzis, S.; Edirneli, S.; Mehmet, A.; Fotiadis, I.; Gkika, M.; Konstantinidis, A.; Perente, I.; Dardabounis, D.; et al. Lighting needs of patients that underwent pseudophakic presbyopic corrections. A theoretical approach. In Proceedings of the 34th International Congress of the Hellenic Society of Intraocular Implant and Refractive Surgery, Athens, Greece, 7–10 July 2020. [Google Scholar]
- European Committee for Standardization. Technical Report 15193-2: Energy Performance of Buildings—Energy Requirements for Lighting—Part 2: Explanation and Justification of EN 15193-1, Module M9; European Committee for Standardization: Brussels, Belgium, 2017. [Google Scholar]
- What is the European Lighting Expert. Available online: https://europeanlightingexpert.org/en/what-is-the-ele/ (accessed on 30 June 2020).


© 2020 by the authors. Licensee MDPI, Basel, Switzerland. This article is an open access article distributed under the terms and conditions of the Creative Commons Attribution (CC BY) license (http://creativecommons.org/licenses/by/4.0/).