Data-Driven Regionalization of Decarbonized Energy Systems for Reflecting Their Changing Topologies in Planning and Optimization

 , ,
, , 
Abstract
:
1. Introduction
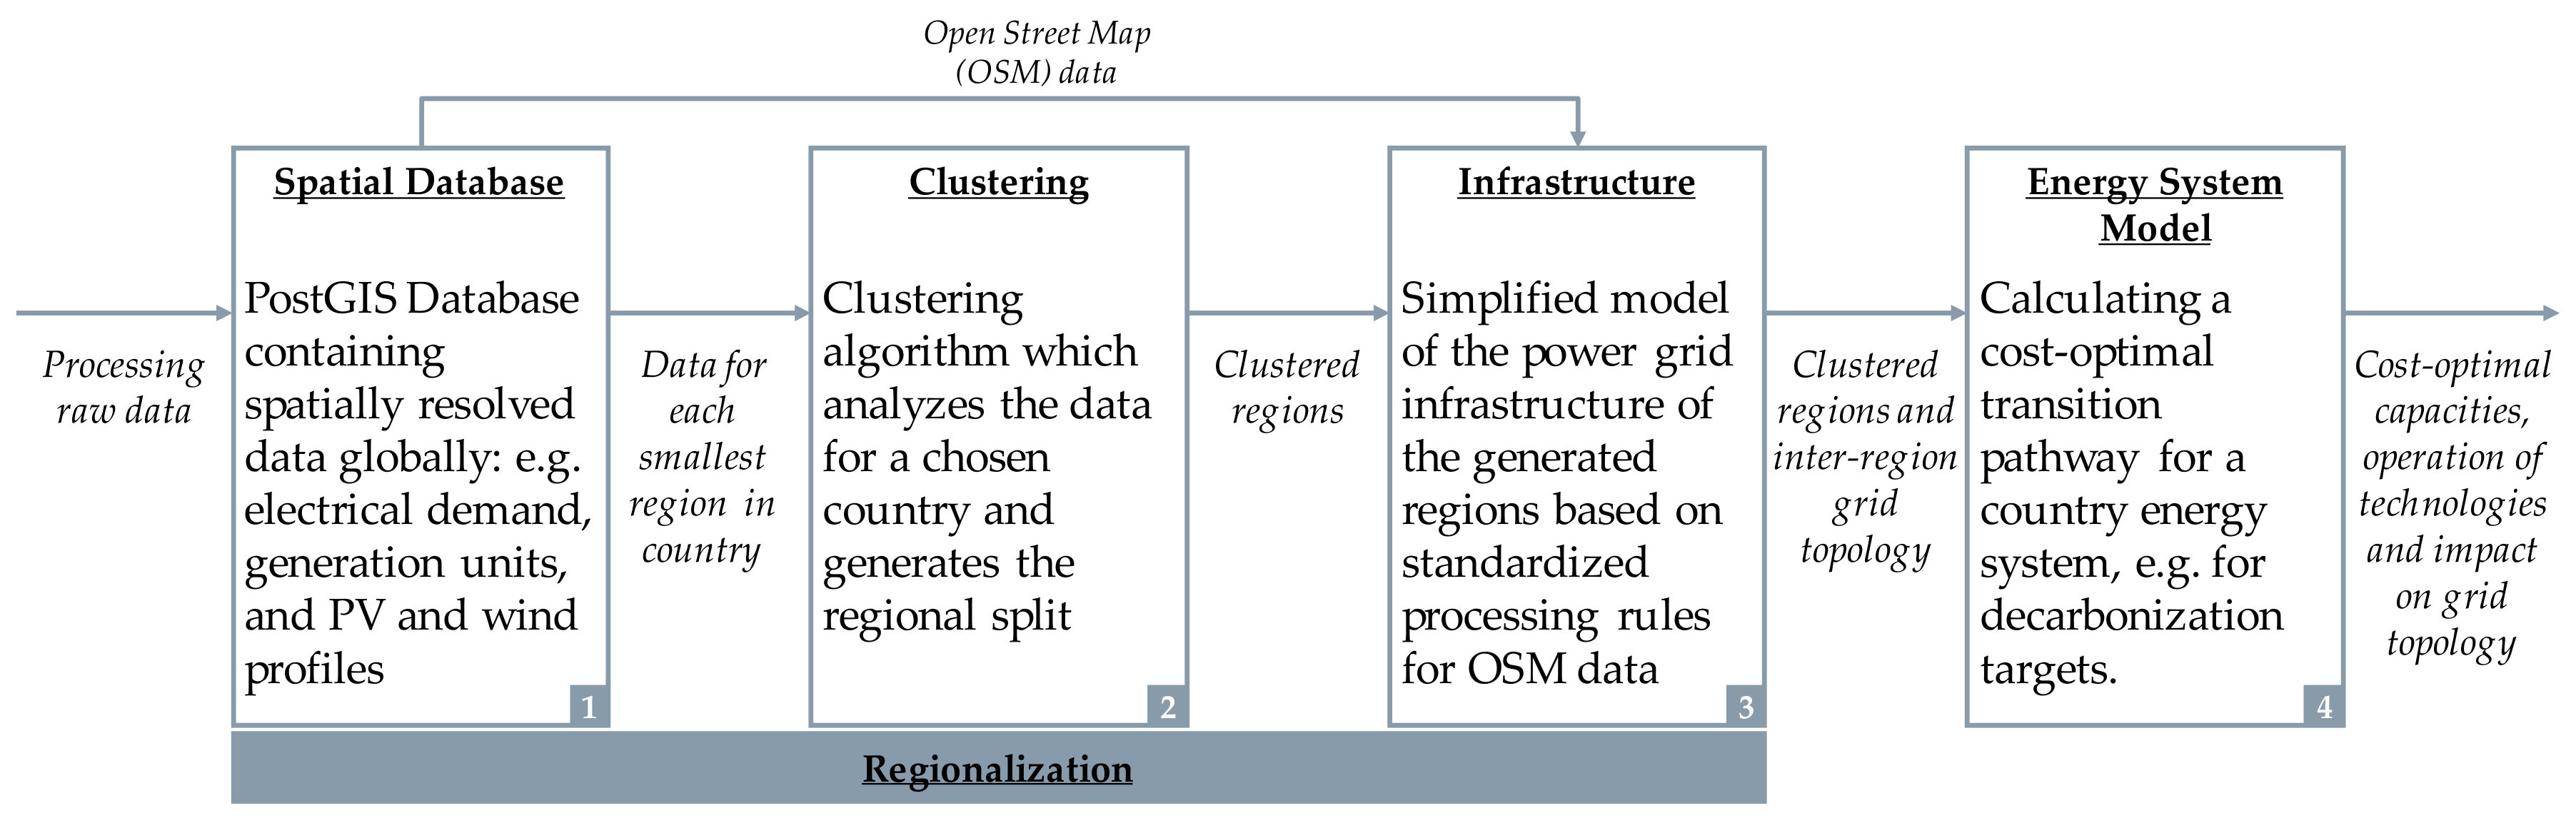
2. Methods
2.1. Spatial Database
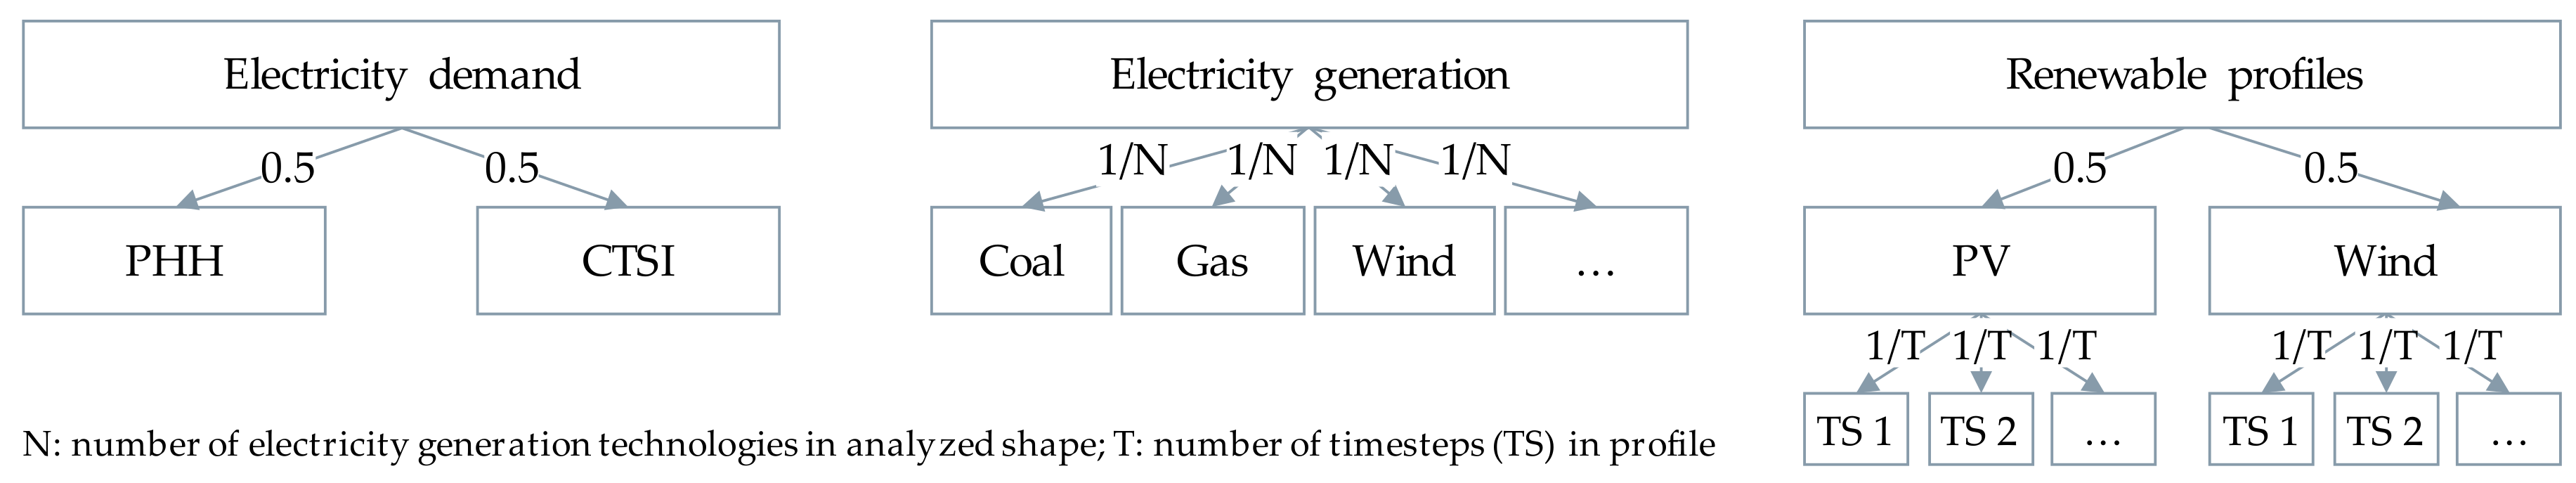
- Since there is no spatial layer of global electricity demand available, this database is built up in a joint project with “Forschungsstelle für Energiewirtschaft e.V.” [14]. In general, the demand data are separated into two categories: private household demand (PHH) and commercial, trade, public services, and industry (CTSI) demand. The household demand is calculated by intersecting the overall household demand of a country [15] with the global human settlement layer which describes the distribution of population globally [16]. To ensure a consistency of population data and provide a flexible scale up for future data, the distribution of population is scaled for every country by global population data [17]. The CTSI demand is calculated by using industrial, commercial, and retail areas stated in OpenStreetMap (OSM) to execute the spatial disaggregation [18].
- Concerning the distribution of generation technologies, a publicly available database is used [19]. This database contains precise data for conventional power plants with an accuracy of 80–100% [20] depending on the technology. For solar and wind generation, the accuracy is lower (wind: 49%, solar 21%) as it is difficult to gather the data for all units in every country [20]. Since the share of these technologies in the current electricity generation mix is still comparably low in most countries, this inaccuracy is acceptable to describe the spatial distribution of generation technologies in the current system. However, the importance of both technologies in future decarbonized energy systems is still considered in the clustering by their profiles, which are represented by the third data category.
- Similar to the demand, hourly time series of normalized wind and photovoltaic generation are determined by processing publicly available raw data. For this purpose, we combine weather data from the MERRA-2 database [21,22,23,24,25] with the technical characteristics of the two technologies [26]. For wind generation, the final profile is determined by using the best turbine type for each region based on the region’s full load hours weighted by the current distribution of wind turbines from OSM data [18]. The photovoltaic profiles, which are calculated for all possible orientations (compass direction in 22.5° steps) and module angles (0°–45°), are finally included by using the best of all possible combinations of direction and angle leading to the highest full load hours. All profiles are generated based on the weather year 2012, adjusted to a non-leap year by neglecting February 29.
2.2. Clustering
2.2.1. Clustering Algorithm
- Regions on the smallest administrative level consisting of two or more parts which are not spatially contiguous are split to guarantee spatially contiguous clusters.
- The islands of a country must be handled since naturally they are not connected to the other regions of a country. This is especially important for countries characterized by multiple big islands such as Indonesia, Japan, or New Zealand or countries with islands located far away from the “mainland” energy system such as France or Portugal:
- ○
- Those islands with an area less than a defined percentage (default 1%) of the total country’s area are merged to the closest region if the distance is less than 50 km.
- ○
- Further distanced islands as well as those without any demand or generation capacities are dropped since they are considered to have low importance for the country’s energy system.
2.2.2. Validation of Clustering
2.3. Infrastructure
2.4. Energy System Model
3. Results
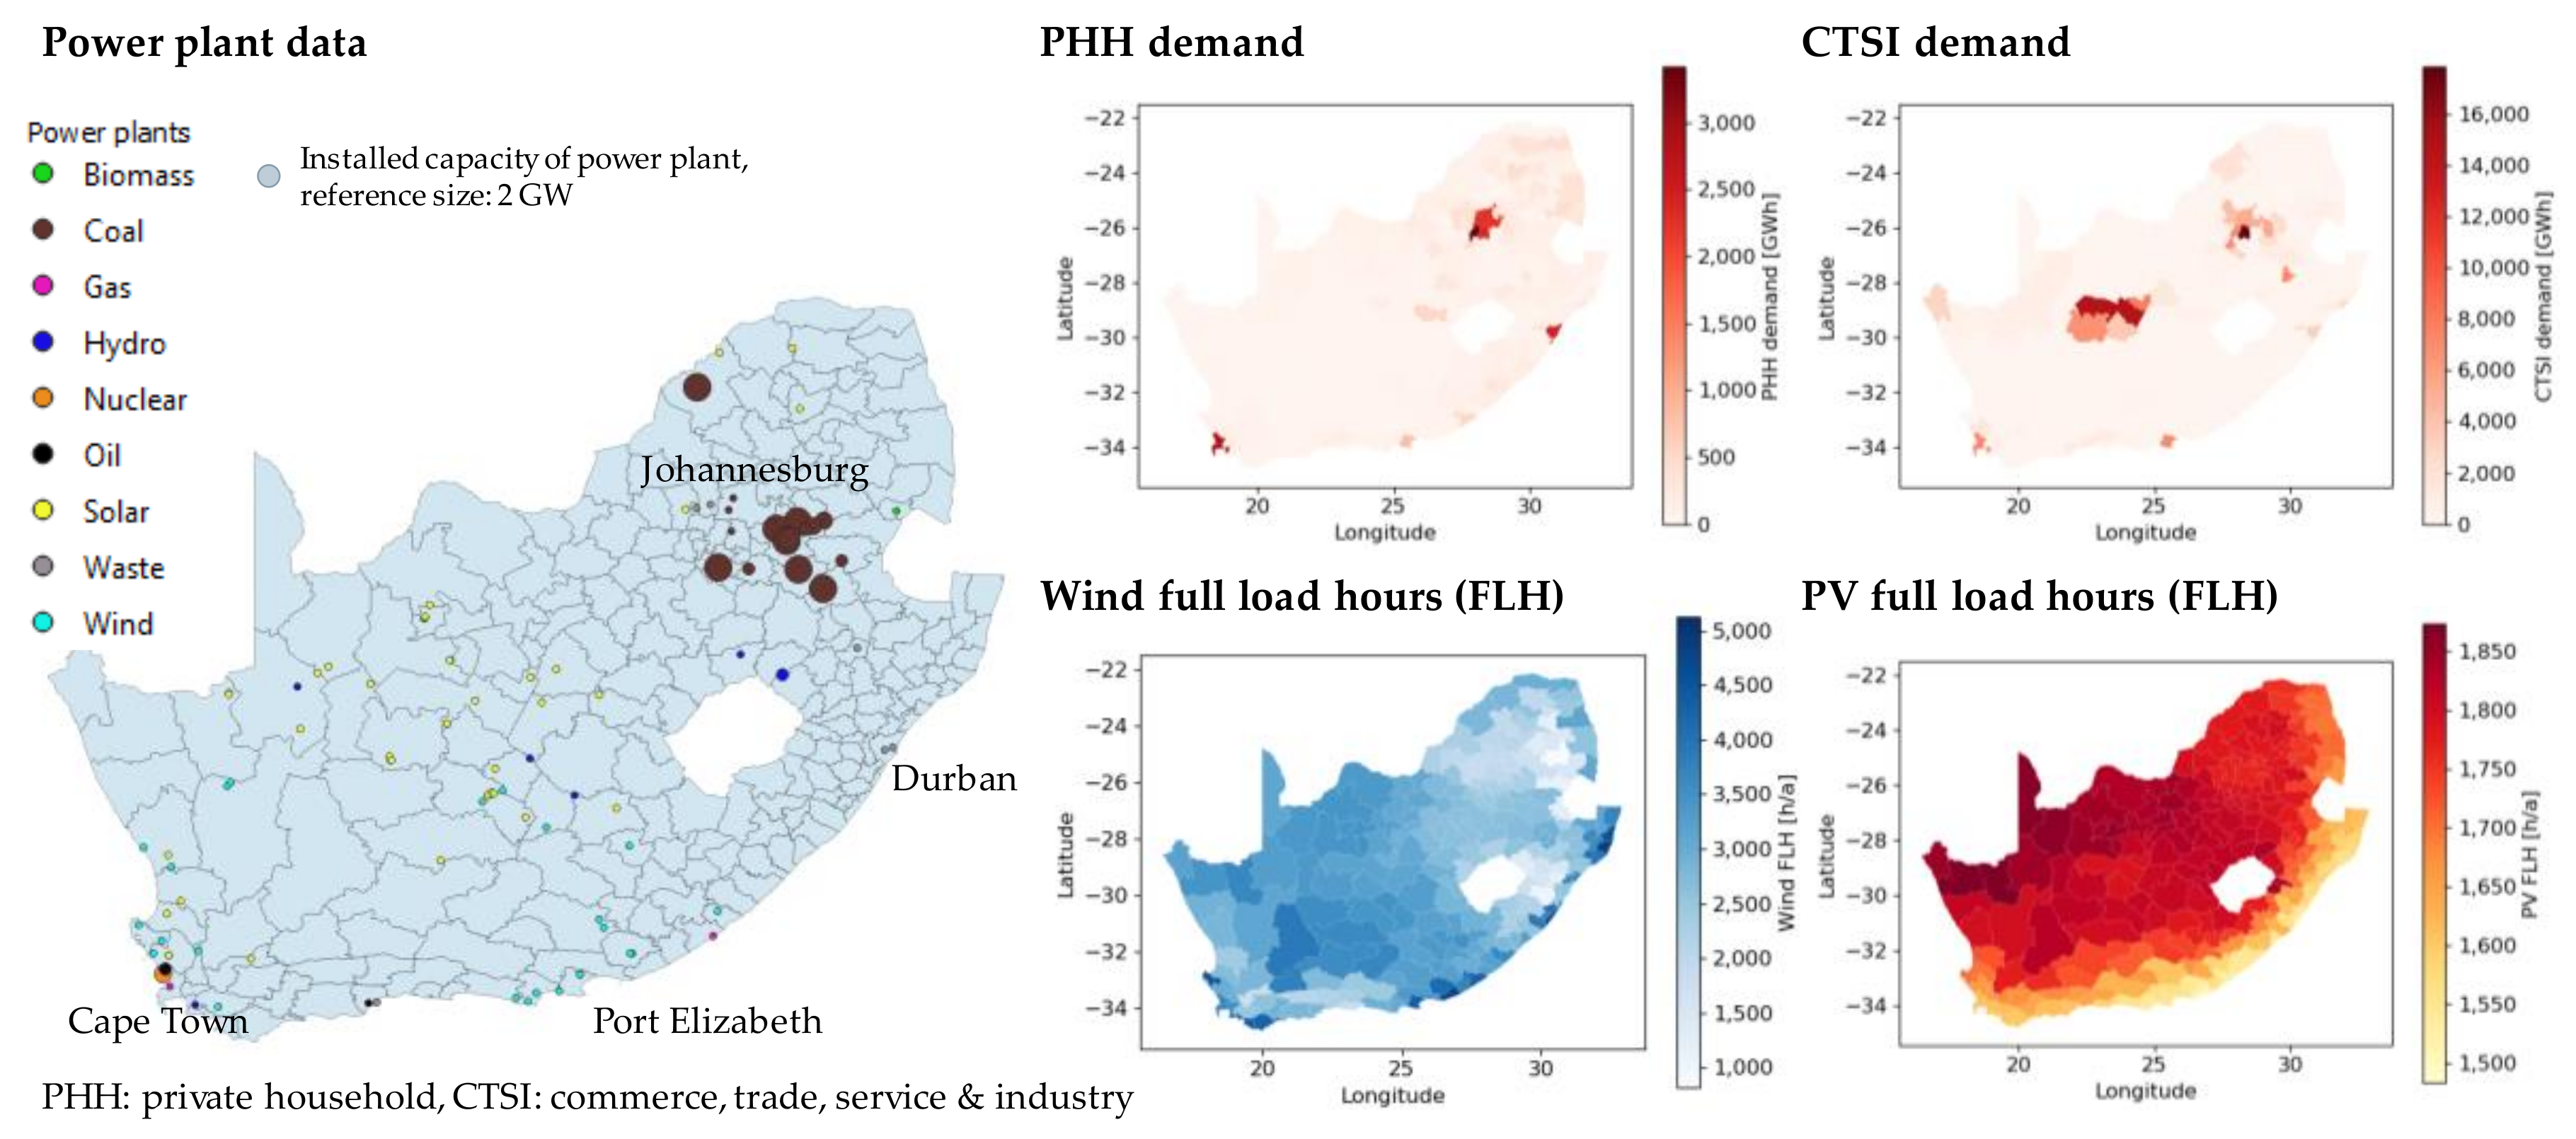
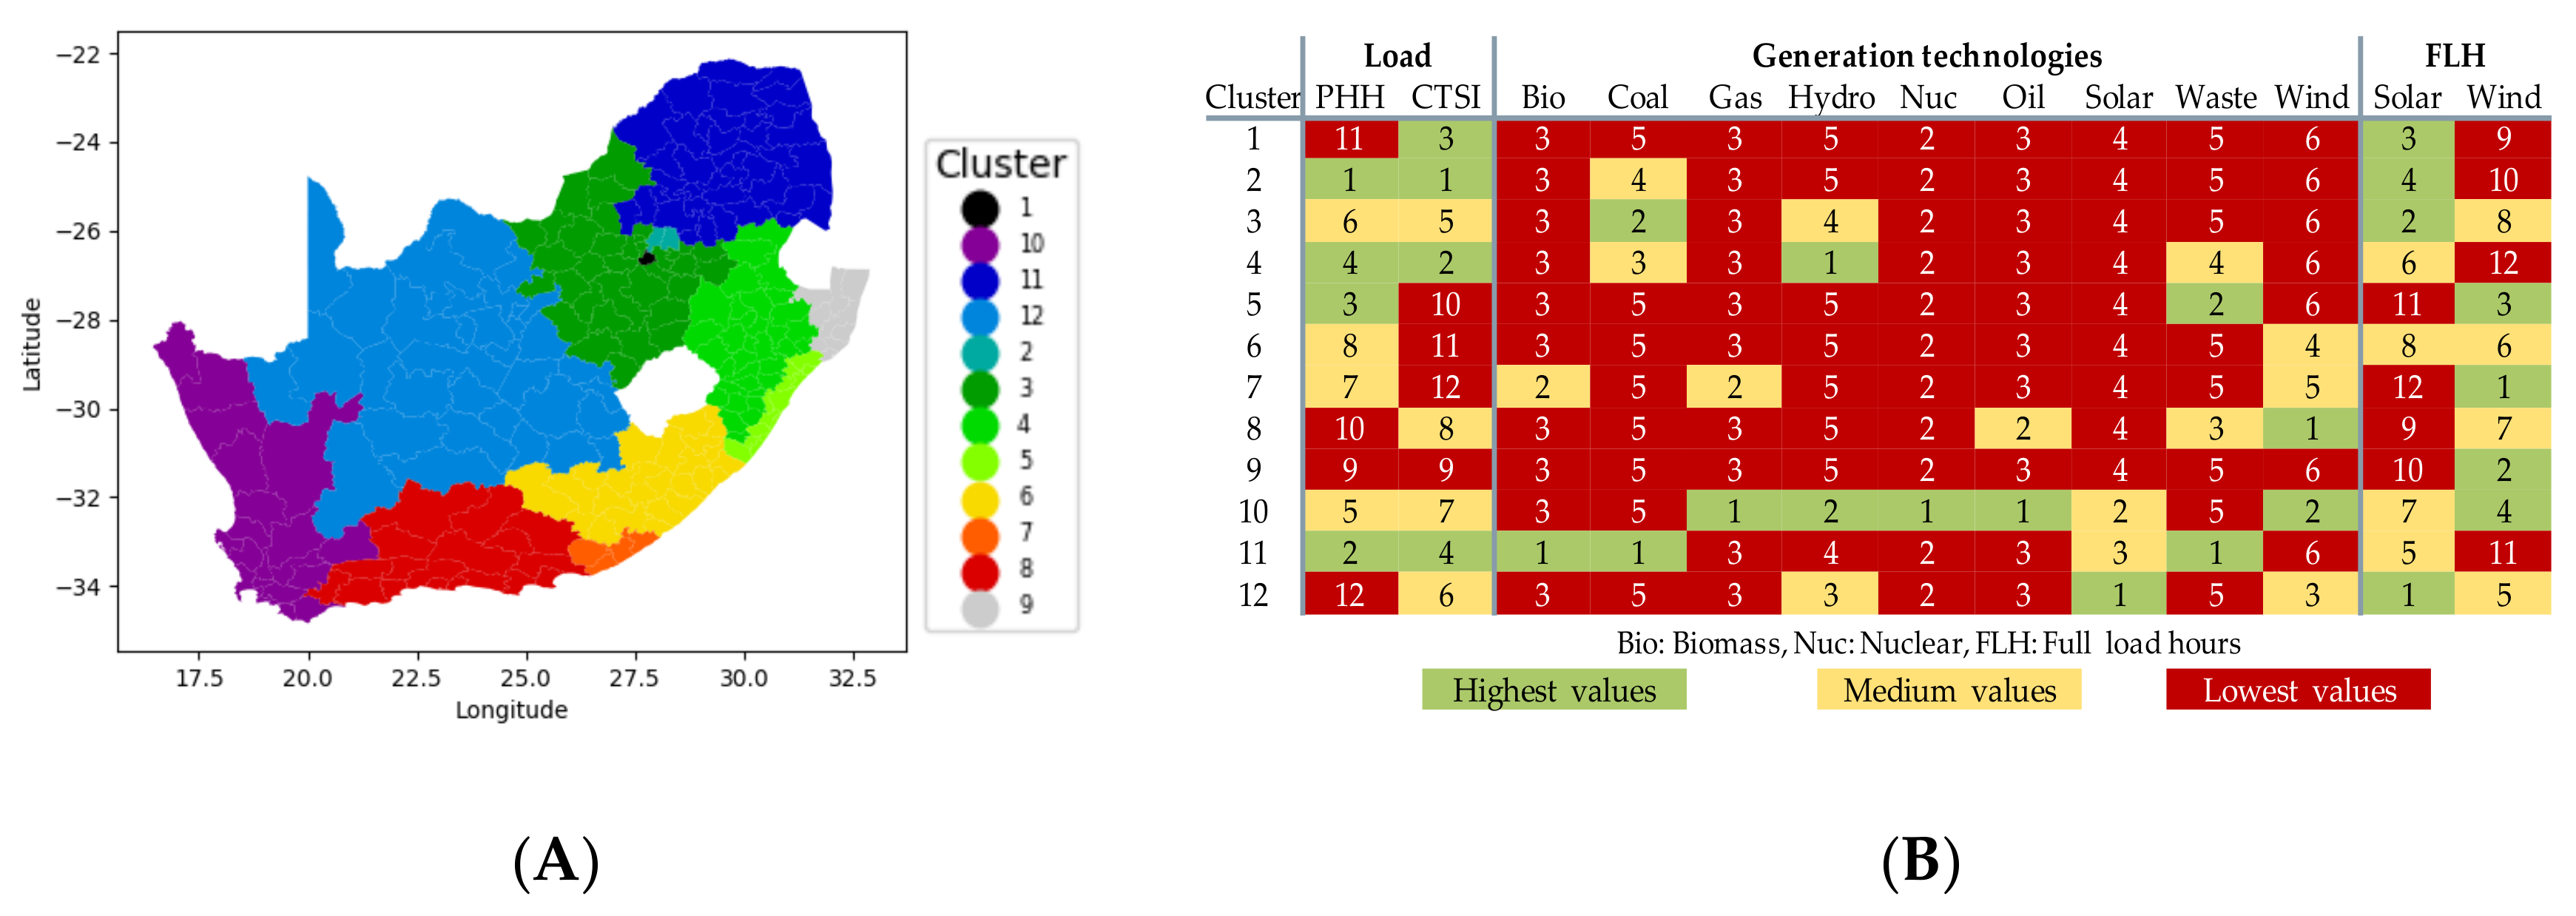
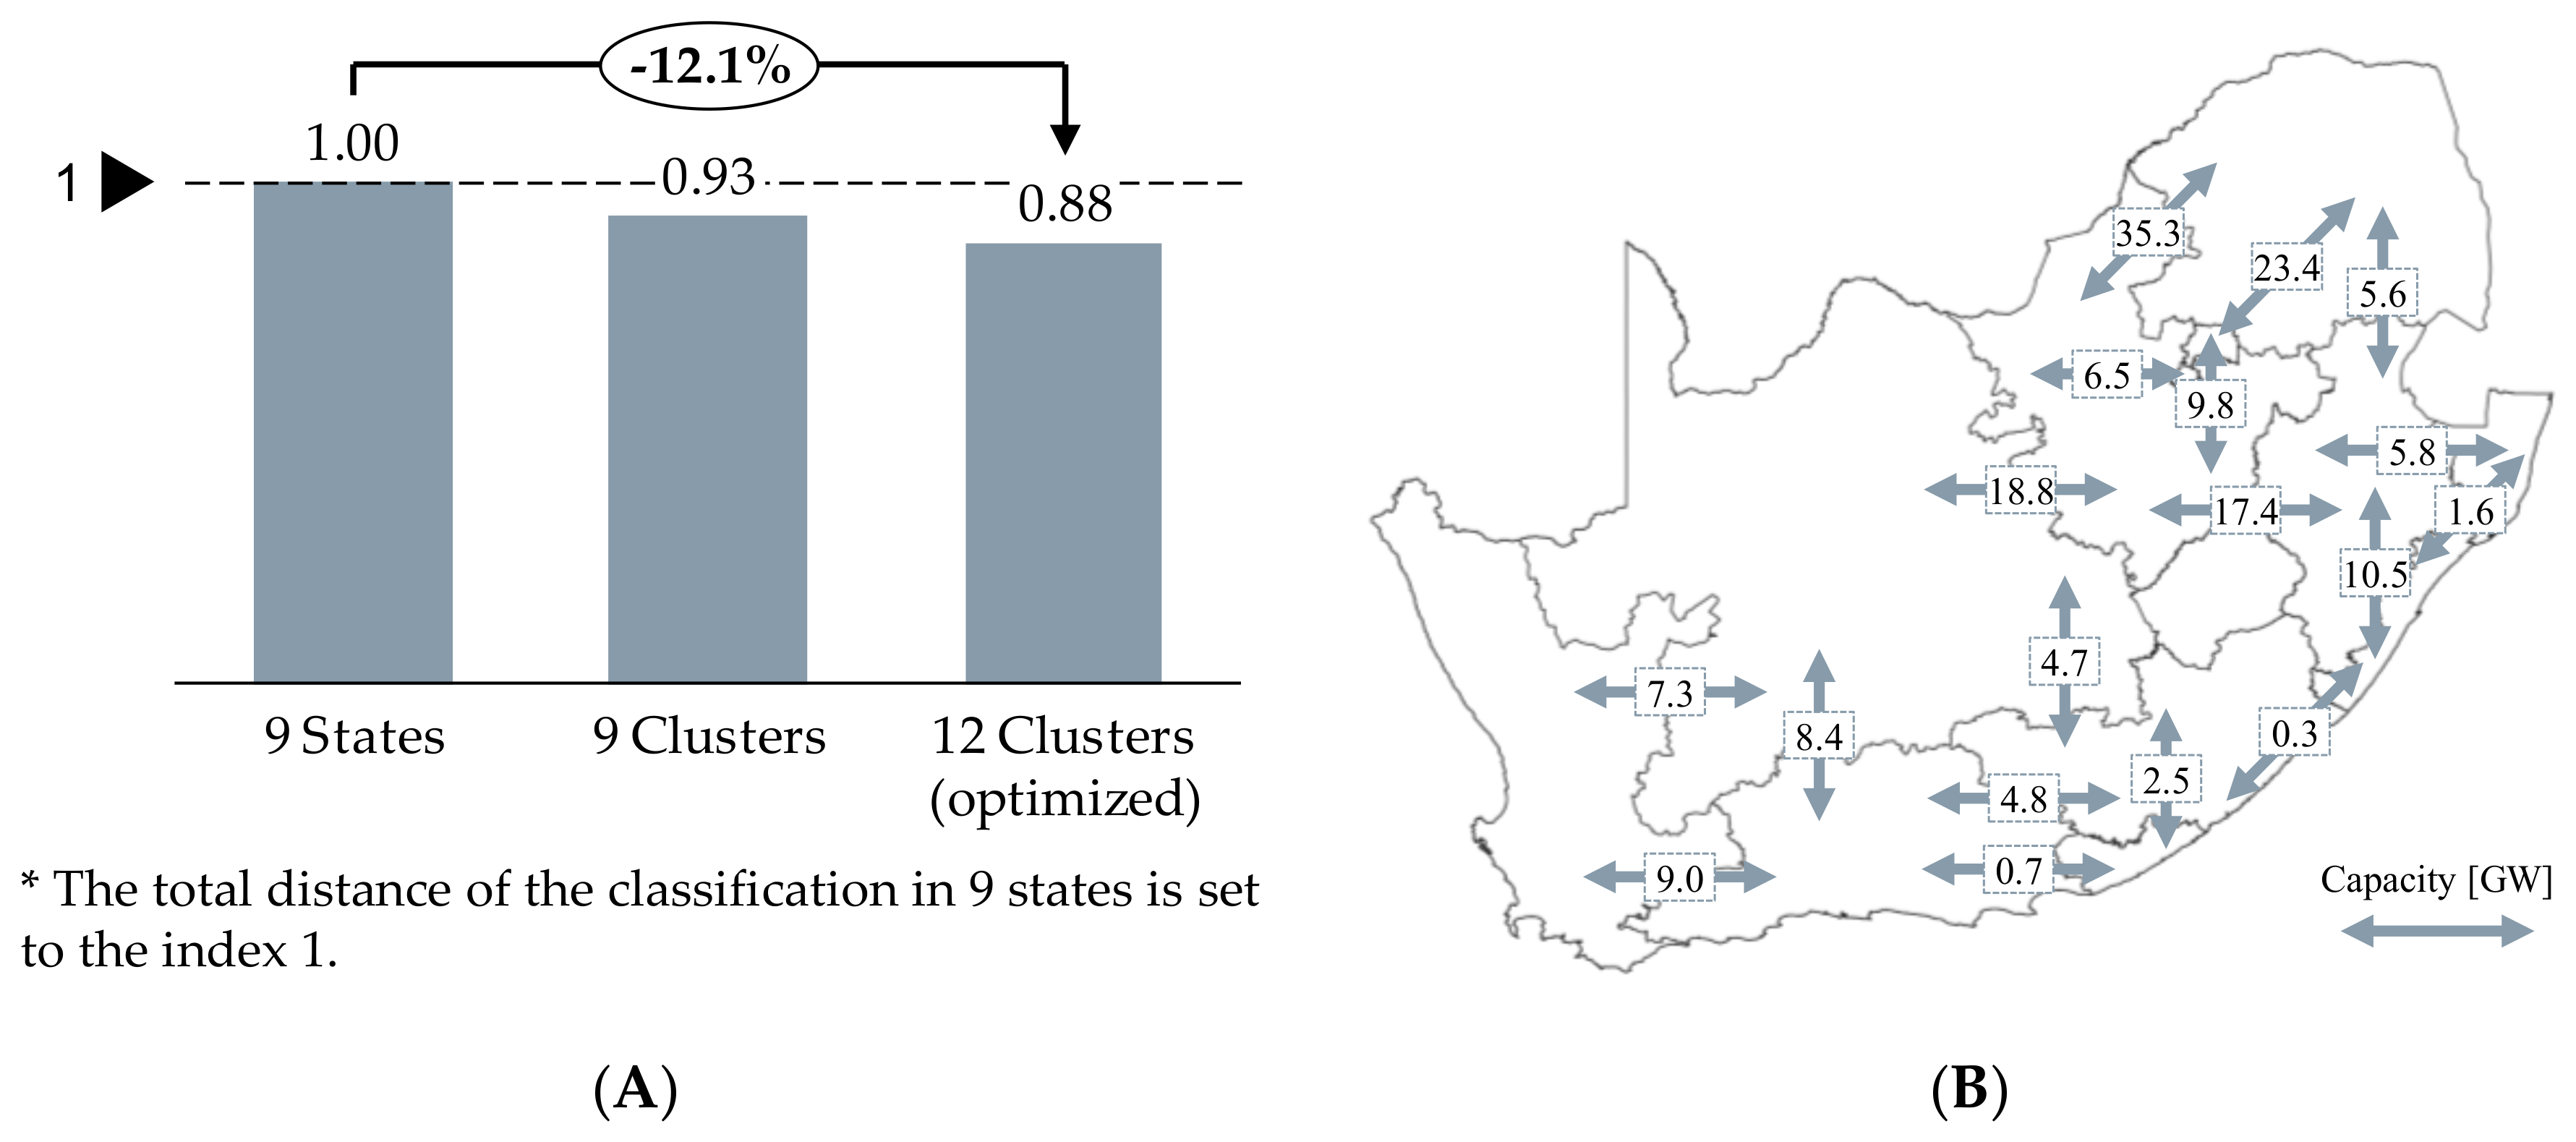
3.1. Regionalization of South Africa
3.2. A Regionalized Decarbonization Pathway for South Africa
4. Discussion and Conclusions
Author Contributions
Funding
Acknowledgments
Conflicts of Interest
References
- Lopion, P.; Markewitz, P.; Robinius, M.; Stolten, D. A Review of Current Challenges and Trends in Energy Systems Modeling. Renew. Sustain. Energy Rev. 2018, 96, 156–166. [Google Scholar] [CrossRef]
- Pfenninger, S.; Hawkes, A.; Keirstead, J. Energy Systems Modeling for Twenty-First Century Energy Challenges. Renew. Sustain. Energy Rev. 2014, 33, 74–86. [Google Scholar] [CrossRef]
- Siala, K.; Mahfouz, M.Y. Impact of the Choice of Regions on Energy System Models. Energy Strategy Rev. 2019, 25, 75–85. [Google Scholar] [CrossRef]
- Short, W. Regions in Energy Market Models; NREL/TP-620-40506; National Renewable Energy Laboratory (NREL): Golden, CO, USA, 2007. [CrossRef] [Green Version]
- GADM. GADM Maps and Data. Available online: https://gadm.org/index.html (accessed on 11 July 2019).
- Oyewo, A.S.; Aghahosseini, A.; Ram, M.; Lohrmann, A.; Breyer, C. Pathway towards Achieving 100% Renewable Electricity by 2050 for South Africa. Solar Energy 2019, 191, 549–565. [Google Scholar] [CrossRef]
- IEA. Global CO2 Emissions in 2019; International Energy Agency: Paris, France, 2020.
- Cao, K.-K.; von Krbek, K.; Wetzel, M.; Cebulla, F.; Schreck, S. Classification and Evaluation of Concepts for Improving the Performance of Applied Energy System Optimization Models. Energies 2019, 12, 4656. [Google Scholar] [CrossRef] [Green Version]
- Biberacher, M. Modelling and Optimisation of Future Energy Systems Using Spatial and Temporal Methods. Ph.D. Thesis, University of Augsburg, Augsburg, Germany, 2004. [Google Scholar]
- Weinand, J.M.; McKenna, R.; Fichtner, W. Developing a Municipality Typology for Modelling Decentralised Energy Systems. Util. Policy 2019, 57, 75–96. [Google Scholar] [CrossRef] [Green Version]
- Cao, K.-K.; Metzdorf, J.; Birbalta, S. Incorporating Power Transmission Bottlenecks into Aggregated Energy System Models. Sustainability 2018, 10, 1916. [Google Scholar] [CrossRef] [Green Version]
- Anderski, T. E-HIGHWAY 2050—Modular Development Plan of the Pan-European Transmission System 2050: European Cluster Model of the Pan-European Transmission Grid; Deliverable public funded project; e-Highway 2050 Consortium: La Defense, France, 2015. [Google Scholar]
- Hörsch, J.; Brown, T. The Role of Spatial Scale in Joint Optimisations of Generation and Transmission for European Highly Renewable Scenarios. In Proceedings of the 2017 14th International Conference on the European Energy Market (EEM), Dresden, Germany, 6–9 June 2017; IEEE: Piscataway, NJ, USA, 2017. [Google Scholar]
- FfE—Forschungsstelle für Energiewirtschaft, e.V. Siemens Global Energy Demand-Modellierung des Weltweiten Stromverbrauchs. Available online: https://www.ffe.de/themen-und-methoden/erzeugung-und-markt/911-siemens-global-energy-demand-modellierung-des-weltweiten-stromverbrauchs (accessed on 11 June 2020).
- IEA. Electricity Information 2018; International Energy Agency: Paris, France, 2018.
- European Commission, Joint Research Centre; Columbia University, Center for International Earth Science Information Network. GHS-POP R2015A—GHS Population Grid, Derived from GPW4, Multitemporal (1975, 1990, 2000, 2015); Dataset; European Commission, Joint Research Centre (JRC): Ispra, Italy, 2015. [Google Scholar]
- The World Bank. World Development Indicators. Available online: https://databank.worldbank.org/source/world-development-indicators (accessed on 1 November 2018).
- OpenStreetMap (OSM)—OpenStreetMap and Contributors. OpenStreetMap Foundation: Cambridge, 2004 (edited 2019). Available online: http://www.openstreetmap.org/ (accessed on 7 February 2019).
- World Resources Institute. Global Power Plant Database. Available online: http://datasets.wri.org/dataset/globalpowerplantdatabase (accessed on 1 July 2019).
- Byers, L.; Friedrich, J.; Hennig, R.; Kressig, A.; Li, X.; Mccormick, C.; Valeri, L.M. A Global Database of Power Plants; World Resources Institute: Washington, DC, USA, 2019; p. 18. [Google Scholar]
- MERRA-2 tavg1_2d_slv_Nx: 2d, 1-Hourly, Time-Averaged, Single-Level, Assimilation, Single-Level Diagnostics V5.12.4; Global Modeling and Assimilation Office (GMAO), Goddard Earth Sciences Data and Information Services Center (GES DISC): Greenbelt, MD, USA, 2015.
- MERRA-2 tavg1_2d_lnd_Nx: 2d, 1-Hourly, Time-Averaged, Single-Level, Assimilation, Land Surface Diagnostics V5.12.4; Global Modeling and Assimilation Office (GMAO), Goddard Earth Sciences Data and Information Services Center (GES DISC): Greenbelt, MD, USA, 2015.
- MERRA-2 tavg1_2d_flx_Nx: 2d, 1-Hourly, Time-Averaged, Single-Level, Assimilation, Surface Flux Diagnostics V5.12.4; Global Modeling and Assimilation Office (GMAO), Goddard Earth Sciences Data and Information Services Center (GES DISC): Greenbelt, MD, USA, 2015.
- MERRA-2 tavg1_2d_rad_Nx: 2d, 1-Hourly, Time-Averaged, Single-Level, Assimilation, Radiation Diagnostics V5.12.4; Global Modeling and Assimilation Office (GMAO), Goddard Earth Sciences Data and Information Services Center (GES DISC): Greenbelt, MD, USA, 2015.
- MERRA-2 const_2d_asm_Nx: 2d, constants V5.12.4; Global Modeling and Assimilation Office (GMAO), Goddard Earth Sciences Data and Information Services Center (GES DISC): Greenbelt, MD, USA, 2015.
- Albrecht, P. Development of a Tool for the Analysis of the Global Solar and Wind Energy Potential. Master’s Thesis, Technische Universität München, München, Germany, 2016. [Google Scholar]
- Jain, A.K. Data Clustering: 50 Years beyond K-Means. Pattern Recognit. Lett. 2010, 31, 651–666. [Google Scholar] [CrossRef]
- Duque, J.C.; Anselin, L.; Rey, S.J. The Max-P-Regions Problem. J. Reg. Sci. 2012, 52, 397–419. [Google Scholar] [CrossRef]
- Han, J.; Kamber, M.; Tung, A.K. Spatial Clustering Methods in Data Mining. Geographic Data Mining and Knowledge Discovery. 2001, pp. 188–217. Available online: https://ci.nii.ac.jp/naid/10030364406/ (accessed on 23 March 2020).
- Scikit-Learn. Available online: https://scikit-learn.org/stable/modules/clustering.html#hierarchical-clustering (accessed on 28 December 2019).
- Thorndike, R.L. Who Belongs in the Family? Psychometrika 1953, 18, 267–276. [Google Scholar] [CrossRef]
- Guo, D. Greedy Optimization for Contiguity-Constrained Hierarchical Clustering. In 2009 IEEE International Conference on Data Mining Workshops; IEEE: Miami, FL, USA, 2009; pp. 591–596. [Google Scholar] [CrossRef]
- Aggarwal, C.C.; Hinneburg, A.; Keim, D.A. On the Surprising Behavior of Distance Metrics in High Dimensional Space. In Database Theory—ICDT 2001; Van den Bussche, J., Vianu, V., Goos, G., Hartmanis, J., van Leeuwen, J., Eds.; Lecture Notes in Computer Science Series; Springer: Berlin/Heidelberg, Germany, 2001; Volume 1973, pp. 420–434. [Google Scholar] [CrossRef] [Green Version]
- Boehmke, B.; Greenwell, B.M. Hands-on Machine Learning with R; CRC Press: Boca Raton, FL, USA, 2020. [Google Scholar]
- Heitkoetter, W.; Medjroubi, W.; Vogt, T.; Agert, C. Comparison of Open Source Power Grid Models—Combining a Mathematical, Visual and Electrical Analysis in an Open Source Tool. Energies 2019, 12, 4728. [Google Scholar] [CrossRef] [Green Version]
- Oeding, D.; Oswald, B.R. Elektrische Kraftwerke Und Netze; Springer: Berlin/Heidelberg, Germany, 2016. [Google Scholar]
- Puffer, R. Optimierungspotenziale Bei Freileitungen—Was Ist Machbar? 2012. Available online: https://docplayer.org/33699070-Optimierungspotenziale-bei-freileitungen-was-ist-machbar.html (accessed on 11 June 2020).
- Bundesnetzagentur. Bedarfsermittlung 2017–2030 Bestätigung Netzentwicklungsplan Strom; Bundesnetzagentur: Bonn, Germany, 2017.
- Paredes Pineda, S.N. Development and Evaluation of a Simplified Approach for Modeling Country Energy Systems. Master’s Thesis, Technische Universität München, München, Germany, 2019. [Google Scholar]
- Müller, C.; Hoffrichter, A.; Wyrwoll, L.; Schmitt, C.; Trageser, M.; Kulms, T.; Beulertz, D.; Metzger, M.; Duckheim, M.; Huber, M.; et al. Modeling Framework for Planning and Operation of Multi-Modal Energy Systems in the Case of Germany. Appl. Energy 2019, 250, 1132–1146. [Google Scholar] [CrossRef]
- U.S. Energy Information Administration. International Energy Statistics. Available online: https://www.eia.gov/beta/international/data/browser (accessed on 1 November 2018).
- IRENA. REthinking Energy 2017: Accelerating the Global Energy Transformation; International Renewable Energy Agency (IRENA): Abu Dhabi, UAE, 2017.
- Schaber, K.; Steinke, F.; Hamacher, T. Transmission Grid Extensions for the Integration of Variable Renewable Energies in Europe: Who Benefits Where? Energy Policy 2012, 43, 123–135. [Google Scholar] [CrossRef] [Green Version]
- Bundesnetzagentur. Kostenschaetzungen NEP 2030. Available online: https://www.netzentwicklungsplan.de/de/kostenschaetzungen-zu-kapitel-42-2 (accessed on 3 June 2020).
- GET Invest. Available online: https://www.get-invest.eu/market-information/south-africa/energy-sector/ (accessed on 30 March 2020).
- IEA. Electricity Generation by Source, South Africa 1990–2017. Available online: https://www.iea.org/countries/south-africa (accessed on 3 June 2020).
- Dunnett, S.; Sorichetta, A.; Taylor, G.; Eigenbrod, F. Harmonised Global Datasets of Wind and Solar Farm Locations and Power. Sci. Data 2020, 7, 130. [Google Scholar] [CrossRef] [PubMed]


| Technology | 2015 | 2030 | 2045 |
|---|---|---|---|
| Coal | 91% | 57% | 8% |
| Nuclear | 6% | 3% | 1% |
| Gas | 0% | 3% | 6% |
| Wind Onshore | 1% | 31% | 70% |
| Photovoltaic | 1% | 4% | 11% |
| Other 1 | 1% | 2% | 3% |
© 2020 by the authors. Licensee MDPI, Basel, Switzerland. This article is an open access article distributed under the terms and conditions of the Creative Commons Attribution (CC BY) license (http://creativecommons.org/licenses/by/4.0/).
Share and Cite
Kueppers, M.; Perau, C.; Franken, M.; Heger, H.J.; Huber, M.; Metzger, M.; Niessen, S. Data-Driven Regionalization of Decarbonized Energy Systems for Reflecting Their Changing Topologies in Planning and Optimization. Energies 2020, 13, 4076. https://doi.org/10.3390/en13164076
Kueppers M, Perau C, Franken M, Heger HJ, Huber M, Metzger M, Niessen S. Data-Driven Regionalization of Decarbonized Energy Systems for Reflecting Their Changing Topologies in Planning and Optimization. Energies. 2020; 13(16):4076. https://doi.org/10.3390/en13164076
Chicago/Turabian StyleKueppers, Martin, Christian Perau, Marco Franken, Hans Joerg Heger, Matthias Huber, Michael Metzger, and Stefan Niessen. 2020. "Data-Driven Regionalization of Decarbonized Energy Systems for Reflecting Their Changing Topologies in Planning and Optimization" Energies 13, no. 16: 4076. https://doi.org/10.3390/en13164076