Article

Characterization of Chemically and Physically Activated Carbons from Lignocellulosic Ethanol Lignin-Rich Stream via Hydrothermal Carbonization and Slow Pyrolysis Pretreatment

1
Renewable Energy Consortium for Research and Demonstration—RE-CORD, Viale Kennedy 182, Scarperia, 50038 Florence, Italy
2
Department of Chemistry, University of Florence, Via della Lastruccia 3-13, Sesto Fiorentino, 50019 Florence, Italy
3
“Galileo Ferraris” Energy Department, Polytechnic of Turin, Corso Duca Degli Abruzzi 24, I-10129 Torino, Italy
*
Author to whom correspondence should be addressed.
Energies 2020, 13(16), 4101; https://doi.org/10.3390/en13164101
Submission received: 24 June 2020 / Revised: 27 July 2020 / Accepted: 5 August 2020 / Published: 7 August 2020
(This article belongs to the Collection Feature Papers in Bio-Energy)

Abstract

:
The aim of the present work is to investigate the possibility of producing activated carbons from the residual lignin stream of lignocellulosic ethanol biorefineries, as this represents an optimal opportunity to exploit a residual and renewable material in the perspective of sustainable bioeconomy, increasing biorefinery incomes by producing value-added bioproducts in conjunction with biofuels. Activated carbons (ACs) were produced via chemical (KOH) and physical (CO2) activation. Char samples were obtained by slow pyrolysis (SP) and hydrothermal carbonization (HTC). Several HTC experiments were carried out by varying residence time (0.5–3 h) and reaction temperature (200–270 °C), in order to evaluate their influence on the product yield and on the morphological characteristics of the hydrochar (specific surface area, total pore volume and pore size distribution). ACs from hydrochars were compared with those obtained from pyrochar (via physical activation) and from the raw lignin-rich stream (via chemical activation). In both cases, by increasing the HTC temperature, the specific surface of the resulting activated carbons decreased from 630 to 77 m2 g−1 for physical activation and from 675 to 81 m2 g−1 for chemical activation, indicating that an increase in the severity of the hydrothermal pretreatment is deleterious for the activated carbons quality. In addition, the HTC aqueous samples were analyzed, with GC-MS and GC-FID. The results suggest that at low temperatures the reaction mechanisms are dominated by hydrolysis, instead when the temperature is increased to 270 °C, a more complex network of reactions takes place among which decarboxylation.

Graphical Abstract

1. Introduction

In order to face the challenges of climate change, our dependence from fossil fuels has to be heavily reduced: one of the most relevant sectors where this need to be urgently achieved is transports, which also represent the most difficult one to decarbonize [1]. Lignocellulosic ethanol production is a technological process where lignocellulosic biomass, such as wood or agricultural residues (e.g., straw), is converted into this biofuel, which has a well-established downstream infrastructure. However, as reported by Lynd [2], this technology showing slower growth than initially expected. This is partly because of overestimation of technological readiness, partly due to the global financial crisis and collapse of oil prices, and mostly because of a lack of adequate supporting policies. As a result many advanced biofuel startups have failed and those who survived have changed their focus from biofuels to biomass-derived value-added products. More than half of the actual global investment in biofuels and biochemicals is dedicated to the latter [2]. A comprehensive assessment of the policy-related reasons driving or hampering the industrial deployment of biorefining and advanced biofuels in Europe, following the new Directive on Renewable Energies (REDII), has been recently carried out by Chiaramonti and Goumas [3]. In a zero-waste biorefinery concept, all products derived from biomass should be exploited and the production of biofuels (low selling price) should follow that of biochemicals (high selling price).
The conversion of lignocellulosic biomass to fermentable sugars is a complex process, due to the highly structured chemical composition of woody biomass. Cellulose and hemicellulose have normally to be firstly separated, as different microorganisms are needed to efficiently ferment their respective sugars to ethanol [4]. Lignin is not fermentable and, consequently, a large amount of a wet lignin-rich stream (LRS) is produced, which in the current management is dried and co-burned for heat and power [5]. Lignin is the most abundant natural source of aromatics and its valorization offers unparalleled opportunity for the green chemistry and circular economy, especially when the feedstock is recovered as a residue from an industrial process. Finding a more profitable way to exploit this co-product is fundamental in order to improve the overall biorefinery efficiency and a possible alternative to energy production can be represented by activated carbons. The conventional activation process involves biomass carbonization through slow pyrolysis, but, due to the very high amount of the LRS water content, hydrothermal carbonization represents an interesting option, as carbonization occurs in liquid water and energy-intensive drying is avoided.
The activated carbon market is growing: the main application areas of activated carbons are air and water treatment and, due to the continuous increase of global population and environmental pollution, the need for clean air and clean water is becoming a relevant issue and governments across the globe are offering subsidies and issuing new stringent environmental regulations and directives for water as well as air purification. Considering also the rapid industrialization of emerging countries, such as the Asia Pacific region, the reasons behind the growth of the activated carbon market (over 3M$ in 2015) is easily explained [6]. Activated carbons are produced from lignocellulosic biomass (coconut shell, wood, etc.) and from coal, lignite and peat [6]. In order to decrease the dependence from fossil sources, the production of AC from LRS represents an optimal opportunity to exploit a residual and renewable material in the perspective of sustainable bioeconomy. AC are amorphous organic materials with high adsorption potential, industrially produced via two different processes: physical and chemical activation. In physical activation, an activating agent (steam, carbon dioxide, air or a combination thereof) gasify at elevated temperatures part of the carbon structure, creating porosities; in chemical activation, the feedstock is impregnated with a reagent (KOH, ZnCl2, H3PO4, K2CO3, etc.) and then it is heated in an inert atmosphere. In general, physical activation is carried out on a pre-carbonized material i.e., char (double-step activation), while, in the chemical process, carbonization occurs during activation [7].
Rodríguez Correa et al. [8] performed KOH chemical activation at 600 °C, 2 h and 1:4 char-KOH ratio of several kind of lignins after slow pyrolysis (600 °C, 2 h) and hydrothermal carbonization (220 °C, 1 h) pretreatment. The activated carbons obtained from the activation of pyrochar and hydrochar had a similar BET area. Sun et al. [9] activated corn straw lignin via a one-step activation with H3PO4 for 120 min and at an activation temperature from 300 to 600 °C. They found that the highest surface area and pore volume were obtained at 500 °C (820 m2 g−1 and 0.8 cm3 g−1, respectively). Slow pyrolysis of a commercial lignin powder was carried out at 600 °C for 2 h and the resulting char was physically activated with CO2 [10]. They obtained a specific area of nearly 394 m2 g−1 when activating at 700 °C for 1 h and, by performing a partial oxidation on the char prior to activation, they increased this value up to nearly 530 m2 g−1.
To the author’s knowledge, the reported experiences of lignin or lignin-rich biomass in HTC have been carried out on lignin from the pulp and paper industry or on high-purity model compounds [8,11,12,13], both structurally differing from LRS from lignocellulosic ethanol. Typically, lignin from pulp and paper has a higher degree of purity, generally greater than 90% [8,14], while that recovered from lignocellulosic ethanol still contains up to 50% of carbohydrates degradation products [14,15], making the hydrothermal conversion of this latter material remarkably different. On the contrary, slow pyrolysis have been applied to hydrolytic lignin from biochemical plants as a pretreatment for further physical activation. Catalytic slow pyrolysis of lignin was carried out in an air/steam-fluidized bed reactor and subsequently activated carbons were produced by steam activation [16]. The maximum surface area (769 m2 g−1) was obtained with a pyrolysis temperature of 780 °C and by activating at 780 °C for 30 min and with a steam/char ratio of 2.44. Hydrolytic lignin was carbonized in an electrically heated rotating reactor at 600 °C and then the resulting char was steam-activated at 800 °C for 120 min [17]. They obtained an activated carbon with specific surface of 865 m2 g−1, for a burn off value of 82%.
The aim of the present study is to investigate the thermochemical carbonization (pyrolysis and hydrothermal processing) of LRS followed by physical and chemical activation, evaluating hydrothermal carbonization (HTC) as a pretreatment in place of conventional slow pyrolysis (SP), and assess if its process conditions affect the AC morphological characteristics. In addition, an in-depth characterization of the HTC aqueous phase was also performed—to support with novel and original data—the development of carbon recovery/valorization processes from the aqueous stream originated during the hydrothermal conversion, so to fill the knowledge gap in the literature.

2. Materials and Methods
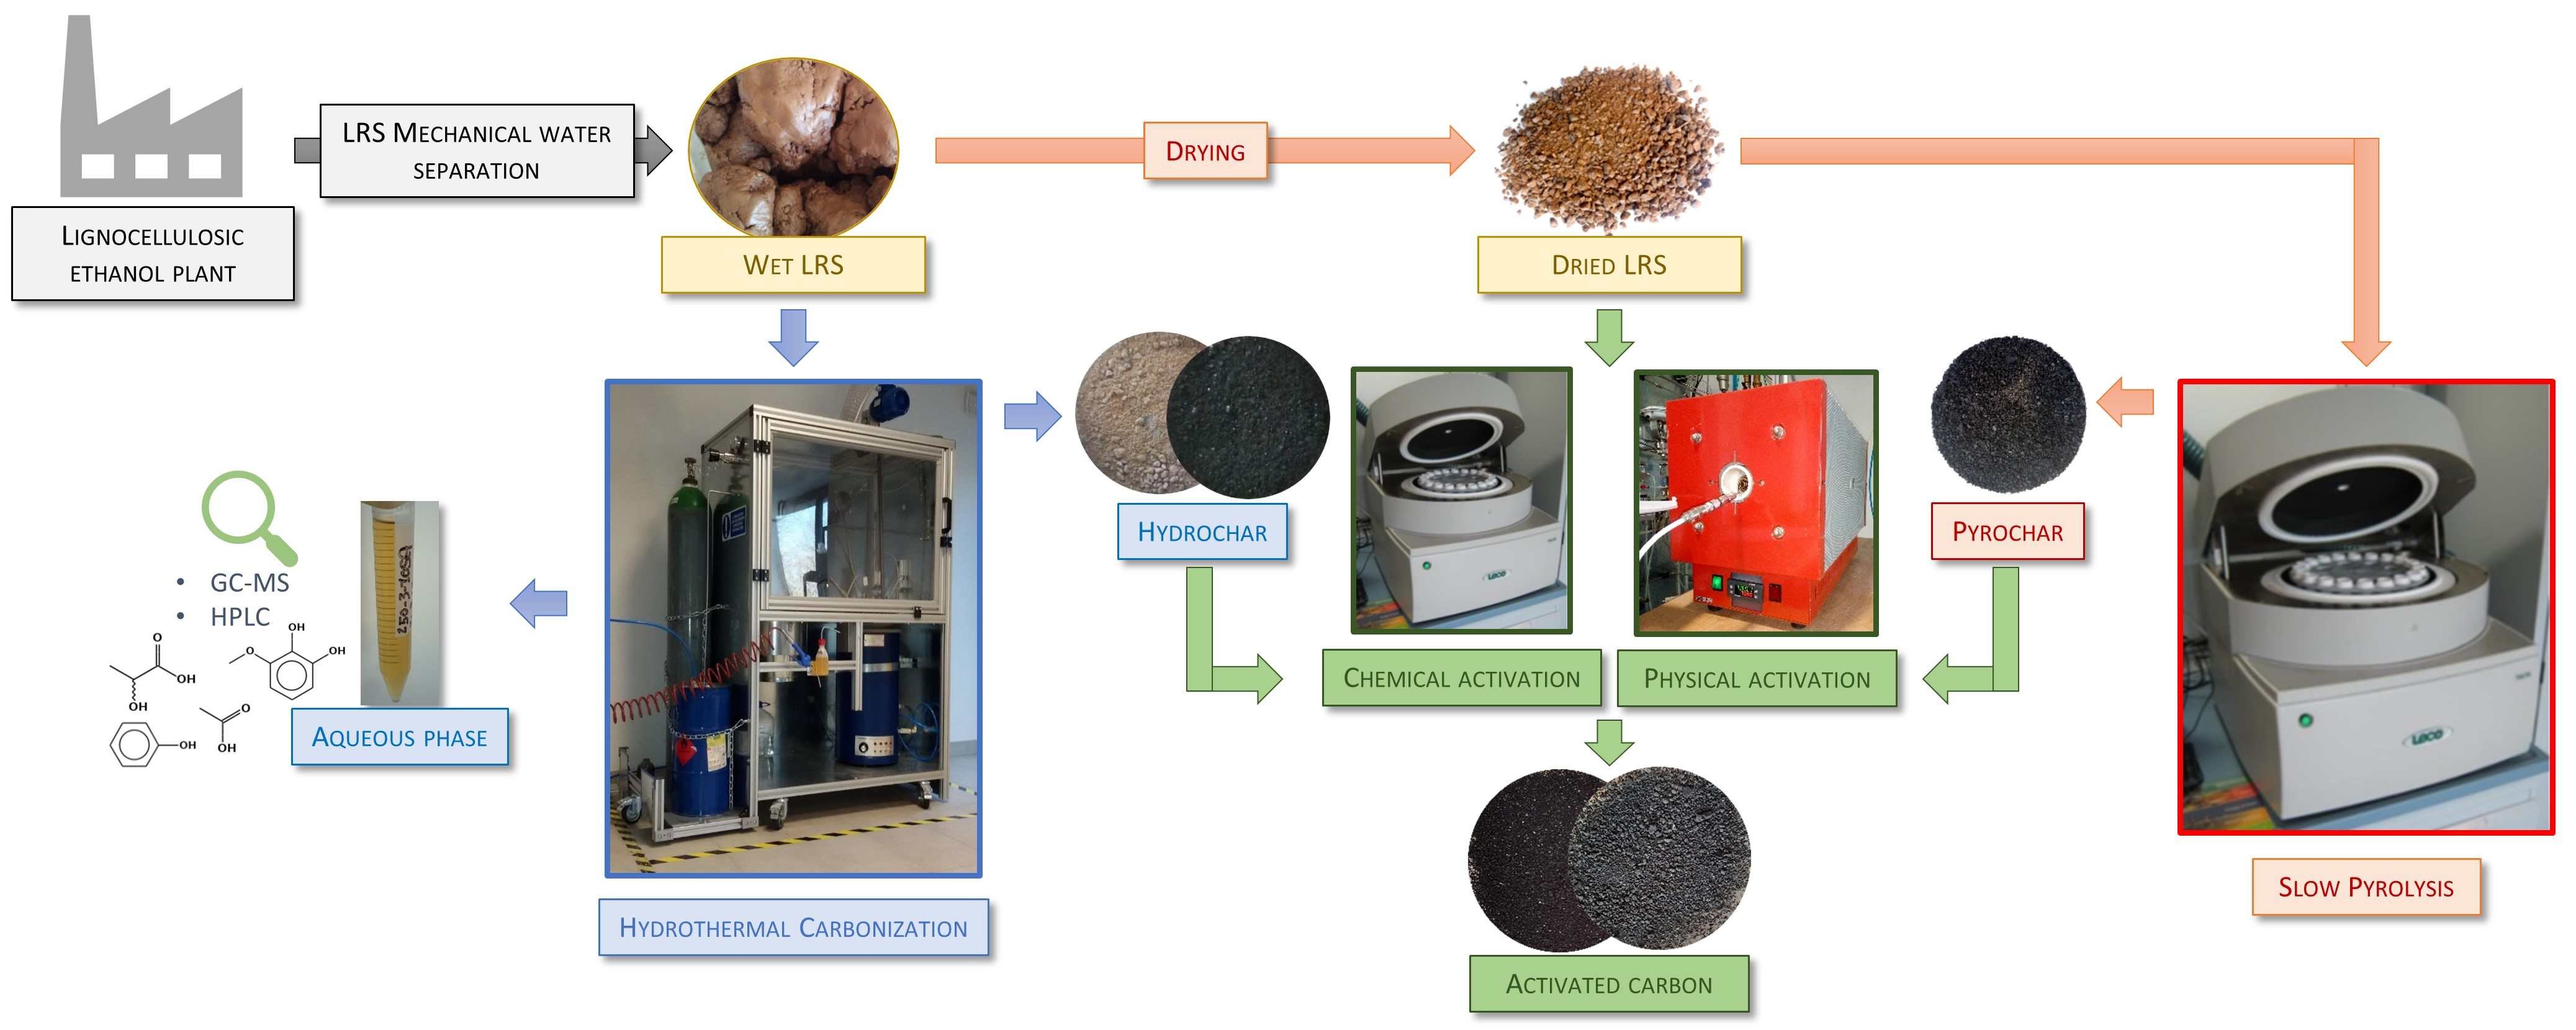
2.1. Feedstock

The lignin-rich stream was produced in an industrial-scale lignocellulosic ethanol demo plant located in Northern Italy [18], where poplar was used as raw material. A different batch of the same material was converted via hydrothermal liquefaction and its characterization is reported in Dell’Orco et al. [15]. The properties of the sample used in the present study are reported in the Results Section and are compared with those of a sulfur-free lignin from soda pulping [14]. The feedstock was received in an agglomerated wet powder form and in order to make the experiments more reproducible, the LRS was oven-dried for 48 h at 75 °C, ground and then sieved to 4 mm (Figure S1 in Supplementary Materials).

2.2. Experimental Equipment and Procedure

Prior to hydrochar activation, a series of physical and chemical activation experiments were carried out with the LRS not being hydrothermally pretreated, in order to determine the best activation condition for the hydrochars in terms of a trade-off between apparent surface area and activated carbon yield. This preliminary step was necessary to reduce the number of the HTC experiments, but it had been also useful in order to assess the suitability of the HTC process as a pretreatment for activated carbon production and compare its effect with slow pyrolysis pretreatment. A block diagram elucidating the experimental workflow is reported in Figure 1.

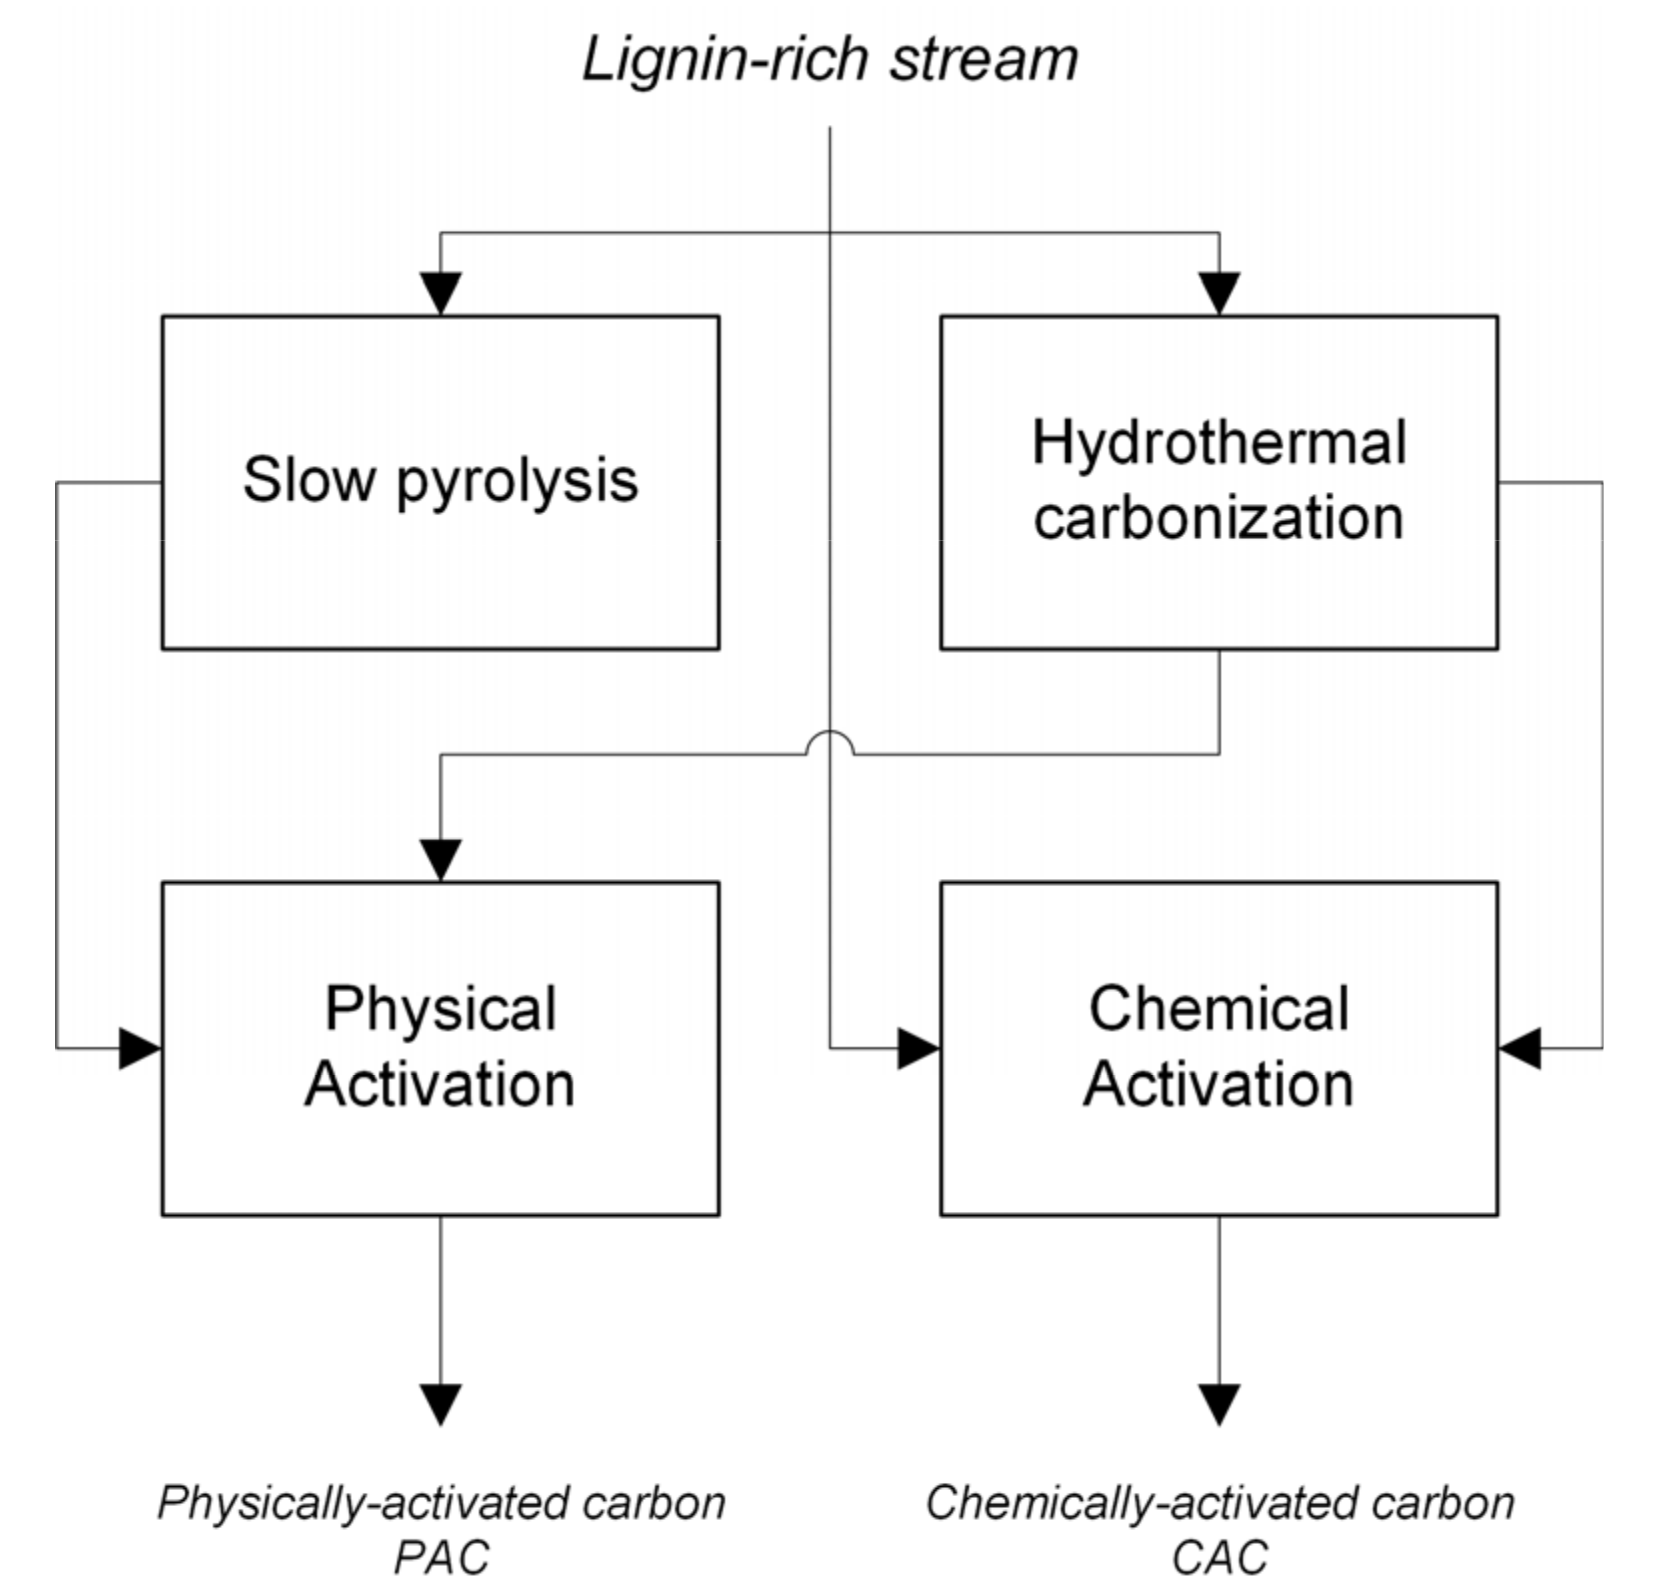
2.2.1. Hydrothermal Carbonization

Batch hydrothermal carbonization experiments were performed in a custom-made test bench, whose description was previously reported in [19,20]. The reactors adopted in the test bench were obtained by ¾” stainless steel tubes (27 mL inner volume) and are equipped with pressure and temperature sensors and a safety pressure-relief valve. Reaction temperature is reached by immersion of the reactor in a hot fluidized sand bath. The advantage of using a fluidized sand bath is that a fast and very high homogeneity of temperature can be achieved. In each experiment 7 g of dried and milled feedstock were dispersed in deionized water (0.055 μS cm−1) to obtain a 30% w/w dry biomass-to-water mass ratio. The reactor was pressurized with argon at 8 MPa in order to identify any possible leakage; three purging cycles with N2 (0.5 MPa) were then performed to assure an inert atmosphere in the freeboard of the reactor. The initial pressure set to 2 MPa using argon, the reactor was then inserted in the sand bath. When the inner temperature of the reactor arrived within 2 °C below the design reaction temperature, the residence time counting started and once it had elapsed, the reactor was cooled by water bath immersion. Solids (hydrochars) and liquids were separated by centrifuge (NF400 r, Nuve, Ankara, Turkey) at 4100 rpm for 15 min, while it was not possible to collect and recover the gas phase. Investigated temperatures and residence times were 200, 270 °C and 2, 4 h, respectively, at autogenous pressure. In order to obtain enough material for the following activation, experiments were replicated from 3 to 6 times. The average operational conditions of the LRS HTC experiments and a selected temperature-pressure diagram are reported in Table S1 and Figure S2, respectively.

2.2.2. Slow Pyrolysis

LRS pyrochar was obtained by batch slow pyrolysis (SP) carried out in a TGA 701 thermogravimetric analyzer (Leco, St Joseph, MI, USA) at 550 °C for 2 h, under a constant N2 flow (10 L min−1) at a heating rate of 5 °C min−1. The apparatus is equipped with 19 ceramic crucibles (18 mL each).

2.2.3. Physical Activation

Physical activation experiments were performed in a ceramic tubular furnace (Figure S3), with CO2 as activating agent. Gas flow was controlled by two mass flow controllers (MFC, Bronkhorst, Ruurlo, The Netherlands). A two-step activation process was performed: the feedstock was firstly carbonized by HTC or SP and then subjected to activation. The pyrochar was physically activated at 700 °C and 800 °C with the following procedure: a nitrogen flow (250 mL min−1) was maintained in the reactor (15.75 mm internal diameter) until activation temperature; gas was then switched to CO2 and temperature held for 2 h. The same procedure was used for hydrochar activation. The hydrochars used for physical activation were those produced at the four operating conditions (200 °C—2 h; 200 °C—4 h; 270 °C—2 h; 270 °C—4 h). Physical activation of hydrochars was carried out at a constant temperature of 700 °C, with an average heating rate between 3 and 4 °C min−1. The so-produced activated carbons were denoted as physically activated carbon, named PAC.

2.2.4. Chemical Activation

Chemical activation was performed in the same and previously described thermogravimetric analyzer under nitrogen flow. The feedstocks used for this activation were both the hydrochars and the LRS without the carbonization pretreatment (single-step activation). The selected activating agent was KOH as it was shown to be successfully adopted by other authors [8]; impregnation was carried out in a stirred aqueous solution, which was maintained at 60 °C for 6 h. The impregnated samples were then oven-dried overnight at 105 °C. As far as concerns the straight activation of LRS (i.e., without carbonization pretreatment), three activation temperatures and two KOH:LRS mass ratios (d.b.) were investigated: 600 °C, 700 °C and 800 °C and 1:1 and 2:1, respectively. Activation time at constant activation temperature was 1 h, nitrogen flow rate 10 L min−1 and heating rate 5 °C min−1. After the chemical activation, the samples were washed with HCl (1 M), in order to remove the KOH and other K-containing compounds, and then with ultrapure water until neutral pH. The best result in terms of apparent surface area and yield was obtained at 600 °C and mass ratio of 1:1; this condition was then chosen for the chemical activation of the hydrochars. The so-produced ACs were denoted as chemically activated carbon, named CAC. Table 1 summarizes the investigated experimental conditions.

2.3. Analytical Methods and Chemicals

The activation yield and the total yield were evaluated as:
A c t i v a t i o n   y i e l d = d r y   w e i g h t   o f   a c t i v a t e d   c a r b o n d r y   w e i g h t   o f   c h a r · 100
T o t a l   y i e l d = d r y   w e i g h t   o f   a c t i v a t e d   c a r b o n d r y   w e i g h t   o f   L R S · 100

2.3.1. Analysis of Solids

Before feedstock characterization, LRS was dried at 75 °C for 48 h (atmospheric pressure) and grounded in a knife mill (SM 300, Retsch, Haan, Germany) equipped with a sieve of 4 mm. Drying was carried out at low temperature to minimize the devolatilization of the material.
Moisture, ash and volatiles were determined by a Leco TGA 701 instrument in ceramic crucibles. Moisture was determined according to UNI EN 13,040 by heating the samples at 105 °C until constant weight. The ash content was determined according to UNI EN 14,775 at 550 °C until constant weight. Volatiles were evaluated according to UNI EN 15,148 by heating at 900 °C under N2 flow and holding for 7 min. Fixed carbon was calculated by difference from moisture, ash and volatiles.
The carbon, hydrogen and nitrogen content were measured with a Leco TruSpec (UNI EN 15104), while sulphur content was determined by a TruSpec S Add-On Module (ASTM D4239). The oxygen content was evaluated by difference, considering C, H, N, S and ash. The higher and lower heating value (HHV) was measured according to UNI EN 14,918 by means of a Leco AC500 isoperibol calorimeter. The lignin content of the LRS was determined according to the NREL/TP–510–42618 procedure [21].
Brunauer–Emmett–Teller (BET) analysis was carried out in a Nova 2200E analyzer (Quantachrome, Graz, Austria) with N2 at 77 K. Samples were dried at 160 °C for 48 h and then degassed under vacuum in the BET analyzer at 160 °C for 24 h. The average pore diameter was calculated with the following equation [22]:
A v e r a g e   p o r e   d i a m e t e r = 4 · T o t a l   p o r e   v o l u m e B E T   a r e a
As regards the evaluation of the BET area and other morphological parameters (adsorption-desorption isotherms, total pore volume, micropore volume, pore size distribution), particular attention was taken in considering the pressure range necessary for measuring microporosity [23] and, in general, following the IUPAC guidelines reported in [24]. Micropore and external surface area were estimated by adopting the t-plot method, while the DFT (density functional theory) model, assuming slit/cylinder pores, was used to assess the distribution of pore size. The total pore volume was determined at a pressure ratio of 0.95. Pores smaller than 2 nm were considered micropores, while mesoporosity was considered in the range of 2–50 nm [7].
FTIR spectra of lignin precursor, chars and ACs, were obtained using an IRAffinity-1S spectrometer (Shimadzu, Kyoto, Japan) equipped with Dynamic Alignment system (maximum resolution: 0.5 cm−1, spectral range:4000–600 cm−1. FTIR spectroscopy is a powerful method for evaluating the surface functional groups, as the IR beam slightly penetrates the sample [25]. FTIR bands were assigned by comparing those reported in the literature.

2.3.2. Analysis of HTC Aqueous Phase

The aqueous samples were solvent-extracted with diethyl ether (DEE) and the extract analyzed in GC-MS. A scheme of the adopted methodology is shown in Figure S4: 2 mL of sample were extracted with 3 mL of solvent under sonication and the resulting mix was centrifuged at 4100 rpm for 10 min. The solvent-soluble phase was evaporated under N2 flow, dissolved in isopropanol and then injected in the GC-MS apparatus (GC 2010 Shimadzu) equipped with a Zebron ZB-5HT INFERNO (Phenomenex, Torrance, CA, USA) column (length 30 m, internal diameter 0.25 mm, film diameter 0.25 μm). The analysis was carried out with a column flow of 2.02 mL min−1 with an initial temperature of 40 °C (10 min holding time), increased to 200 °C (8 °C min−1 heating rate, 10 min holding time) and then to 280 °C (10 °C min−1 heating rate, 30 min holding time). The qualitative composition of the sample was determined by comparing the acquired spectra with those of NIST 11 library.
By performing a solvent extraction, the concentration of soluble organics in the aqueous could have been somehow underestimated. Therefore, the extraction efficiency was evaluated by creating three aqueous solutions at different concentrations of high-purity phenol, guaiacol and syringol, which were considered as representative compounds. Detailed results are reported in the supporting information (Table S2). The efficiency was compound and concentration-dependent, however the extraction step was necessary for keeping the GC column water-free and preventing its damage. Although GC-MS is affected by this issue, it has the advantage of identifying the numerous compounds dissolved in the sample and, by obtaining this information, it was possible to calibrate the HPLC with the most abundant ones, achieving a better and more trustful characterization of the aqueous phase. The HPLC apparatus (UFLC Shimadzu) was equipped with a refractive index detector, a Hi-Plex H column (Agilent, Santa Clara, CA, USA) 300 × 7.7 mm, operating with 0.005 M sulfuric acid as mobile phase, following NREL 42,623 guidelines [21].

2.3.3. Chemicals

All reagents and solvents were purchased from Sigma Aldrich (St. Louis, MO, USA) and Carlo Erba (Milan, Italy) and were adopted without further purification. All chemicals were ACS reagent grade. Deionized water (0.055 μS cm−1) was collected from a Microlab ultrapure water system (TKA, Milan, Italy). The analytical standards for chromatography were ≥98% purity. Chemical standards for calibrations of instruments were purchased from Leco (HHV, CHNS), BAM (Berlin, Germany) and Quantanalitica (Lecco, Italy, BET). Gases were purchased from Rivoira (Turin, Italy). Argon, air, nitrogen and oxygen were 99.999% purity, helium 99.9995% purity.

3. Results

3.1. Lignin-Rich Stream Characterization

Table 2 reports the properties of the lignocellulosic ethanol lignin-rich stream, compared with those of a lignin from pulp and paper industry (ALM lignin). It is important to notice that the lignin content in the feedstock adopted in the present study accounts only for 53% of the total dry weight and still a relatively high amount of structural sugars is present (35.8% w/w d.a.f.), mainly in the form of glucan. On the other hand, ALM lignin is almost completely made of lignin, being its content 94% w/w (d.b.), hence the higher carbon content. This difference remarkably affects HTC reaction mechanism: as proposed by Kang et al. [11] a pure lignin feedstock would produce a polyaromatic char via solid-solid reactions and phenolic char formed by the polymerization of converted solubilized lignin fragments. However, due to the presence of structural sugars another reaction pathway is determined: Dinjus et al. [13] proposed a mechanism where carbohydrates are firstly solved in the aqueous medium and then, polymerize, forming carbon particles. These two pathways are not independent from each other.

3.2. Preliminary Lignin-Rich Stream Activation

In order to select the appropriate conditions for hydrochars activation and thus to reduce the amount of hydrochar needed for further activation (i.e., the number of HTC experiments), two physical and six chemical activation experiments were carried out. In the physical activation experiments, LRS was firstly subjected to slow pyrolysis (two-step activation), while in the chemical process it was activated without carbonization (one-step activation).

3.2.1. Physical Activation

The results from the preliminary physical activation of LRS are reported in Table 3 The pyrochar from the slow pyrolysis of LRS showed an apparent surface area (BET area) of 370 m2 g−1: solid yield was 27.8% w/w (d.b.; absolute standard deviation 0.49%). When activating at 800 °C, total yield was 16.5% w/w and BET area was 1078 m2 g−1, whereas the yield at 700 °C was higher (22.6% w/w), but the resulting BET area was 600 m2 g−1. Although the best trade-off between total yield and BET area was obtained with 800 °C as the activation temperature, 700 °C was chosen for the hydrochars activation. This decision was taken because the apparent surface area obtained at 700 °C was a very interesting value, comparable with several commercial activated carbons, and therefore the research focus shifted to maximization of the AC yield.

3.2.2. Chemical Activation
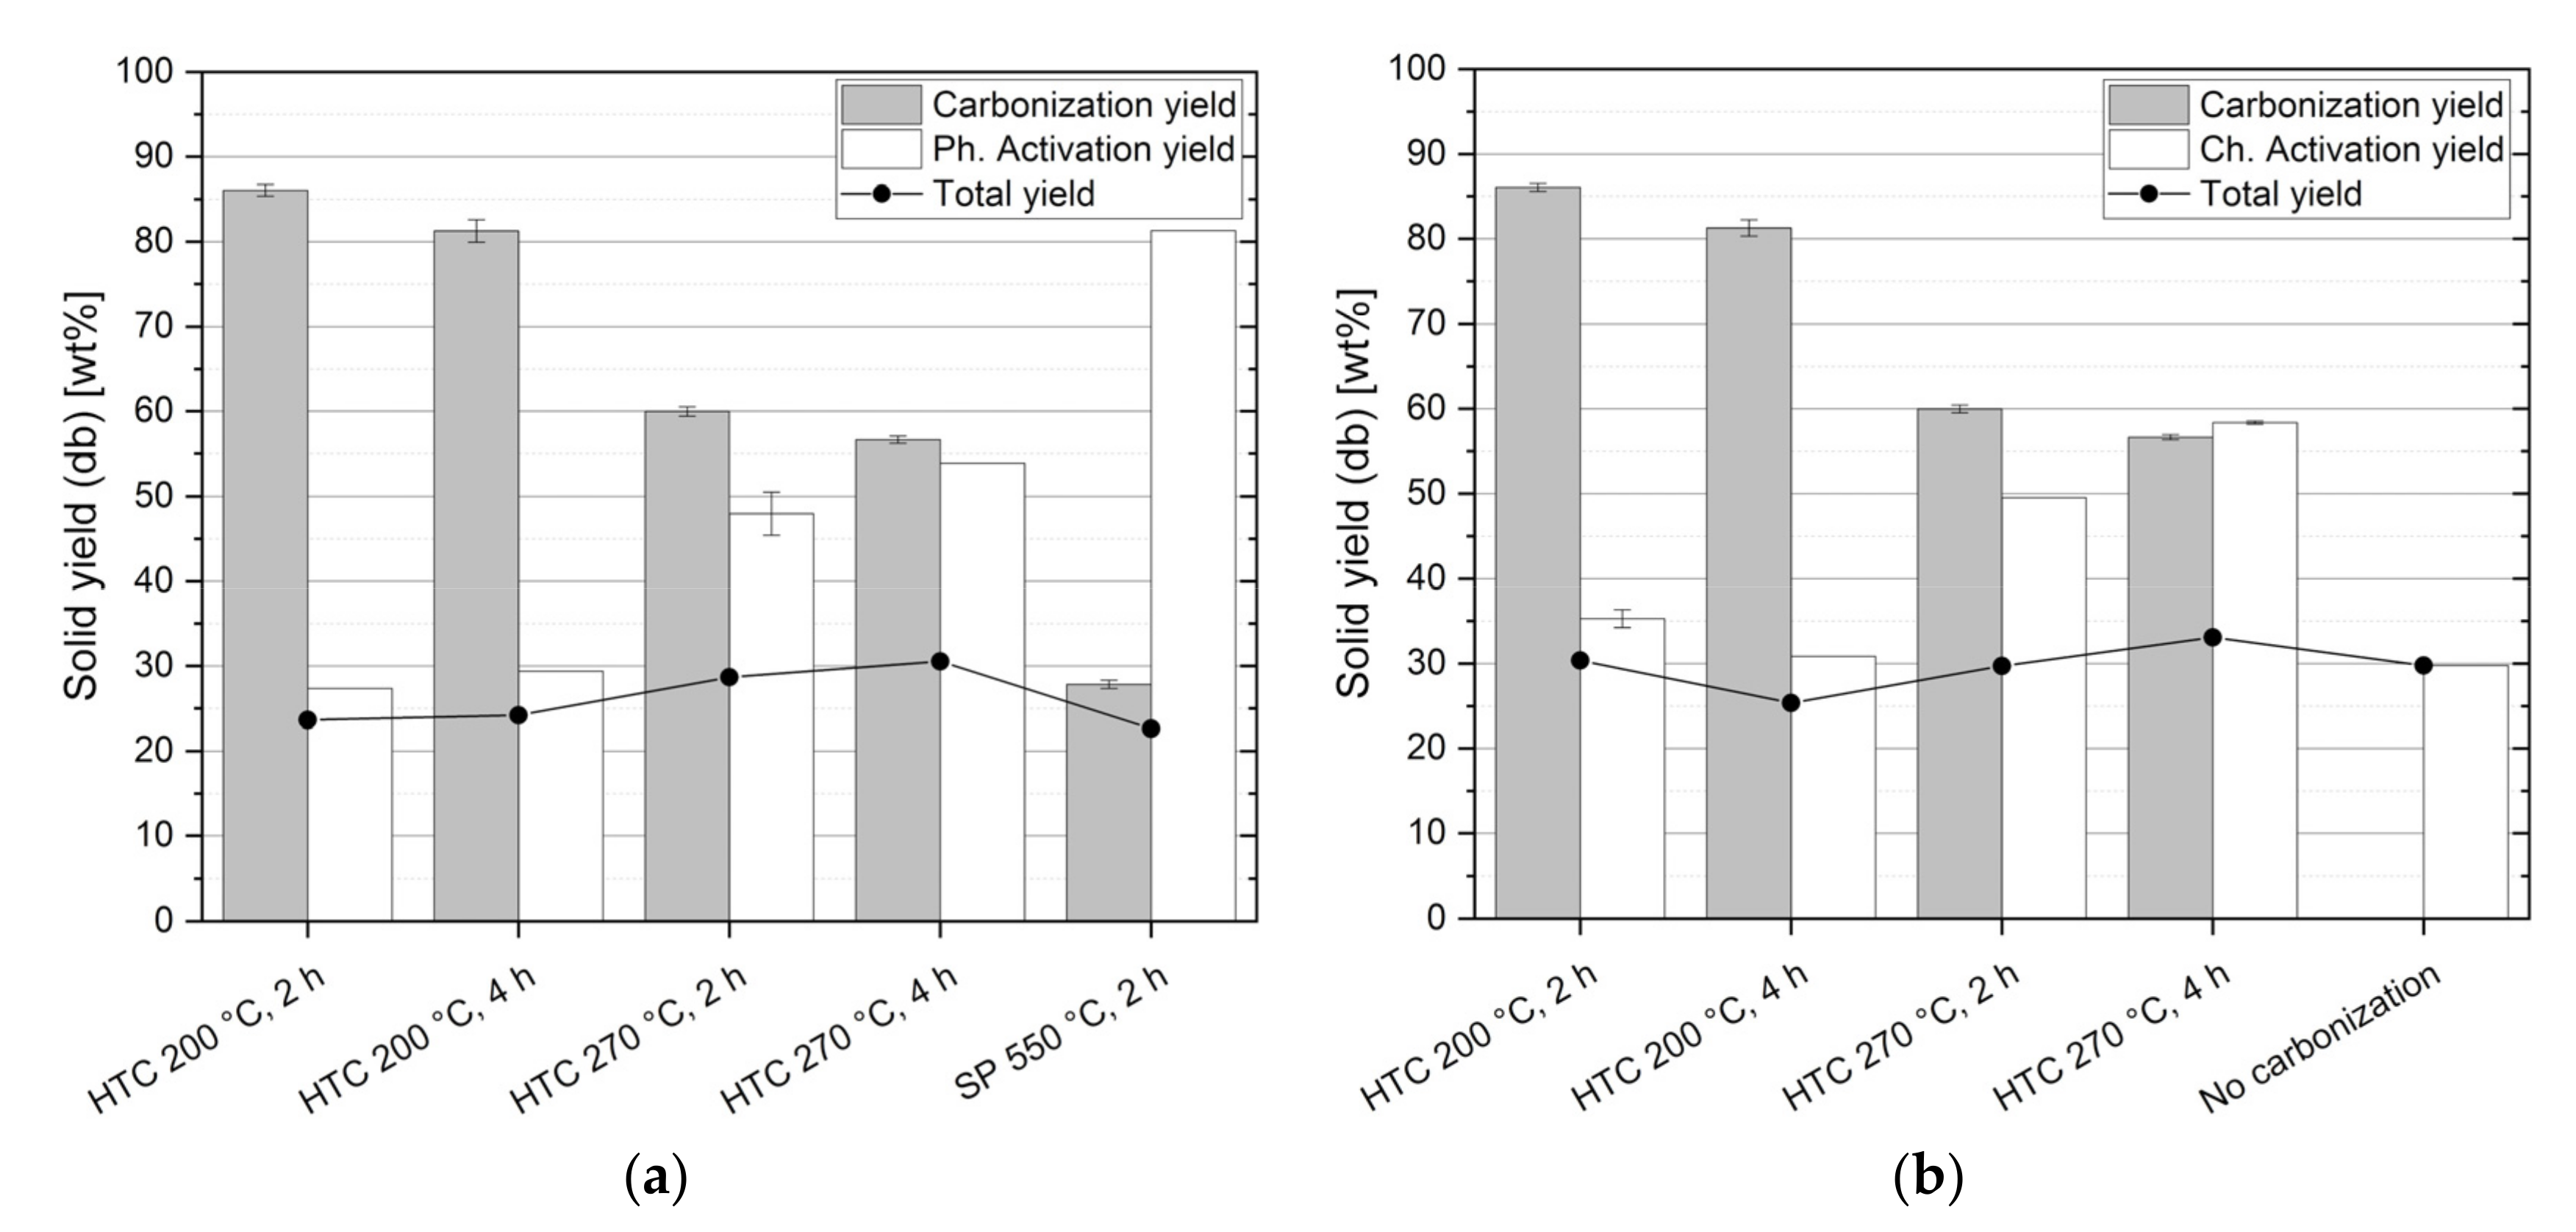
The LRS was chemically activated in a single step, after its impregnation with KOH as activating agent; the results are shown in Table 4.
At a 1:1 KOH:LRS dry mass ratio, increase in activation temperature led to yield reduction and BET area increase, the latter reaching a maximum of 1484 m2 g−1. At 2:1 mass ratio the BET maximum value was obtained at 700 °C (1188 m2 g−1), a lower figure if compared to the surface area achieved at the same temperature but at a lower mass ratio (1437 m2 g−1). It is possible that the higher amount of KOH led to an excessive opening of the pores, producing a lower value of BET area. As the best trade-off between yield and surface area was produced at 600 °C and 1:1, this condition was chosen for the following chemical activation of the hydrochars.
During chemical activation, the samples inside the ceramic crucibles experienced the so-called muffin effect, rising as muffins do during baking (Figure S5). This behavior is attributed to the typical swelling of lignin under pyrolytic conditions and it was reported also by other authors [8,26] and indicates the fact that lignin has only been partially degraded during HTC.

3.3. Solids Yields

The carbonization, activation and total yields (d.b.) for the physical and the chemical activation experiments are reported in Figure 2. The term carbonization yield means the yield of the pretreatment carbonization process (i.e., HTC or pyrolysis), ahead of activation. By increasing the severity of the carbonization process, the solid yield decreased from 86.0 to 56.7% w/w (d.b.) for HTC, down to 27.8% w/w (d.b.) for SP; these values are in agreement with literature data [8,11,27]. In general, the higher the reaction severity the lower the solid yield and the higher the extent of the carbonization. Indeed, the activation yield increased with the severity of the pretreatment, indicating a more thermochemically stable precursor for activation. Due to these contrasting trends, the total yield was approximately constant, being between 23.6 and 30.5% w/w (d.b.). In the case of chemical activation, the minimum value of the activation yield was not reached at the less severe HTC condition, but at 200 °C—4 h (30.8% w/w, d.b.). However, a trend similar to the physical process was obtained, being the total yield between 25.4 and 33.1% w/w (d.b.).

3.4. FT-IR Analysis

The spectra are reported in Figures S6 and S7. The FT-IR spectrum of the feedstock presents a strong and wide band at around 3340 cm−1 produced by alcoholic and phenolic hydroxyl groups involved in hydrogen bonds [28]. The band at 2920 cm−1 is due to a C-H stretching vibrations. The region (2000–600 cm−1) provides interesting information. The bands at 1592 cm−1, 1511 cm−1 and 1422 cm−1 are ascribed to C=C vibrations of skeletal aromatic rings, while the band at 1456 cm−1 corresponds to C-H asymmetric vibrations and deformations (asymmetric in methyl and methylene) [29]. The band at 1321 cm−1 is due to syringyl units (aromatic ring breathing, S and G condensed units), whereas the band at 1269 cm−1 is due to guaiacyl units (aromatic ring breathing) [29]. The absorption bands located in 1030–1114 cm−1 wavenumber range, are attributed to: deformation vibrations of C-H bonds in the aromatic rings, deformation vibrations of C-O bonds in primary alcohols and C–O–C glycosidic bonds vibrations [28,29].
Both carbonization processes (pyrolysis and HTC) led to a decrease in functional groups [8]. Unlike LRS, the FTIR spectrum of pyrochar, shows only two characteristic bands: one at 1570 cm−1 and another at 1700 cm−1. The first band is attributed to C=C vibrations of skeletal aromatic rings. This band intensity is a strong indication of the significant development of aromatic structure during pyrolysis [8,30]. The second band is attributed to C=O stretching vibrations probably associated to COOH or carbonyl groups on the surfaces.[30]. The absence of –OH signals is related to breaking hydrogens bonds, which released of alcohol and water [30]. The FTIR spectra of chemically activated lignin are very similar to pyrochar spectra. On the contrary, the FTIR spectrum of physically activated pyrochar doesn’t show any signal. The angular deviation of the base line is probably due to the presence of charcoal’s organic or mineral by-products [31].
The FTIR spectra of hydrochars obtained at different temperatures (200 °C for 2 h, 4 h and 270 °C for 2 h, 4 h in Figure S7) are very similar to each other and above all to the FTIR spectrum of LRS precursor. This supports the fact that lignin undergoes a minor decomposition during HTC [8]. It is very interesting to note that in the spectra of hydrochars obtained at 200 °C, there is a band at around 2100 cm−1 that can be attributed to asymmetric C≡C stretching. The formation of carbyne-like materials is also observed during low temperature pyrolysis of bio-based lignin [32].
The FTIR spectra from physically and chemically activated hydrochars show a drastic decrement of functional groups compared to hydrochars without activation, however, some peaks are still observable [8,33]. The only visible peak of the spectra of physically activated hydrochars appears in black spectrum at around 2290 cm−1 and is associated to asymmetric C≡C stretching. The most relevant peaks of the spectra of chemically activated hydrochars are those related to: asymmetric C≡C stretching (2110 cm−1), C=C vibrations (1560 cm−1) and C-O-C stretching (broad band at around 1140 cm−1). These again corroborate the aromaticity increase that hydrochars undergo during activation, in agreement with literature [8,33].

3.5. Char Characterization

Table 5 reports the results of the elemental analysis of the chars (hydrochars and pyrochar). An increase in severity led to an increase in the total carbon content, thus to a more stable compound. During low-temperature HTC the hydrochar elements’ concentrations were approximately unchanged with respect to the feedstock; only when the reaction temperature was 270 °C, a steep increase of the carbon content was obtained (71.1% w/w, d.b.), which was similar to the one obtained with pyrolysis (75.0% w/w, d.b.). During HTC, the hydrogen concentration remained roughly unaffected, whereas in the pyrochar it was more than halved. In agreement with the Van Krevelen diagram of Figure S8, also a visual observation of the samples (Figure S9) revealed that the hydrochar obtained at 200 °C was less converted, being its aspect very similar to the LRS, while the hydrochar produced at 270 °C and the pyrochar had a characteristic char-black color.

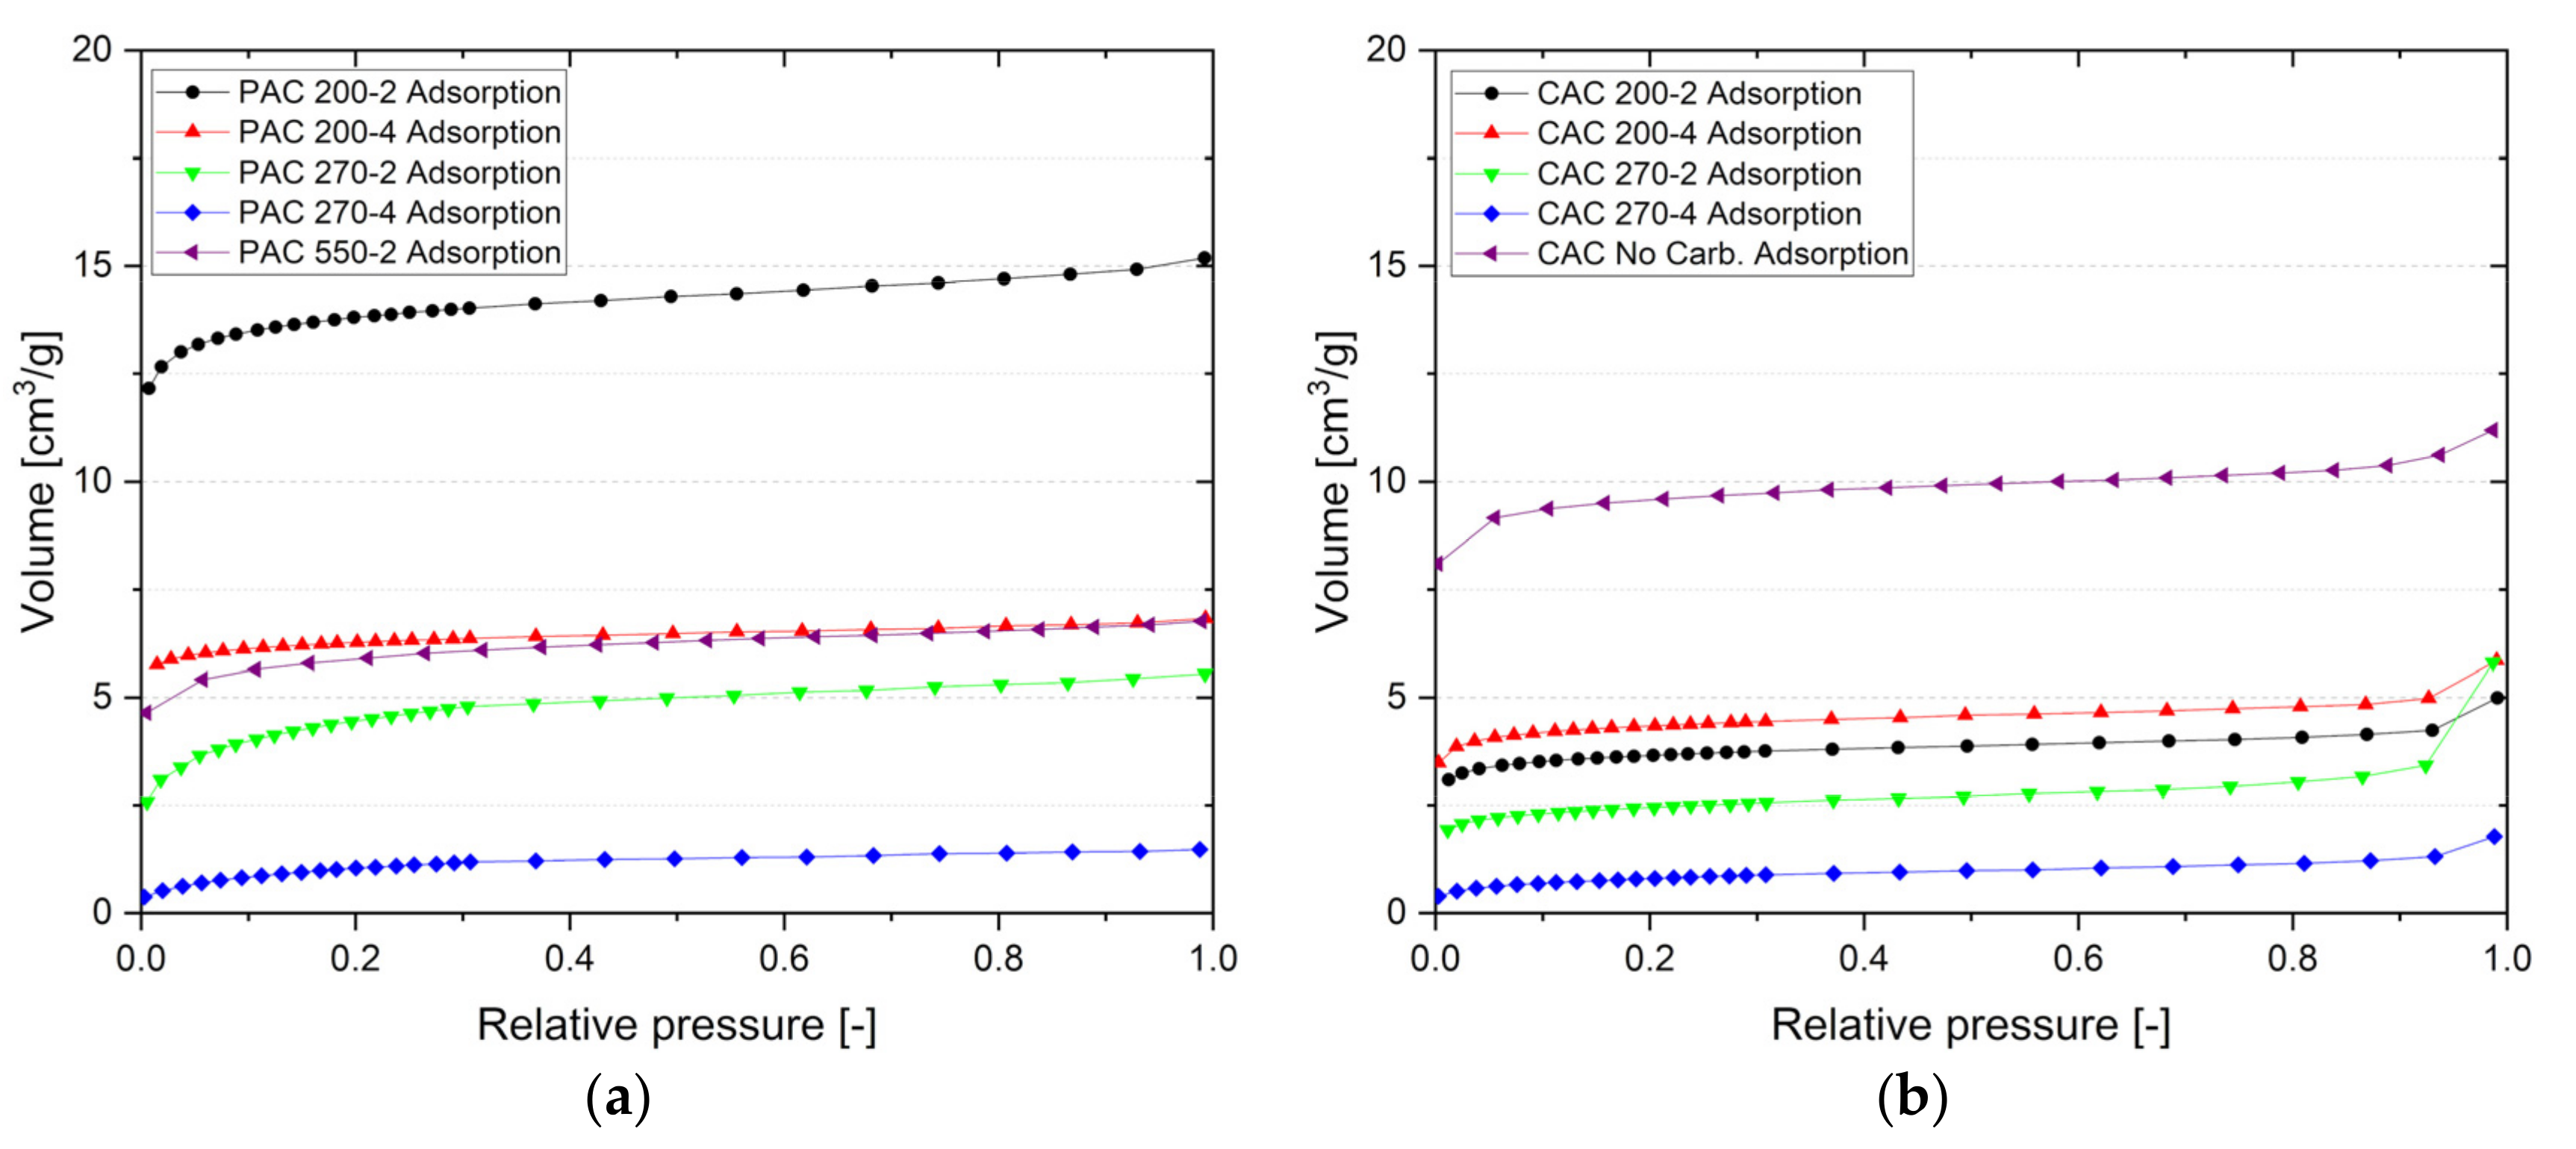
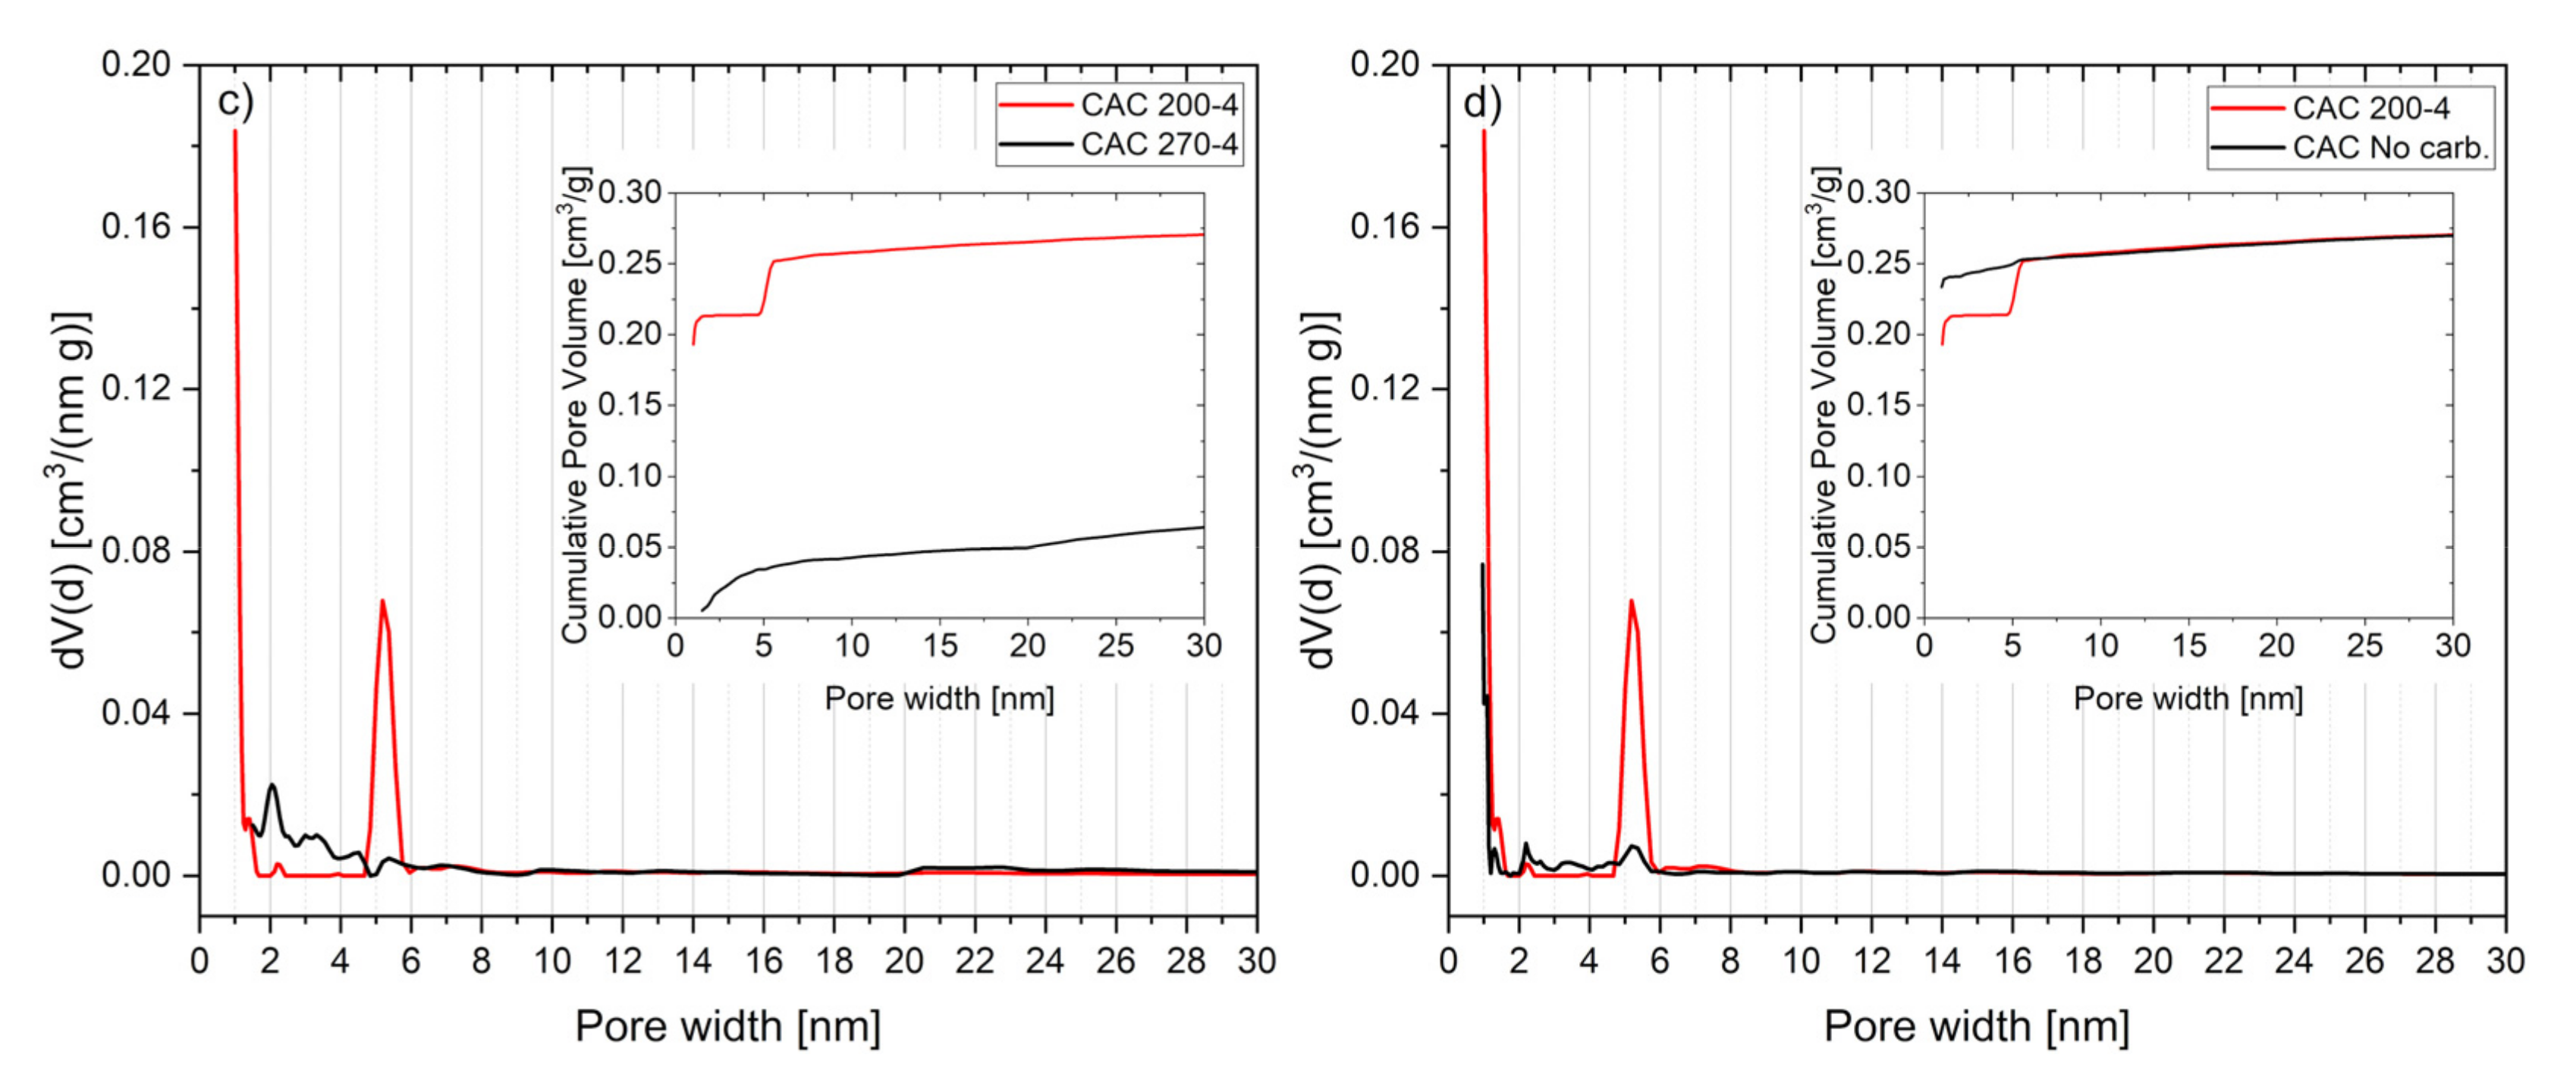
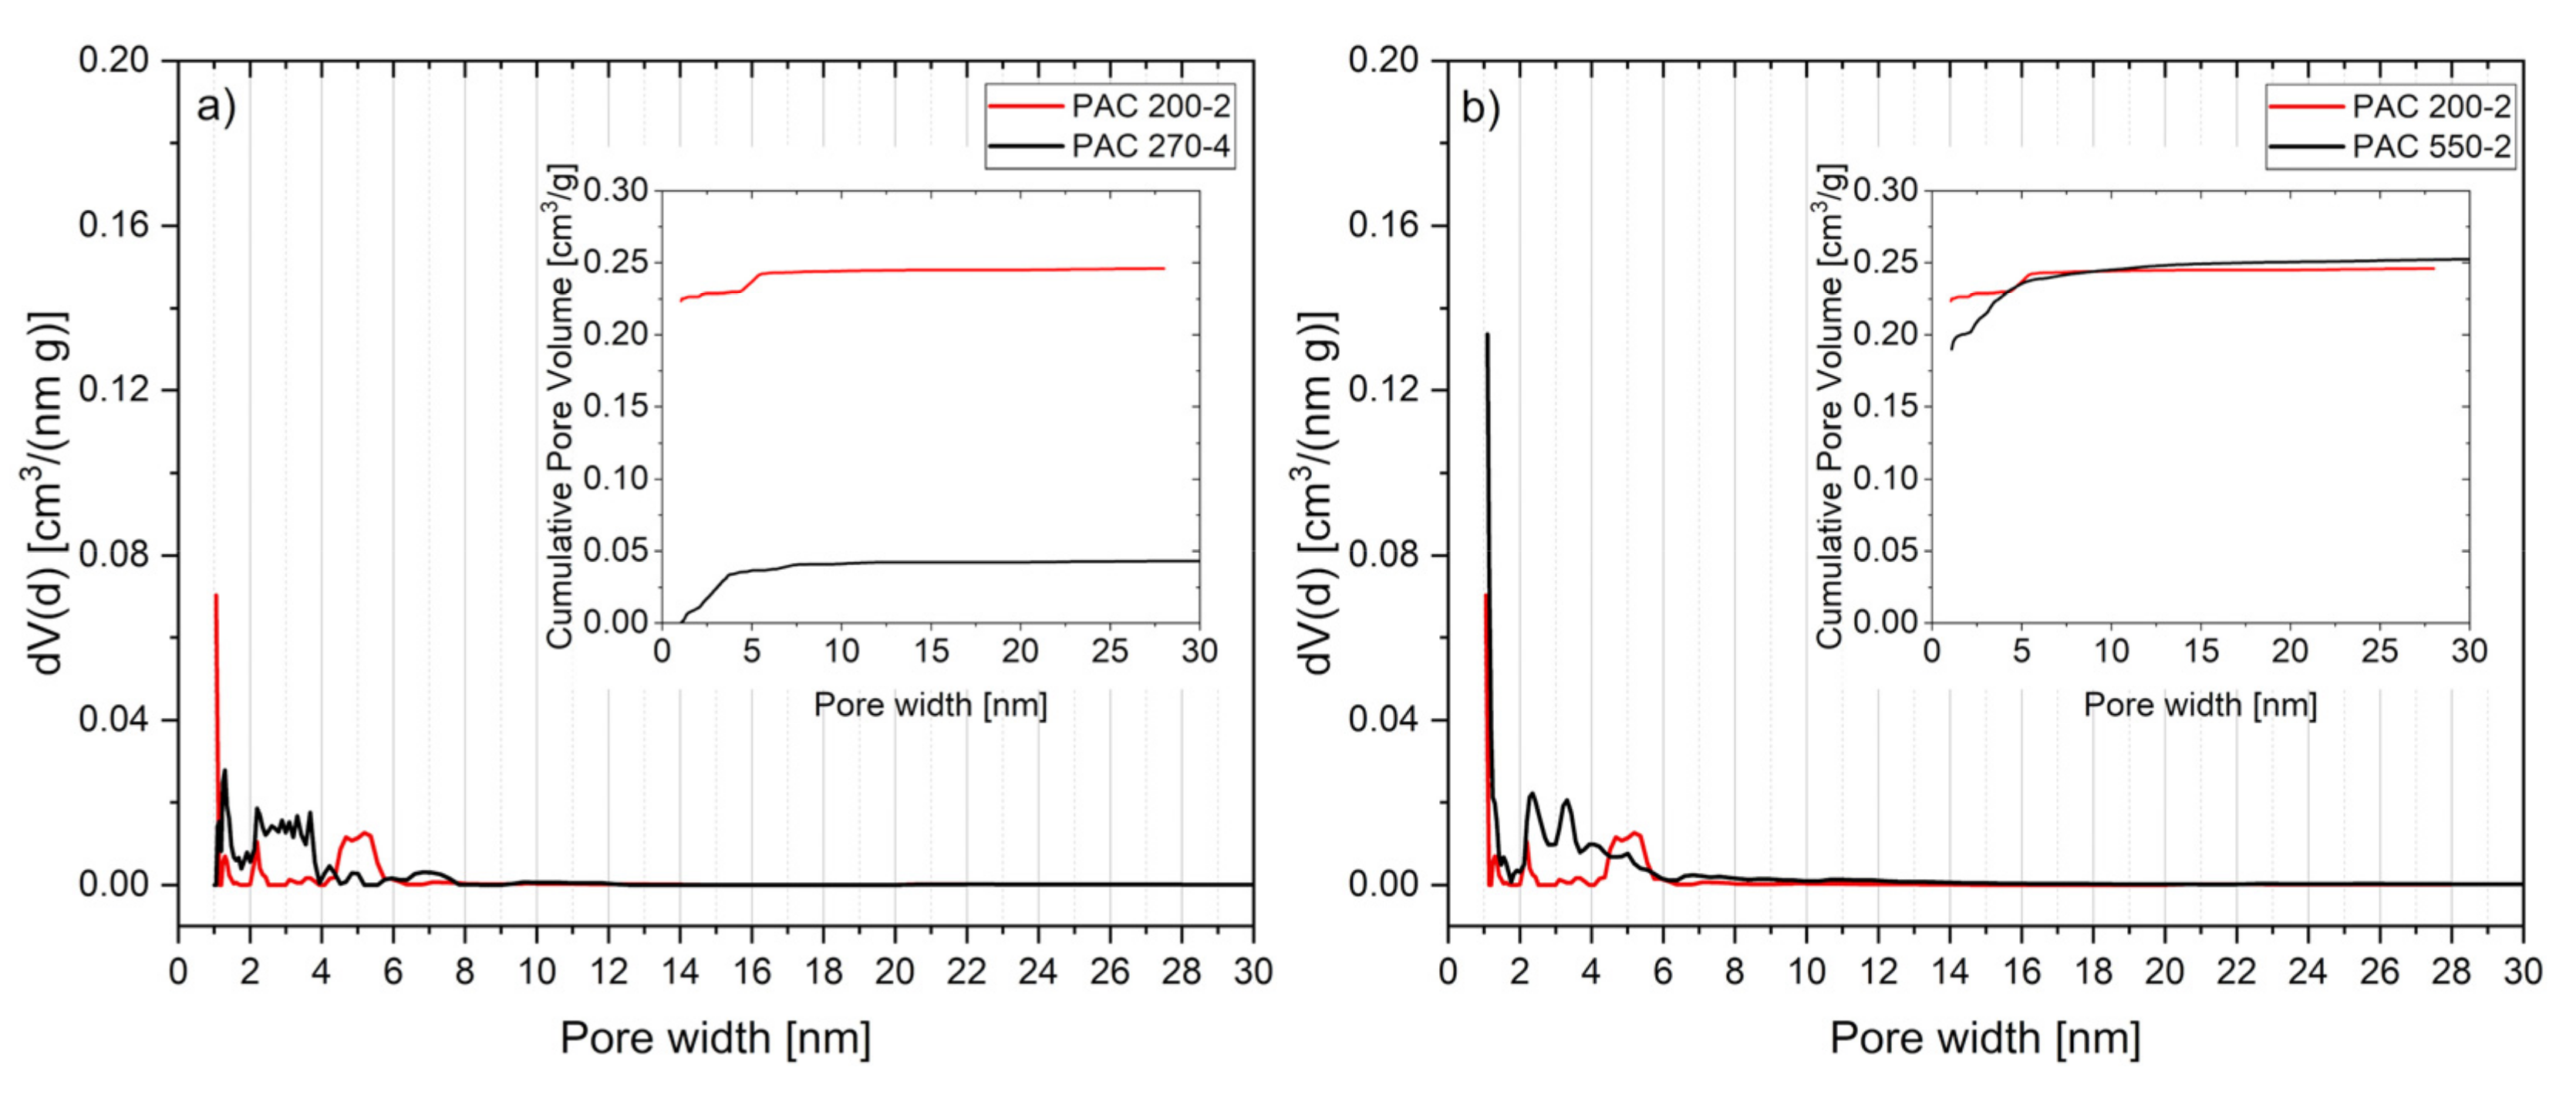
3.6. Activated Carbon Characterization

Figure 3 shows the nitrogen adsorption isotherms of the produced carbons. A visual inspection of these curves provides information on the carbon porous structure. The PAC isotherms can be classified as type I, which indicates that the PAC are mainly composed of micropores, while the CAC isotherms are a combination of type I and II; this latter behavior is an indication of wider pores [24]. The adsorbed volume generally decreased with the HTC reaction temperature and time, this is true for the PAC, where the AC pretreated at the mildest HTC condition achieved the highest volume. The AC that was pretreated by pyrolysis showed an isotherm curve similar to the one pretreated by HTC at 200 °C—4 h. In the case of chemical activation, the best sample was the one activated without prior carbonization, while, among the HTC-pretreated samples, the one which exhibited the highest adsorption was the one processed at 200 °C—4 h.
A further comparison between the adsorption-desorption isotherms of the best PAC and CAC with and without the HTC pretreatment is reported in Figure S10. The shape of the hysteresis loop gives an additional insight on the pore structure: all the samples exhibited a type H4 loop, indicating a combination of micro and mesoporosity.
Table 6 reports the results of the activation experiments. The feedstock and the hydrochars had an extremely low specific surface (from 3 to 9 m2 g−1). Considering the produced AC, a drastic decrease in specific surface occurs as the HTC temperature reaches 270 °C and, in general, these results agree with the trends observed in the adsorption isotherms. The highest value of BET surface area was achieved by chemical activation without carbonization, reaching 675 m2 g−1. In general, studies dealing with the activation of hydrochar report an increase of the AC BET area with the HTC process severity. However, to the author’s knowledge, it is the first time that lignin-rich stream from a lignocellulosic ethanol plant was converted by HTC and subsequently activated. Granular activated carbons from grape seeds were produced via HTC and further activated with KOH [34]. The results from proximate and ultimate analyses of the feedstock they adopted were similar to those of LRS and at HTC and activation conditions similar to the ones reported in the present study, they obtained very similar BET values (around 600 m2 g−1). However, as they increased HTC severity, AC of better quality were produced, reaching 1018 m2 g−1 when the HTC temperature was 250 °C. Likewise, chemical KOH activation of hydrochar from anaerobic digestion digestate have been performed [35] and an increase in BET area from 930 to 1351 m2 g−1 when HTC conditions shifted from 190 °C—6 h (pH 7) to 250 °C—6 h (pH 5) were found; however, the maximum total yield they obtained was below 8% w/w. An explanation of this behavior could be the fact that at higher temperature feedstock dissolution and carbonization of solubilized lignin fragments are favored, thus producing a greater amount of phenolic hydrochar particles which tends to adhere to the hydrochar substrate [11]. These heavy phenolic particles may have hindered the activation process, leading to low values of BET apparent surface area. It should be pointed out that no solvent-washing was adopted for hydrochar collection, keeping intact the surface chemistry. The elemental analysis of the hydrochar obtained at 200 °C confirms the fact that the low-temperature HTC pretreatment only slightly affected the feedstock, hence the higher BET values.
The total pore volume followed a similar trend too, being maximal for the CAC produced at 200 °C—4 h (0.32 cm3 g−1). The results from the t-plot method confirmed the shape of the adsorption isotherms: the PAC produced at a low HTC temperature had a micropore contribution to the total pore volume greater than 85%. In the case of CAC, the activated carbon with higher microporosity was the one produced without the HTC pretreatment.
The pore size distribution of the produced activated carbons was evaluated by DFT; the results, together with the cumulative pore volume, are reported in Figure 4. A comparison between the best and worst AC (in terms of measured BET area) produced with the HTC pretreatment (a, c) and between the best AC with and without HTC pretreatment (b, d) is shown in the figures. In the case of physical activation, PAC 200—2 exhibited a high microporosity, with a mesoporosity concentrated below 6 nm (mainly around 5.5 nm), where the cumulative pore volume experienced a sudden increase.
PAC 270—4 shows a significant mesoporosity from 2 to 8 nm. The AC produced with the SP pretreatment still showed a good microporosity level, but also a significant mesoporosity ranging from 2 to 15 nm, as indicated by the increasing curve of the cumulative volume. CAC pretreated at 200 °C—4 h exhibited a very concentrated mesoporosity (around 5.5 nm), while mesoporosity for the CAC 270—4 extended above 20 nm. Without the carbonization pretreatment a porosity similar to CAC 200—2 was obtained, but with a better-developed microporosity.

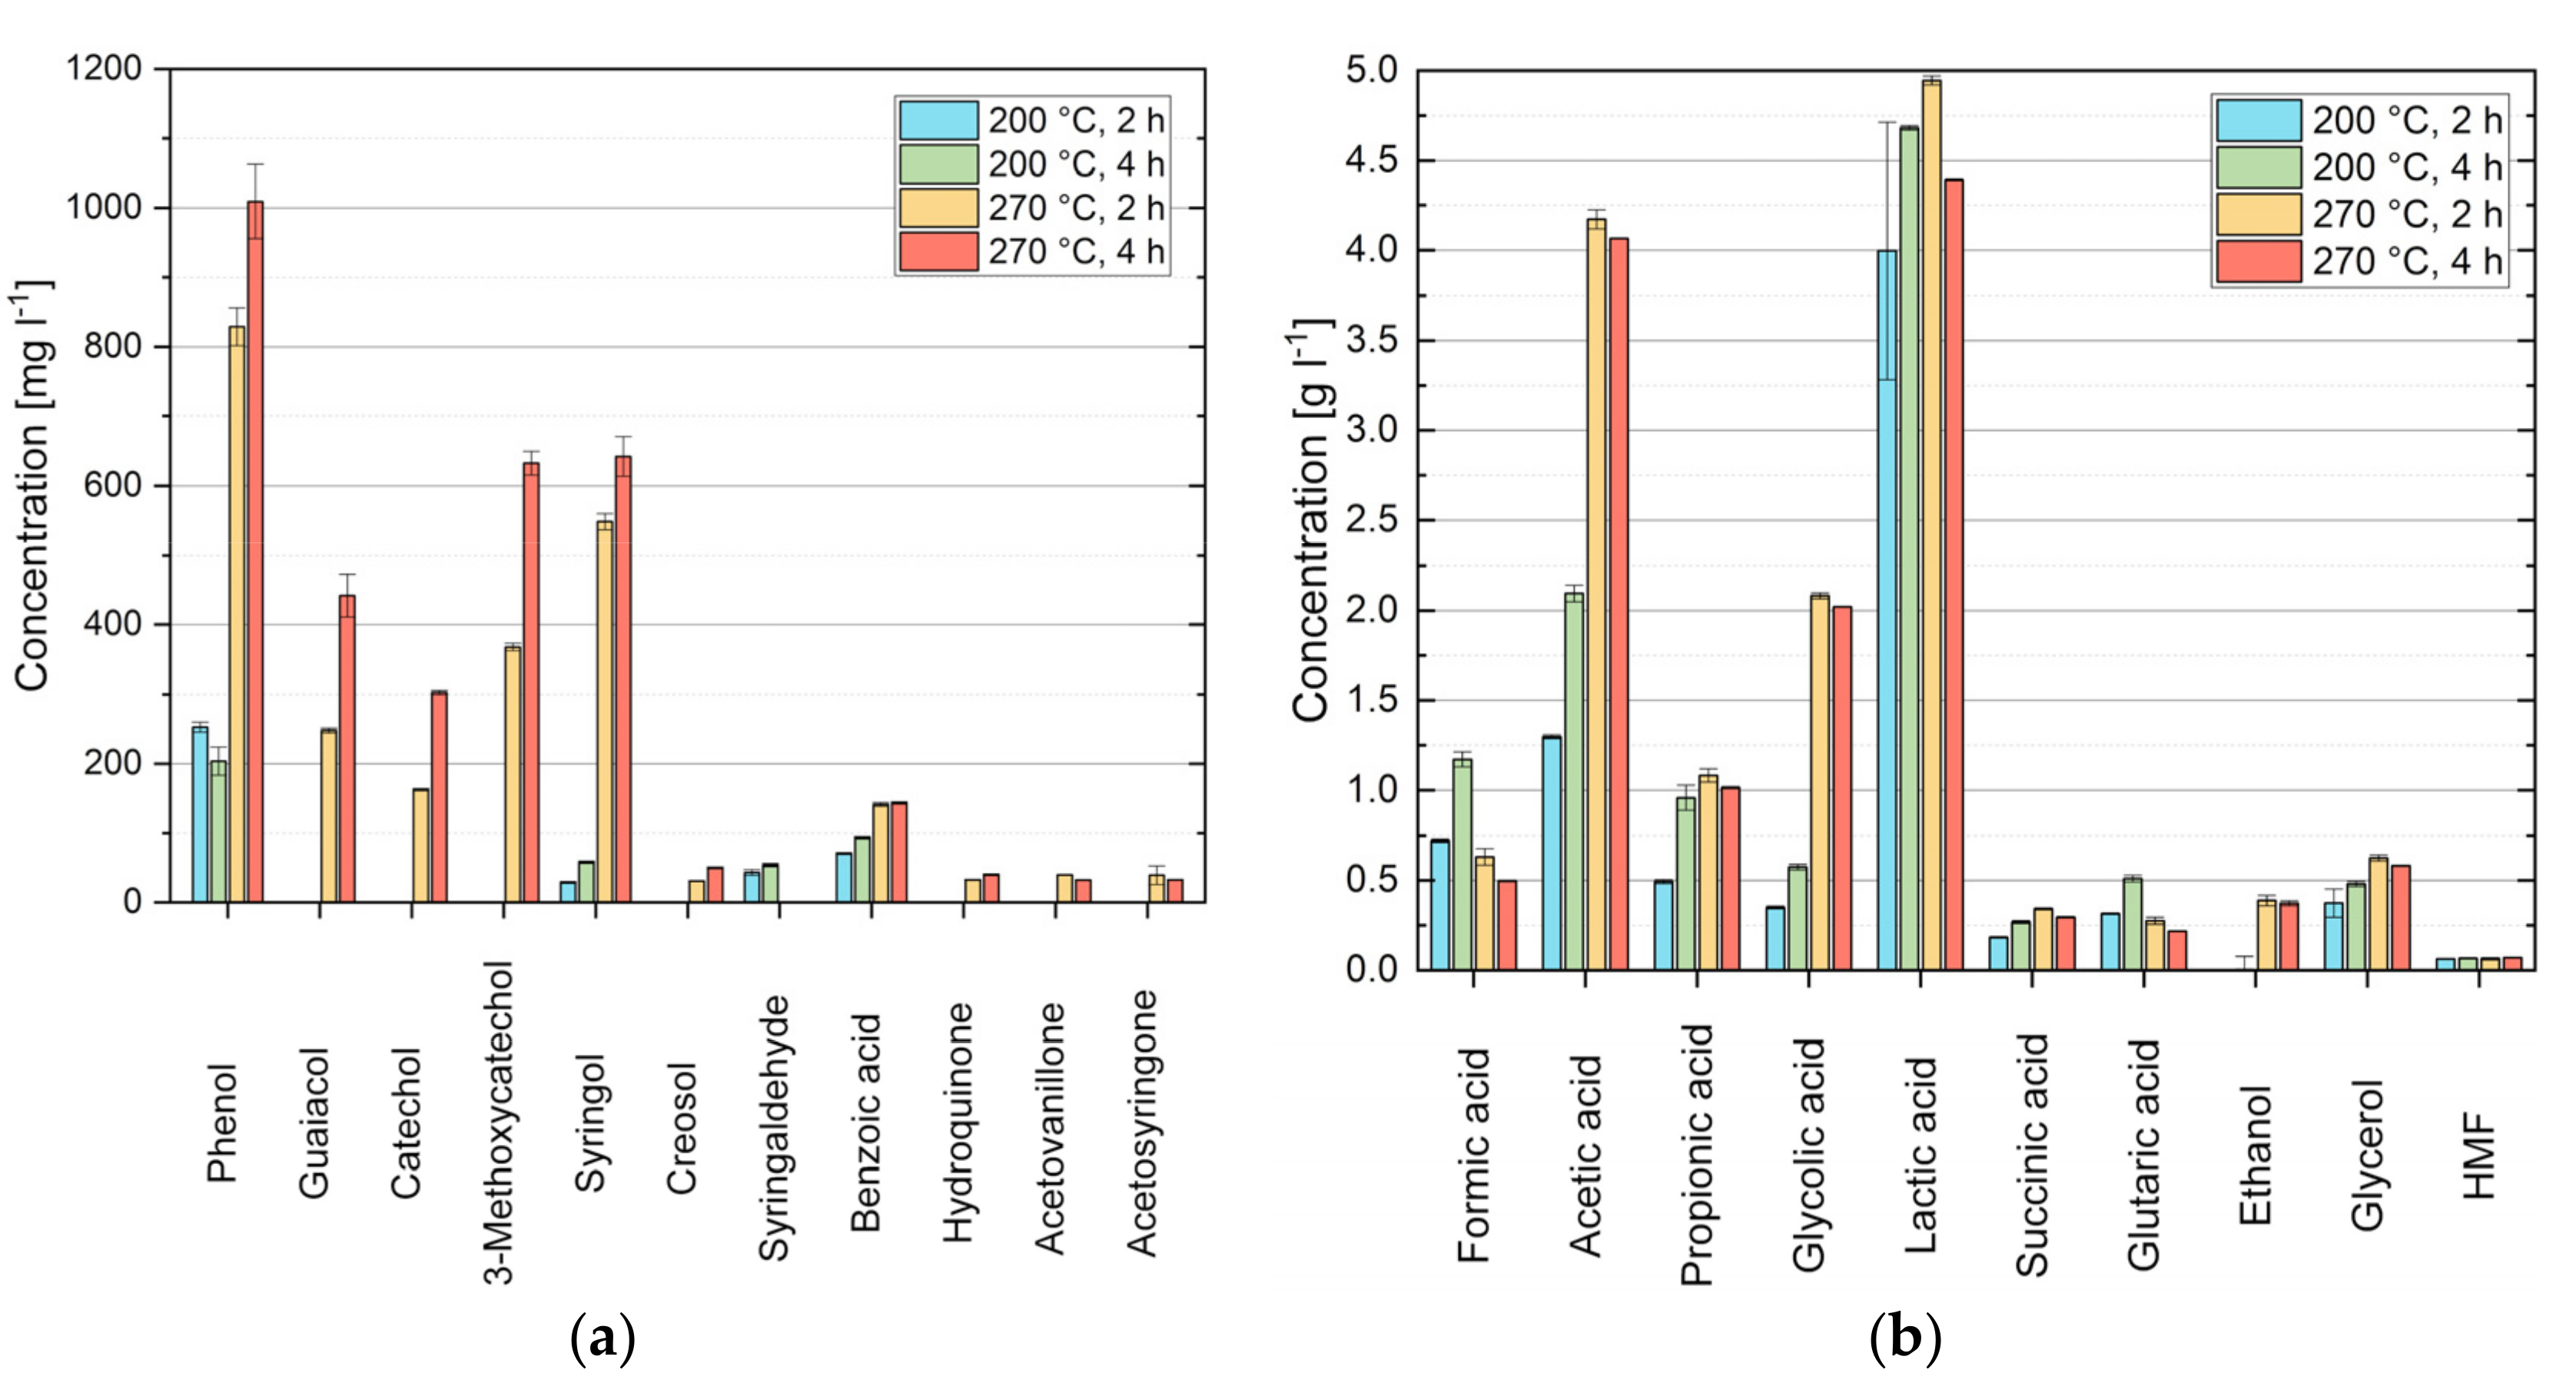
3.7. HTC Aqueous Phase Characterization

GC-FID and GC-MS were performed on the aqueous phase from HTC of anaerobic digestion digestate [35], finding that oxygenated aromatic compounds (e.g., phenol, guaiacol, 4-ethylphenol, 4-ethylguaiacol, syringol) were the most abundant substances, with an increasing concentration with HTC severity (up to 200 mg L−1). In the present study, the concentration of most of the aqueous phase dissolved organics increased with the reaction severity, as shown in Figure S11, where four selected chromatograms—each representative of a reaction condition—are reported. Figure 5 provides the quantification of organics by GC-MS and HPLC. The reaction temperature significantly governs which kind of reaction dominates during HTC process [36]. In general, at higher temperatures a greater fragmentation of the side chains of lignin is favored. This causes a drastic increase of the concentration of oxygenated aromatics, such as species belonging to the families of phenol, guaiacol and syringol, and of complex ketones; these compounds are derivatives of lignin degradation. Only syringaldehyde concentration increased with time, that however became unquantifiable at 270 °C. This behavior indicates that at low temperatures the reaction mechanisms are dominated by hydrolysis, in which water breaks ester and ether bonds, releasing phenol and phenolic derivatives. When the temperature is increased to 270 °C, a more complex network of reactions takes place among which decarboxylation. During decarboxylation, carboxyl and carbonyl groups quickly degrade, yielding, respectively, CO2 and CO. One probable CO2 source is formic acid and its concentration decreases at higher temperature because of the loss of CO2 [37]. Other reactions occurring during HTC are dehydration, polymerization and aromatization [38]. The concentrations of lactic acid and acetic acid increased with temperature and with reaction time at 200 °C. It is known that the HTC process yields organic acids, in particular acetic [39]. Some acids are obtained by direct reaction of the biomass, while others are produced by further degradation of intermediates, like sugars. Also, low concentrations of glycerol, ethanol and 5-hydroxymethylfurfural (HMF) were detected. The HMF is a versatile chemical which can potentially replace petroleum-based products. This latter compound, deriving from the degradation of unfermented cellulose is a highly reactive intermediate, which could have been converted into carboxylic acids, cyclic ketones and phenols [35,40]. More specifically, the dehydration of fructose, which is produced by the isomerization of glucose produced HMF [41]. At hydrothermal conditions, 5-HMF can be degraded into formic acid. Fructose can also lead to the formation of glyceraldehyde, which can consequently produce glycolic acid or pyruvaldehyde, which in turn forms acetic acid. Among the quantified compounds, lactic acid was the most abundant, reaching nearly 5 g L−1 at 270 °C, 2 h. Glycerol, lactic and acetic acid were also found in the raw feedstock [15], and derive from the bacterial contamination of the poplar fermentation process from which the lignin-rich stream was obtained.

4. Conclusions

Differently from most of the reported studies, which deal with technical lignin or lignin from pulp and paper, here the conversion of residual lignin from a demo-scale lignocellulosic ethanol plant was investigated in order to produce activated carbons by slow pyrolysis and HTC pretreatment. Residual lignin from ethanol biorefineries greatly differs from pulp and paper lignin, as more than 30% w/w (d.a.f.) of structural sugars are still retained in the material and lignin only accounts for nearly 50% w/w (d.a.f.). IR spectroscopy shows that both carbonization processes (pyrolysis and HTC) lead to a reduction of the functional groups characteristic of the feedstock. The greater number of signals present in the hydrochar spectra than in the pyrochar spectra, indicate that lignin undergoes less decomposition during HTC than pyrolysis. Microporous AC were produced, and the maximum achieved value of BET area was 630 m2 g−1 for physically activated carbon with HTC pretreatment and 541 m2 g−1 for chemically activated carbon with HTC pretreatment. Moreover, chemically activated carbon without pre-treatment showed a higher value of BET area of 675 m2 g−1.The physically activated carbons had a better-developed microporosity than those produced with KOH chemical activation. Increasing the HTC reaction severity reduced the specific area and microporosity of the AC, both for chemical and physical activation. Thus, when processing lignin from lignocellulosic ethanol, slow pyrolysis or mild-temperature HTC should be favored in place of high-temperature HTC when performing physical activation with the aim of producing microporous adsorbent with good surface area and pore volume. Likewise, no pretreatment is needed for chemical activation. As dissolution and carbonization of solubilized lignin fragments are favored at higher temperature in a hydrothermal environment, sticky heavy phenolics particles are produced, which adhere to the char surface and lead to a less effective activation process. Water-soluble organics in HTC aqueous phase were quantified by GC-MS and HPLC: high concentrations of lactic acid were found (up to 5 g L−1), together with lignin derivatives, such as phenol, guaiacol, 3-methoxycatechol and syringol, which increased with severity. The results suggest that at low temperatures the reaction mechanisms are dominated by hydrolysis, while, as the temperature increases up to 270 °C, more complex pathway take place, among which decarboxylation seem to be the most important one.

Supplementary Materials

The following are available online at https://www.mdpi.com/1996-1073/13/16/4101/s1, Figure S1: Lignin-rich stream as received (left) and after drying, grounding and sieving to 4 mm (right), Figure S2: Operating diagram of a typical experiment carried out at 200 °C—2 h, showing the trends of inner reactor temperature, sand bed temperature and inner reactor pressure, Figure S3: Scheme of the experimental apparatus used for physical activation of pyrochar and hydrochar; MFC: mass flow controller, Figure S4: Methodology for gas-chromatographic analyses, Figure S5: Chemically activated carbons from LRS; as removed from the TGA (left, the muffin effect is clearly visible) and after washing and drying (right), Figure S6: FTIR spectra of feedstock, pyrochar, physically activated carbon from pyrochar and chemically activated carbon from feedstock, Figure S7: FTIR spectra of hydrochars and related physically and chemically activated carbons, Figure S8: Van Krevelen diagram of the hydrochars and pyrochar, Figure S9: Char samples obtained after the carbonization pretreatment. Residence time is 2 h for each shown sample, Figure S10: Comparison between the adsorption-desorption isotherms (N2, 77 K) of selected activated carbon samples, Figure S11: Chromatograms from GC-MS of HTC aqueous phase from the HTC of LRS, Table S1: Average experimental results of the LRS HTC tests, Table S2: Results from the evaluation of the DEE extraction efficiency from the aqueous phase.

Author Contributions

Conceptualization, A.M.R.; methodology, E.M.; validation, A.M.R., L.R.; investigation, E.M.; resources; writing—original draft preparation, E.M., L.B., and G.L.; writing—review and editing, D.C. and L.R.; visualization, E.M.; project administration, D.C.; resources, L.B. and G.L. All authors have read and agreed to the published version of the manuscript.

Funding

This research received no external funding.

Acknowledgments

Authors wish to acknowledge Benedetta Ciuffi for her valuable help in the interpretation of the FT-IR spectra.

Conflicts of Interest

The authors declare no conflict of interest.

References

  1. European Environment Agency, Sectoral Greenhouse Gas Emissions by IPCC Sector. Available online: https://www.eea.europa.eu/data-and-maps/daviz/change-of-co2-eq-emissions-2#tab-dashboard-01 (accessed on 9 January 2019).
  2. Lynd, L.R. The grand challenge of cellulosic biofuels. Nat. Biotechnol. 2017, 35, 912–915. [Google Scholar] [CrossRef] [Green Version]
  3. Chiaramonti, D.; Goumas, T. Impacts on industrial-scale market deployment of advanced biofuels and recycled carbon fuels from the EU Renewable Energy Directive II. Appl. Energy 2019, 251, 113351. [Google Scholar] [CrossRef]
  4. Lee, S.; Speight, J.G.; Loyalka, S.K. Handbook of Alternative Fuel Technologies; CRC Press, Taylor & Francis Group LLC: Boca Raton, FL, USA, 2007. [Google Scholar] [CrossRef]
  5. Aden, A.; Ruth, M.; Ibsen, K.; Jechura, J.; Neeves, K.; Sheehan, J.; Wallace, B.; Montague, L.; Slayton, A.; Lukás, J. Lignocellulosic Biomass to Ethanol Process Design and Economics Utilizing Co-Current Dilute Acid Prehydrolysis and Enzymatic Hydrolysis for Corn Stover; NREL: Golden, CO, USA, 2002; Available online: https://www.nrel.gov/docs/fy02osti/32438.pdf (accessed on 8 February 2017).
  6. Grand View Research Inc., Activated Carbon Market Size, Share & Trends Analysis Report by Product (Powdered Activated Carbon, Granular Activated Carbon), by Application, by End-use, and Segment Forecasts, 2018–2024. 2018. Available online: https://www.grandviewresearch.com/industry-analysis/activated-carbon-market (accessed on 11 March 2020).
  7. Marsh, H.; Rodríguez-Reinoso, F. Activated Carbon; Elsevier: Amsterdam, The Netherlands, 2006; pp. 27–316. [Google Scholar]
  8. Correa, C.R.; Stollovsky, M.; Hehr, T.; Rauscher, Y.; Rolli, B.; Kruse, A. Influence of the Carbonization Process on Activated Carbon Properties from Lignin and Lignin-Rich Biomasses. ACS Sustain. Chem. Eng. 2017, 5, 8222–8233. [Google Scholar] [CrossRef]
  9. Sun, Y.; Yang, G.; Zhang, J.; Wang, Y.; Yao, M. Activated Carbon Preparation from Lignin by H3PO4 Activation and Its Application to Gas Separation. Chem. Eng. Technol. 2011, 35, 309–316. [Google Scholar] [CrossRef]
  10. Sebbahi, S.; Ahmido, A.; Kifani-Sahban, F.; El Hajjaji, S.; Zoulalian, A. Preoxidation and Activation of the Lignin Char: Carbonization and Oxidation Procedures. J. Eng. 2014, 2014, 1–9. [Google Scholar] [CrossRef] [Green Version]
  11. Kang, S.; Li, X.; Fan, J.; Chang, J. Characterization of Hydrochars Produced by Hydrothermal Carbonization of Lignin, Cellulose, d-Xylose, and Wood Meal. Ind. Eng. Chem. Res. 2012, 51, 9023–9031. [Google Scholar] [CrossRef]
  12. Demir, M.; Kahveci, Z.; Aksoy, B.; Palapati, N.K.R.; Subramanian, A.; Cullinan, H.T.; El-Kaderi, H.M.; Harris, C.T.; Gupta, R.B. Graphitic Biocarbon from Metal-Catalyzed Hydrothermal Carbonization of Lignin. Ind. Eng. Chem. Res. 2015, 54, 10731–10739. [Google Scholar] [CrossRef]
  13. Dinjus, E.; Kruse, A.; Tröger, N. Hydrothermal Carbonization - 1. Influence of Lignin in Lignocelluloses. Chem. Eng. Technol. 2011, 34, 2037–2043. [Google Scholar] [CrossRef]
  14. Nowakowski, D.; Bridgwater, A.; Elliott, D.C.; Meier, D.; De Wild, P. Lignin fast pyrolysis: Results from an international collaboration. J. Anal. Appl. Pyrolysis 2010, 88, 53–72. [Google Scholar] [CrossRef] [Green Version]
  15. Dell’Orco, S.; Miliotti, E.; Lotti, G.; Rizzo, A.M.; Rosi, L.; Chiaramonti, D. Hydrothermal Depolymerization of Biorefinery Lignin-Rich Streams: Influence of Reaction Conditions and Catalytic Additives on the Organic Monomers Yields in Biocrude and Aqueous Phase. Energies 2020, 13, 1241. [Google Scholar] [CrossRef] [Green Version]
  16. Kuznetsov, B.; Shchipko, M. The conversion of wood lignin to char materials in a fluidized bed of AlCuCr oxide catalysts. Bioresour. Technol. 1995, 52, 13–19. [Google Scholar] [CrossRef]
  17. Baklanova, O.; Plaksin, G.; Drozdov, V.A.; Duplyakin, V.; Chesnokov, N.; Kuznetsov, B. Preparation of microporous sorbents from cedar nutshells and hydrolytic lignin. Carbon 2003, 41, 1793–1800. [Google Scholar] [CrossRef]
  18. Mergner, R.; Janssen, R.; Rutz, D.; de Bari, I.; Sissot, F. Lignocellulosic Ethanol Process and Demonstration—A handbook—Part I; WIP Renewable Energies: Munich, Germany, 2013; Available online: www.biolyfe.eu (accessed on 10 May 2019).
  19. Miliotti, E.; Dell’Orco, S.; Lotti, G.; Rizzo, A.M.; Rosi, L.; Chiaramonti, D. Lignocellulosic Ethanol Biorefinery: Valorization of Lignin-Rich Stream through Hydrothermal Liquefaction. Energies 2019, 12, 723. [Google Scholar] [CrossRef] [Green Version]
  20. Miliotti, E.; Casini, D.; Rosi, L.; Lotti, G.; Rizzo, A.M.; Chiaramonti, D. Lab-scale pyrolysis and hydrothermal carbonization of biomass digestate: Characterization of solid products and compliance with biochar standards. Biomass Bioenergy 2020, 139, 105593. [Google Scholar] [CrossRef]
  21. Sluiter, A.; Hames, B.; Ruiz, R.; Scarlata, C.; Sluiter, J.; Templeton, D. Determination of Sugars, Byproducts, and Degradation Products in Liquid Fraction Process Samples; NREL: Golden, CO, USA, 2008. [Google Scholar]
  22. Lowell, S.; Shields, J.E.; Thomas, M.A.; Thommes, M. Mesopore Analysis. In Characterization of Porous Solids and Powders: Surface Area, Pore Size and Density, 1st ed.; Kluwer Academic Press: Dordrecht, The Netherlands, 2004; pp. 101–128. [Google Scholar] [CrossRef]
  23. Rouquerol, J.; Llewellyn, P.; Rouquérol, F. Is the bet equation applicable to microporous adsorbents? Stud. Surf. Sci. Catal. 2007, 160, 49–56. [Google Scholar] [CrossRef]
  24. Thommes, M.; Kaneko, K.; Neimark, A.V.; Olivier, J.P.; Rodriguez-Reinoso, F.; Rouquerol, J.; Sing, K.S.W. Physisorption of gases, with special reference to the evaluation of surface area and pore size distribution (IUPAC Technical Report). Pure Appl. Chem. 2015, 87, 1051–1069. [Google Scholar] [CrossRef] [Green Version]
  25. Stark, N.M.; Yelle, D.J.; Agarwal, U. Techniques for Characterizing Lignin. In Lignin in Polymer Composites; Omar, F., Mohini, S., Eds.; Elsevier: Amsterdam, The Netherlands, 2016; pp. 49–66. [Google Scholar] [CrossRef]
  26. Rodríguez-Mirasol, J.; Cordero, T.; Rodriguez, J. Preparation and characterization of activated carbons from eucalyptus kraft lignin. Carbon 1993, 31, 87–95. [Google Scholar] [CrossRef]
  27. Antal, M.J.; Grønli, M.G. The Art, Science, and Technology of Charcoal Production†. Ind. Eng. Chem. Res. 2003, 42, 1619–1640. [Google Scholar] [CrossRef]
  28. Bykov, I. Characterization of Natural and Technical Lignins using FTIR Spectroscopy. Independent Thesis, 2008. Available online: http://www.diva-portal.org/smash/get/diva2:1016107/FULLTEXT01.pdf (accessed on 20 July 2020).
  29. Santos, J.I.; Fillat, U.; Martin-Sampedro, R.; Ballesteros, I.; Manzanares, P.; Ballesteros, M.; Eugenio, M.E.; Ibarra, D. Lignin-enriched Fermentation Residues from Bioethanol Production of Fast-growing Poplar and Forage Sorghum. Bioresources 2015, 10, 5203–5214. [Google Scholar] [CrossRef] [Green Version]
  30. Chen, W.; Shi, S.; Nguyen, T.; Chen, M.; Zhou, X. Effect of Temperature on the Evolution of Physical Structure and Chemical Properties of Bio-char Derived from Co-pyrolysis of Lignin with High-Density Polyethylene. Bioresources 2016, 11, 3923–3936. [Google Scholar] [CrossRef] [Green Version]
  31. Júnior, A.F.D.; Oliveira, R.N.; Deglise, X.; De Souza, N.D.; Brito, J.O. Infrared spectroscopy analysis on charcoal generated by the pyrolysis of Corymbia. citriodora wood. Rev. Matéria (Rio de Janeiro) 2019, 24. [Google Scholar] [CrossRef]
  32. Khanna, R.; Ikram-Ul-Haq, M.; Rawal, A.; Rajarao, R.; Sahajwalla, V.; Cayumil, R.; Mukherjee, P.S. Formation of carbyne-like materials during low temperature pyrolysis of lignocellulosic biomass: A natural resource of linear sp carbons. Sci. Rep. 2017, 7, 16832. [Google Scholar] [CrossRef] [PubMed] [Green Version]
  33. Diaz, E.; Manzano, F.J.; Martínez, J.A.V.; Rodriguez, J.J.; De La Rubia, M. Ángeles Low-Cost Activated Grape Seed-Derived Hydrochar through Hydrothermal Carbonization and Chemical Activation for Sulfamethoxazole Adsorption. Appl. Sci. 2019, 9, 5127. [Google Scholar] [CrossRef] [Green Version]
  34. Purnomo, C.W.; Castello, D.; Fiori, L. Granular Activated Carbon from Grape Seeds Hydrothermal Char. Appl. Sci. 2018, 8, 331. [Google Scholar] [CrossRef] [Green Version]
  35. Correa, C.R.; Bernardo, M.; Ribeiro, R.P.; Esteves, I.A.; Kruse, A.; Esteves, I.A. Evaluation of hydrothermal carbonization as a preliminary step for the production of functional materials from biogas digestate. J. Anal. Appl. Pyrolysis 2017, 124, 461–474. [Google Scholar] [CrossRef]
  36. Kambo, H.S.; Dutta, A. A comparative review of biochar and hydrochar in terms of production, physico-chemical properties and applications. Renew. Sustain. Energy Rev. 2015, 45, 359–378. [Google Scholar] [CrossRef]
  37. Reza, M.T.; Rottler, E.; Herklotz, L.; Wirth, B. Hydrothermal carbonization (HTC) of wheat straw: Influence of feedwater pH prepared by acetic acid and potassium hydroxide. Bioresour. Technol. 2015, 182, 336–344. [Google Scholar] [CrossRef]
  38. Funke, A.; Ziegler, F. Hydrothermal carbonization of biomass: A summary and discussion of chemical mechanisms for process engineering. Biofuels Bioprod. Biorefining 2010, 4, 160–177. [Google Scholar] [CrossRef]
  39. Hoekman, S.K.; Broch, A.; Robbins, C. Hydrothermal Carbonization (HTC) of Lignocellulosic Biomass. Energy Fuels 2011, 25, 1802–1810. [Google Scholar] [CrossRef]
  40. Sınag, A.; Gülbay, S.; Uskan, B.; Güllü, M. Comparative studies of intermediates produced from hydrothermal treatments of sawdust and cellulose. J. Supercrit. Fluids 2009, 50, 121–127. [Google Scholar] [CrossRef]
  41. Castello, D.; Kruse, A.; Fiori, L. Low temperature supercritical water gasification of biomass constituents: Glucose/phenol mixtures. Biomass Bioenergy 2015, 73, 84–94. [Google Scholar] [CrossRef]
Figure 1. Workflow of the experimental activities.
Energies 13 04101 g001
Figure 2. Solid yields from the physical (a) and chemical (b) activation experiments (the error bar represents the absolute standard deviation).
Energies 13 04101 g002
Figure 3. Adsorption isotherms (N2, 77 K) of the physically (a) and chemically (b) activated carbons.
Energies 13 04101 g003
Figure 4. Pore size distribution of selected physically activated carbons (a,b) and chemically activated carbons (c,d). (a,c) show a comparison between the ACs which were pretreated by HTC and which reported the highest and the lowest BET area. (b,d) show a comparison between the AC which was pretreated by HTC, showing the highest BET area, and the AC without HTC pretreatment. In general, the higher HTC pretreatment severity, the lower the AC quality with respect to BET surface area and microporosity, for both the physical and the chemical activations. On the base of the particular kind of feedstock and activation conditions, and comparing the characteristics of the hydrochar-activated samples versus pyrochar-activated samples, it can be concluded that the HTC pretreatment is deleterious for AC quality when combined with physical activation, and that the pyrolysis pretreatment leads to results similar to that of mild hydrothermal carbonization, producing a better quality AC. The HTC step should be avoided also for chemical activation.
Energies 13 04101 g004aEnergies 13 04101 g004b
Figure 5. Results from the GC-MS (a) and HPLC (b) of the aqueous phase from the HTC of LRS. Error bars represent absolute standard deviation.
Energies 13 04101 g005
Table 1. Summary of the adopted experimental conditions.
PretreatmentPretreatment Temperature [°C]Pretreatment Time [h]ActivationActivation Temperature [°C]Activating Agent Ratio (d.b.)
None--Physical, CO2, 2 h700-
None--Physical, CO2, 2 h800-
None--Chemical, KOH, 1 h6001:1
None--Chemical, KOH, 1 h6002:1
None--Chemical, KOH, 1 h7001:1
None--Chemical, KOH, 1 h7002:1
None--Chemical, KOH, 1 h8001:1
None--Chemical, KOH, 1 h8002:1
Slow pyrolysis5502Physical, CO2, 2 h700-
Hydrothermal carbonization2002Physical, CO2, 2 h700-
Hydrothermal carbonization2004Physical, CO2, 2 h700-
Hydrothermal carbonization2702Physical, CO2, 2 h700-
Hydrothermal carbonization2704Physical, CO2, 2 h700-
Hydrothermal carbonization2002Chemical, KOH, 1 h6001:1
Hydrothermal carbonization2004Chemical, KOH, 1 h6001:1
Hydrothermal carbonization2702Chemical, KOH, 1 h6001:1
Hydrothermal carbonization2704Chemical, KOH, 1 h6001:1
Table 2. Properties of the lignin-rich stream from poplar fermentation compared with pulp and paper lignin.
Parameteru.m.Lignin-Rich Stream (Present Study)ALM Lignin [14]
Moisture% w/w (w.b.)69.7n.a.
Ash% w/w (d.b.)3.0<4.0
Volatile matter% w/w (d.b.)69.2n.a.
Fixed Carbon% w/w (d.b.)27.3n.a.
Higher Heating ValueMJ kg−1 (d.b.)22.8n.a.
Carbon% w/w (d.b.)55.161.0
Hydrogen% w/w (d.b.)5.97.0
Nitrogen% w/w (d.b.)1.20.9
Sulphur% w/w (d.b.)0.2<0.03
Oxygen% w/w (d.b.)34.631.0
Lignin content% w/w (d.a.f.)53.094.0 *
Structural sugars% w/w (d.a.f.)35.82.2 *
n.a.: not available, u.m.: unity of measure, * values are on dry basis.
Table 3. Results from the preliminary physical activation of LRS.
ParameterLRSPyrocharPhysically Activated Carbon
Activation temperature [°C]--700800
Activation time [h]--22
BET area [m2 g−1]33706001078
Micropore area [m2 g−1]-309525949
External surface area [m2 g−1]-6168132
Micropore area (%)-838788
Micropore volume [cm3 g−1]-0.140.210.39
Total pore volume [cm3 g−1]0.010.190.280.54
Micropore volume (%)-717772
Avg. Pore diameter [nm]17.272.061.842.00
Table 4. Results from the preliminary chemical activation of LRS.
ParameterLRSChemically Activated Carbon
Activation temperature [°C]-600600700700800800
KOH:LRS (d.b.)-1:12:11:12:11:12:1
Activation yield [% w/w] d.b.-29.815.78.110.70.23.6
BET area [m2 g−1]3675989143711881484558
Micropore area [m2 g−1]<06238071234861793244
External surface area [m2 g−1]<046174188319691314
Micropore area (%)Null928286725344
Micropore volume [cm3 g−1]<00.240.340.550.390.350.11
Total pore volume [cm3 g−1]0.010.310.610.730.751.391.02
Micropore volume (%)Null795675522510
Avg. Pore diameter [nm]17.271.822.472.032.523.737.29
Table 5. Results from the elemental analysis of the chars.
SampleCarbonHydrogenNitrogenOxygen *H/CO/C
% w/w (d.b.)% w/w (d.b.)% w/w (d.b.)% w/w (d.b.)
LRS55.15.91.237.81.280.51
HTC 200 °C—2 h57.85.91.135.21.230.46
HTC 200 °C—4 h58.55.91.334.41.200.44
HTC 270 °C—2 hn.m.n.m.n.m.n.m.n.m.n.m.
HTC 270 °C—4 h71.15.61.621.70.950.23
SP 550 °C—2 h75.02.61.920.50.420.21
n.m.: not measured, * evaluated by difference without considering the S and the ash content.
Table 6. Results from the physical and chemical activation of LRS.
ParameterPhysically Activated CarbonChemically Activated Carbon
PretreatmentSPHTCNoneHTC
Pretr. temperature [°C]550200200270270-200200270270
Pretr. time [h]22424-2424
BET area [m2 g−1]6006315401617767550260023081
Micropore area [m2 g−1]5255975241395862345254118549
External surface area [m2 g−1]68362922194650594532
Micropore area (%)0.870.950.970.860.75920.900.900.810.61
Micropore volume [cm3 g−1]0.210.230.200.060.030.240.180.220.080.02
Total pore volume [cm3 g−1]0.280.270.230.080.050.310.270.320.220.08
Micropore volume (%)0.770.850.870.730.60790.660.670.340.30
Avg. Pore diameter [nm]1.841.721.722.112.421.822.182.153.893.83

