Effect of Various Coolant Mass Flow Rates on Sealing Effectiveness of Turbine Blade Rim Seal at First Stage Gas Turbine Experimental Facility


Abstract
:1. Introduction
- Pressure difference by the shape of gas turbine vane.
- Gas turbine blade rotation.
- Gas turbine off-design operation.
2. Experiment Method
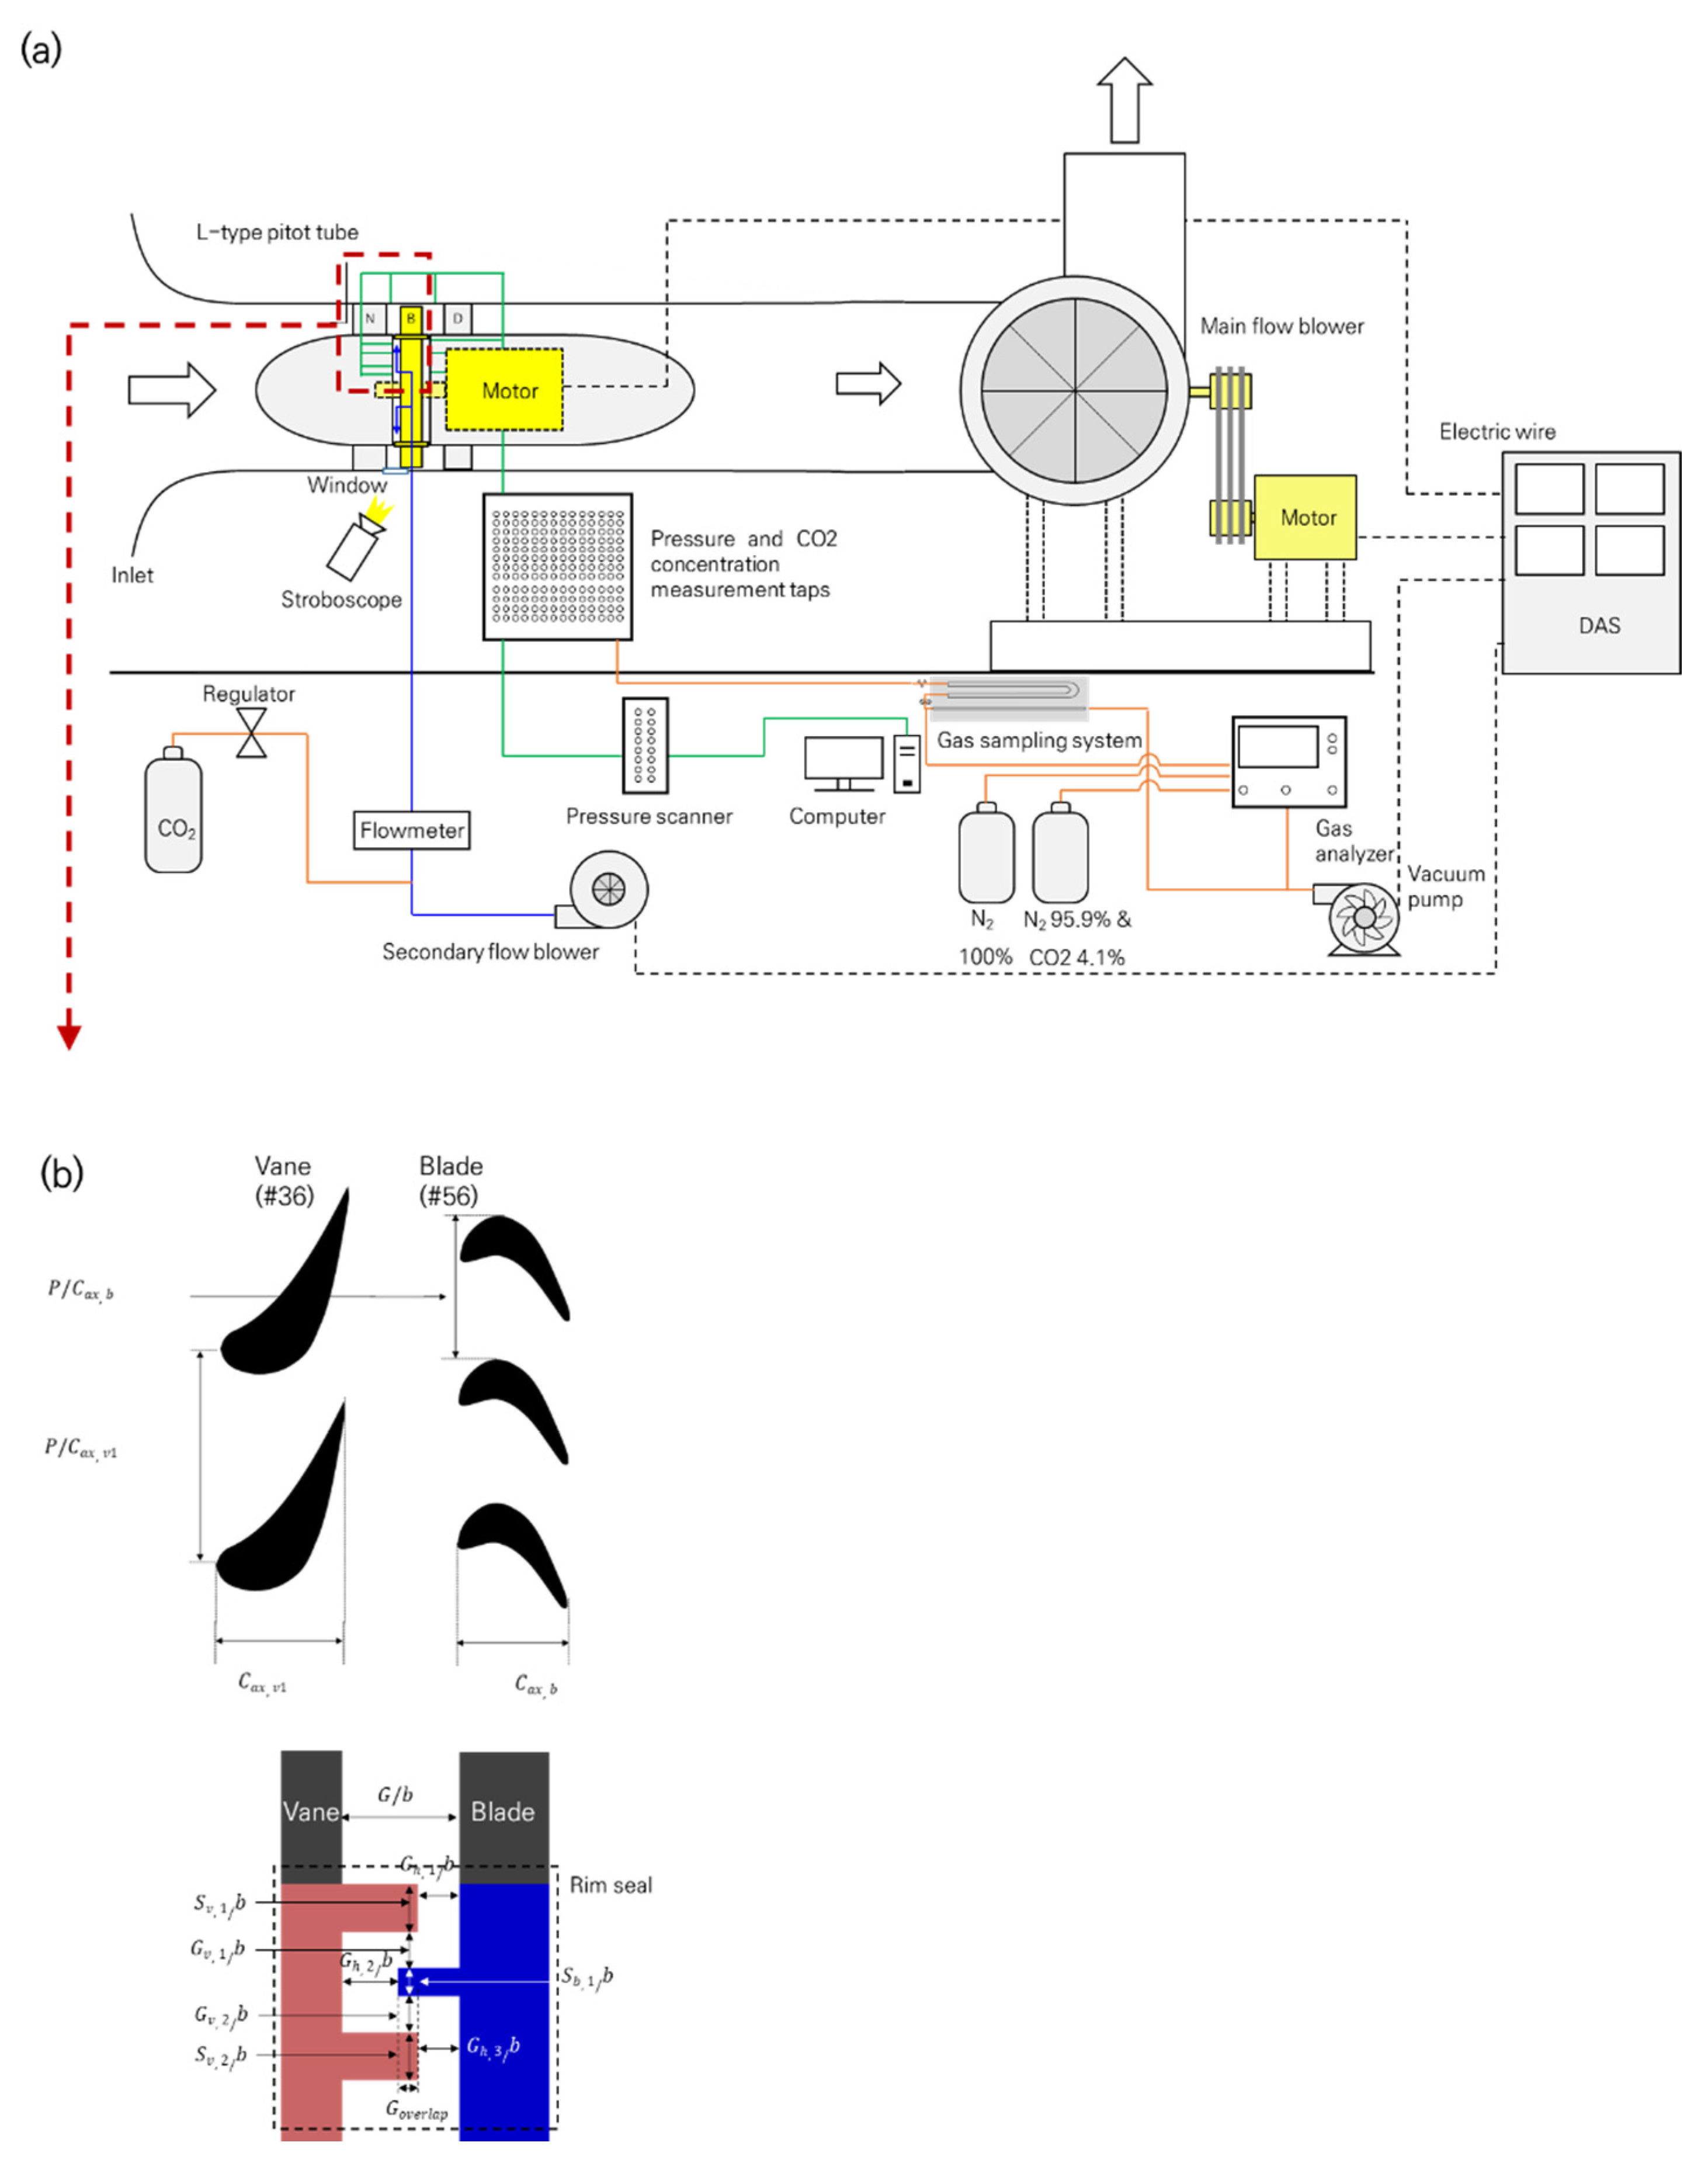
2.1. Experimental Facility
2.2. Pressure Measurement Method
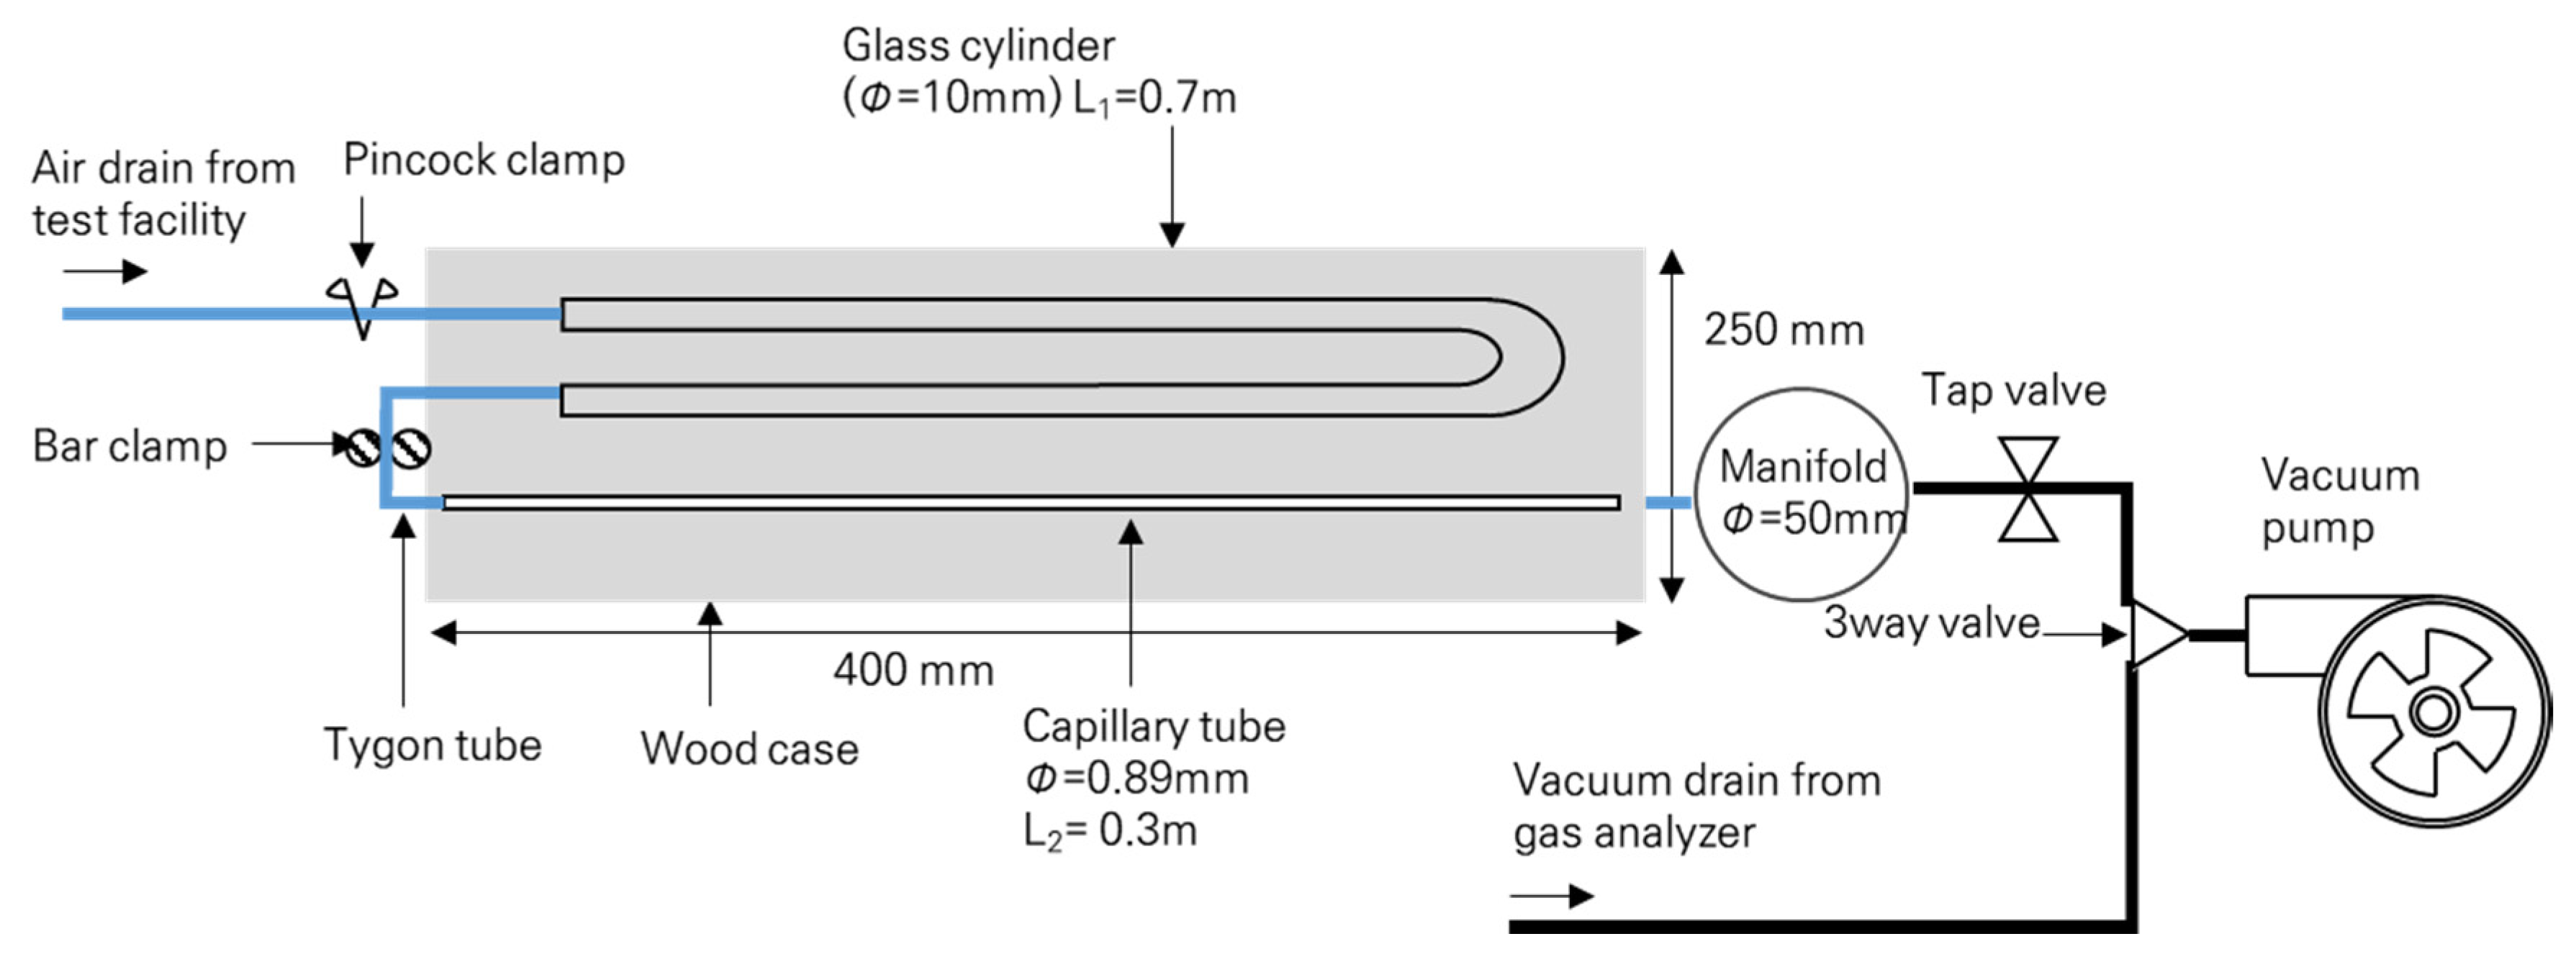
2.3. Carbon Dioxide Concentration Measurement Method
2.4. Experimental Parameters and Non-Dimensional Number Definitions
2.5. Uncertainty Analysis
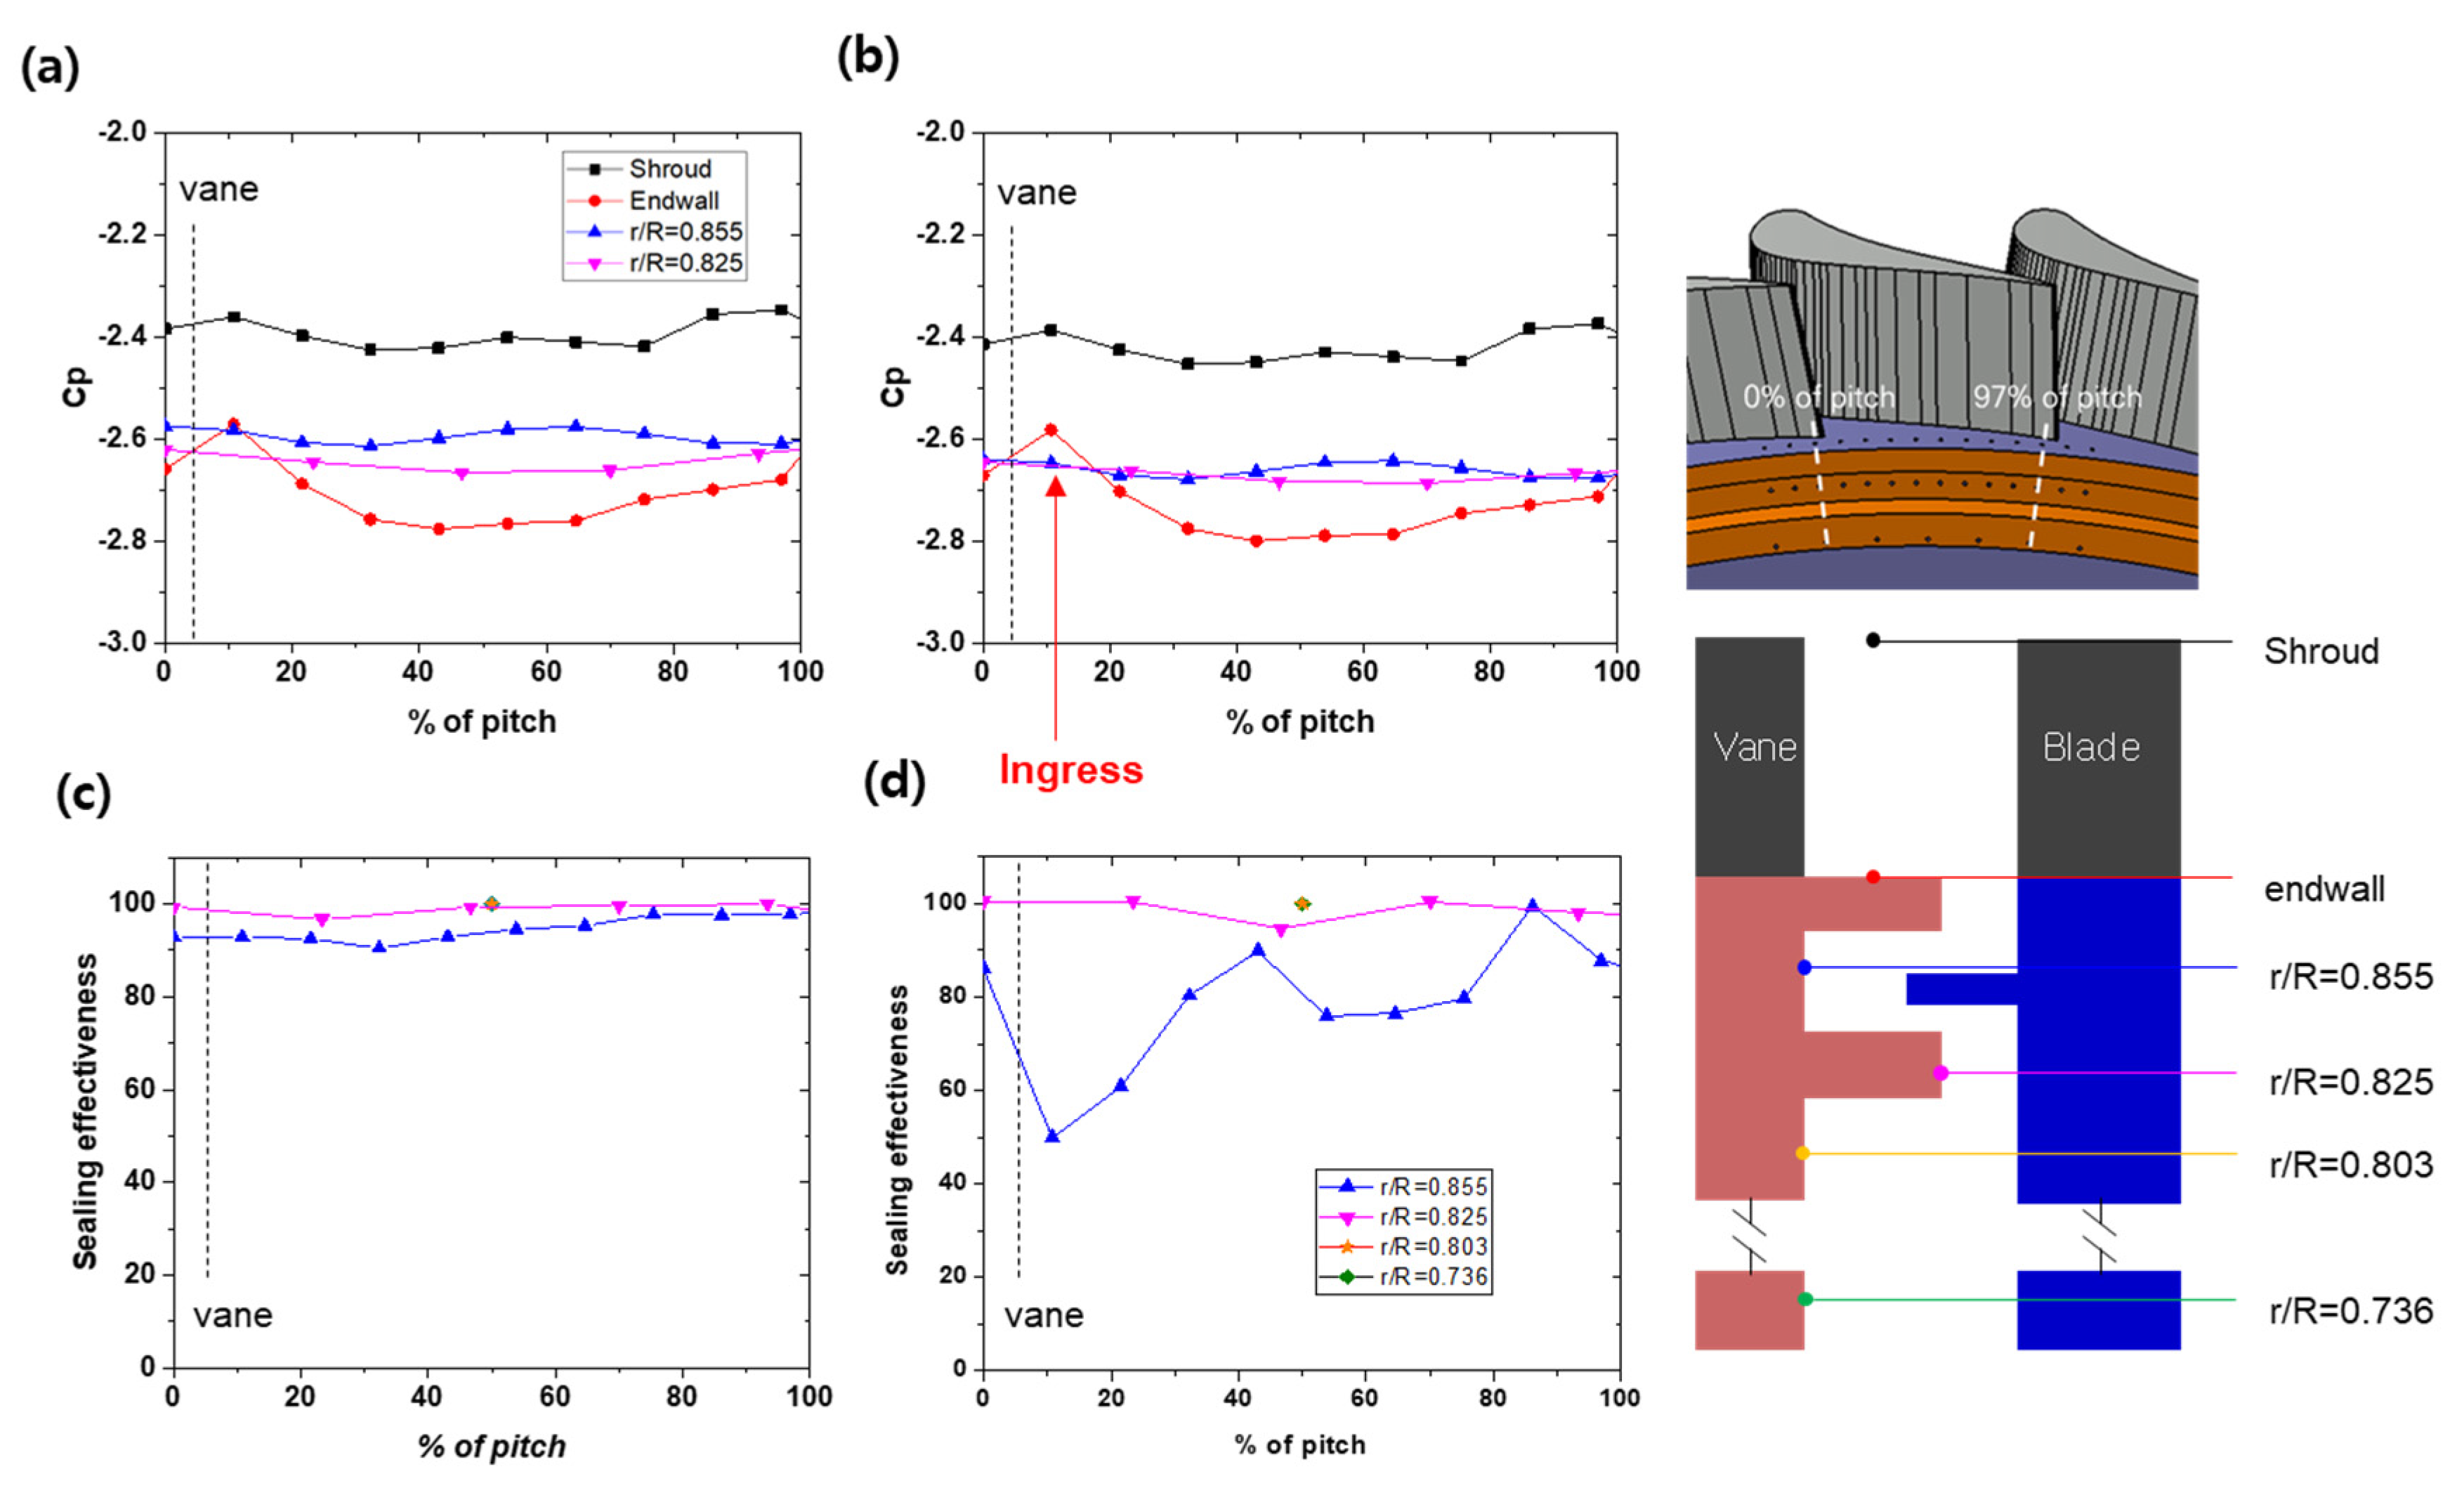
3. Results and Discussion
4. Conclusions
Author Contributions
Funding
Conflicts of Interest
Nomenclature
| b | turbine blade hub radius of turbine blade (m) |
| Cax,v | vane axial chord length (m) |
| Cax,b | blade axial chord length (m) |
| Cp | pressure coefficient |
| Cw | non-dimensional secondary mass flowrate () |
| ca | CO2 concentration of ambient air |
| co | CO2 concentration at r/R = 0.7 |
| ci | local CO2 concentration |
| dp/Cax | distance from the vane trailing edge to measurement taps |
| G | gap between rim seal of vane and blade (m) |
| Goverlap | rim seal overlap length of the rim seal (m) |
| L | length of the glass cylinder (m) |
| mass flow rate (kg s−1) | |
| Pt | total pressure at inlet (kg m−1 s−2) |
| Ps,i | local static pressure (kg m−1 s−2) |
| P/Cax,v | vane pitch (nondimensional) |
| P/Cax,b | blade pitch (nondimensional) |
| Re | Reynolds number () |
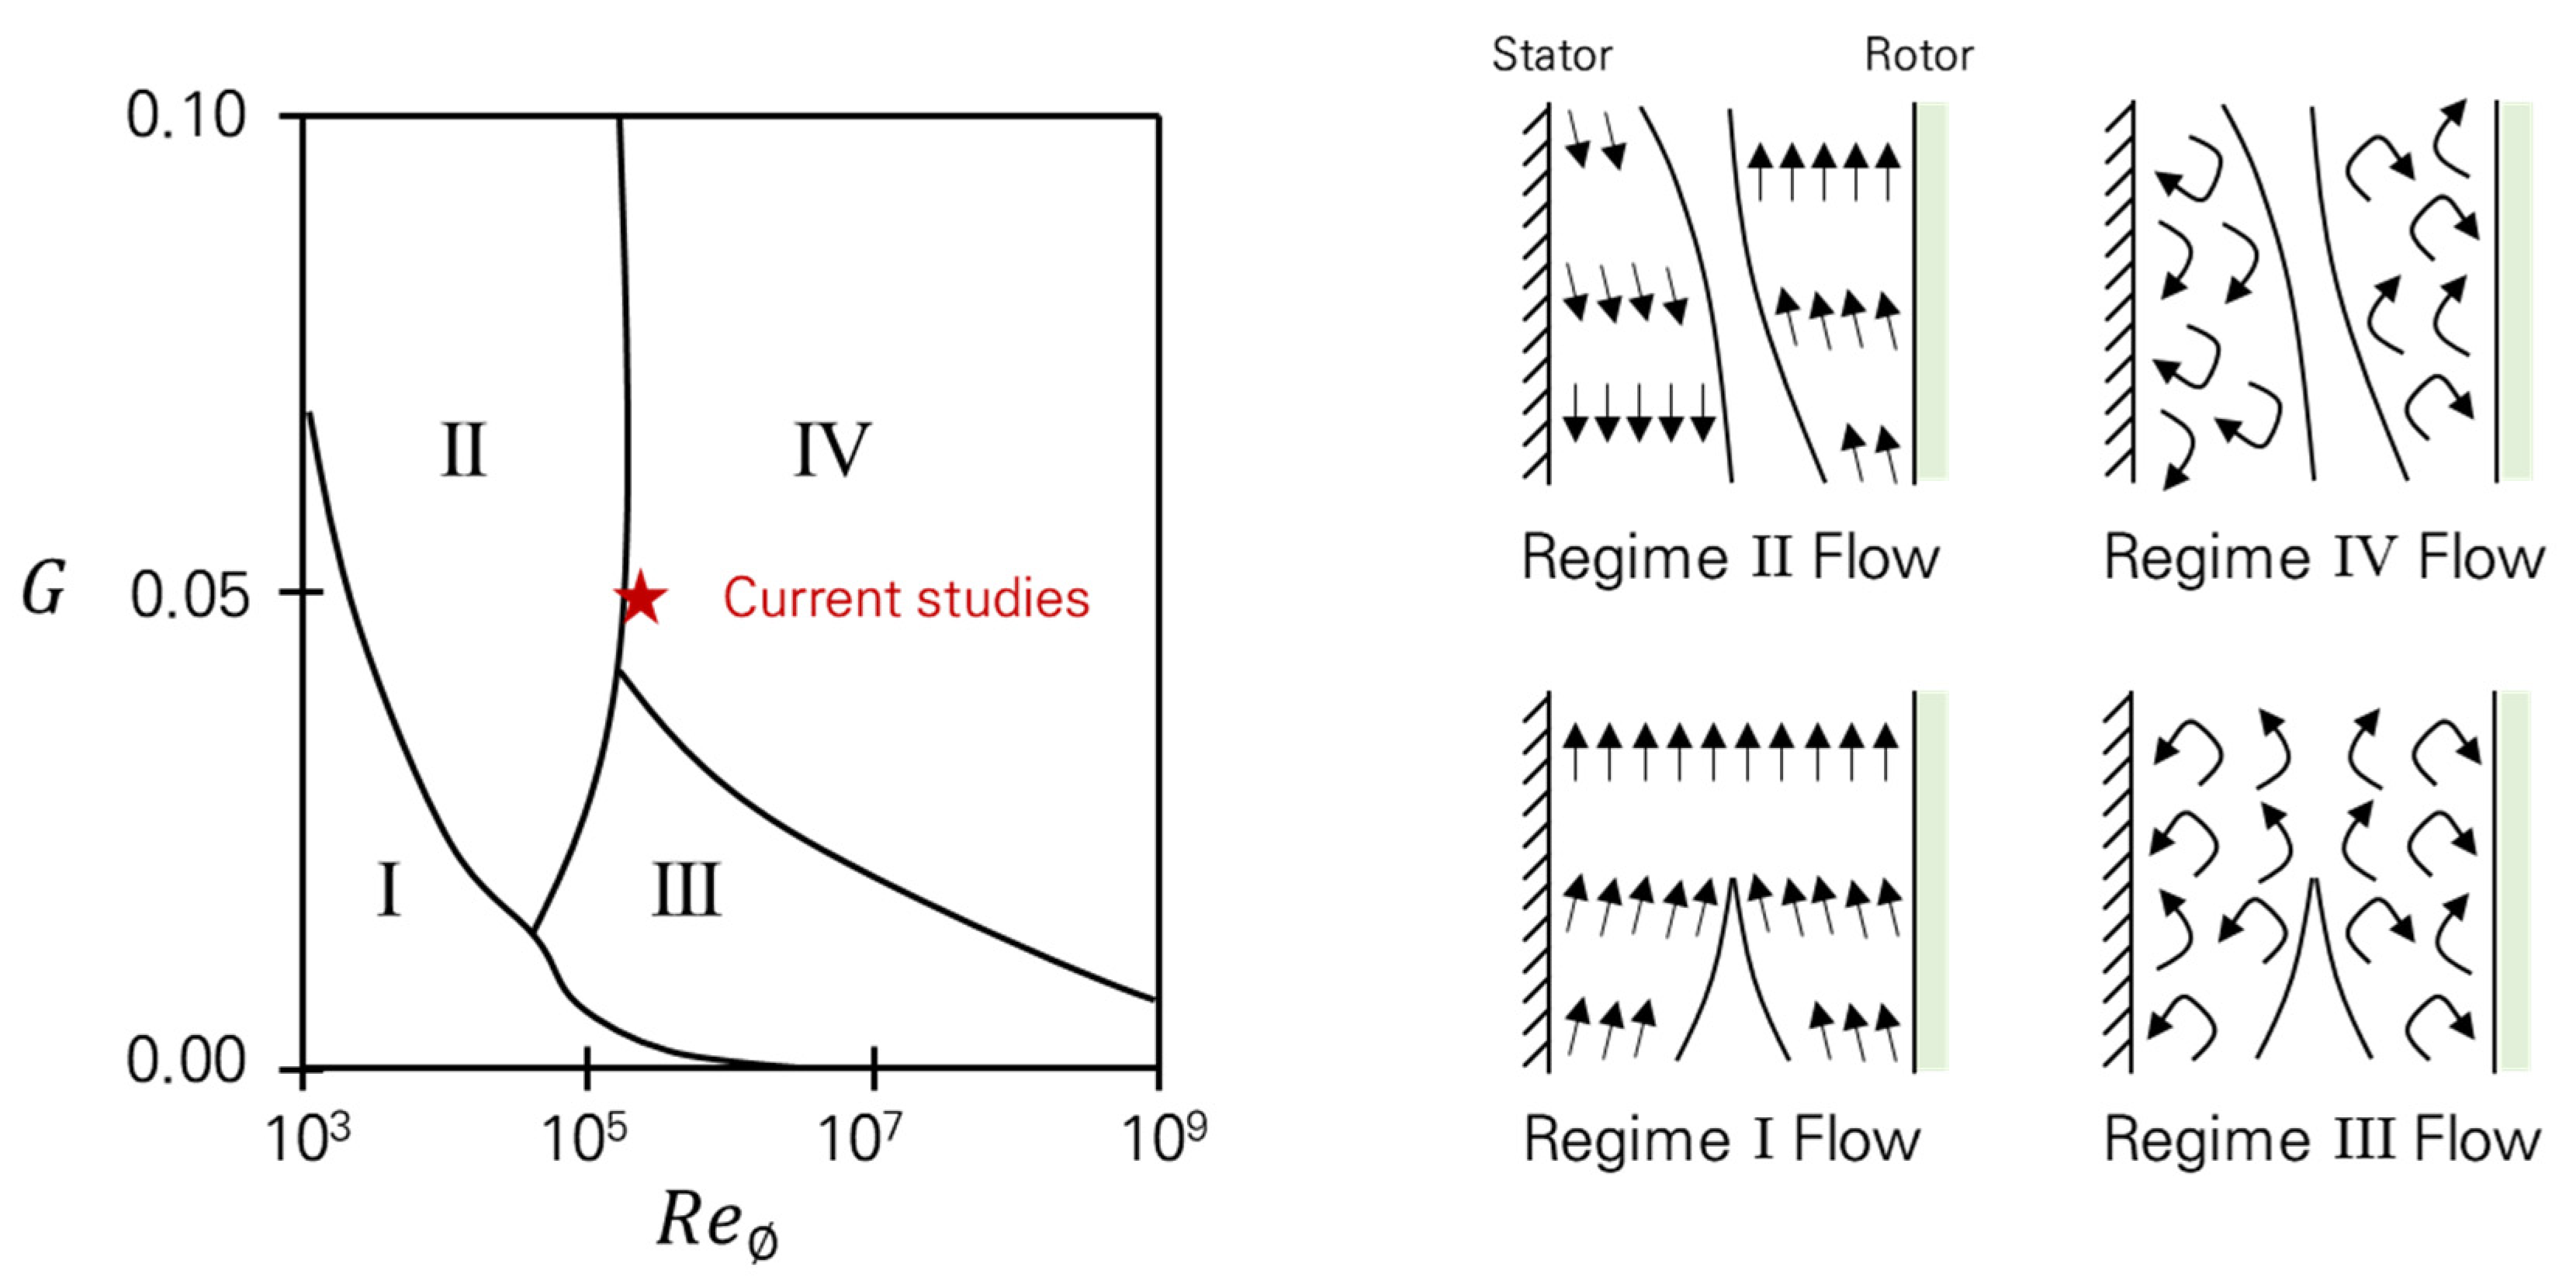
| Reϕ | Rotational Reynolds number () |
| S | blade span (m) |
| Sv | vane rim seal thickness (m) |
| Sb | blade rim seal thickness (m) |
| V | velocity of main air flow (m s−1) |
| U | circumferential velocity of turbine blade (m s−1) |
| x | coordinate in main flow direction |
| r | coordinate in radial direction |
| θ | coordinate in circumferential direction Greek Symbols |
| α1 | blade inlet angle (°) |
| α2 | blade exit angle (°) |
| α | turning angle (°) |
| density of air (kg m−3) | |
| φ | flow coefficient |
| Ω | rotational speed (s−1) |
| μ | dynamic viscosity of air (kg m−1s−1) |
| sealing effectiveness |
References
- Chupp, R.E.; Hendricks, R.C.; Lattime, S.B.; Steinetz, B.M. Sealing in turbomachinery. J. Pro. Power 2006, 22, 313–349. [Google Scholar] [CrossRef]
- Bohn, D.; Wolff, M. Improved formulation to determine minimum sealing flow–Cw,min–for different sealing configurations. In Proceedings of the ASME Turbo Expo 2003, Collocated with the 2003 International Joint Power Generation Conference, Atlanta, GA, USA, 16 June 2003; pp. 1041–1049. [Google Scholar]
- Bohn, D.; Rudzinski, B.; Sürken, N.; Gärtner, W. Influence of rim seal geometry on hot gas ingestion into the upstream cavity of an axial turbine stage. In Proceedings of the ASME 1999 International Gas Turbine and Aeroengine Congress and Exhibition, New York, NY, USA, 7 June 1999; pp. 1–10. [Google Scholar]
- Coren, D.D.; Atkins, N.R.; Turner, J.R.; Eastwood, D.E.; Davies, S.; Childs, P.R.N.; Scanlon, T.S. An advanced multi-configuration stator well cooling test facility. In Proceedings of the ASME Turbo Expo 2010: Power for Land, Sea, and Air, Glasgow, UK, 14 June 2010; pp. 1259–1270. [Google Scholar]
- Gentilhomme, O.; Hills, N.J.; Turner, A.B.; Chew, J.W. Measurement and analysis of ingestion through a turbine rim seal. ASME J. Turbo. 2003, 125, 505–512. [Google Scholar] [CrossRef] [Green Version]
- Sangan, C.M.; Pountney, O.J.; Zhou, K.; Wilson, M.; Michael Owen, J.; Lock, G.D. Experimental Measurements of Ingestion Through Turbine Rim Seals—Part I: Externally Induced Ingress. J. Turbo. 2013, 135, 021012. [Google Scholar] [CrossRef]
- Pau, M.; Paniagua, G.; Delhaye, D.; de La Loma, A.; Ginibre, P. Aerothermal impact of stator-rim purge flow and rotor-platform film cooling on a transonic turbine stage. J. Turbo. 2010, 132, 021006. [Google Scholar] [CrossRef]
- Bayley, F.J.; Owen, J.M. The fluid dynamics of a shrouded disk system with a radial outflow of coolant. J. Eng. Power 1970, 92, 335–341. [Google Scholar] [CrossRef]
- Owen, J.M.; Rogers, R.H. Flow and Heat Transfer in Rotating-Disc Systems, Volume 1: Rotor-Stator Systems; Research Studies Press: Taunton, UK, 1989. [Google Scholar]
- Owen, J.M.; Rogers, R.H. Flow and Heat Transfer in Rotating-Disc Systems, Volume 2: Rotating Cavities; Research Studies Press: Taunton, UK, 1995. [Google Scholar]
- Owen, J.M. Prediction of Ingestion through Turbine Rim Seals. Part I: Rotationally Induced Ingress. J. Turbo. 2011, 133, 031005. [Google Scholar] [CrossRef]
- Owen, J.M. Prediction of Ingestion through Turbine Rim Seals. Part II: Externally Induced and Combined Ingress. J. Turbo. 2011, 133, 031006. [Google Scholar] [CrossRef]
- Owen, J.M.; Zhou, K.; Pountney, O.J.; Wilson, M.; Lock, G.D. Prediction of Ingress through Turbine Rim Seals. Part 1: Externally-Induced Ingress. J. Turbo. 2012, 134, 031012. [Google Scholar] [CrossRef]
- Owen, J.M.; Pountney, O.J.; Lock, G.D. Prediction of Ingress through Turbine Rim Seals. Part 2: Combined Ingress. J. Turbo. 2012, 134, 031013. [Google Scholar] [CrossRef]
- Owen, J.M. Theoretical modelling of hot gas ingestion through turbine rim seals. Pro. Power 2012, 1, 1–11. [Google Scholar]
- Zhou, K.; Wood, S.N.; Owen, J.M. Statistical and theoretical models of ingestion through turbine rim seals. J. Turbo. 2013, 135, 021014. [Google Scholar] [CrossRef]
- Mear, L.I.; Owen, J.M.; Lock, G.D. Theoretical Model to Determine Effect of Ingress on Turbine Disks. J. Eng. Gas Turbines Power 2016, 138, 3. [Google Scholar]
- Johnson, B.V.; Wang, C.Z.; Roy, R.P. A Rim Seal Orifice Model with 2 Cds and Effects of Swirl in Seals. In Proceedings of the ASME Turbo Expo 2008: Power for Land, Sea, and Air, Berlin, Germany, 9 June 2008; pp. 1531–1547. [Google Scholar]
- Zhang, Z.; Ma, H. Application of Phase-Locked PIV Technique to the Measurements of Flow Field in a Turbine Stage. J. Therm. Sci. 2020, 29, 1–9. [Google Scholar] [CrossRef]
- Cao, C.; Chew, J.W.; Millington, P.R.; Hogg, S.I. Interaction of rim seal and annulus flows in an axial flow turbine. J. Eng. Gas Turbines Power 2004, 126, 786–793. [Google Scholar] [CrossRef] [Green Version]
- Hills, N.J.; Chew, J.W.; Turner, A.B. Computational and mathematical modeling of turbine rim seal ingestion. J. Turbo. 2020, 124, 306–315. [Google Scholar] [CrossRef] [Green Version]
- Teuber, R.; Li, Y.S.; Maltson, J.; Wilson, M.; Lock, G.D.; Owen, J.M. Computational extrapolation of turbine sealing effectiveness from test rig to engine conditions. In Proceedings of the ASME Turbo Expo 2012: Turbine Technical Conference and Exposition, Berlin, Germany, 9 June 2012; pp. 167–178. [Google Scholar]
- Ding, Z.; Palafox, P.; Moore, K.; Chupp, R.; Kirtley, K. A New 1.5-Stage Turbine Wheelspace Hot Gas Ingestion Rig (HGIR): Part II—CFD Modeling and Validation. In Proceedings of the ASME Turbo Expo 2013: Turbine Technical Conference and Exposition, San Antonio, TX, USA, 3 June 2013; pp. 1–8. [Google Scholar]
- Tucker, P.G. Computation of unsteady turbomachinery flows: Part 2—LES and hybrids. Prog. Aerosp. Sci. 2011, 47, 546–569. [Google Scholar] [CrossRef]
- Chilla, M.; Hodson, H.; Newman, D. Unsteady interaction between annulus and turbine rim seal flows. J. Turbo. 2013, 135, 051024. [Google Scholar] [CrossRef]
- Rabs, M.; Benra, F.K.; Dohmen, H.J.; Schneider, O. Investigation of flow instabilities near the rim cavity of a 1.5 stage gas turbine. In Proceedings of the ASME Turbo Expo 2009: Power for Land, Sea, and Air, Orlando, FL, USA, 8 June 2009; pp. 1263–1272. [Google Scholar]
- Wu, H.; Li, P.; Li, Y. Simulation of unsteady state performance of a secondary air system by the 1D-3D-Structure coupled method. J. Therm. Sci. 2016, 25, 68–77. [Google Scholar] [CrossRef]
- Gao, J.; Du, Q.; Liu, J.; Liu, G.; Wang, P.; Liu, H.; Du, M. Flow development through HP & LP turbines, Part I: Inward rotating cavity flow with superimposed throughflow. J. Therm. Sci. 2017, 26, 297–307. [Google Scholar]
- Hu, J.; Du, Q.; Liu, J.; Wang, P.; Liu, G.; Liu, H.; Du, M. Flow development through HP & LP turbines, Part II: Effects of the hub endwall secondary sealing air flow on the turbine’s mainstream flow. J. Therm. Sci. 2017, 26, 308–315. [Google Scholar]
- Sangan, C.M.; Pountney, O.J.; Scobie, J.A.; Wilson, M.; Owen, J.M.; Lock, G.D. Experimental Measurements of Ingestion Through Turbine Rim Seals—Part III: Single and Double Seals. J. Turbo. 2013, 135, 051011. [Google Scholar] [CrossRef]
- Zhou, D.W.; Roy, R.P.; Wang, C.Z.; Glahn, J.A. Main gas ingestion in a turbine stage for three rim cavity configurations. J. Turbo. 2011, 133, 031023. [Google Scholar] [CrossRef]
- Schuler, P.; Kurz, W.; Dullenkopf, K.; Bauer, H.J. The influence of different rim seal geometries on hot-gas ingestion and total pressure loss in a low-pressure turbine. In Proceedings of the ASME Turbo Expo 2010: Power for Land, Sea, and Air, Glasgow, UK, 14 June 2010; pp. 1123–1134. [Google Scholar]
- Scobie, J.A.; Teuber, R.; Li, Y.S.; Sangan, C.M.; Wilson, M.; Lock, G.D. Design of an improved turbine rim-seal. J. Eng. Gas Turbines Power 2016, 138, 022503. [Google Scholar] [CrossRef]
- Barringer, M.; Coward, A.; Clark, K.; Thole, K.A.; Schmitz, J.; Wagner, J.; Dennis, R. The Design of a Steady Aero Thermal Research Turbine (START) for Studying Secondary Flow Leakages and Airfoil Heat Transfer. In Proceedings of the ASME Turbo Expo 2014: Turbine Technical Conference and Exposition, Dusseldorf, Germany, 16 June 2014. V05CT16A013. [Google Scholar]
- Green, T.; Turner, A.B. Ingestion into the upstream wheelspace of an axial turbine stage. In Proceedings of the ASME 1992 International Gas Turbine and Aeroengine Congress and Exposition, Colonge, Germany, 1 June 1992; pp. 1–7. [Google Scholar]
- Roy, R.P.; Feng, J.; Narzary, D.; Paolillo, R.E. Experiment on gas ingestion through axial-flow turbine rim seals. J. Eng. Gas Turbines Power 2005, 127, 573–582. [Google Scholar] [CrossRef]
- Eastwood, D.; Coren, D.D.; Long, C.A.; Atkins, N.R.; Childs, P.R.N.; Scanlon, T.J.; Guijarro-Valencia, A. Experimental investigation of turbine stator well rim seal, re-ingestion and interstage seal flows using gas concentration techniques and displacement measurements. J. Eng. Gas Turbines Power 2012, 134, 082501. [Google Scholar] [CrossRef] [Green Version]
- Regina, K.; Kalfas, A.I.; Abhari, R.S. Experimental Investigation of Purge Flow Effects on a High Pressure Turbine Stage. J. Turbo. 2015, 137, 041006. [Google Scholar] [CrossRef]
- Wang, R.; Du, Q.; Liu, G.; Lian, Z.; Xie, L.; Zhu, J. Influence of Secondary Sealing Flow on Performance of Turbine Axial Rim Seals. J. Therm. Sci. 2020, 29, 840–851. [Google Scholar] [CrossRef]
- Balasubramanian, J.; Michael, M.; Roy, R.P.; Kim, Y.W.; Moon, H.K. Experiments on front-and aft-disk cavity ingestion in a subscale 1.5-stage axial turbine. In Proceedings of the Turbo Expo: Power for Land, Sea, and Air, Seoul, South Korea, 13 June 2016; pp. 1–16. [Google Scholar]
- James, A.S. An Experimental Study of Gas Turbine Rim Seals. Ph.D. Thesis, University of Bath, Bath, UK, 26 June 2014. [Google Scholar]
- Pedersen, D.R. Effect of Density Ratio on Film Cooling Effectiveness for Injection through a Row of Holes and for a Porous Slot. Ph.D. Thesis, University of Minnesota, Minneapolis, MN, USA, 9 September 1972. [Google Scholar]
- Abernethy, R.B. ASME measurement uncertainty. J. Fluids Eng. 1985, 107, 161–164. [Google Scholar] [CrossRef] [Green Version]


| Parameter | Vane | Blade |
|---|---|---|
| No. of airfoil | 36 | 56 |
| Axial chord length ratio (Cax,i/Cax,v1) | 1 | 0.877 |
| Pitch of blade (P/Cax,i) | 1.09 | 0.8 |
| Span of blade (S/Cax,i) | 0.77 | 0.8 |
| Blade inlet angle | 0° | 54.4° |
| Blade outlet angle | 77° | −67° |
| Turning angle | 77° | 121.7° |
| Expt Set | Rotor Speed | Main Air Flow Rate | Secondary Air | ||||||
|---|---|---|---|---|---|---|---|---|---|
| Parameter | rpm | Reϕ | kg/s | Reax | kg/s | Cw | % of Main Air Flow | % of Actual Engine Air Flow | V/U |
| Case 1-1 | 1000 | 5.2 × 10⁵ | 0.69 | 2.3 × 10⁴ | 0.0371 | 7.0 × 10³ | 5.4 | 1.35 | 0.34 |
| Case 1-2 | 1000 | 5.2 × 10⁵ | 0.69 | 2.3 × 10⁴ | 0.0350 | 6.6 × 10³ | 5.0 | 1.25 | 0.34 |
| Case 1-3 | 1000 | 5.2 × 10⁵ | 0.69 | 2.3 × 10⁴ | 0.0311 | 5.9 × 10³ | 4.5 | 1.13 | 0.34 |
| Case 1-4 | 1000 | 5.2 × 10⁵ | 0.69 | 2.3 × 10⁴ | 0.0276 | 5.2 × 10³ | 4.0 | 1 | 0.34 |
| Case 1-5 | 1000 | 5.2 × 10⁵ | 0.69 | 2.3 × 10⁴ | 0.0207 | 3.9 × 10³ | 3.0 | 0.75 | 0.34 |
| Case 1-6 | 1000 | 5.2 × 10⁵ | 0.69 | 2.3 × 10⁴ | 0.01138 | 2.6 × 10³ | 2.0 | 0.5 | 0.34 |
| Case 2-1 | 800 | 4.2 × 10⁵ | 0.55 | 1.8 × 10⁴ | 0.0330 | 6.2 × 10³ | 6.0 | 1.5 | 0.34 |
| Case 2-2 | 800 | 4.2 × 10⁵ | 0.55 | 1.8 × 10⁴ | 0.0297 | 5.6 × 10³ | 5.4 | 1.35 | 0.34 |
| Case 2-3 | 800 | 4.2 × 10⁵ | 0.55 | 1.8 × 10⁴ | 0.0275 | 5.2 × 10³ | 5.0 | 1.25 | 0.34 |
| Case 2-4 | 800 | 4.2 × 10⁵ | 0.55 | 1.8 × 10⁴ | 0.0248 | 4.7 × 10³ | 4.5 | 1.13 | 0.34 |
| Case 2-5 | 800 | 4.2 × 10⁵ | 0.55 | 1.8 × 10⁴ | 0.0220 | 4.1 × 10³ | 4.0 | 1 | 0.34 |
| Case 2-6 | 800 | 4.2 × 10⁵ | 0.55 | 1.8 × 10⁴ | 0.0165 | 3.1 × 10³ | 3.0 | 0.75 | 0.34 |
| Case 3-1 | 600 | 3.1 × 10⁵ | 0.41 | 1.4 × 10⁴ | 0.0247 | 4.7 × 10³ | 6.0 | 1.5 | 0.34 |
| Case 3-2 | 600 | 3.1 × 10⁵ | 0.41 | 1.4 × 10⁴ | 0.0222 | 4.2 × 10³ | 5.4 | 1.35 | 0.34 |
| Case 3-3 | 600 | 3.1 × 10⁵ | 0.41 | 1.4 × 10⁴ | 0.0207 | 3.9 × 10³ | 5.0 | 1.25 | 0.34 |
| Case 3-4 | 600 | 3.1 × 10⁵ | 0.41 | 1.4 × 10⁴ | 0.0186 | 3.5 × 10³ | 4.5 | 1.13 | 0.34 |
| Case 3-5 | 600 | 3.1 × 10⁵ | 0.41 | 1.4 × 10⁴ | 0.0166 | 3.1 × 10³ | 4.0 | 1 | 0.34 |
| Case 3-6 | 600 | 3.1 × 10⁵ | 0.41 | 1.4 × 10⁴ | 0.0124 | 2.3 × 10³ | 3.0 | 0.75 | 0.34 |
© 2020 by the authors. Licensee MDPI, Basel, Switzerland. This article is an open access article distributed under the terms and conditions of the Creative Commons Attribution (CC BY) license (http://creativecommons.org/licenses/by/4.0/).
Share and Cite
Choi, S.M.; Choi, S.; Cho, H.H. Effect of Various Coolant Mass Flow Rates on Sealing Effectiveness of Turbine Blade Rim Seal at First Stage Gas Turbine Experimental Facility. Energies 2020, 13, 4105. https://doi.org/10.3390/en13164105
Choi SM, Choi S, Cho HH. Effect of Various Coolant Mass Flow Rates on Sealing Effectiveness of Turbine Blade Rim Seal at First Stage Gas Turbine Experimental Facility. Energies. 2020; 13(16):4105. https://doi.org/10.3390/en13164105
Chicago/Turabian StyleChoi, Seok Min, Seungyeong Choi, and Hyung Hee Cho. 2020. "Effect of Various Coolant Mass Flow Rates on Sealing Effectiveness of Turbine Blade Rim Seal at First Stage Gas Turbine Experimental Facility" Energies 13, no. 16: 4105. https://doi.org/10.3390/en13164105