Abstract
With increasing renewable penetration and projected increase in natural disasters, the reliability and resiliency of a power system become crucial issues. As network inertia drops with increasing penetration of renewables, operators search for flexible resources that can help cope with a disruptive event or manage renewable intermittency. Energy storage is a solution, but the type of storage solution needs to be profitable to exist in the current and upcoming power markets. Advanced pumped-storage hydropower (PSH) is one solution that can help cope with such requirements, which will in turn help to increase the renewable penetration in the system. This paper qualitatively compares the revenue earning potential of PSH configurations, including, adjustable-speed PSH (AS-PSH) and ternary PSH (T-PSH) in comparison to conventional PSH (C-PSH) from the arbitrage and regulation markets, with and without the presence of wind penetration. In addition, a framework for quantitative analysis of any energy storage system has been proposed. A 24-bus RTS system is studied with summer and winter variations in load and wind power. Through revenue and operational mode analysis, this paper reveals that T-PSH has the highest revenue earning potential, which is mainly due to its ability to operate with a hydraulic short circuit.
1. Introduction
The primary control reserves and regulation services are crucial for enhancing the reliability and resilience of power systems. Primary frequency regulation and load following reserves enable power systems not only to cope with any disruptive events but also to absorb the intermittency of renewable energy and load. However, as the penetration of renewable energy increases, fossil-fuel powered thermal generators are removed from the schedule, which simultaneously removes the reserves and regulatory services provided previously by these generators. Thus, we look forward to grid-scale energy storage technologies such as pumped-storage hydropower (PSH). However, from an economic standpoint, it becomes important to understand which candidate of the PSH portfolio is most beneficial.
Fair remuneration mechanism for energy storage systems is of great importance. To remunerate these grid-scale energy storage devices in a fair manner, the U.S. Federal Energy Regulatory Commission (FERC) has ordered independent system operators (ISOs) to make necessary changes to their markets. In 2007, FERC issued order 890 to ensure the fair and equitable participation of non-generation resources in the markets [1]. The FERC issued order 755 in 2011 and order 784 in 2013, which required independent system operators/regional transmission operators (ISO/RTO) to compensate resources for their frequency regulation services [2,3]. In 2018, FERC issued order 841, which requires ISO/RTO to establish market rules and tariffs that, recognizing the physical capabilities and limitations of the energy storage sources, allows the participation of storage in the RTO/ISO markets [4].
To comply with these orders, most ISOs have introduced two main revenue streams, arbitrage and regulation. Arbitrage exploits the advantage of the difference in cost of energy during different parts of the scheduling period. Periods of low demand, such as the weekends, produce low price energy and hence an opportunity to buy energy. Periods of peak demand during the weekdays provide the best opportunity to sell energy. The regulation market generally offers payments in two components, the capacity payment and mileage payment. Capacity payments remunerate the unit for the capacity reserved for regulation, while the mileage payments remunerate the unit for regulation provided or reserve used. The “pay-for-performance” scheme also evaluates quality with which the mileage (or movement) was provided (speed and accuracy).
This paper considers some of these practices and evaluates the revenue earning potentials of different pumped-storage hydropower technologies as well as the benefits to the power network. This work assumes that the day-ahead nodal price and the real-time price are equal and considers the effect of wind penetration on the operation and revenue of the PSH configurations. Solar photovoltaic (PV) penetration has not been considered as the time of PV power production coincides, approximately, with the time of peak load requirement. Thus, the scope for arbitrage with the presence of PV becomes less obvious. However, future studies with PV and both wind and PV will be performed.
The paper is organized as follows: Section 2 describes a few similar works. Section 3 describes and compares advanced pumped hydro technologies, and the optimization problem is formulated in Section 4. Section 5 describes the optimization algorithms. Section 6 describes the power system considered for the study, and the results of the case studies with and without wind are presented in Section 7. Section 8 presents a brief discussion about the PV only and PV + wind scenario, with conclusions stated in Section 9.
2. Literature Review
The approach for revenue quantification used in this paper is similar to that adopted in [5,6,7]. In [8], this approach is extended to the Midcontinent Independent System Operator (MISO) market that has adopted the “pay-for-performance” scheme. However, for these previous analysis, historical nodal prices were available. In this paper, the optimal power flow (OPF) is solved to calculate the nodal energy price and the reserve cost, and the storage revenue optimization is jointly solved with the dispatch problem.
In [9,10], Filipe et al. analyzed the profit from arbitrage and regulation from a variable speed PSH in the Iberian Peninsula power market in a Portugal region. They concluded that the participation in regulation market doubles more than the amount of revenue earned as compared to arbitrage only, but it does not affect the reservoir levels significantly. In [11], Ahmed et al. considered the production costing simulation with and without the PSH, showing a benefit/cost ratio ranging 1.27~1.33 with a payback period of 18–21 years. When monetary value of ancillary services is included, the benefit/cost ratio increases to be around 1.4~1.6 and the payback period is reduced to about 10 years. In [12], Fong, Moreira, and Strbac analyze revenue and payback periods for battery energy systems (BESs) considering arbitrage, frequency regulation, reserve and other network services as revenue streams in the Great Britain (GB) market. They conclude that participation in multiple services increases revenue of the storage system, while frequency regulation service brings in the most revenue. In addition, it is seen that while a combination of services can provide payback in 10 years, frequency regulation and arbitrage can do so in 12 years and frequency regulation alone in 18 years. With batteries, there is always a risk of recovering the capital cost and operational expenditure within the lifespan of the batteries but participating in multiple network services reduces such risks. In [13], Hozouri et al. performed energy cost minimization, revenue maximization, renewable curtailment minimization, and transmission expansion cost minimization through optimal placement of the PSH units. Here, the application of MATPOWER has been made for the problem and use of nodal energy prices for revenue calculation. In [14], Salevid examines the profitability of PSH form arbitrage market using historical data to find two price limits, one above which the plant generates power and the other below which the plant acts as a pump. These prices are determined by an iterative method on a two-week basis, based on a locational marginal price (LMP) forecasting model. In a previous work [15], Nag and Lee considered various objectives, but the benefits of advanced pumped hydro were not revealed clearly. The main conclusions from [15] were that the time period considered was too small and did not create much incentives for arbitrage. Furthermore, an oligopoly provides a better optimum and encourages the participation of the storage system.
When considering renewable energy, it becomes important to consider its possible future growth and the effect of its growth on market conditions. In [16], Seel et al. investigated the effect of high variable renewable energy futures on the energy market. Key findings include (a) the increase of low cost electricity periods, (b) increase in solar leads to higher diurnal changes in prices and increases in wind leads to high irregularity in the pricing patterns, (c) with increases in renewable energy, the price of ancillary services rise. All of the above findings can be used beneficially by energy storage plants.
3. Advanced Pumped-Storage Hydropower
Pumped hydro is the most matured and deployed form of grid-scale energy storage mainly due to its relevance to existing hydro power technology, simplicity, ability to store large amounts of energy, and cost-effectiveness. The conventional PSH (C-PSH) plants mainly consist of a reversible pump-turbine as the prime mover connected to a synchronous machine that acts as a motor or a generator. To store energy, water is transferred from the lower to the upper reservoir with the pump-turbine rotating in one direction as a pump. To release the stored energy, water is governed to flow down from the upper reservoir to the lower reservoir through the pump-turbine that rotates in the opposite direction as a turbine.
The main disadvantages of C-PSH are pump mode inflexibility, poor partial-load efficiency in generation mode, and long mode-change time [17]. To overcome these drawbacks, the adjustable speed PSH (AS-PSH) and ternary PSH (T-PSH) have been introduced. The operational ranges and schematic diagrams of the same have been depicted in Figure 1.
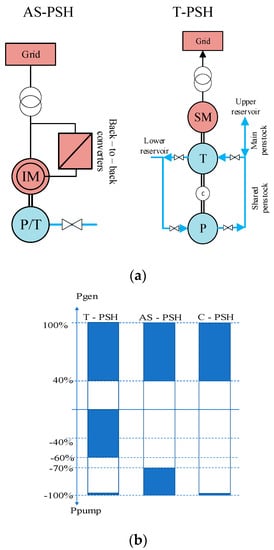
Figure 1.
Schematic diagrams and operating ranges of T-PSH, AS-PSH, and C-PSH: (a) Schematic diagrams; (b) Operating ranges highlighted in blue.
3.1. Adjustable-Speed PSH
The key idea with adjustable speed systems is to operate at a speed above or below the synchronous speed to enhance efficiency and to provide regulation even during the pump mode. The AS-PSH can be of two types. The first type is where a synchronous machine (SM) is coupled to a fully rated converter and filter on the stator side and to a reversible pump-turbine through its shaft (not shown in Figure 1). The second type is where a doubly-fed induction machine (DFIM) is used as the motor/generator with a back-to-back converter on the rotor side and a reversible pump-turbine coupled to its shaft, as can be seen in Figure 1.
In the first type with SM, the stator connected back-to-back converter and filter arrangement is rated equal to the machine rating and hence is not an economic option, especially for large units. For smaller units (<100 MW), this option has been adopted. However, there has been an implementation of a partially rated converter which [18] does provide a lower operating point in terms of power consumed, while also being able to participate in grid frequency response.
The AS-PSH of the second type with DFIM is a more economic option as its rotor connected back-to-back converter is rated at 5% to 30% of the total unit’s nominal power rating, and is hence of concern to this paper. This provides a sufficient range of speed variation for operation of the AS-PSH system. The back-to-back converter consists of two parts, the rotor-side converter (RSC) and the grid-side converter (GSC). The RSC controls the real and reactive power exchanged with the grid through the stator, while the GSC controls the DC-link voltage of the back-to-back converter. The hydraulic governor maintains the optimal speed of the system [19,20].
It is assumed that the AS-PSH is equipped with a converter of 20% rating, and the operating range for the AS-PSH is within the nominal range of 100% to 40% in the generating mode. The synchronous speed is marked at 60% power output. In the pump mode, the power consumed ranges between to −70% to −100%, as shown in Figure 1b.
3.2. Ternary PSH
The T-PSH is a unique addition to the PSH portfolio mainly because of its structure. The T-PSH has a shaft that connects the turbine, the synchronous motor/generator (SM/G), and the pump. Here, a clutch is used to separate the pump and the motor/generator. In addition, the pump and the turbine share the same penstock, which gives rise to a hydraulic short-circuit (or the shared penstock). There are many advantages of using this device.
First, due to the hydraulic short circuit, the turbine can be operated from the pump’s discharge which will in turn reduce the required shaft torque and hence power consumed, in turn providing pump mode regulation to the network. Another way to state the same would be that, since the pump and turbine are almost at the same head level, the main work done is to pump water to the upper reservoir, which when reduced, reduces the net work done and hence the net power drawn from the grid.
Secondly, the time required to change from pump mode to generator mode, and vice versa, is reduced as the entire arrangement rotates in the same direction for both modes of operation [21,22]. Thus, to travel from generator to pump mode, all that is required is to engage the clutch, close the turbine inlet, and open the pump outlet in an ordered fashion. This avoids the time lost in resynchronizing the unit.
The turbine mode operating range is the same as that of the C-PSH. With the help of the hydraulic short circuit, the entire turbine range can be used to provide regulation during the pump mode. Hence, the pump can or operate at full load at −100%, or with the hydraulic short circuit in the range of 0% to −60%, since the entire working range of the turbine which is 40% to 100% is used, as shown in Figure 1b.
4. Problem Formulation
To understand the profitability of a grid-scale storage technology of the PSH configurations from arbitrage and regulation markets, it is required to simulate a network over a significantly long duration. It is also important to consider network constraints for a more practical realization of the same. Therefore, a week-long, reserve and network constrained dynamic dispatch optimization problem is formulated to minimize:
where,
Equation (1) consists of four different terms and considers the objectives of both the ISO and the storage facility as it accounts for revenue maximization and reservoir volume as well as system reserves, operating cost and losses. The first term in (1) is the cost of generation , which is further detailed in (2) and comprises of the value of the objective function at each hour from the OPF, , and the ramping costs of thermal generators, . The second term in (1), , is the apparent power loss as detailed in (3). The third term in (1) is the curtailment of wind energy as detailed in (4) as the difference between the maximum available wind energy and the amount that was actually dispatched, . The effect of solar energy has not been considered. The fourth term in (1) is the penalty that enforces the constraint that the final volume at the end of the week must be equal to the initial volume. The penalty is applied as in (5), where is the target energy level at the end of the scheduling period and and are penalty constants.
The fifth term in (1), calculates the revenue earned by the storage facility from the energy market, and the regulation market, as in (6). Here, the revenue from the regulation market, , is divided into two parts as shown in (7) and (8); in (7) the first term simply states the revenue for reserve allocation and the second term states the revenue collected proportional to the regulation mileage or actually activating the reserve. Equation (7) assumes a performance-based payment scheme where the performance factor, , describes the speed and accuracy of response of the PSH plant. The allocated reserve earns a revenue proportional to the regulation capacity price of the PSH plant, while the activated reserve is sold at the LMP as in (8), where the revenue from the energy market is the difference between the revenue earned from generation of and the amount paid for pumping . Here, the price for pumping is discounted by the factor . The efficiency of the plant in generating mode (or pumping mode with ) are separately accounted for by (9) assuming constant head with p1, p2, p3 and p4 being required coefficients (see Table A1) and being the generation mode power output from the PSH.
At every time step (1 h), the power network was internally optimized to maintain system security and generate the nodal energy prices used for the revenue calculation. The MATPOWER [23] was used to perform the optimal power flow for the system, which solved:
In (10), the cost for energy and reserves are minimized, while respecting the constraints described by (11) through (18). Equations (11) and (12) describe the nodal balance constraints, while (13) describes the power flow limits. Equations (14)–(17) limit the voltage angle and magnitude and respective generator productions within specified limits. Equation (18) specifies the amount of reserve for the hour . This is to select the reserve level according to the stricter of the two criteria: (i) the N-1 requirement or the maximum generation for the hour, ; and (ii) mean error plus three times the standard deviation of the combined load and wind prediction errors, indicated by subscripts, d and w, respectively [24,25]. The data used for the distribution of load and wind prediction error can be found in Table A2.
The N-1 criterion ensures that enough reserve is scheduled to balance demand and generation after the outage of any single generation unit or tie-line. An underlying assumption is that other network disturbances such as a sudden load increase or load prediction errors are less severe and are thus covered under the umbrella of the N-1 criterion.
With the advent of high levels of wind power, the N-1 criterion may not be sufficient and need to be revised to reflect the possibility of wind power prediction errors being greater than the power imbalance resulting from the loss of any single piece of apparatus. To avoid such a situation, we consider (18).
5. Optimization Algorithms
When considering long optimization routines, nonlinear objectives and constraints, and the necessity to obtain a global optimum in stipulated amount of time, the selection of the optimization algorithm becomes very important. Due to significant discontinuity of search space of the PSH candidates, as shown in Figure 1, classical optimization algorithms have not been preferred. Moreover, MATPOWER’s MOST tool released in 2019 [26] performs scheduling using quadratic programming but only for continuous search spaces. In order to handle large-scale complex nonlinear optimization problems with discontinuous search spaces, modern meta-heuristic optimization techniques have been introduced in recent years with applications to power systems [27]. In this paper, three most popular modern heuristic optimization algorithms were chosen: (a) Differential evolution, (b) Genetic algorithm, and (c) Particle swarm optimization. The test problem selected for the choice of algorithms was the optimization of 24-h operation of T-PSH in the 24-bus network.
5.1. Differential Evolution
Differential Evolution (DE) was formulated by Storn and Price [28] and consists of four main steps: (a) initialization, (b) mutation, (c) crossover, and (d) selection. The mutation operator is a unique property of DE in that a randomly chosen individual evolves according to the weighted difference between two or more randomly chosen individuals. The crossover operation combines randomly chosen dimensions from the mutant and the parent according to a pre-designed law. Finally, the selection operation formulates the new population by evaluating and selecting the new individuals with improved fitness.
5.2. Genetic Algorithm
Genetic Algorithm (GA) was formulated by Goldberg [29]. Similar to DE, GA also performs (a) initialization, (b) crossover, (c) mutation, and (d) selection. The main differences between the two is that (a) the mutation operation occurs after the crossover operation, and (b) the mutation operation in case of GA is not related to the difference between any individuals. In GA, the crossover operation is performed when two selected individuals or parents exchange parts of their genetic material to form two new individuals. The mutation operator then randomly selects a few individuals from the newly formed population and mutates. The mutated individuals are also added to the new children population. The selection mechanism is the same as that in DE.
5.3. Particle Swarm Optimization
Particle Swarm Optimization (PSO) was formulated by Kennedy and Eberhart [30]. Similar to DE, the population evolves according to the two differences: (a) between the position of the global best individual and that of the chosen individual, and (b) between its personal best and present position of the chosen individual.
5.4. Genetic Algorithm with Selective Evaluation (SEGA)
The proposed variant of GA has the same steps of crossover, mutation, and selection. This is generally followed by the evaluation of the objective function. However, since the evaluation of the objective function is a significantly long task in certain situations, the evaluation of a large population might be of significant burden. Therefore, a GA with selective evaluation (SEGA) is proposed in this paper, where not all children need to be evaluated. The algorithm, after every generation, stores the chromosomes of the worst individual and makes use of this database to evaluate the children for the generations to come. In case the new child to be evaluated is within a radius of r of any previously stored worst solution, the child is directly assigned the cost of that worst individual. Hence, before the objective function is evaluated, the distance from the stored worst individuals are calculated, for every child.
As shown in Figure 2, not all of the new children (C1, C2,…, C8) are evaluated; C6 is directly assigned the cost of worst individual-1 (WI1) as its distance from WI1 is less than that from WI2 and C7 is directly assigned the cost of WI3, where WI1, WI2, and WI3 originated from the first, second and third iterations, respectively. In the fourth iteration, C8 is the worst individual found and, thus stored in the WI database for comparison. On average, SEGA takes 66.46 s per iteration and conventional GA takes 72 s per iteration, while they converge to approximately the same value of the objective function as can be seen in Figure 3. The proposed variant is therefore a memory-based optimization algorithm that exploits the data collected from previous iterations.
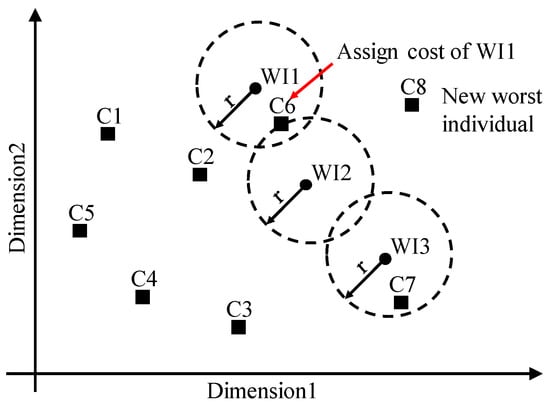
Figure 2.
Illustration of proposed GA with selective evaluation. WI1, WI2, and WI3 are the worst individuals originated from the first, second, and third iterations, respectively.
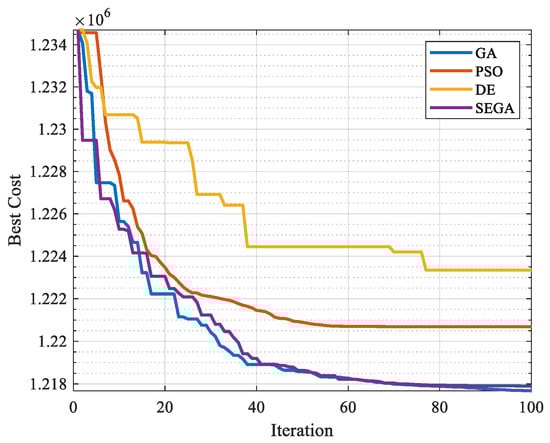
Figure 3.
Objective functions of GA, PSO, DE, and GA with selective evaluation (SEGA).
6. System Data
To generalize the findings, the IEEE 24-bus reliability test system (RTS) system [31] as in Figure 4 is considered during winter and summer weeks. For the 24-bus RTS system, the hydro power plant at the bus 22 was replaced by the PSH plant. For the replacement of the hydro plant, the six units were deleted from the generator matrix as well as the generator cost matrix. In addition, the bus type was changed from generator bus to load bus for the replacement. The reserve cost matrices were added to the test cases to obey security constraints. The PSH added was considered a negative load. Reactive power of the PSH was maintained at 0. Further details about the sytem load, generation, and wind can be found in Table A3 in the appendix section.
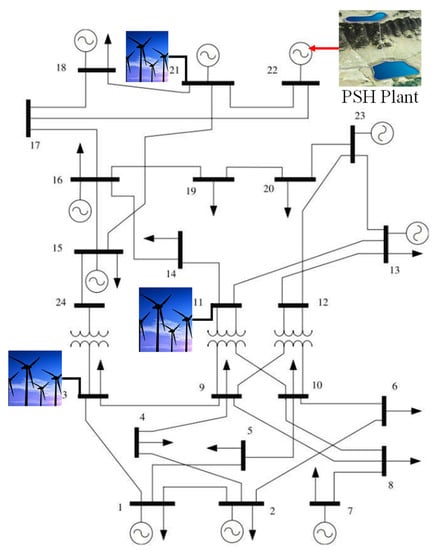
Figure 4.
The modified 24-bus RTS system.
The wind and load profiles of one week that have been used for the summer and winter analysis are displayed in Figure 5 [32]. Much difference can be seen between the summer and winter load profiles. The variation in load between weekends and weekdays is low in winter as compared to the summer profile, which hints towards the low variation of nodal prices between the weekend and weekdays during winter. Furthermore, the winter load profiles provide a dual peak load curve for most days, which is mainly caused by residential use of electricity. The wind profile also displays a daily pattern; however, extended durations of high-power output can be observed, which introduces randomness into the net load profile but also increases the low LMP hours. In addition, the wind profile displays significant ramping activity.
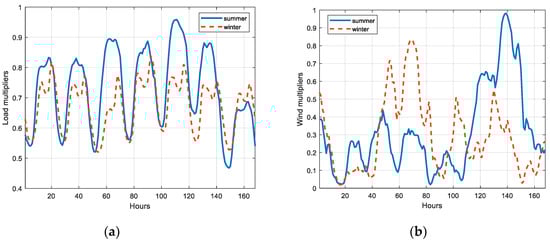
Figure 5.
Weekly (a) Load and (b) Wind Profile for summer and winter.
7. Results and Observation
7.1. Without Wind
For the week-long dynamic dispatch problem considering no wind penetration, the optimized results in Figure 6 displays that C-PSH earns the least amount of revenue. Although the 24-bus RTS system does provide ample opportunity for the PSH plants to participate in the market, C-PSH is limited by partial load generation inefficiency and inability to perform pump mode regulation, and hence earns lower revenue compared to the AS-PSH and T-PSH. In addition, with reduced nodal price differences in the winter, the arbitrage revenue is reduced for all PSH types.
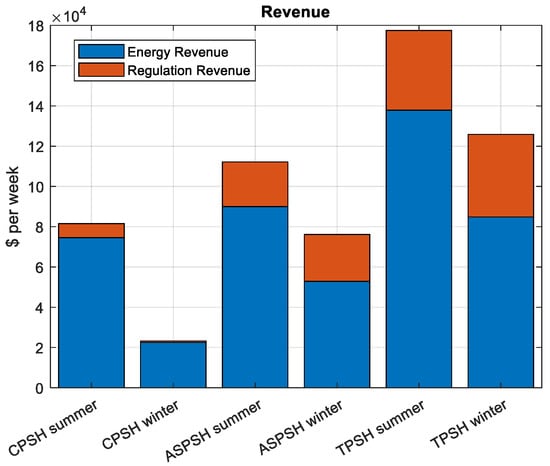
Figure 6.
Weekly revenue collected from the energy and regulation markets combined with the storage technologies from the 24-bus system for summer and winter weeks.
The operating mode analysis, as displayed in Table 1, reveals the amount of time spent in different modes of operation for each PSH configuration. The C-PSH and AS-PSH remain idle for more than half the week. However, as seen in Figure 6, the AS-PSH plant beats the C-PSH plant in revenue in both summer and winter, which can be mainly attributed to its enhanced partial-load generation efficiency and enhanced performance factor. The T-PSH, however, has the lowest number of idle hours, which does indicate a higher O&M cost.

Table 1.
Time spent [%] in each mode of operation over the week; positive being generation and negative being pumping; S = summer and W = winter.
The AS-PSH leads the partial-load generation hours among all PSH types. The AS-PSH plant can efficiently participate in the partial-load generation, which is why it displays 11% and 13% of the week generating at partial-load in summer and winter, respectively. Furthermore, the partial-load generation during peak hours provides the opportunity for the AS-PSH system to participate in the reserve market and given its high-performance factor, it earns a significant portion of its regulation revenue by operating in partial-load generation. The comparatively higher (compared to C-PSH) partial-load generation of the AS-PSH plant is also strongly motivated by the opportunities provided by the network.
In the pump mode operation also, we find certain differences between each PSH types. Firstly, the amount of time spent in pumping is different for each technology. As the hydraulic short circuit enables the T-PSH to provide pump mode regulation, the T-PSH spends most of its time in the pump mode with the hydraulic short circuit engaged. This results in a smaller amount of time spent at pumping at rated capacity. Although the AS-PSH can participate in regulation in its pumping mode, that does not encourage its pump mode operation. As a result, the duration spent in pump mode operation for AS-PSH is slightly lesser than the C-PSH. Thus, the AS-PSH mostly relies on efficient partial-load generation for its regulation revenue. In addition, this higher participation of AS-PSH in partial-load generation leads to reduced water usage, which leads to the reduced pumping requirements.
Another key observation is the comparatively higher participation of T-PSH in the generating mode. This is mainly attributed to the higher reservoir levels as a result of the plant operating in pump mode for extended periods with hydraulic short circuit.
7.2. With Wind
Figure 7 shows the optimization results for the week-long dynamic dispatch problem considering wind generation. Comparing Figure 7 with Figure 6, it shows that the trend that the T-PSH leads all other types of PSH from a revenue standpoint still holds. One major difference in revenue is the reduction of revenue collected by T-PSH, which can be attributed to the increased operational hours in pump mode that was required to prevent the curtailment of wind energy. In addition, the reduction in nodal price due to the availability of wind resulted in reduced revenues. Another key observation is the increase of C-PSH arbitrage and regulation revenue during winter. This can be justified by the availability of low-priced energy during increased operational hours with the inclusion of wind, which provides the C-PSH additional pumping opportunities at lower costs. Another important observation is the higher participation of C-PSH in the regulation market, especially in winter.
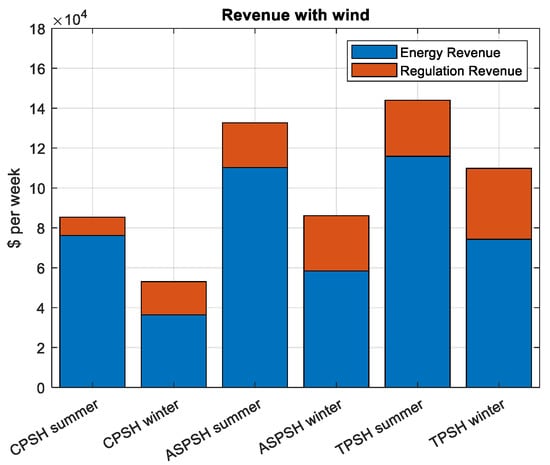
Figure 7.
Weekly revenue collected from the energy and regulation markets earned by the PSH technologies from the 24-bus system with and without 30% wind.
The regulation requirement increases as wind is included, which is why the revenue from the regulation market is comparatively higher for all PSH variants. Winter months observe a greater participation in partial-load generation for all candidates, which could be attributed to the low load conditions and hence the lower revenue.
To reveal the change in operation of these candidates with the inclusion of wind, Table 1 and Table 2 have been compared. With the inclusion of wind resources, the PSH types display an overall increase in activity, which could be attributed to the ramping of wind resources when comparing Table 1 with Table 2. As conventional units have restricted ramp rates due to their physical characteristics, PSH systems provide the required flexibility. Especially in winter, we observe repeated and high ramping of wind output, which is accommodated by the pumping mode operation of PSH facilities. Greater participation in the generating mode for all PSH types leads to increased pumping hours. This indirectly has resulted in the decrease of idle hours for each PSH type.
Table 2.
Time spent [%] in each mode of operation over the week with positive being generation and negative being pumping; S = summer and W = winter.
The network optimization algorithm supported greater partial-load operation with the inclusion of wind, especially during the winters, we see that AS-PSH and C-PSH spend much time in generating mode. This consecutively increases their pumping requirement. Apparently, it seems as if the AS-PSH outruns the C-PSH in terms of revenue even with reduced hours of generation. This can be justified by the fact that during the hours that AS-PSH spends in partial-load generation, it does so more efficiently and hence conserves water, which minimizes pumping and provides opportunities to work on full load. The key strategy for the T-PSH is to operate mostly in pump mode with hydraulic short-circuit that boosts reservoir level and revenue as it participates in the regulation market. Table 3 reveals the benefits of advanced PSHs from a curtailment standpoint.
Table 3.
Curtailment in MW h.
8. Discussion
The work done in this paper is only concerned with the penetration of wind energy. However, if only solar PV penetration would be considered instead, the results would be different. All PSH systems have been observed to charge during the night and on weekends, as these periods provide low LMPs and network congestion is minimal. These opportunities would not be available with solar PV as the nighttime charging would not be possible or would have to be done at a higher cost than with wind and could lead to added congestion if day-time charging was attempted. This would lead to a low state-of-charge for the PSH system for most of the week. Thus, revenue would be lower than compared to the only wind scenario.
In addition, the inclusion of both solar and wind (which is a more practical scenario) could also present different results. The availability of wind energy would provide the opportunities for nighttime charging. This would result in a higher state-of-charge for the PSH system for most of the week. However, discharging would be performed during very few peak load hours during the day, as the daytime LMPs would be lowered due to solar PV. As diurnal price differentials would decrease, the chances of arbitrage would also reduce, and hence the net revenue would reduce.
As mentioned in Section 1, with the inclusion of renewables, the price of ancillary services would rise and so would their requirement. This can be demonstrated in the proposed framework as an additional forecast error component would have to be considered. Thus, the wind and solar scenario would yield higher revenue from the regulation market than from the PV only or the wind only scenario.
9. Conclusions
With increasing penetration of renewable energy, the need for controllable resources is also growing. This paper presents advanced pumped-storage hydro systems, as a controllable resource, and compares the revenue earning potential of C-PSH, AS-PSH, and T-PSH.
An optimal operational planning framework has been created using the co-simulation of MATLAB and MATPOWER. A comparison of modern meta-heuristic optimization techniques, DE, PSO and the conventional GA, is presented, where GA beats the others in solution optimality. To reduce the time consumed in the optimization process, a variant of GA, called SEGA, is proposed. The comparison shows that if the objective function takes a considerably long time to evaluate, SEGA produces similar results to that of GA with a shorter time per iteration.
Key generalized conclusions from the optimization are: (a) With and without wind, AS-PSH and T-PSH show higher revenue earning potential compared to C-PSH; (b) The hydraulic short-circuit of the T-PSH offers greater advantages than the converter-based regulation of AS-PSH; (c) the generation mode efficiency enhancement in AS-PSH system is of significant benefit and should be considered during governor design; and (d) not only do the advanced PSH plants show greater participation in the regulation market, but their potential to participate in arbitrage is also greater than C-PSH.
Author Contributions
Investigation, S.N.; Supervision, K.Y.L.; Validation, K.Y.L.; Writing—original draft, S.N.; Writing—review & editing, K.Y.L. All authors have read and agreed to the published version of the manuscript.
Funding
This research received no external funding.
Conflicts of Interest
The authors declare no conflict of interest.
Appendix A
Table A1.
PSH data for C-PSH, AS-PSH, and T-PSH.
Table A1.
PSH data for C-PSH, AS-PSH, and T-PSH.
| PSH Data | |
|---|---|
| Power rating | 300 MVA |
| Energy rating | 7230 MW h |
| Performance factor η | CPSH and TPSH η = 0.85 AS-PSH η = 0.9 |
| Discount factor γ | 0.5 |
| Efficiency-CPSH and TPSH | Pump mode efficiency = 89% Generator mode efficiency coefficients p1 = −0.2778; p2 = 0.2738; p3 = 0.4016; p4 = 0.521 |
| Efficiency-ASPSH | Pump mode efficiency coefficients p1 = −2.222; p2 = 4.238; p3 = −2.206; p4 = 1.08; Generator mode efficiency coefficients p1 = 0.2778; p2 = −0.8452; p3 = 0.9984; p4 = 0.5005 |
| CPSH operating range | Generator mode [0.4 to 1 pu] Pump mode −1 pu |
| ASPSH operating range | Generator mode [0.4 to 1 pu] Pump mode [−0.7 to −1 pu] |
| TPSH operating range | Generator mode [0.4 to 1 pu]; Pump mode −1 pu; Pump mode with hydraulic short circuit [0 to −0.6 pu] |
Table A2.
Forecast error data. Wind was normalized by the installed capacity and load was normalized by the average load.
Table A2.
Forecast error data. Wind was normalized by the installed capacity and load was normalized by the average load.
| Forecast Error Data (Normal Fit) | |
|---|---|
| Mean load forecast error, | −0.002 |
| Standard deviation of load forecast error, | 0.026 |
| Mean wind forecast error, | −0.004 |
| Standard deviation of wind forecast error, | 0.13 |
Table A3.
Additional system data.
Table A3.
Additional system data.
| Additional System Data | |
|---|---|
| Total base load | 3135 MW |
| Total wind capacity | 960 MW (3 × 320 MW) @ Bus 3, 11, and 21 |
| Pumped hydro capacity | 300 MW |
| Total conventional generation | 3405 MW |
| Maximum hourly penetration | Summer: 31% Winter: 29% |
References
- Federal Energy Regulatory Commission. Final Rule Order No. 890: Preventing Undue Discrimination and Preference in Transmission Service; Office of the General Counsel: Washington, DC, USA, 16 February 2007. [Google Scholar]
- Federal Energy Regulatory Commission. Final Rule Order No. 755: Frequency Regulation Compensation in the Organized Wholesale Power Markets; Office of the General Counsel: Washington, DC, USA, October 2011. [Google Scholar]
- Federal Energy Regulatory Commission. Third-Party Provision of Ancillary Services; Accounting and Financial Reporting for New Electric Storage Technologies; 144 FERC 61,056; Office of the General Counsel: Washington, DC, USA, July 2013. [Google Scholar]
- Federal Energy Regulatory Commission. Final Rule Order No. 841: Electric Storage Participation in Markets Operated by Regional Transmission Organizations and Independent System Operators; Office of the General Counsel: Washington, DC, USA, 2018. [Google Scholar]
- Byrne, R.H.; Silva-Monroy, C.A. Estimating the Maximum Potential Revenue for Grid Connected Electricity Storage: Arbitrage and the Regulation Market; SAND2012-3863; Report; Sandia National Laboratories: Albuquerque, NM, USA, 2012. [Google Scholar]
- Byrne, R.H.; Silva-Monroy, C.A. Potential revenue from electrical energy storage in ercot: The impact of location and recent trends. In Proceedings of the 2016 IEEE Power Energy Society General Meeting, Denver, CO, USA, 26–30 July 2015; IEEE: Piscataway, NJ, USA, 2015. [Google Scholar]
- Byrne, R.H.; Silva-Monroy, C.A.; Conception, J. Estimating potential revenue from electrical energy storage in PJM. In Proceedings of the 2016 IEEE Power Energy Society General Meeting, Boston, MA, USA, 17–21 July 2016; IEEE: Piscataway, NJ, USA, 2016. [Google Scholar]
- Nguyen, T.A.; Byrne, R.H.; Concepcion, R.J.; Gyuk, I. Maximizing revenue from electrical energy storage in MISO energy & frequency regulation markets. In Proceedings of the 2017 IEEE Power & Energy Society General Meeting, Chicago, IL, USA, 16–20 July 2017; IEEE: Chicago, IL, USA, 2017; pp. 1–5. [Google Scholar]
- Filipe, J.; Bessa, R.; Moreira, C.; Silva, B. On the Profitability of Variable Speed Pump-Storage-Power in Frequency Restoration Reserve. J. Phys. Conf. Ser. 2017, 813, 012010. [Google Scholar] [CrossRef]
- Filipe, J.M.; Moreira, C.L.; Bessa, R.J.; Silva, B.A. Optimization of the variable speed pump storage participation in frequency restoration reserve market. In Proceedings of the 2016 13th International Conference on the European Energy Market (EEM), Porto, Portugal, 6–9 June 2016; IEEE: Porto, Portugal, 2016; pp. 1–6. [Google Scholar]
- Ahmed, M.H.; Arif, M.; Abdel-Galil, T.K.; Alhems, L.M.; Kotiuga, W. Quantifying the value of pumped storage hydro (PSH) in the Saudi electric grid. In Proceedings of the 2016 Saudi Arabia Smart Grid (SASG), Jeddah, Saudi Arabia, 6–8 December 2016; IEEE: Jeddah, Saudi Arabia, 2016; pp. 1–6. [Google Scholar]
- Fong, G.; Moreira, R.; Strbac, G. Economic analysis of energy storage business models. In Proceedings of the 2017 IEEE Manchester PowerTech, Manchester, UK, 18–22 June 2017; IEEE: Manchester, UK, 2017; pp. 1–6. [Google Scholar]
- Hozouri, M.A.; Abbaspour, A.; Fotuhi-Firuzabad, M.; Moeini-Aghtaie, M. On the Use of Pumped Storage for Wind Energy Maximization in Transmission-Constrained Power Systems. IEEE Trans. Power Syst. 2015, 30, 1017–1025. [Google Scholar] [CrossRef]
- Salevid, K. Market Requirements for Pumped Storage Profitability: Expected Costs and Modelled Price Arbitrage Revenues, Including a Case Study of Juktan. 2013. Available online: https://uu.diva-portal.org/smash/get/diva2:661286/FULLTEXT01.pdf (accessed on 3 January 2020).
- Nag, S.; Lee, K.Y. Optimal scheduling and dispatch of pumped hydro-Thermal-Wind systems. In Proceedings of the 2017 North American Power Symposium (NAPS), Morgantown, WV, USA, 17–19 September 2017; IEEE: Morgantown, WV, USA, 2017; pp. 1–6. [Google Scholar]
- Seel, J.; Mills, A.; Wiser, R.; Deb, S.; Asokkumar, A.; Hassanzadeh, M.; Aarabali, A. Impacts of High Variable Renewable Energy Futures on Wholesale Electricity Prices, And on Electric-Sector Decision Making; Lawrence Berkeley National Laboratory: Berkeley, CA, USA, 2020. Available online: https://emp.lbl.gov/publications/impacts-high-variable-renewable (accessed on 25 July 2020).
- Joseph, A.; Selvaraj, A.; Chelliah, C.V.; Sarma, S.V.A. Starting and Braking of a Large Variable Speed Hydrogenerating Unit Subjected to Converter and Sensor Faults. IEEE Trans. Ind. Appl. 2018, 54, 3372–3382. [Google Scholar] [CrossRef]
- Schlunegger, H.; Thöni, A. 100 MW full-size converter in the Grimsel 2 pumped-storage plant. Innsbr. Hydrog. 2013, 2, 35. [Google Scholar]
- Nag, S.; Lee, K.Y. DFIM-Based Variable Speed Operation of Pump-Turbines for Efficiency Improvement. IFAC Pap. 2018, 51, 708–713. [Google Scholar] [CrossRef]
- Nag, S.; Lee, K.Y.; Suchitra, M.V. Load Frequency Control through DFIM-based Pumped Storage Hydro. In Proceedings of the 2019 IEEE Power & Energy Society General Meeting, Atlanta, GA, USA, 4–8 August 2019; IEEE: Atlanta, GA, USA, 2019; pp. 1–5. [Google Scholar]
- Nag, S.; Lee, K.Y.; Suchitra, D. A Comparison of the Dynamic Performance of Conventional and Ternary Pumped Storage Hydro. Energies 2019, 12, 3513. [Google Scholar] [CrossRef]
- Kratirov, V.; Guzwoski, L. Modelling Ternary Pumped Storage Units; Argonne National Laboratory: Oak Ridge, TN, USA, 2013. [Google Scholar]
- Zimmerman, R.D.; Murillo-Sanchez, C.E.; Thomas, R.J. MATPOWER: Steady-State Operations, Planning and Analysis Tools for Power Systems Research and Education. IEEE Trans. Power Syst. 2011, 26, 12–19. [Google Scholar] [CrossRef]
- Restrepo, J.F.; Galiana, F.D. Effects of wind power on day-ahead reserve schedule. In Proceedings of the 2009 IEEE PES/IAS Conerence on Sustainable Alternative Energy (SAE), Valencia, Spain, 28–30 September 2009; IEEE: Valencia, FL, USA, 2009; pp. 1–4. [Google Scholar]
- Hodge, B.; Florita, A.; Orwig, K.; Lew, D.; Milligan, M. A Comparison of Wind Power and Load Forecasting Error Distributions; NREL: Denver, CO, USA, 2012; pp. 1–10. [Google Scholar]
- Murillo-Sanchez, C.E.; Zimmerman, R.D.; Anderson, C.L.; Thomas, R.J. Secure Planning and Operations of Systems with Stochastic Sources, Energy Storage and Active Demand. IEEE Trans. Smart Grid 2013, 4, 2220–2229. [Google Scholar] [CrossRef]
- Lee, K.Y.; El-Sharkawi, M.A. (Eds.) Modern Heuristic Optimization Techniques with Applications to Power Systems; Wiley-IEEE Press: New York, NY, USA, 2008; ISBN 978-0-471-45711-4. [Google Scholar]
- Storn, R.; Price, K. Differential Evolution—A Simple and Efficient Heuristic for global Optimization over Continuous Spaces. J. Glob. Optim. 1997, 11, 341–359. [Google Scholar] [CrossRef]
- Goldberg, D.E. Genetic Algorithms in Search Optimization and Machine Learning; Addison Wesley: Boston, MA, USA, 2012; p. 41. ISBN 0-201-15767-5. [Google Scholar]
- Kennedy, J.; Eberhart, R. Particle swarm optimization. In Proceedings of the ICNN’95-International Conference on Neural Networks, Perth, WA, Australia, 27 November–1 December 1995; IEEE: Perth, WA, Australia, 1995; Volume 4, pp. 1942–1948. [Google Scholar]
- Grigg, C.; Wong, P.; Albrecht, P.; Allan, R.; Bhavaraju, M.; Billinton, R.; Chen, Q.; Fong, C.; Haddad, S.; Kuruganty, S. A report prepared by the Reliability Test System Task Force of the Application of Probability Methods Subcommittee. IEEE Transactions on Power Systems. IEEE Reliab. Test Syst. 1999, 14, 1010–1020. [Google Scholar]
- Eia.gov. U.S. Energy Information Administration (EIA)-Embed. 2020. Available online: https://www.eia.gov/opendata/widgets.php (accessed on 15 September 2019).
© 2020 by the authors. Licensee MDPI, Basel, Switzerland. This article is an open access article distributed under the terms and conditions of the Creative Commons Attribution (CC BY) license (http://creativecommons.org/licenses/by/4.0/).