Article

A Real Options Approach to Valuate Solar Energy Investment with Public Authority Incentives: The Italian Case

Department of Economics and Finance, University of Bari, Largo Abbazia S. Scolastica, 53-70124 Bari, Italy
Energies 2020, 13(16), 4181; https://doi.org/10.3390/en13164181
Submission received: 22 June 2020 / Revised: 22 July 2020 / Accepted: 11 August 2020 / Published: 12 August 2020

Abstract

:
Solar energy investment represents currently a valid reason to support sustainable economic development. In fact, over the last few years, governments have applied different measures to incentivize private consumers and firms to use renewable energies. Photovoltaic (PV) projects are characterized by uncertainty due to meteorological conditions, the unpredictable behavior of government, and managerial flexibility. Since the Net Present Value (NPV) approach is not able to capture these uncertain factors, it was replaced with the Real Options Approach (ROA). The latter method manages to embed flexibility in PV investment using binomial trees. This paper valuates PV investment in all regional areas in Italy using an integrated approach between the discounted cash flows method and real option value, called Expanded Net Present Value (ENPV). We fit the probability of tax benefits into a binomial lattice model after analyzing the geographical position and weather conditions of all regional capitals of Italy. The results show that the cities with high irradiance/temperature have positive NPV and high investment values. On the other hand, while most cities have negative NPV, the inclusion of the flexibility in investment decisions gives additional value to the project, making the ENPV positive and implying an attractive investment opportunity with the possibility of delaying the project. We also propose a sensitivity analysis that shows how the real option value changes when incentive policies of the government become more attractive. This paper contributes to the existing literature in the way of considering financial, meteorological/geographical, and political factors to valuate PV investment.

1. Introduction

Renewable energy investment has become the frontier of science to reduce pollution and to develop more sustainable societies. Some governments around the world, recognizing the importance of these investments, have adopted political measures to encourage the implementation of these projects. In fact, solar energy investments with the adoption of Photovoltaic (PV) panels represent currently a good opportunity to obtain economic advantages and to respect the environment that surrounds us.
Over the last few years, PV panels have gained attention becoming one of the most important green technologies in the renewable sector (see [1]). Since PV panels harness solar irradiation and turn it into electricity, the meteorological and geographical factors such as the exposure to solar irradiation have a great influence on their profitability. In addition to this, the profitability of PV investment depends also on technological aspects such as materials or cell technology (see [2,3]), cells’ location (see [4]), and PV systems’ location (see [5]). Regarding the cell technology of the panel, Premalatha and Rahim (2017) [6] presented an analysis of the impact of dynamic fluctuations in irradiance and temperature on the performance of different PV cell technologies. They observed that three PV technologies, monocrystalline, multicrystalline, and thin film modules, reacted differently to different irradiance and temperature conditions, which affect the energy output. Moreover, there are also other factors that can affect positively or negatively the PV investment value such as the presence of potential incentive measures adopted by the government (see [7,8,9]) or the managerial flexibility of a renewable project, for example due to an embedded innovation that could change the project value during its lifetime (see [10]). Considering all these factors, the valuation of PV projects could require sophisticated financial method to make a reliable valuation of the investment. This is for the uncertain nature of these variables.
Since renewable projects are characterized by uncertainty, the classical NPV approach is not adequate to embed unpredictable factors in its evaluation and assess the value of uncertain investment. This is because it is based on the Discounted Cash Flows (DCF) method, which ignores the upside potential of added value due to flexibility or innovation (see [11,12,13]). Therefore, the NPV approach does not take into account the value of managerial flexibility to delay the realization of investment. When it is necessary to consider the uncertainty of PV investments and the irreversible aspect of such investments in the assessment, the Real Options Approach (ROA) can give management better decision support.
Previous studies also applied ROA to different types of uncertain investment. For example, Kellogg and Charnes (2000) [14] and Hauschild and Reimsbach (2015) [15] showed that the ROA can be used to value a biotechnology company, while Trigeorgis and Panayi (1998) [16] applied a multi-stage ROA to valuate information technology infrastructure. All these studies showed that real options embedded in capital investment projects allow investors to add value to their firm through active management.
In fact, sometimes, a project based on the NPV approach can be undervalued, and consequently, potential investors should refuse this (see for instance [10,17]).
In the case of solar energy investments, there are two possible scenarios that NPV quantification cannot predict. The first involves weather and geographical condition, i.e., according to each level of exposure to sunlight, a PV panel can perform differently (see [18]). The second one is relative to the public’s role, namely the government could put into place measures to encourage the use of renewable energy (see [8,19]).
For these reasons, we decided to assess the application of the Expanded Net Present Value (ENPV), which allows combining the value of flexibility represented by the real options approach with NPV (see [10,20]).
The valuation of investment uncertainty with ROA has become one of the most diffused methods in the literature. Solar energy projects are comfortably valuated with this approach. Yeo and Qiu (2003) [13] explained the inefficiency of NPV quantification for evaluating the convenience of investments characterized by uncertainty. In addition, they give some examples about projects embedded with options. This uncertainty related to renewable energy investments was highlighted by Kim et al. (2017) [21], who proposed a real options analysis framework as a tool to assess renewable energy investments in developing countries. These latter, in fact, are characterized by high uncertainty due to rapidly changing technologies and host government conditions. To determine the real options value, Madlener and Stoverink (2012) [22] used the binomial lattice model considering the possibility before expiry of the option to postpone the granting of releasing of the final order to the next period. However, previous studies showed that although Discounted Cash Flows (DCF) based measures are not able to price the flexibility embedded in a solar ready building, the NPV approach represents a perfect starting point to display cash flows of projects, and if it is combined with the option value, it can provide a reliable quantification of the analyzed project (see [10]).
This article contributes to the existing literature in the way of merging economic, climatic, and political aspects to valuate PV projects. We propose an ROA to valuate a PV investment among regional areas of Italy. This approach valuates the energy investor’s choice that is subject to flexibility, in terms of the opportunity to postpone his/her decision on an irreversible investment. Regarding policy behavior, over the last year, the diffusion of PV projects in Italy has been encouraged by some effective promoting policies that were implemented by the Italian Government in compliance with the directives promulgated by the European Union (see [19]). We show that when the public authority intervenes by granting tax benefits on maintenance costs, it can be advantageous for the manager do not abandon a project with a negative NPV, but to defer it and exercise it if the value of the underlying project grows over the time. We manage to link the values of these investments to the temperature level that measures the effectiveness of solar panels. The paper is organized as follows: Section 2 provides the basic model to combine NPV with ROA. Section 3 shows a case study referred to Italy presenting also a sensitivity analysis, and finally, the conclusion is given in Section 4.

2. Basic Model

The exposure to solar irradiation, which depends on the geographical location, is the primary variable that affects the PV panels’ performance. Therefore, before proceeding with the project valuation and installation of PV panels, it is necessary to study the performance of solar panels considering the site where they are located. Firstly, we consider environmental factors referred to meteorological and micro-climate effects (see [18]). After that, agents can carry out the economic and financial analysis of their investment opportunities in solar energy and quantify the uncertainty.
In order to realize the PV investments, the economic rule that must be applied is equivalent to comparing all the prospective business revenues, which we denote as R e v i for years i = 1 , , n , with the potential monetary exits. The business revenues concept in this case is referred to benefits deriving from the installation of the panels in terms of the difference between the electricity costs without panels (over the last few years) and the ones using solar panels. We denote by I 0 the initial investment that investors can amortize over time and by M C i the annual costs that are essential for maintaining the solar panels. The value of M C i takes also into account the concept of setting aside funds for replacement parts and building renovations. Depending on the meteorological situation of each specific country, the cost of the initial investment could also include the addition of batteries where needed and consequently adding other maintenance costs. This could challenge the different energy production among the months of year. Regarding this point, Oliva et al. (2019) [23] showed that the addition of batteries increases the value of PV systems. In this case, I 0 would become the result of I 0 = C a p i t a l r e q u i r e d f o r P V p a n e l s + C o s t s o f b a t t e r i e s . However, since the battery complement is not always necessary, we consider a generic value of I 0 .
In our model, the role of the public authority consists of favoring green investments applying tax benefits, which we denote as T B (ratio of the Tax Benefit). Therefore, the economic advantage to realize the solar investment at time t 0 can be represented as:
N P V = i = 1 n R e v i + M C · T B ( 1 + r ) t i I 0 i = 1 n M C i ( 1 + r ) t i
where r is an appropriate discount rate that considers the riskiness of the solar investment energy sector. Although the NPV approach is not suitable to systematically value the managerial flexibility embedded in the solar energy investments (see [13]), it is certainly a good starting point. In fact, the NPV approach is one of the most common techniques in order to evaluate investment projects, and it is widely used by developers, financial institutions, and government agencies under the condition of definite cash flows, as was shown by Agaton and Karl (2018) [24]. Following the standard NPV rule, an investment will be realized at initial time t 0 if the NPV is positive, otherwise the investors will prefer to abandon its realization. Moreover, the idea of waiting and then investing only when NPV becomes positive could not be successful due to the latter approach not allowing making an ex-ante valuation able to embed all possible future scenarios in the investment value. In fact, it would be characterized by the sequential decision according to which the investor makes a decision in correspondence with each different instant of time in the future. This insight was shown by Panayi and Trigeorgis (1998) [16] for technology infrastructure. The insight to be based only on NPV in correspondence with each future time does not permit considering unpredictable future scenarios in the project valuation. This is permitted by ROA.

The Real Options Approach for the Valuation of a Solar Investment Project

As we have seen previously, the NPV approach realizes a static analysis since it does not take into account the managerial opportunity that an investment project can be abandoned, enlarged, or postponed. In fact, the theory of real options allows considering these possibilities and consequently a better performing value of the project. However, this approach sometimes becomes difficult to implement because of the lack of information about market prices (see [25]). Despite this inconvenience, ROA is widely used in business because it allows the decision maker to manage his/her investments adding managerial flexibility in the presence of uncertainty.
Two basic approaches exist for implementing ROA:
  • The closed-form approach, which is suitable for a European option, which can be only exercised at maturity. The most important model is, for instance, that of Black and Scholes (1973) [26].
  • The open-form method, including the lattice approach, which provides a straightforward way to analyze and value of more general types of options.
We focus this study on the valuation of solar investment through the binomial multi-period approach proposed by Cox et al. (1979) [27]. In quantitative finance, the binomial lattice model is a technique applied to valuate derivatives considering discrete time. We assume that the underlying asset of a real option is represented by discounted potential business advantages, i.e., P V R e v . In other words, P V R e v is referred to the present value of revenues. Using a binomial lattice, the maturity T is divided into n periods with the same length Δ t = T / n . Figure 1 depicts the evolution of P V R e v along the binomial tree evolution with the assumption that the maturity T = 1 year is divided into n = 2 periods, and so, Δ t = 1 / 2 . This means that the manager makes the decision at the end of each node.
The capital required for PV investment I 0 denotes the strike price in order to exercise the option. Therefore, when the investor realizes the investment I 0 , he/she obtains the benefits of solar project investments, namely P V R e v = i = 1 n R e v i ( 1 + r ) t i .
In this phase, we do not consider the maintenance costs in the computation of panels’ present value because they are taken into account in the expected value related to potential tax benefits. Therefore, when the investor realizes the investment I 0 , he/she obtains the value of project P V R e v . The asset value evolves as a binary random-walk with two movements: up ( u P V R e v ) with a risk neutral probability q and down ( d P V R e v ) with a probability ( 1 q ) . The relation among these parameters, in order to avoid arbitrage, is that d < 1 + r f < u with u > 1 , d < 1 , and r f is the annual risk-free interest rate. The risk-neutral interest rate is performed with the length of each step, and so, the risk-neutral probability q follows:
q = ( 1 + r f ) Δ t d u d
where u = e σ Δ t and d = e σ Δ t . The value of σ represents the volatility, which is a statistical measure of the dispersion of returns for a given security or market index. In other words, σ represents the percentage variation of a financial asset during time.
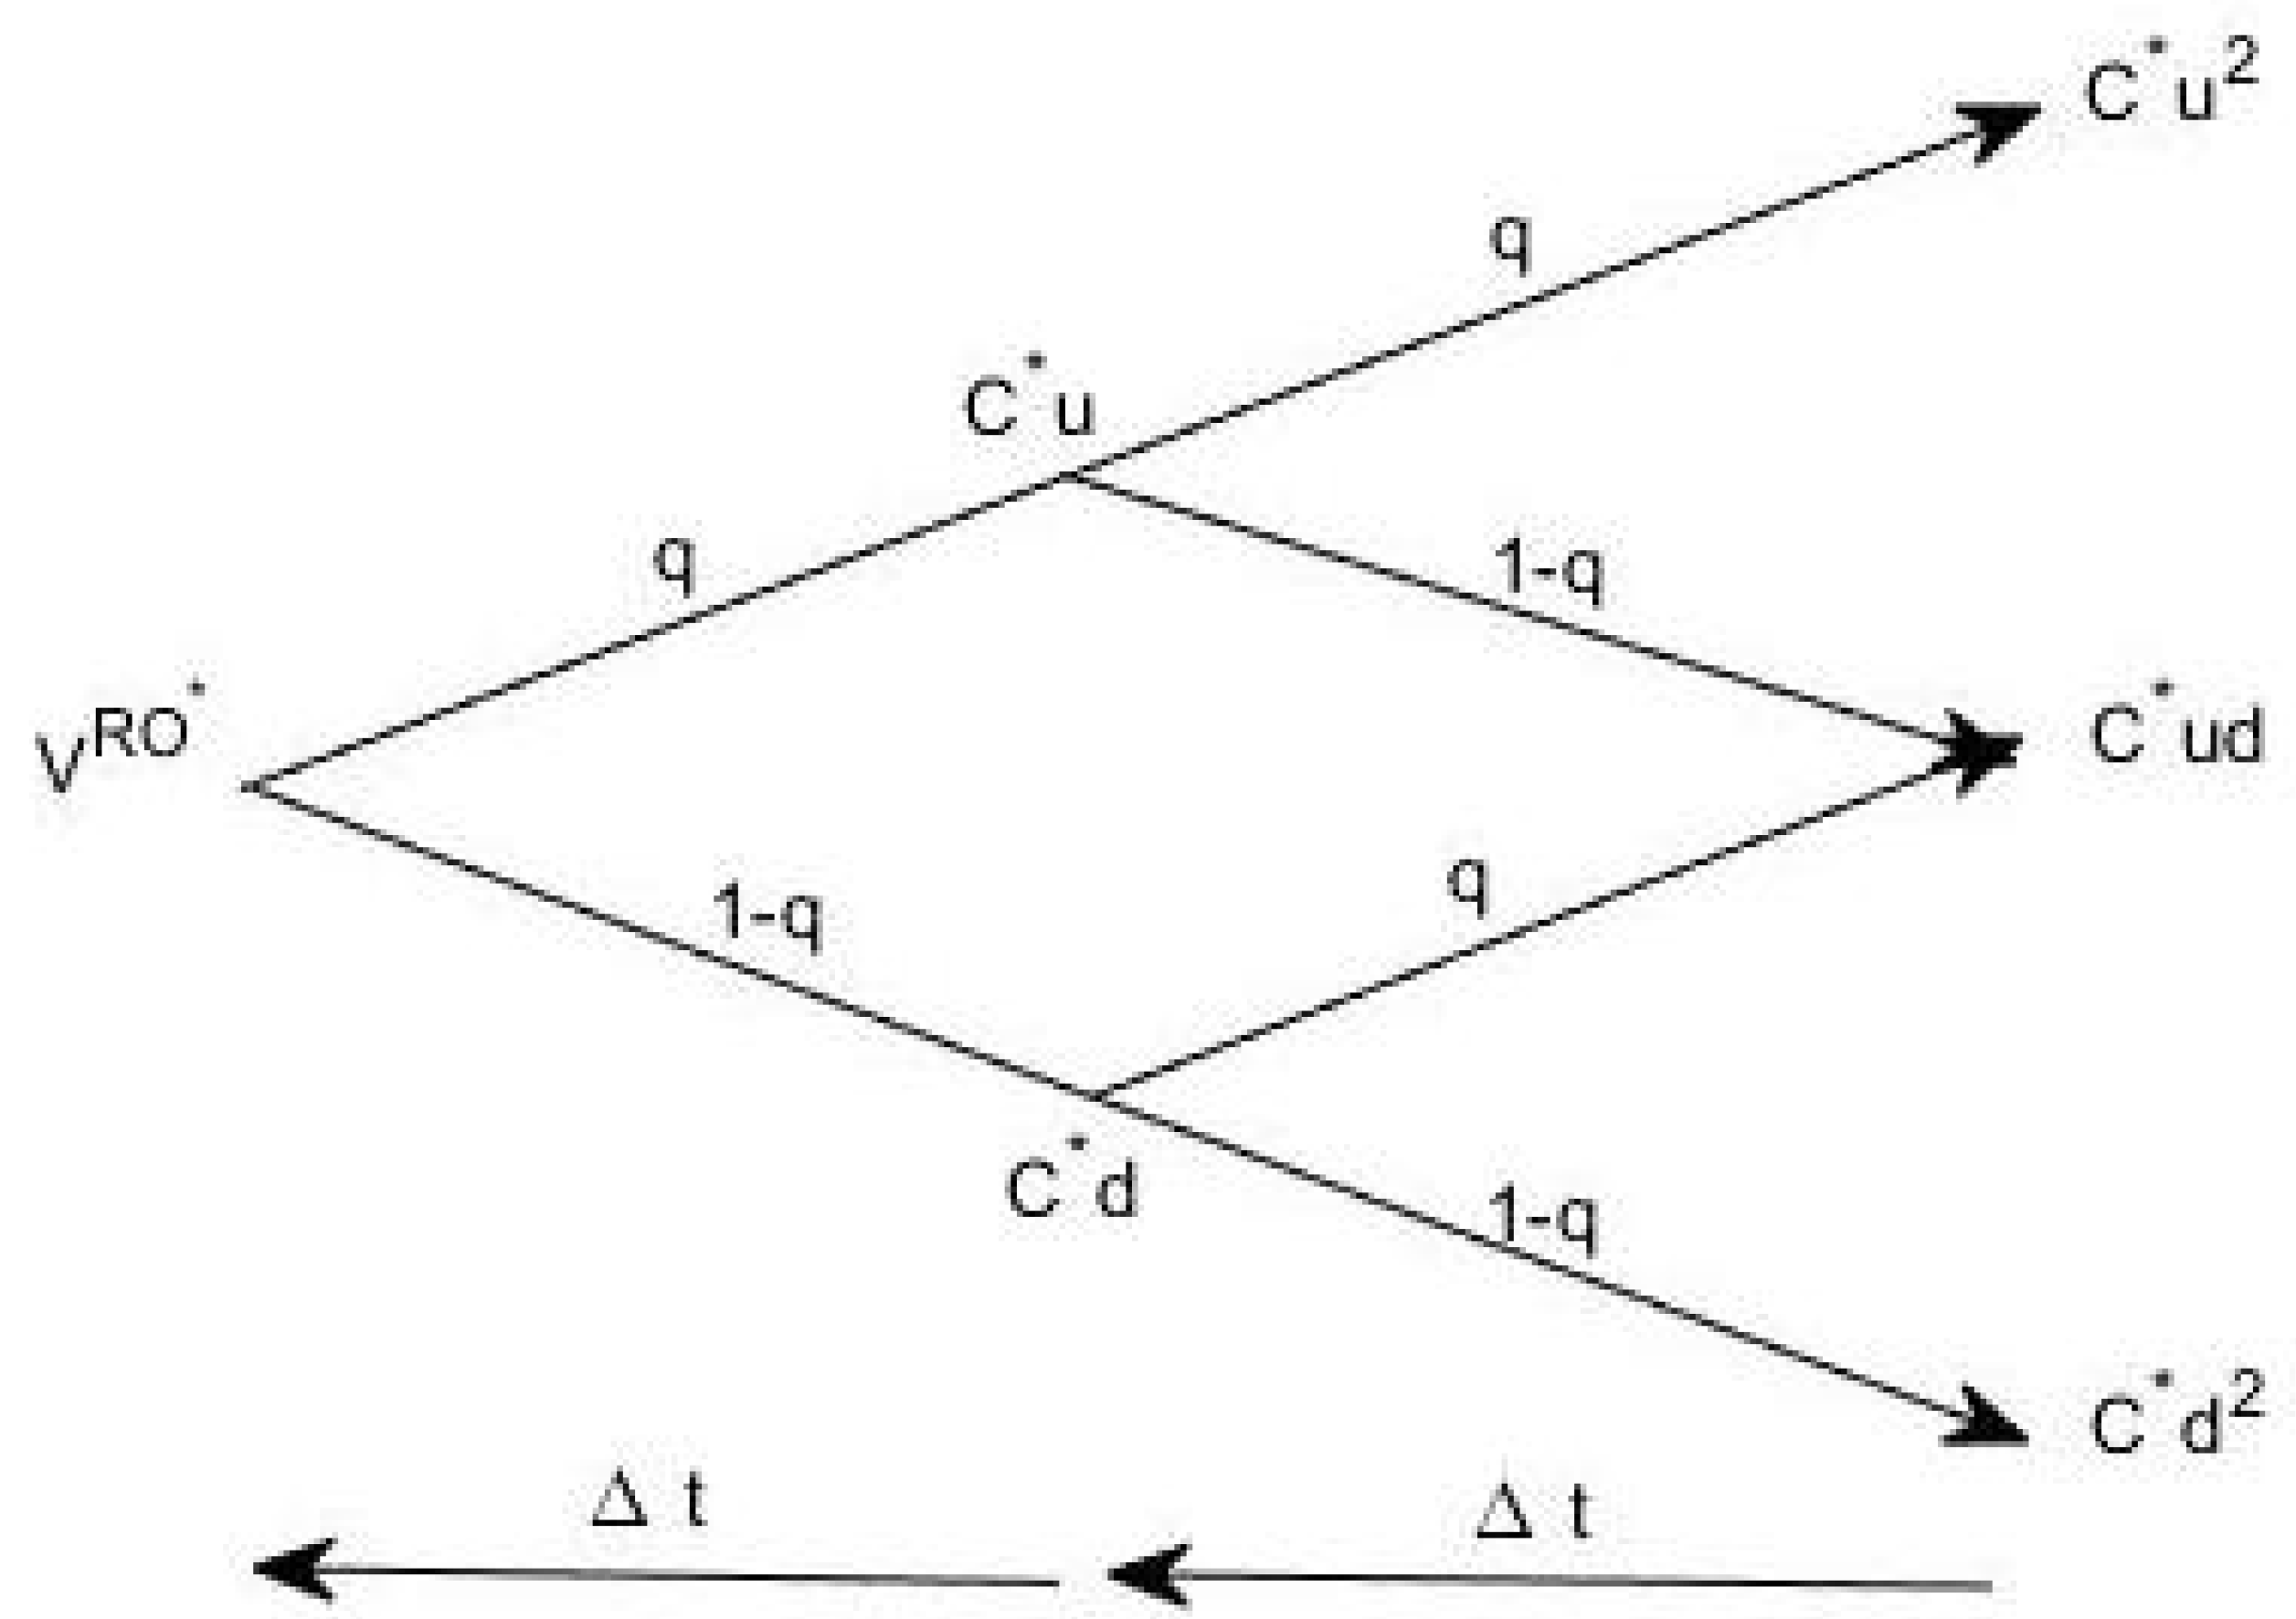
Consequently, the value of the real option is determined by the backward induction approach (see Figure 2). Therefore, moving at the end of the tree, we compute the payoffs at the terminal values. The investor decides to exercise a call option if the capital investment required for project I 0 is less than the evolution of the underlying asset in correspondence to the different probability levels of increasing (u) or decreasing (d). Assuming two instants of time, we have the following payoffs:
C u 2 = max u 2 P V R e v I 0 [ ( 1 + r f ) Δ t ] 2 ; 0 C u d = max u d P V R e v I 0 [ ( 1 + r f ) Δ t ] 2 ; 0 C d 2 = max d 2 P V R e v I 0 [ ( 1 + r f ) Δ t ] 2 ; 0
In this case, the American call option type is taken into account, and this implies the probability to expand the strategic project at any time before the expiration date. The feature of exercising at any time before expiry is typical of the American options type. On the other hand, European options can be exercised only at the expiration date and so at a specific pre-defined year. Another classification is referred to the difference between a call option and a put option. A call option gives the investor the right to buy the underlying at a specified price (in the case of ROA, to expand the investment), whereas a put option gives the investor the right to sell an asset (in the real case, not to proceed with the investment).
For the previous node, the maximum between the payoffs obtained exercising the option and the value obtained by keeping the option alive is computed. It results that:
C u = max u P V R e v I 0 [ ( 1 + r f ) Δ t ] , q C u 2 + ( 1 q ) C u d ( 1 + r f ) Δ t C d = max d P V R e v I 0 [ ( 1 + r f ) Δ t ] , q C u d + ( 1 q ) C d 2 ( 1 + r f ) Δ t
Finally, we valuate at time t 0 the investment project opportunity as a call option:
V R O = max P V R e v I 0 , q C u + ( 1 q ) C d ( 1 + r f ) Δ t
As Cox et al. (1979) [27] showed, the exercise of a call option before the maturity is not optimal. However, adding the Maintenance Costs ( M C ) discounted at risk-free interest rate r f and the possible tax benefits granted by the government to encourage green investments, the investor decision can change, and he/she could decide to exercise the option before the maturity. Regarding this, we assume that maintenance costs are constant and stable over time and that they are affected by the potential tax benefits. In other words, when the investor realizes the cost of maintenance M C , the public authority can give, with a probability p, a tax benefit equal to T B · M C , where T B is the ratio of the tax benefit. Therefore, considering the compound probability, it will be M C + p · T B · M C in the first node and M C + p n · T B · M C in the last node. Therefore, we reformulate the option value in this way:
C * u 2 = max C u 2 M C ( 1 T B p 2 ) ; 0 C * u d = max C u d M C ( 1 T B p 2 ) ; 0 C * d 2 = max C d 2 M C ( 1 T B p 2 ) ; 0
At this point, working backward, we obtain that:
C * u = max C u M C ( 1 T B p ) , q C * u 2 + ( 1 q ) C * u d ( 1 + r f ) Δ t C * d = max C d M C ( 1 T B p ) , q C * u d + ( 1 q ) C * d 2 ( 1 + r f ) Δ t
This means that an increase of government influence characterized by a growth of p and/or T B implies a competing driver to invest sooner considering that the government might reduce or remove subsidies in the near future. Thus, if:
C u M C ( 1 T B p ) > q C * u 2 + ( 1 q ) C * u d ( 1 + r f ) Δ t C d M C ( 1 T B p ) > q C * u d + ( 1 q ) C * d 2 ( 1 + r f ) Δ t
then the investor exercises the option before expiry due to the exercised value being higher than the waiting value.
Finally, we realize the real option value to invest at initial time t 0 considering the role of the public authority as:
V R O * = max P V R e v I 0 , q C * u + ( 1 q ) C * d ( 1 + r f ) Δ t
Figure 3 represents the real option evolution for PV investment. Finally, adding to the static NPV the managerial flexibility valuated as a real option that the investment can be postponed over time, we are able to embed uncertainty and flexibility in order to reach the ENPV as a criterion for the choice and valuation of these investment types. We can state that:
E N P V = N P V + V R O *

3. Case Study

In this section, we provide the case of Italy to valuate PV project in all regional areas by using the ROA considering potential authority incentives. We consider tax benefits as incentive measure due to in 2013 the Italian government adopted tax credits program (see [28,29,30]). Orioli and Di Giangi (2017) showed that the new program implied a global benefit on PV system costs equal to various percentage of expenses according to different years [19]. In this article we assume government could adopt an incentive measure related to tax benefits of 50% deducted directly on maintenance costs. We focus on Bari that is a city located in the south of Italy sufficiently exposed to solar irradiation. We present the results for the other regional capitals. This allows to make a comparison between different regional areas of Italy.

3.1. Analysis of Meteorological and Geographical Conditions

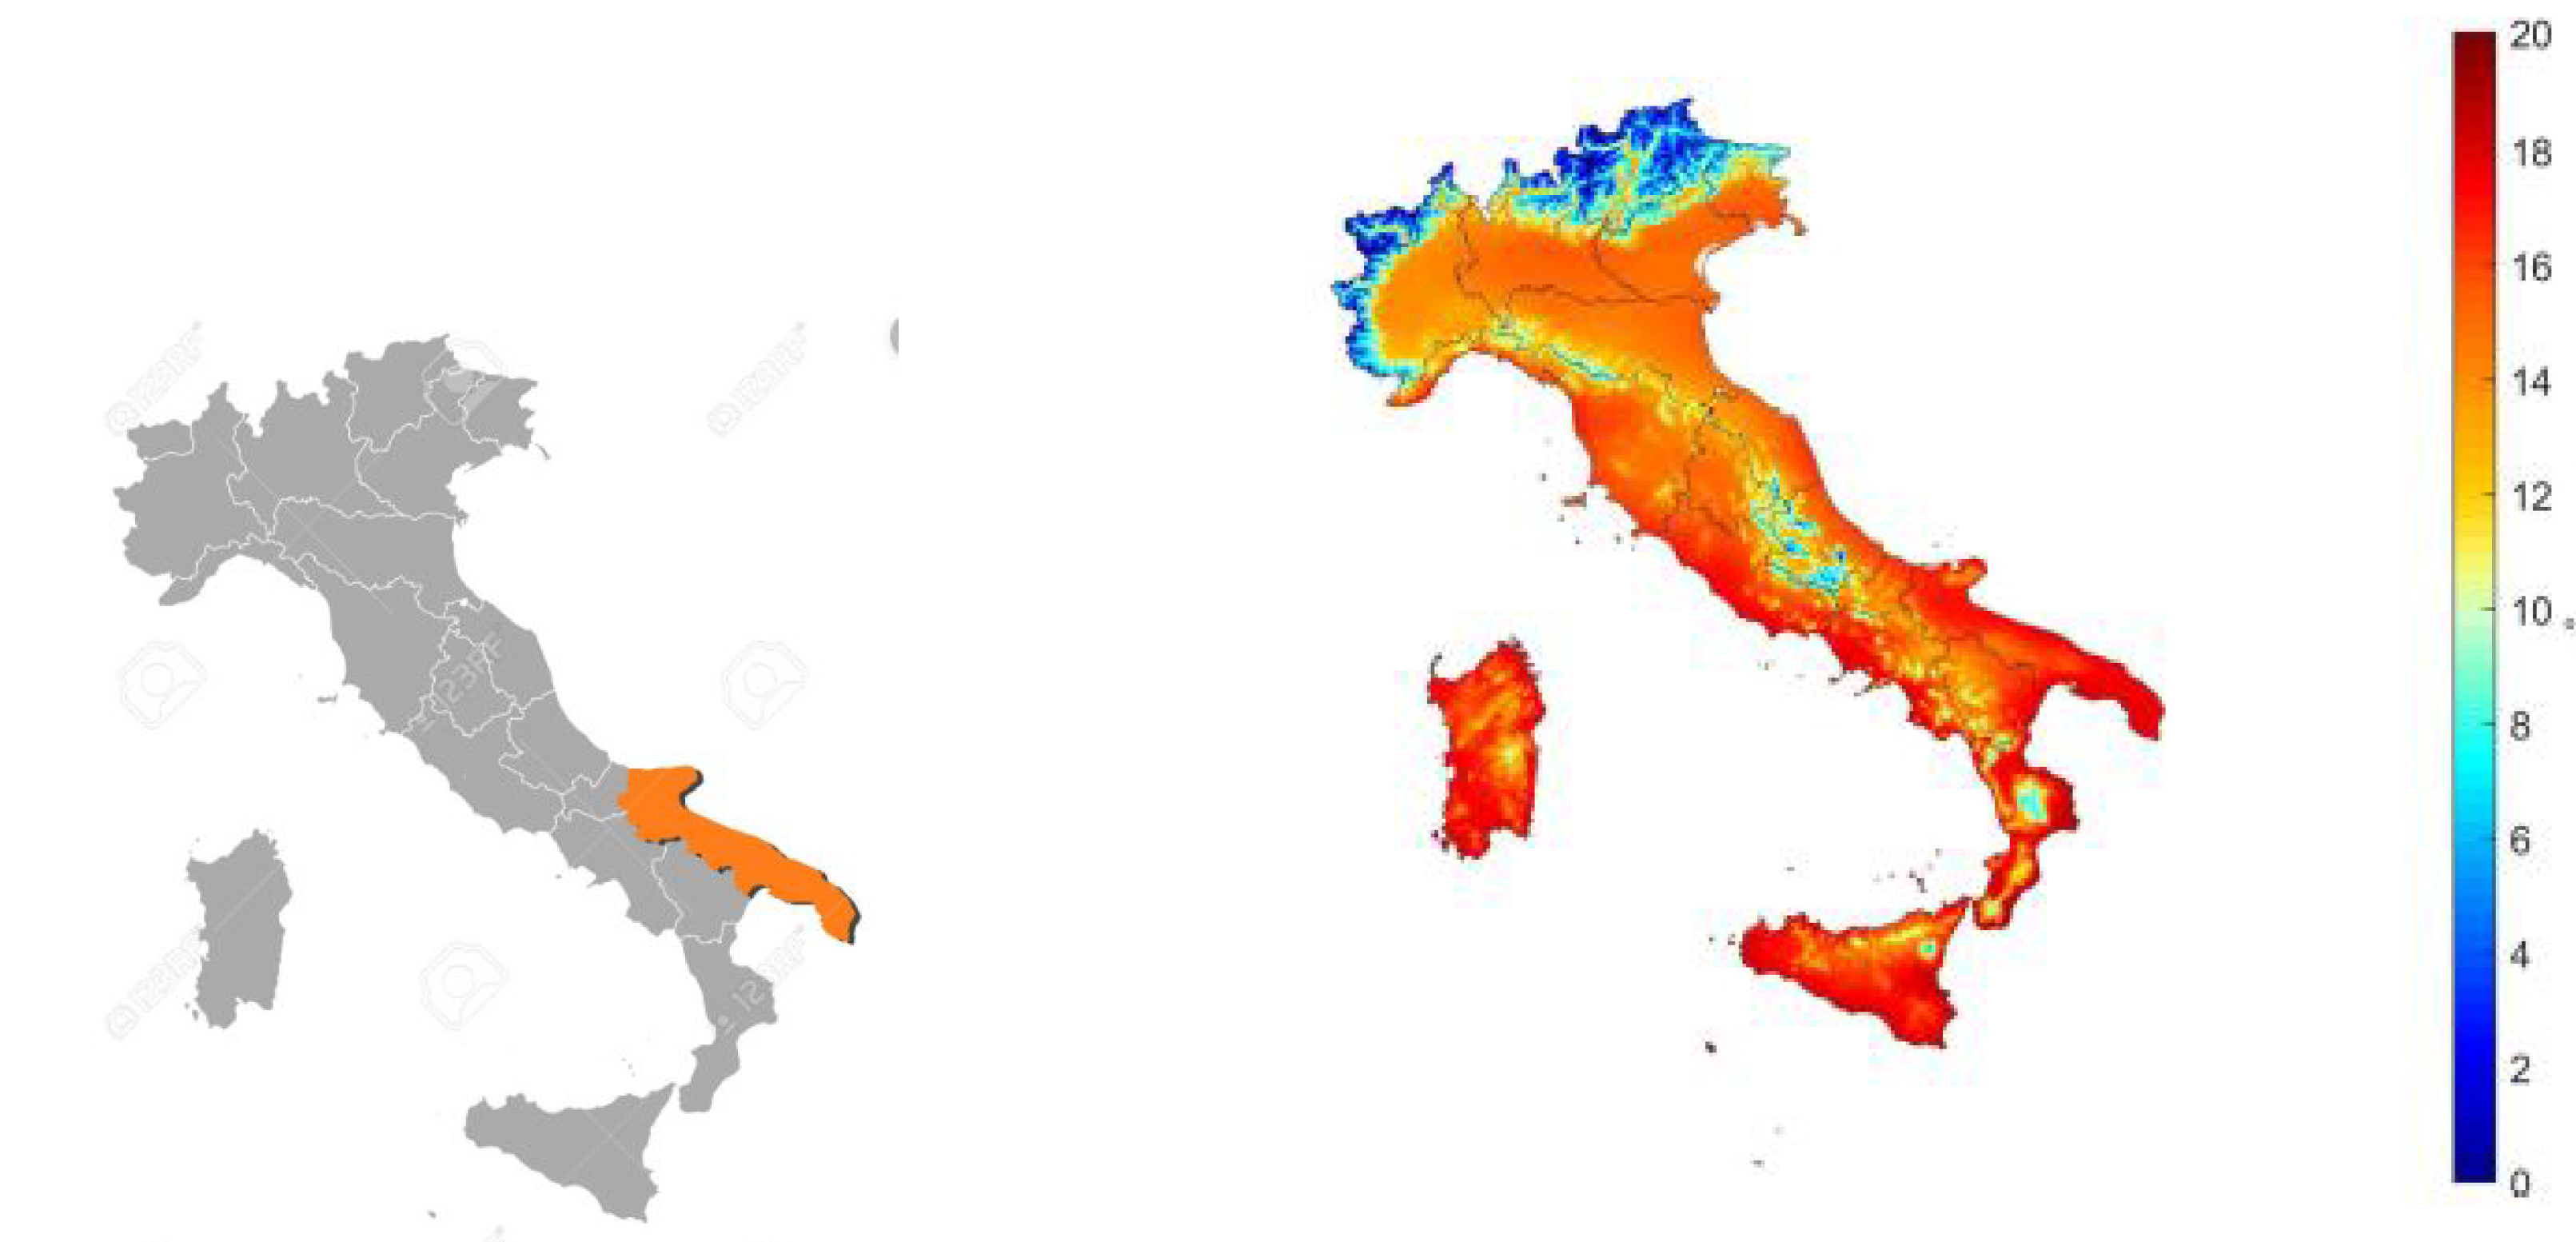
Firstly, we analyze the region that includes the city of Bari, Puglia, where we should apply the solar energy investment. We realize this analysis in order to understand if area of Puglia is generally favorable. This study allow us to implement a comparison among other areas of Italy. Considering that there is a strong relation between solar irradiation and incremental temperature, we take into account this latter factor in order to examine the advantage to install PV panels in city of Bari. In fact, Figure 4 shows annual average temperature in all regions in Italy in 2019, as referred by Italian Institute for Environmental Protection and Research.
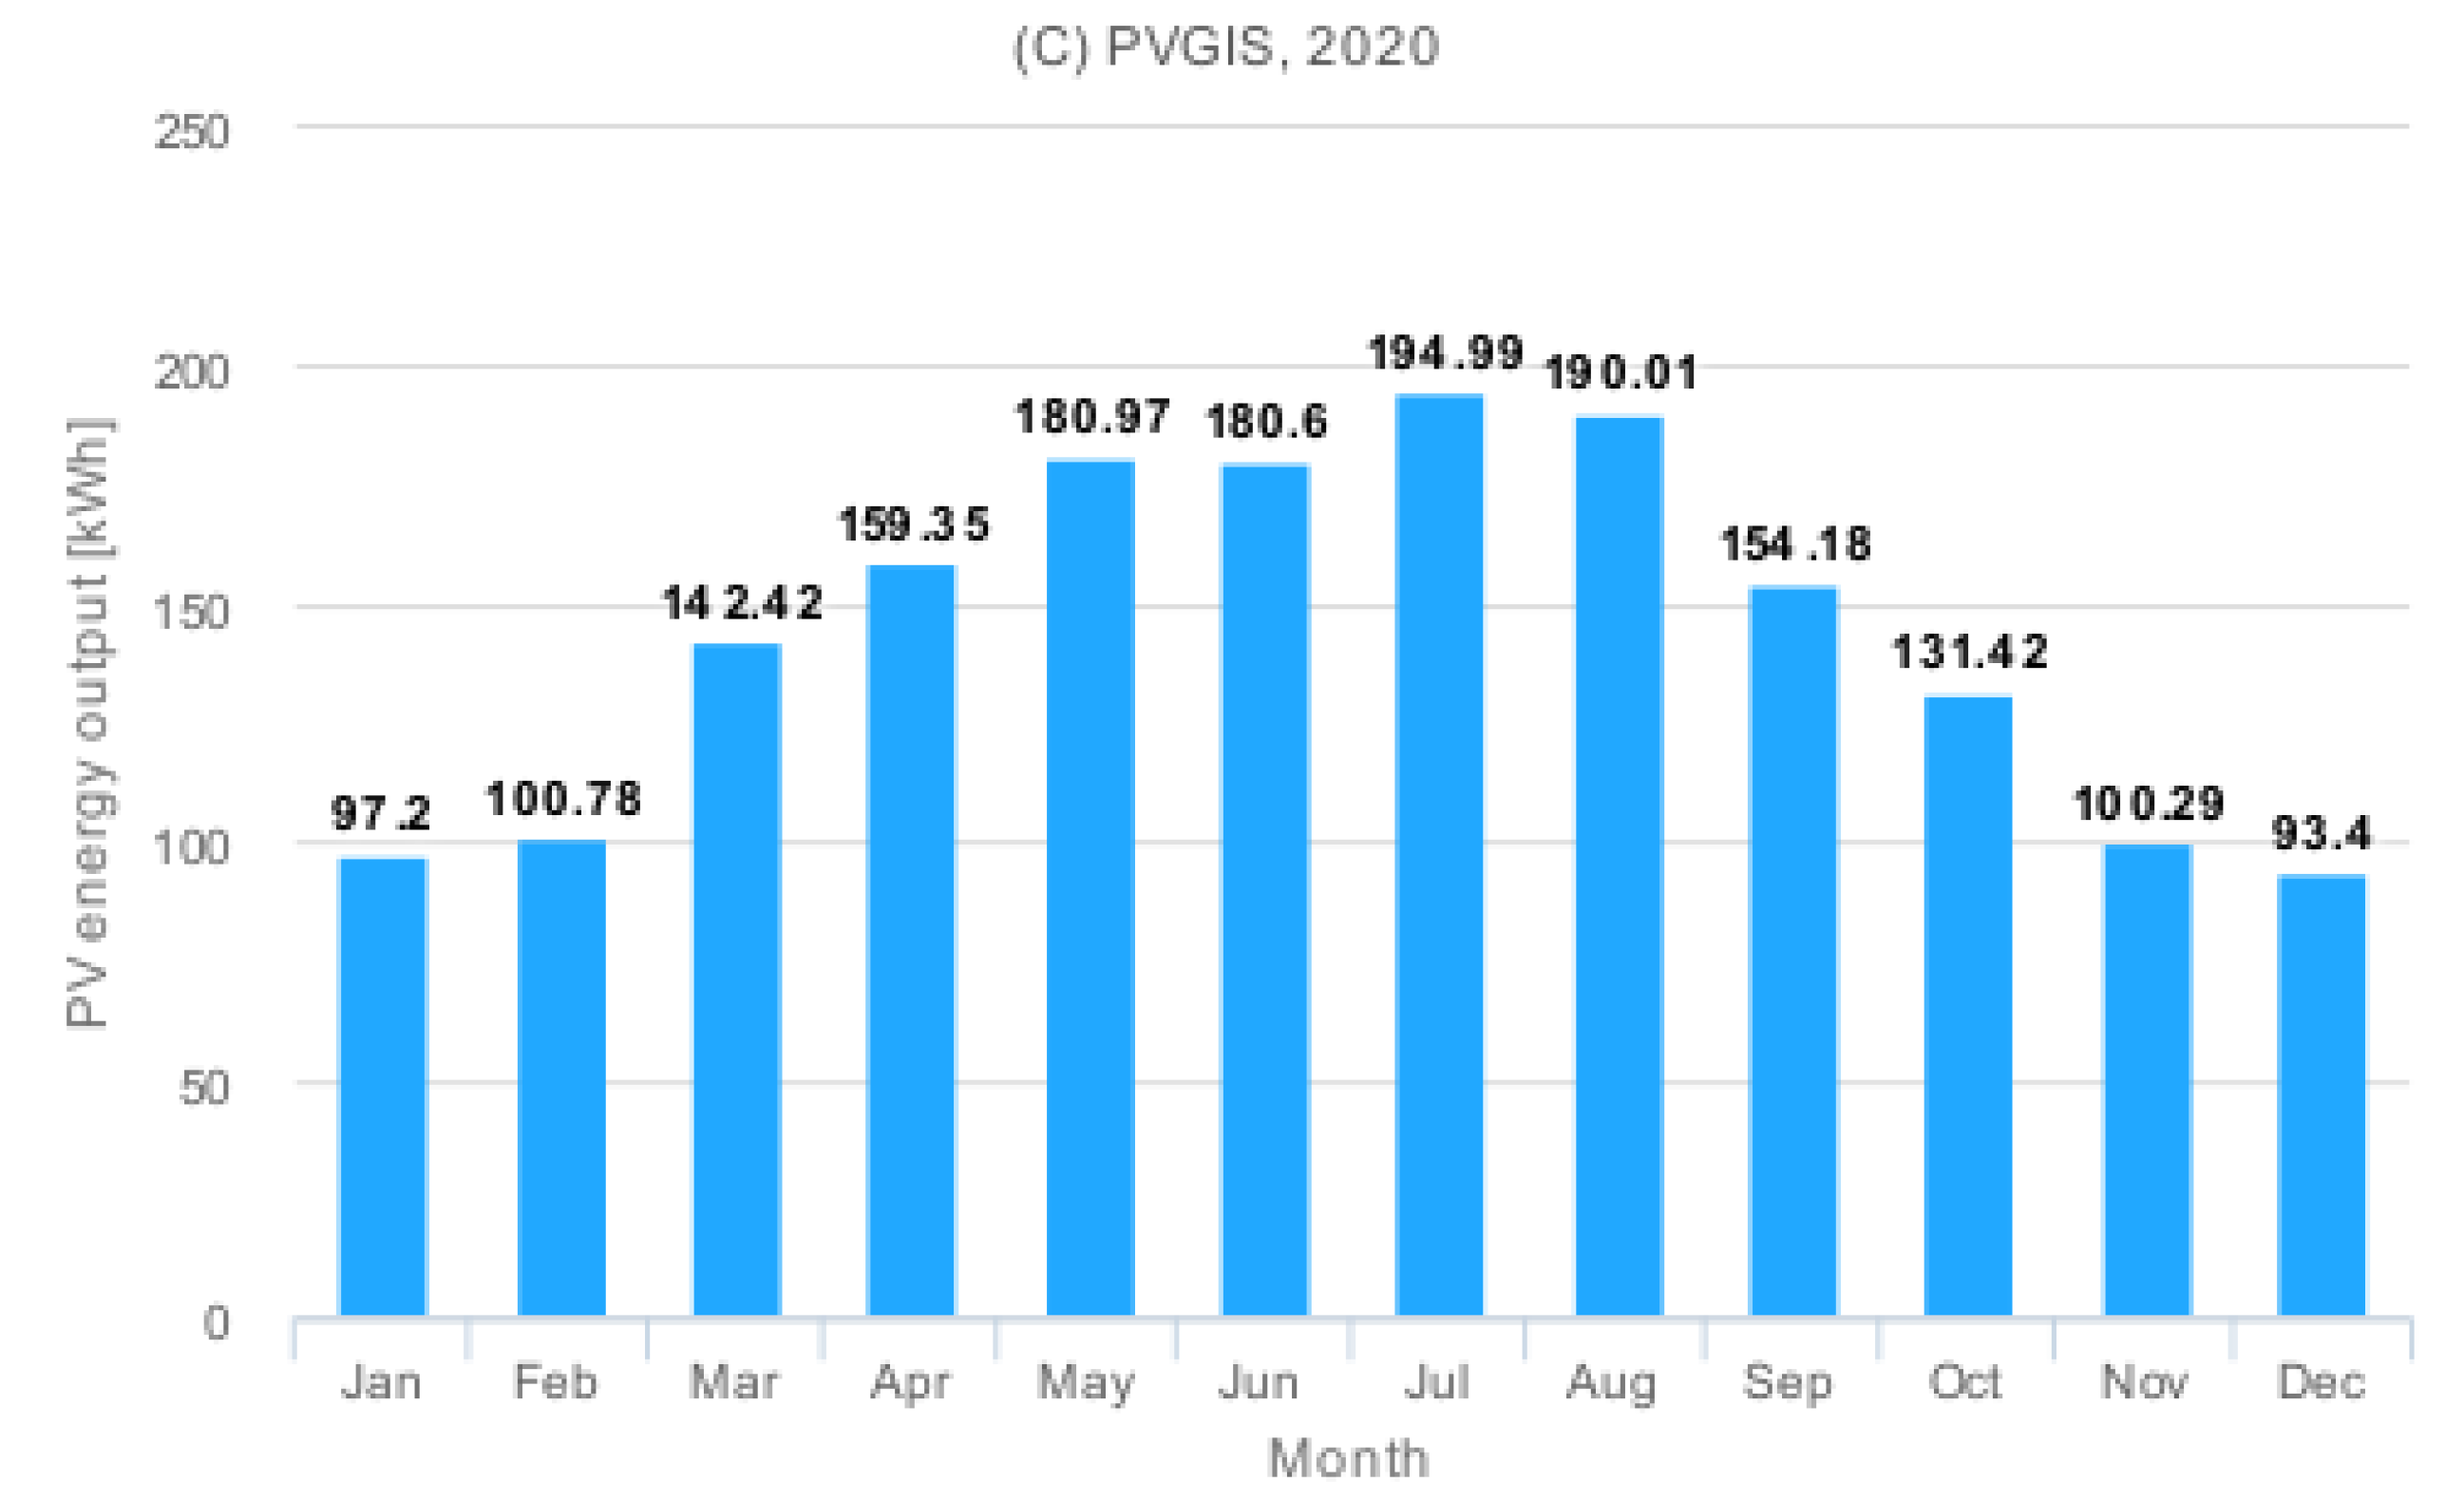
We highlight how the Puglia region, where the city of Bari is located, is potentially a favorable location for installing PV panels because its yearly average temperature is from 15 to 18 °C. In order to valuate the performance of PV panels located in Bari, Figure 5 shows us respectively the PV energy output in terms of KWh and in-plane irradiation in every month of the year 2019 for a single panel installed in Bari (the data are given considering the PVGIS-SARAHdatabase that is produced using the CM SAF algorithm for Europe, Africa, Asia, and parts of South America).
For this purpose, we considered an installation of a PV panel that uses crystalline silicon as the technology with an angle of 35 from the horizontal plane. Currently, the initial cost to make this investment is around I = 2000 €, a single panel of 1 kWp, which will be amortized using an interest rate r = 2.2 % . The value of I consists of the capital required for installing the PV system, including the system components, such as PV modules, mounting, inverters, cables, and so on, and moreover, installation costs. We consider a fixed interest rate on a loan spread over ten years that will be paid back in yearly installments for the lifetime of the system. Data are summarized in Table 1. These results allow understanding the total electricity cost of the PV panel derived from a simple multiplication, i.e., 1725.61 kWh × 0.154 € = 265.74 €. The value of PV electricity cost of 0.154 is given considering the PV system cost of 2000 €, an interest of 2.2%, and a lifetime of 10 years. In this way, we are able to calculate the advantages in terms of lower cost between the use of solar energy and the one of a traditional source of energy. According to the statistical office of Eurostat, the average electricity price including taxes for household consumers in Italy in the first half of 2019 was equal to 0.2301 € per kWh. Consequently, if we consider the same quantity of energy produced by PV panels, the overall electricity cost is about 397.06 €. Therefore, we can affirm that there is a yearly benefit using PV energy compared to the traditional energy source equal to 131.32 € ( 397.06 265.74 ) under the net metering assumption. Net metering is an electricity billing mechanism that allows consumers who generate some or all of their own electricity to use that electricity anytime, instead of when it is generated. In Italy, this mechanism is regulated legally by “L’autorità per l’energia elettrica e il gas”and economically by “Gestore dei servizi energetici”.
It is also necessary to take into account the efficiency losses of the PV system due to the natural degradation of the panels, which is taken into account in the next section, where we propose the economic and financial analysis.

3.2. Economic and Financial Analysis of a Solar Energy Investment

Now, we provide a reliable NPV valuation considering the following aspects that affect the cash flows of solar investment. Before proceeding with the cash flow analysis, we take into account the “estimated system losses”(this is referred to all the losses in the system, which cause the power actually delivered to the electricity grid to be lower than the power produced by the PV modules; the causes for this loss could be losses in cables, power inverters, dirt (sometimes snow) on the modules, and so on.) due to degradation, which in the Mediterranean climate zone is about 1.48% year by applying the Classical Seasonal Decomposition (CSD) method (see [31]).
At this point, we subtract 1.48% of annual energy production, and then, we multiply these results by the electricity price determined above, i.e., 0.2301 € per kWh. The annual cash flows determined are listed in Table 2, assuming tax benefits for 50%. Finally, on the basis of the data available in Table 2, we can compute the discounted cash flows of revenues using an interest rate r = 7.5 % , and so, we obtain P V R e v = 2535.38 €.
We assume that the maintenance costs are constants over time and equal to 200 € per year. In this way, the NPV can be determined as:
N P V = 391.19 + 200 · 0.50 ( 1 + 0.075 ) + 385.40 + 200 · 0.50 ( 1 + 0.075 ) 2 + 379.69 + 200 · 0.50 ( 1 + 0.075 ) 3 + + 374.07 + 200 · 0.50 ( 1 + 0.075 ) 4 + 368.54 + 200 · 0.50 ( 1 + 0.075 ) 5 + 363.08 + 200 · 0.50 ( 1 + 0.075 ) 6 + 357.71 + 200 · 0.50 ( 1 + 0.075 ) 7 + + 352.41 + 200 · 0.50 ( 1 + 0.075 ) 8 + 347.20 + 200 · 0.50 ( 1 + 0.075 ) 9 + 342.06 + 200 · 0.50 ( 1 + 0.075 ) 10 + t = 1 10 200 ( 1 + 0.075 ) t 2000 = 151.03
Based on the conventional use of the NPV criterion, investors should not invest in the solar project since the NPV is negative, and consequently, they should abandon its realization. However, the NPV approach assumes a certain “expected scenario”, and it does not consider the value of managerial flexibility, the opportunity that the investment can be postponed for waiting for better scenarios, and so on. In fact, in the real case, the realization of cash flows will probably differ from the initial managerial expected wishes. For this reasons, the ROA is suitable to take into account features about the PV investment and their managerial flexibility (see for instance [12,13]). In this way, the real option should add value to the solar investment, and the investor decision about its realization changes.

3.3. Real Options Approach for the Valuation of PV Investment

In this section, we adopt a step-by-step approach that considers all computations starting from the evolution of the underlying asset ( P V R e v ) to valuate the real option considering the potential tax benefits, i.e., C * . As we have seen previously, P V R e v = 2535.38 €, and the cost of a panel is equal to I = 2000 €. Moreover, in order to determine the volatility of such an investment, we assume that there is a proxy with companies that carry out activities whose shares are listed on the market. Therefore, another aspect of uncertainty that we consider in the real options approach unlike the NPV is linked to the volatility of the electricity price based on a historical analysis (the choice of volatility value σ = 0.4067 was made considering the volatility of ERG SPA between years 2019 and 2020). We estimate σ = 0.4067 , and we use a risk-free discounted rate r f = 0.022 . In addition, the deadline of PV benefits is assumed to be T = 10 years, and we suppose that the real option can be exercised at the end of each year, so n = 10 . Consequently, Δ t = 1 , u = e σ Δ t = 1.5018 , and d = e σ Δ t = 0.6658 . In our paper, we assume a ratio of tax credit equal to T B = 0.50 on the basis of the Italian case, and the probability that this tax benefit will remain every year is assumed p = 0.95 .
We create the process of underlying asset evolution using the binomial multi-period model as shown in Figure 6.
However, based on the American exercised rules defined by Equations (6) and (7), investors decide to exercise the option when the exercised value at each node is higher than the waiting value. Therefore, assuming constant expected maintenance costs M C = 200 € that are affected by a tax benefit granted by the government with a probability p = 0.95 , Figure 7 displays the American option results in the binomial lattice model.
In Figure 7, the yellow cells represent the values for which it is profitable to exercise the American option before maturity, which in real terms means that it is better to make the investment and not postpone it, as shown in Equation (12).
C + / M C ( 1 T B · p ) > q C + + ( 1 q ) C ( 1 + r f ) Δ t
where C + is the up option node, C is the down option node, and C + / represents the node in the previous year. Conversely, the white cells denote the scenarios for which the deferring decision is better. This happens because investing now implies a loss of opportunity to invest later, which corresponds to the value of delaying the option. Therefore, the value generated by the project should be sufficiently high to cover the deferral option. In addition, when the underlying asset has lower values, the option to postpone for the next period is a better choice. Therefore, this could be expressed as a strategy for the investor according to which the investor has the advantage to exercise the option in correspondence with the yellow cells of Years 6-9. The real option value V R O * that valuates the managerial flexibility to postpone the implementation of PV investment is equal to 1316.59 €. Consequently, the ENPV is equal to:
E N P V = N P V + V R O * = 151.03 + 1316.59 = 1165.56
Including the value of flexibility represented by the real option, the ENPV increases, and so, the manager can modify its decision. In other words, if the investor decides only on the basis of NPV, he/she would refuse the PV investment, while, on the basis of ENPV, the PV investment is attractive.
We can repeat this analysis for all Italian regional capitals to obtain a wider vision about the profitability of PV panels in Italy. Results are displayed in Table 3.
It clearly shows how the NPV values are negative for all Italian regional capitals except for Cagliari based on the estimated parameters. Overall, it changes between a minimum value 658.18 recorded in Aosta and a maximum value of about + 22.14 in Cagliari. However, if we considered the possibility of postponing this project waiting for better market conditions, the ENPV is positive also in the event that NPV is negative. In this case, the maximum value of PV investment is in Cagliari with + 1474.12 and the minimum in Aosta with + 305.05 . These values highlight the close correlation between the areas with higher temperatures and the higher investment values.
Finally, we propose a sensitivity analysis when the probability to receive the tax benefit p and the ratio T B change. We study the case of PV investment in Bari, and all numerical simulations are referred to Table 4.
These results clearly show that an increase in both the tax benefit ratio T B and the probability p implies a growth of the real option value. Obviously, the impact of tax benefit T B in terms of different real option values decreases when the probability of this measure goes down.

4. Conclusions

In this paper, we presented a step-by-step real option valuation of a solar energy investment considering potential public incentives. We showed that the NPV approach is insufficient to valuate PV projects because it does not embed uncertainty and managerial flexibility in its calculation. Sometimes, investment valuated using this approach could be undervalued. Therefore, on the basis of NPV analysis, investors could make a non-reliable valuation that could imply the wrong decision to abandon the investment. For this reason, ROA is used to embed uncertainty in the project value. After analyzing meteorological and micro-climate effects, we presented the model based on the binomial tree, which allows calculating the real option as an American call option. This type of real option is characterized by the fact that the investor can defer this choice, in a context in which he/she can receive tax benefits with a certain probability. Combining the real option value with NPV, we are able to take into account the aspect of flexibility in the valuation through the ENPV. We presented a case study of Italy, and the results confirmed previous studies about the inadequacy of the NPV approach. We analyzed the PV investment values in each regional capital, and we noted that cities with a high solar irradiation exposure have a positive NPV and a very high ENPV. On the other hand, although there is a higher number of cities in which the NPV is negative, the inclusion of the flexibility in the investment decision allows changing the negative NPV valuation into a positive ENPV valuation. Thus, the profitability of solar panels is confirmed in each regional capital of Italy. Regarding the impact of incentive policies, we proposed a sensitivity analysis showing how the option value increases when incentive policies become more attractive and more likely. The results of the sensitivity analysis showed a strong positive relation between the real option value and potential incentive measures of the government. This paper contributes to the existing literature in the way of valuating PV investment taking into account political, economic, and meteorological aspects. However, sometimes batteries could be added to PV panels to make available energy when it is needed. This situation could produce other scenarios such as the probability of battery failure, the perspective analysis of battery duration, and the cost-benefit analysis of this technology. These factors should be needed to consider valuating these projects. Future work should examine how the combination of batteries and PV systems affects the profitability of a PV investment project. Another important analysis that could be conducted by future work is to consider how the PV panels’ profitability can change on the basis of different trademarks, also considering the different characteristics, such as efficiency, material, value for money, etc., according to which each trademark could produce the best performance.

Funding

This research received no external funding.

Conflicts of Interest

The author declares no conflict of interest.

References

  1. Li, X.; Ramshani, M.; Khoj, I.A.; Omitaomu, O.; Hathaway, J.M. An agent based model for joint placement of PV panels and green roofs. In Proceedings of the Simulation Conference (WSC), Las Vegas, NV, USA, 3–6 December 2017; pp. 1133–1144. [Google Scholar]
  2. Cui, Y.; Yao, H.; Hong, L.; Zhang, T.; Xu, Y.; Xian, K.; Hou, J. Achieving over 15% efficiency in organic photovoltaic cells via copolymer design. Adv Mater. 2019, 31, 1808356. [Google Scholar] [CrossRef] [PubMed]
  3. Lee, H.K.H.; Barbé, J.; Meroni, S.M.; Du, T.; Lin, C.T.; Pockett, A.; Carnie, M.J. Outstanding indoor performance of perovskite photovoltaic cells-effect of device architectures and interlayers. Sol. RRL 2019, 3, 1800207. [Google Scholar] [CrossRef] [Green Version]
  4. Duong, M.Q.; Pham, T.D.; Nguyen, T.T.; Doan, A.T.; Tran, H.V. Determination of optimal location and sizing of solar photovoltaic distribution generation units in radial distribution systems. Energies 2019, 12, 74. [Google Scholar] [CrossRef] [Green Version]
  5. Abdul Kadir, A.F.; Khatib, T.; Lii, L.S.; Hassan, E.E. Optimal placement and sizing of photovoltaic based distributed generation considering costs of operation planning of monocrystalline and thin-film technologies. J. Sol. Energy Eng. 2019, 141, 011017. [Google Scholar] [CrossRef]
  6. Premalatha, L.; Rahim, N.A. The Effect of Dynamic Weather Conditions on Three Types of PV Cell Technologies—A Comparative Analysis. Energy Procedia 2017, 117, 275–282. [Google Scholar] [CrossRef]
  7. Castaneda, M.; Zapata, S.; Cherni, J.; Aristizabal, A.J.; Dyner, I. The long-term effects of cautious feed-in tariff reductions on photovoltaic generation in the UK residential sector. Renew. Energy 2020, 155, 1432–1443. [Google Scholar] [CrossRef]
  8. Zander, K.K.; Simpson, G.; Mathew, S.; Nepal, R.; Garnett, S.T. Preferences for and potential impacts of financial incentives to install residential rooftop solar photovoltaic systems in Australia. J. Clean. Prod. 2019, 230, 328–338. [Google Scholar] [CrossRef]
  9. Zhang, M.M.; Zhou, D.Q.; Zhou, P.; Liu, G.Q. Optimal feed-in tariff for solar photovoltaic power generation in China: A real options analysis. Energy Policy 2016, 97, 181–192. [Google Scholar] [CrossRef]
  10. Durica, M.; Guttenova, D.; Pinda, L.; Svabova, L. Sustainable Value of Investment in Real Estate: Real Options Approach. Sustainability 2018, 10, 4665. [Google Scholar] [CrossRef] [Green Version]
  11. Trigeorgis, L. Real Options and Interactions with Financial Flexibility. Financ. Manag. 1993, 22, 202–224. [Google Scholar] [CrossRef]
  12. Villani, G. Valuation of R&D Investment Opportunities with the Threat of Competitors Entry in Real Option Analysi. Comput. Econ. 2012, 43, 331–355. [Google Scholar]
  13. Yeo, K.T.; Qiu, F. The value of management flexibility—A real option approach to investment evaluation. Int. J. Proj. Manag. 2003, 21, 243–250. [Google Scholar] [CrossRef]
  14. Kellogg, D.; Charnes, J.M. Real-Options Valuation for a Biotchnology Company. Financ. Anal. J. 2000, 56, 76–84. [Google Scholar] [CrossRef]
  15. Bastian, H.; Daniel, R. Modeling sequential R&D investment: A binomial compound option approach. Bus. Res. 2015, 8, 39–59. [Google Scholar]
  16. Panayi, S.; Trigeorgis, L. Multi-stage Real Options: The Cases of Information Technology Infrastructure and International Bank Expansion. Q. Rev. Econ. Financ. 1998, 38, 675–692. [Google Scholar] [CrossRef]
  17. Santos, L.I.; Mendes, S.C.; Ferreira, P. Real Options versus Traditional Methods to assess Renewable Energy Projects. Renew. Energy 2014, 68, 588–594. [Google Scholar] [CrossRef]
  18. Ghazi, S.; Ip, K. The effect of weather conditions on the efficiency of PV panels in the southeast of UK. Renew. Energy 2014, 69, 50–59. [Google Scholar] [CrossRef]
  19. Orioli, A.; Di Gangi, A. Six-years-long effects of the Italian policies for photovoltaics on the pay-back period of grid-connected PV systems installed in urban contexts. Energy 2017, 122, 458–470. [Google Scholar] [CrossRef]
  20. Fernandes, B.; Cunha, J.; Ferreira, P. The use of real options approach in energy sector investments. Renew. Sustain. Energy Rev. 2011, 15, 4491–4497. [Google Scholar] [CrossRef] [Green Version]
  21. Kim, K.; Park, H.; Kim, H. Real options analysis for renewable energy investment decsions in developing countries. Renew. Sustain. Energy Rev. 2017, 75, 918–926. [Google Scholar] [CrossRef]
  22. Madlener, R.; Stoverink, S. Power plant investments in the Turkish electricity sector: A real options approach taking into account market liberalization. Appl. Energy 2012, 97, 124–134. [Google Scholar] [CrossRef]
  23. Oliva, S.H.; Passey, R.; Abdullah, A.M. A semi-empirical financial assessment of combining residential photovoltaics, energy efficiency and battery storage systems. Renew. Sustain. Energy Rev. 2019, 105, 206–214. [Google Scholar] [CrossRef]
  24. Agaton, C.B.; Karl, H. A real options approach to the renewable electricity generation in the Philippines. Energy Sustain. Soc. 2018, 8, 1. [Google Scholar] [CrossRef] [Green Version]
  25. Mun, J. Real Options Analysis: Tools and Techniques for Valuing Strategic Investments and Decisions with Integrated Risk Management Advanced Quantitative Decision Analytics, 3rd ed.; Thomson-Shore: Dexter, MI, USA; ROV Press: San Diego, CA, USA, 2016. [Google Scholar]
  26. Black, F.; Scholes, M. The Pricing of Options and Corporate Liabilities. J. Political Econ. 1973, 81, 637–654. [Google Scholar] [CrossRef] [Green Version]
  27. Cox, J.C.; Ross, S.A.; Rubinstein, M. Option pricing: A simplified approach. J. Financ. Econ. 1979, 7, 229–263. [Google Scholar] [CrossRef]
  28. Decreto Legge 83 del 22.6.2012—Misure Urgenti per la Crescita del Paese, con l’art. 11 “Detrazioni per Interventi di Ristrutturazione e di Efficientamento Energetico. Available online: https://www.gazzettaufficiale.it/eli/id/2012/08/11/12A08941/sg (accessed on 22 June 2012).
  29. Decreto Legge 63 del 4.6.2013—Disposizioni Urgenti per il Recepimento Della Direttiva 2010/31/UE del Parlamento Europeo e del Consiglio del 19 Maggio 2010, sulla Prestazione Energetica Nell’edilizia per la Definizione delle Procedure D’infrazione Avviate dalla Commisssione Europea, Nonchè altre Disposizioni in Materia di Coesione Sociale. Available online: https://www.gazzettaufficiale.it/eli/id/2013/06/05/13G00107/sg (accessed on 4 June 2013).
  30. Legge 147 del 27.12.2013—Disposizioni per la Formazione del Bilancio Annuale e Pluriennale dello Stato (Legge di Stabilità 2014). Available online: https://www.gazzettaufficiale.it/eli/id/2013/12/27/13G00191/sg (accessed on 27 December 2013).
  31. Malvoni, M.; Leggieri, A.; Maggiotto, G.; Congedo, P.M.; De Giorgi, M.G. Long term performance, losses and efficiency analysis of a 960 KWp photovoltaic system in the Mediterranean climate. Energy Convers. Manag. 2017, 145, 169–181. [Google Scholar] [CrossRef]
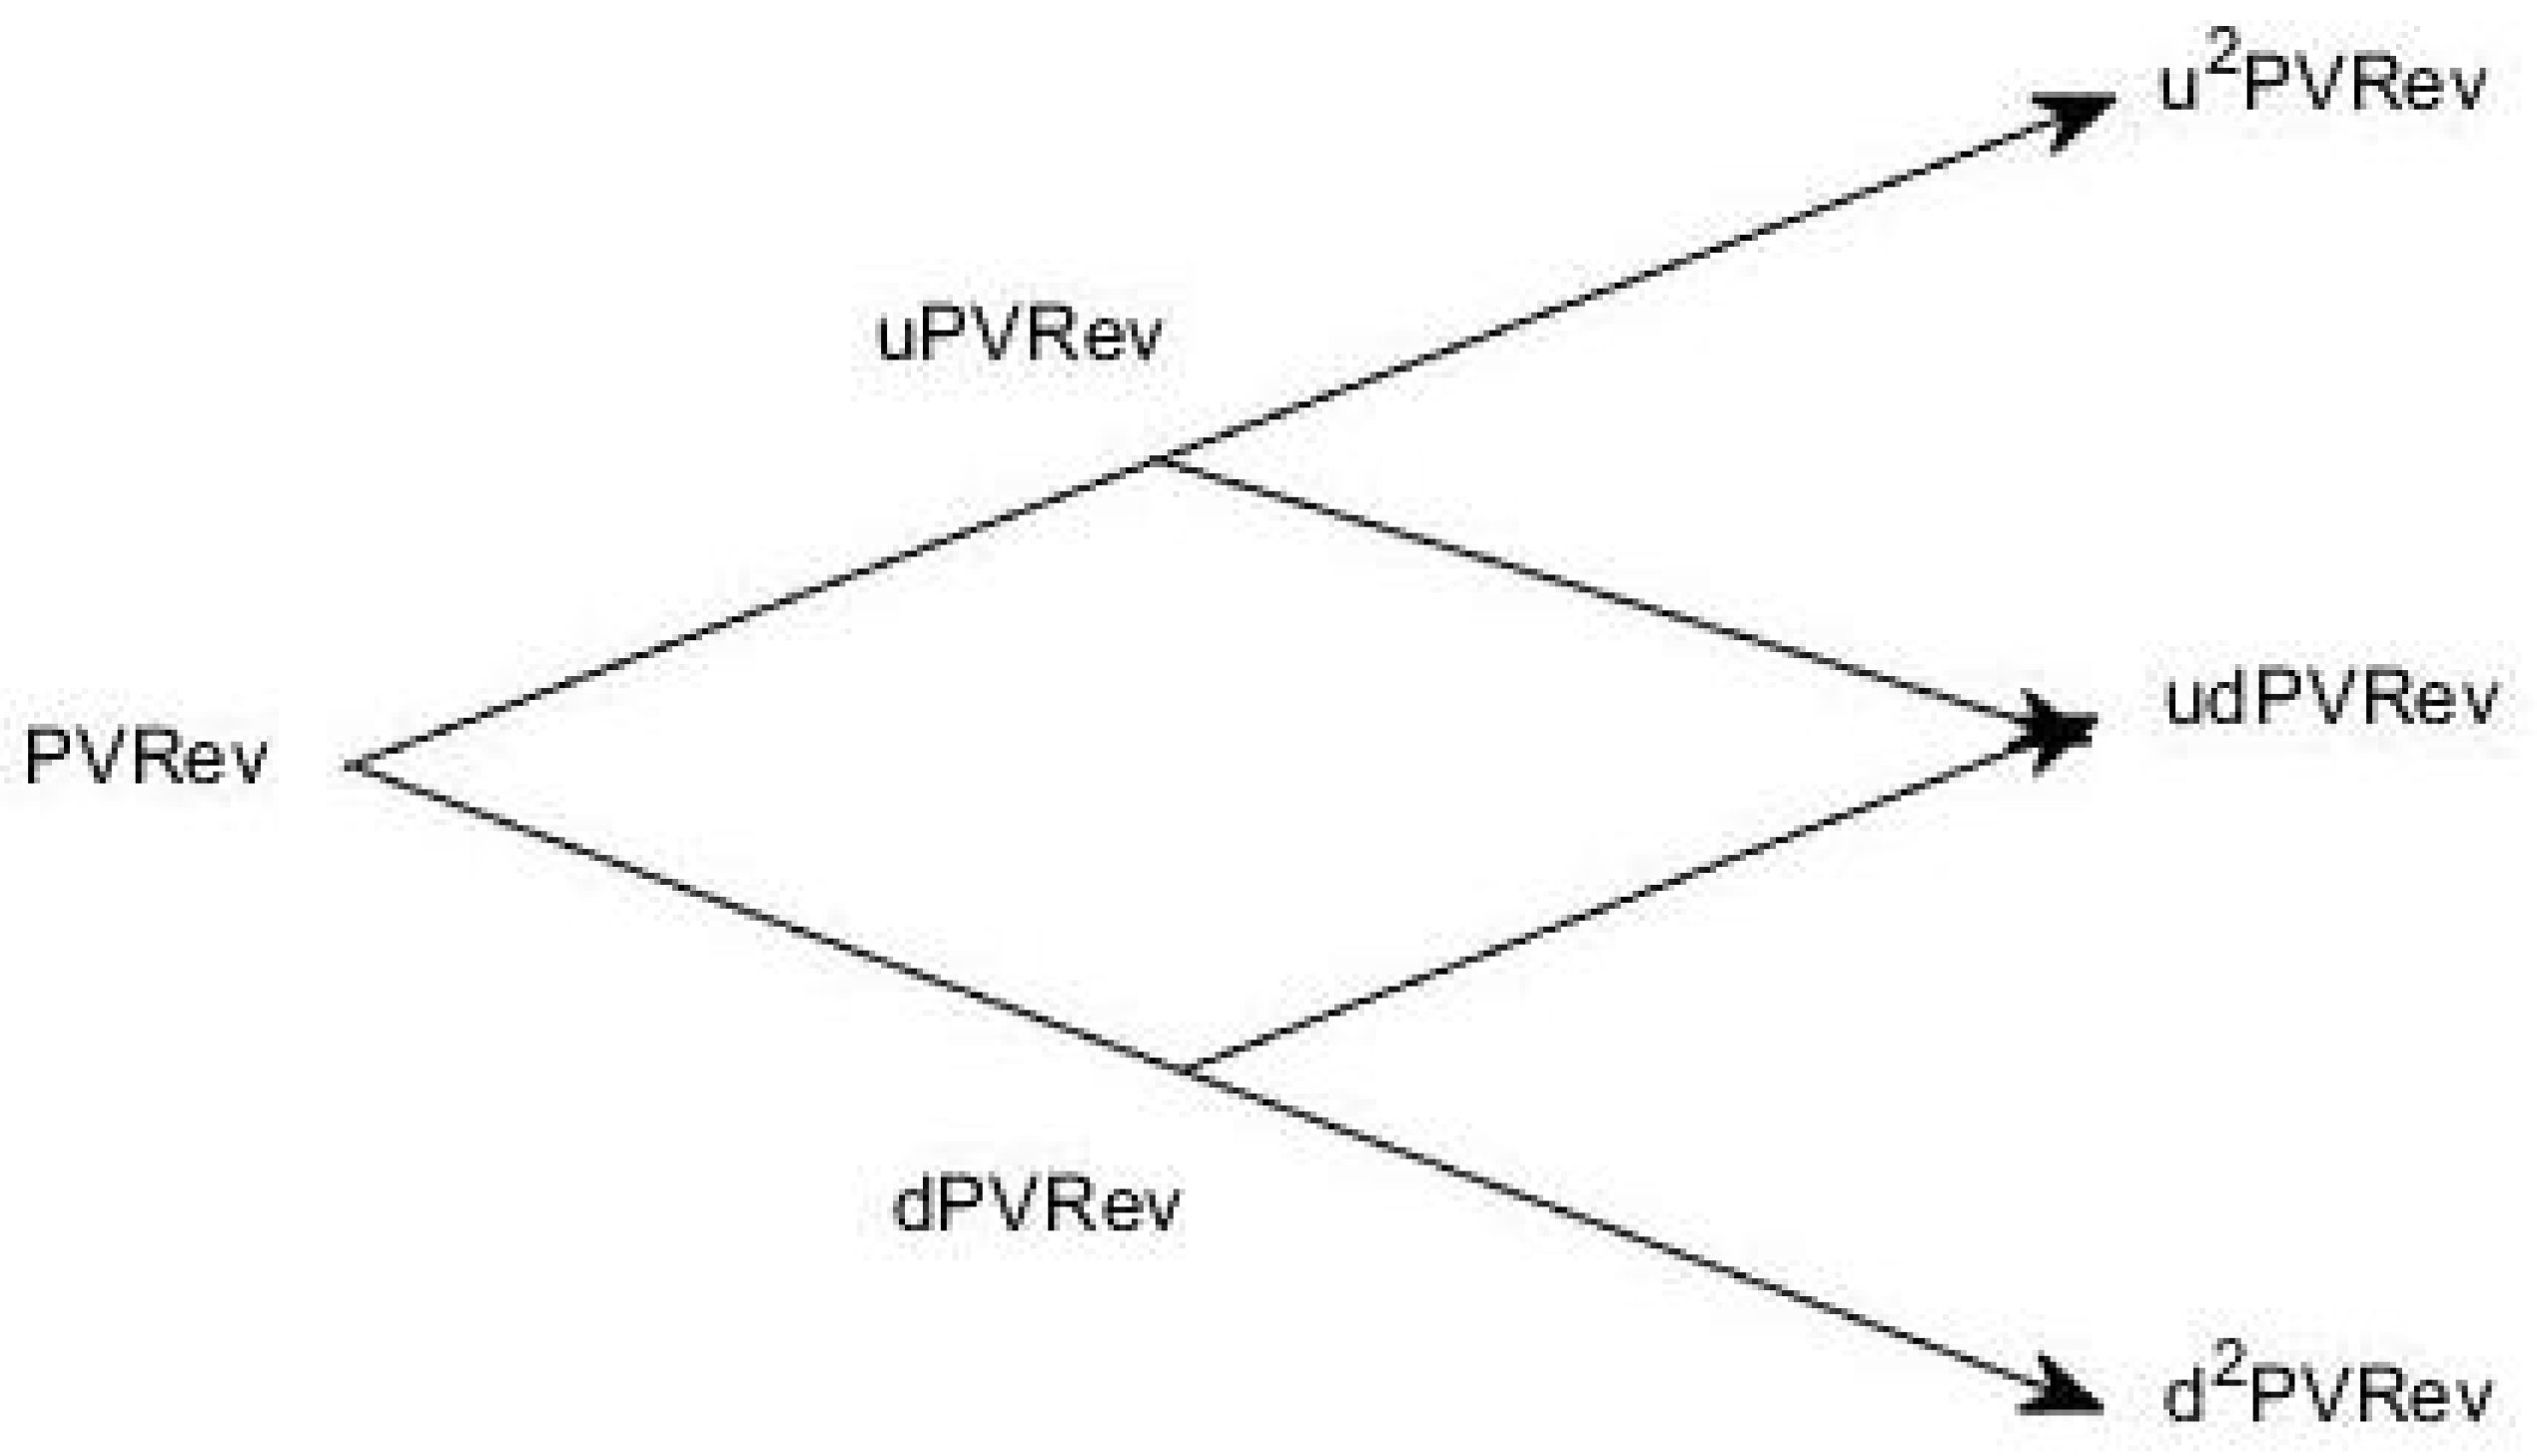
Figure 1. Binomial lattice model using two time instants.
Energies 13 04181 g001
Figure 2. Option valuation.
Energies 13 04181 g002
Figure 3. Option valuation rectified.
Energies 13 04181 g003
Figure 4. Mean temperatures in 2019.
Energies 13 04181 g004
Figure 5. Monthly energy output from a fixed-angle PV system.
Energies 13 04181 g005
Figure 6. Evolution of underlying project value P V R e v .
Energies 13 04181 g006
Figure 7. Evaluation of the American call option.
Energies 13 04181 g007
Table 1. Data of PV installed in Bari.
Provided Inputs Simulation Outputs
Location (lat;long)41,126; 16,862Slope angle (°)35
Database usedPVGIS-SARAHYearly PV energy production (kWh)1725.61
PV technologyCrystalline siliconYearly in-plane irradiation (kWh/m2)1895.4
PV installed (kWp)1Year-to-year variability (kWh)68.83
PV electricity cost (per kWh)0.154
Table 2. Cash flow analysis assuming a rate of loss equal to 1.48 % .
YearProduction (kWh)RevenuesMaintenance CostsTax Benefits
01725.61
11700.07391.192000.50
21674.91385.402000.50
31650.12379.692000.50
41625.70374.072000.50
51601.64368.542000.50
61577.94363.082000.50
71554.58357.712000.50
81531.57352.412000.50
91508.91347.202000.50
101486.58342.062000.50
Table 3. Computation of Expanded Net Present Value (ENPV) for Italian regional capitals.
Regional CapitalsYearly Production (kWh)NPV V RO * ENPV
Aosta1380.44−658.18963.25+305.05
Trieste1491.39−495.161076.81+581.65
Trento1495.01−489.841080.52+590.68
Milano1524.98−445.811111.2+665.39
Ancona1530.45−437.771116.8+679.03
Bologna1547.18−413.191133.93+720.74
Venezia1560.34−393.861147.4+753.54
Firenze1570.58−378.811157.88+779.07
Potenza1574.14−373.581161.53+787.95
Perugia1577.20−369.091164.66+795.57
Genova1579.72−365.381167.24+801.86
Torino1588.38−352.661176.1+823.44
Campobasso1594.87−343.121182.75+839.63
Catanzaro1678.48−220.281268.34+1048.06
L’Aquila1688.73−205.221278.83+1073.61
Bari1725.61−151.031316.59+1165.56
Napoli1735.40−136.651326.61+1189.96
Roma1755.47−107.161347.16+1240.00
Palermo1770.96−84.401363.01+1278.61
Cagliari1843.47+22.141451.98+1474.12
Table 4. Sensitivity of the real option to the variation of p and T B in Bari.
pTB V R O * pTB V R O *
0.9750.361315.850.850.361308.71
0.401316.92 0.401308.98
0.501319.58 0.501309.68
0.950.361313.660.8250.361308.08
0.401314.48 0.401308.28
0.501316.59 0.501308.79
0.9250.361311.930.800.361307.60
0.401312.56 0.401307.75
0.501314.26 0.501308.12
0.900.361310.580.7750.361307.24
0.401311.06 0.401307.35
0.501312.38 0.501307.62
0.8750.361309.520.750.361306.97
0.401309.88 0.401307.05
0.501310.86 0.501307.24