Abstract
Already installed cables are aging and the cable network is growing rapidly. Improved condition monitoring methods are required for greater visibility of insulation defects in the cable networks. One of the critical challenges for continuous monitoring is the large amount of partial discharge (PD) data that poses constraints on the diagnostic capabilities. This paper presents the performance comparison of two data acquisition techniques based on phase resolved partial discharge (PRPD) and pulse acquisition (PA). The major contribution of this work is to provide an in-depth understanding of these techniques considering the perspective of randomness of the PD mechanism and improvements in the reliability of diagnostics. Experimental study is performed on the medium voltage (MV) cables in the laboratory environment. It has been observed that PRPD based acquisition not only requires a significantly larger amount of data but is also susceptible to losing the important information especially when multiple PD sources are being investigated. On the other hand, the PA technique presents improved performance for PD diagnosis. Furthermore, the use of the PA technique enables the efficient practical implementation of the continuous PD monitoring by reducing the amount of data that is acquired by extracting useful signals and discarding the silent data intervals.
1. Introduction
Networks are growing and underground cable installation is increasing, especially in urban areas. The number of cable interconnections is increasing, bringing more joints and terminations that are most vulnerable parts of the cable system considering insulation degradation. Already installed cables are aging and reaching the end of their lifetime [1]. Furthermore, due to loading conditions these cables are often operating at their capacity limits [2], which can be even worse due to increasing penetration of the power electronic loads and sources, e.g., related to distributed energy resources. On the one hand, the operational circumstances of the cable networks are causing challenges. On the other hand, the emerging need for increased resilience and security of the grid is a growing requirement for the smart grid implementation roadmap [3,4,5]. The way to comply with these demands is efficient monitoring and greater visibility that can be accomplished by continuous online monitoring of the insulation condition of the cables. Partial discharge (PD) monitoring provides a clear indication of the degradation of the electric insulation prior to failures and is considered as an efficient method for condition monitoring of the cables [4].
While operational performance of the measurement sensors is of importance, the data acquisition system (DAS) plays a significant role in developing a capable monitoring and diagnostic system [6,7]. The stochastic nature of the PD activity [4] and observing the PD data for longer periods of time requires efficient techniques to acquire the data from the monitored components. Comprehensive research has been done on improvements of the sensor technology that includes shunts, current transformers (CTs), Rogowski coils, Hall effect sensors, magneto impedance (MI) sensors, giant magneto resistive sensors, optical current and acoustic sensors [8]. Because of their non-intrusive installation and operational characteristics, high frequency current transformers (HFCT) and Rogowski coils are the preferred sensors for cable monitoring [4,7]. However, in this work HFCT is used to perform the PD measurement.
Traditionally, PD monitoring requires onsite measurements by experts with several years of field experience in analyzing the data manually. In-service cables are inspected on a periodic basis. The periodic monitoring is done 2–3 times per year using online or offline PD measurements. The critical parts of the cable network are replaced or repaired considering the magnitudes of the monitored PDs. In the case that some hard events have appeared before the next monitoring period, failure of the cable may occur.
To eliminate such drawbacks of manual and periodic monitoring, continuous monitoring is evolving as the preferred method of measurement. Continuous monitoring requires a number of field sensors which measure the data on 24/7 basis and thus, produce a significant amount of data [9,10]. Considering the typical case of PD monitoring, the amount of data grows substantially because of high-speed PD transient signals (as compared to low frequency faults) that can only be captured with a high sampling frequency. Improvements in data handling capabilities are gaining increased attention considering various applications in the modernization of the power grid [11].
Recent work presented in [12] develops a high-speed data acquisition card for phase resolved partial discharge (PRPD) measurements. The measurement system with a bandwidth of 60 MHz is developed using analog-to-digital converters, a field programmable gate array, and a microprocessor to capture different types of PD signals such as internal, corona, and surface discharge. The increased speed of processing units is one way to address the challenge of processing large amounts of data. However, such solutions alone are not sufficient for long term or continuous monitoring. The sampling rate of the DAS is a key parameter to assess the amount of the data and diagnostic performance of a monitoring system. Addressing the performance of a DAS, the work carried out in [13] presents a PD measurement solution based on a sampling rate of 300 MHz. Lower sampling rates can reduce the amount of data; however, this may have a serious impact on the accuracy of reconstructed PD signals. Emphasizing the enhancement of digital signal processing techniques for PD analysis, the work presented in [14] highlights that intelligent algorithms are required for the reduction of the data. These algorithms have the capability to identify the important PD data from the repetitive measurements and store it in the database for tracking the long-term history of components’ aging. Similarly, realizing the need for data to occupy less space, the data compression techniques are presented as fundamental solutions [14,15,16]. Considering the core measurement process, this paper focuses on the data reduction approach by extracting the useful signals without losing any important information during fault progression.
This paper presents a comprehensive study of two widely used methods to capture the PD data; data acquisition techniques based on PRPD measurements and pulse acquisition (PA) measurements. The paper studies the features of these techniques in accordance with the mechanism of the PD activity. The aim is to improve the reliability of the diagnosis and data handling capability (data size) by evaluating the suitability of the technique considering the challenges of randomness caused by the nature of PD characteristics. Further, in this paper, Section 2 briefly introduces the PD mechanism. Section 3 describes the characteristics of PD signals. Section 4 presents the experimental investigations on medium voltage (MV) cables by using two types of data acquisition techniques. In Section 5, different aspects of both techniques are compared to observe the associated pros and cons while the work is concluded in Section 6.
2. PD Mechanism
The purpose of the electric insulation between two electrodes is to hold-on the electrical charges of opposite polarities by posing a high resistance in their path of movement through the material. Under normal operating voltage, the electrical field stress is evenly distributed across the healthy part of the insulation between the electrodes. Depending upon the dielectric properties, the insulation of the electrical components has a certain electrical breakdown strength (expressed in kV/mm) [17]. The insulation defects such as voids, cracks, air bubbles and treeing in the dielectric insulation degrade the insulation and grow with time due to TEAM stresses (thermal, electrical, ambient and mechanical stresses). After a certain point, insulation strength may decrease. This causes a localized breakdown, which in result produces PDs [18]. PD is defined as localized electrical discharge within only a limited part of the insulation between two conductors [18].
In the case of cables, the inner conductor and the shielding act as the field initiating electrodes and the insulation between them causes PDs if voids, cavities, or cracks are present inside the insulation. During the early stage of defect development, the local electrical stress in the void exceeds the threshold (inception voltage) and a discharge occurs that is limited across the void due to the healthy surrounding insulation. Once started, PD causes the progressive deterioration of the surrounding insulation and eventually leads to complete electrical breakdown [19].
Insulation degradation keeps progressing because of the continuous disintegration of the insulating properties of a defect site due to each PD event. PD is a complex phenomenon and understanding of the physical mechanism of the insulation defects and observed PD activity has remained of great interest. However, the stochastic behavior of the PDs is not yet well understood. PD progression comprises three stages; firstly, trapping and de-trapping of the space charge near micro cavities; secondly, production of the hot electrons that cause bond breaking effects and enlargement of the cavities, and thirdly, the PD avalanches that increase until the final breakdown [17]. Similarly, not only is a sufficiently high electric field required to maintain the ionization process, the feedback mechanism also contributes in the avalanching during the continuation of the PD emission [20]. The feedback mechanism can be characterized as a continuous avalanching and ionization process. The avalanche is the process of electron multiplication that is usually localized in its development and results in a PD pulse. Typically, discharge activity is localized in the cavity where the electric field strength is high enough to sustain the ionization of the electrons by various collision processes. However, charge carriers outside the cavity can influence the activity within the cavity [17].
Insulation defects are mostly not of a well-defined shape or of uniform dimensions and a cavity may not be a single entity but a combination of multiple micro-cavities surrounding the defect site. Being located in the same vicinity, the miniature micro-cavities are considered as part of a primary cavity. Continuous charging and discharging of the miniature cavities cause multiple pulses of different amplitudes to appear and disappear at different instants with a random pattern. These factors together, cause stochasticity and make the interpretation of the acquired data challenging [21].
3. Characteristics of PD Signals
The reliability of the PD diagnostics depends on the acquired data and the accuracy of its interpretation. The characteristics of the signals and the equipment under test provide indispensable information in order to interpret the data during analysis. The analysis can be done by observing the most significant pulse characteristics in the time domain such as, shape of the PD pulse, pulse repetition, and pulse propagation [21,22]. These characteristics are closely related to the PD mechanism in the defective part of the insulation. Pulse shape and pulse repetition depends on the physical/electrical parameters of the insulation defect or cavity while pulse propagation mainly depends on the length and parameters of the cables.
3.1. Pulse Shape
Each PD event generates a PD current pulse that can be represented mathematically as,
.
Equation (1) describes the model of a typical (mathematical) PD pulse that is compared with a practically measured PD pulse in Figure 1. Here A is the peak value of the pulse, α1 is the rate of rise and α2 is the rate of fall of the pulse.
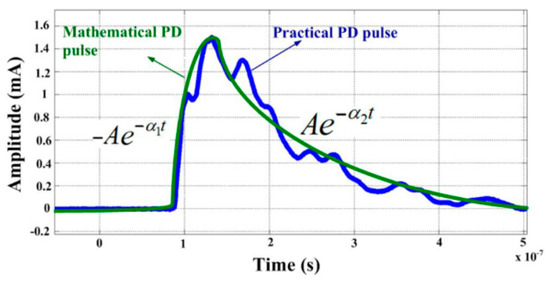
Figure 1.
Mathematical partial discharge (PD) pulse (green) and practically measured PD pulse (blue).
The rise-time of the PD pulse defines the frequency components of the PD signal. The faster the rise-time, the higher the frequency components of the PD pulse will be. Drift velocity and the size of the cavity (the path travelled by the discharged avalanche) determine the rise time of a PD pulse. Referring to work presented in [19], Figure 2 presents the dimensions of a cavity. For a gas-filled cavity, the drift velocity vd in cm/s can be determined as,
where Eci (kV/cm) is the electric field intensity at PD inception and p is the pressure inside the cavity. Hence the rise-time (transit time) tr is calculated as,
where hc is the depth of the cavity (void) which is referred as the distance across which the charges propagate during a discharging event. Equation (3) presents an approximation of the rise-time, however the local environment of the cavity, such as the conductivity of the surface and the internal temperature, also affects the pulse characteristics [17]. For a cavity of 0.2 cm in diameter (d) located between two polyethylene films with two voids depth (hc) of 0.08 mm and 0.12 mm, the rise-time (tr) of the PD pulse is calculated as 0.754 ns and 0.991 ns, respectively [19]. The fall-time tf of the emerged PD pulse depends on the impedance of the cable, propagation characteristics of the medium (cable material), and the impedance of the measuring system [23]. The combination of the rising and falling pulse signals determine the signature and pulse width of the PD pulses. The above-mentioned pulse parameters vary for different types of insulation materials in electrical components. The size, shape and type of insulation defect also affect the value of these parameters.
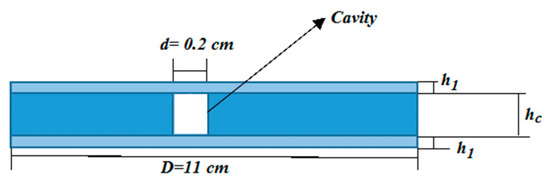
Figure 2.
The dimensions of a test cavity.
3.2. Pulse Repetition
The occurrence of the PD pulses and their repetition rate are closely associated with the applied voltage and the type of the PD defect. Depending on the type of PD defect (internal, corona or surface discharges) the PD pulses appear at different phase angles during positive and negative half-cycles of the applied voltage [17]. In experimental studies, it is observed that for internal PD defects, the PD activity appears during phase angles 330°–90° and 150°–270°. For corona PD defects, the PD activity mostly appears around 90° and 270°, and for surface PD defects, the pulses are observed during 0°–90° and 180°–270° [22]. The case of internal PDs is considered a serious threat to the cable insulation and its PD occurrence pattern is characterized in Figure 3.
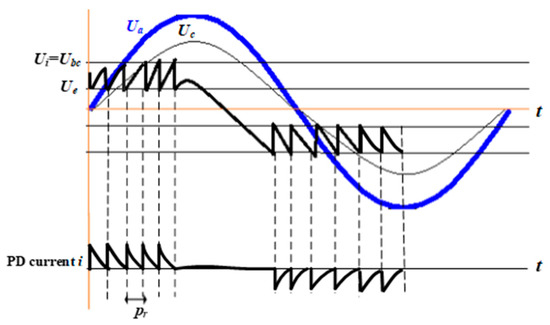
Figure 3.
Repetitive behavior of the electric stress buildup and PD event occurrence.
During normal operation when the applied voltage across the cavity Uc increases to partial discharge inception voltage (PDIV) Ui, the cavity collapses rapidly. After discharge, the voltage Uc across the cavity reduces to a small voltage Ue (extinction voltage), the discharge extinguishes, and the PD pulse appears. At this stage, Uc again starts increasing until it reaches Ui and again collapses to create the next discharge. This causes a repetitive discharge event occurring during each power half-cycle (positive and negative) as shown in Figure 3. It has been observed that the PD magnitude may vary significantly and that the pulse repetition rate pr depends on the average size of cavity and the magnitude of the electrical stress (applied voltage) [17].
The pulse width of the PD signal is of nanosecond to microsecond order. The polarity of these PD pulses is determined by the direction of the electric field developed across the cavity. The electric field follows the polarity of applied (operational) voltage during each half-cycle. Thus, positive and negative PD current pulses are produced during positive and negative half-cycles of applied voltage, respectively.
3.3. Pulse Propagation
The PD signal has a considerably shorter pulse duration (tpd) as compared to its propagation time (tpc) along the cable’s length. PD signals are thus narrow pulses that travel along the cable with cable-specific wave propagation velocity. Considering the cable under observation has a certain length, it is possible to see the complete shape of the PD pulses travelling along different locations of the line and this feature provides the possibility to find the location of the PD sources. The propagation time of the PD pulses can be determined as,
where lc is the length of the cable and vp is the wave propagation velocity as shown in Figure 4.
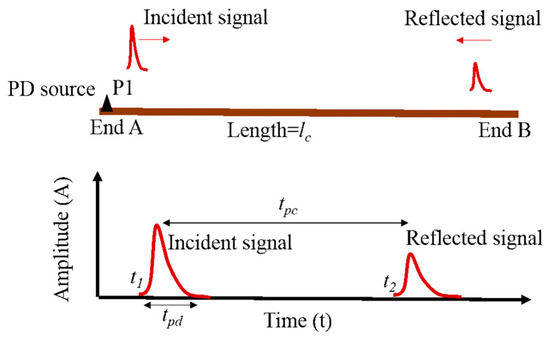
Figure 4.
Propagation of the PD pulse along the cable.
The wave propagation velocity of the PD signals on the line is approximately 3 × 10⁸ m/s when the insulation around the conductor is free space. Considering the cables where the insulation between the cable conductor and shielding is, e.g., cross-linked polyethylene (XLPE) or paper, the propagation velocity is reduced by the velocity factor that depends on the square root of the relative permittivity of the insulation. For XLPE insulation propagation velocity has been measured as 1.57 × 10⁸ m/s [24]. Taking into account the propagation velocity and typical pulse width of PD signals, the original pulse and its reflection can be seen on a cable if the cable length is greater than 25 m. In a typical distribution network, the usual length of a cable section is between 200 and 700 meters. Therefore, time domain reflectometry-based diagnostics can be applied for fault location [25].
4. PD Measurements and Data Acquisition in Power Cables
4.1. Experimental Setup
PD measurements have been done on MV cables in the laboratory environment as shown in Figure 5. The experimental setup is based on the IEC 60270 for PD measurements [26]. Two PD defects were developed with different sizes, shapes and at different locations from the cable end. The PDIVs for both types of sources were different. The applied voltage level was raised above the inception voltage and it was confirmed that the activity from both the PD sources was seen. Single end measurements were carried out using a high frequency current transformer (HFCT) installed at the shielding of the cable end A. The primary window of HFCT is round, with an internal diameter of 15 mm. The transfer ratio of the HFCT is 1:10 while the bandwidth is 0.5 to 80 MHz (−3 dB). The HFCT measures the PD activity in terms of voltage and its output is connected to a high sampling frequency digital storage oscilloscope (DSO) via a coaxial cable. A commercial measurement impedance (MI) is connected in series with the high voltage coupling capacitor (CC). The voltage divider is developed to get the applied voltage at the DSO.
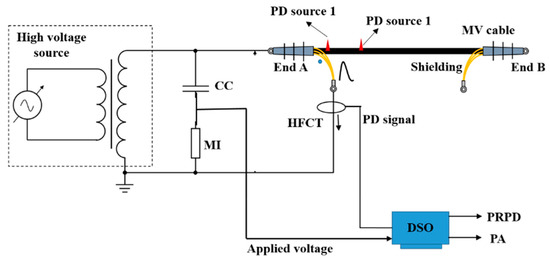
Figure 5.
Layout of the measurement setup.
The primary criterion to assess the possibility of different sources is that the PD pulse inherits a specific fingerprint (signature) associated with the shape or size of the PD defect [21,22]. Furthermore, the propagation characteristics of the cable and the distance of the PD source from the cable end, provide more information to assess if the identified PD signals are from different sources. Therefore, the signature (wave shape) and the time difference of arrival between incident and first reflection are important characteristics for PD diagnostics. The detailed experimental setup is shown in Figure 6. Here, IPP1 is the incident PD pulse related to PD source 1 at location P1 while RPP is the reflected PD pulse. Similarly, related to PD source 2 at location P2, IPP2 represents the incident pulse while RPP represents the reflected PD pulse. The incident and reflected pulses from both sources can also be differentiated by their respective color scheme.
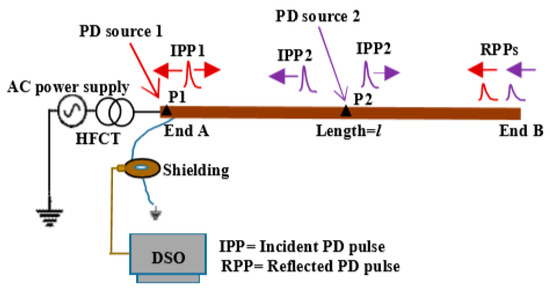
Figure 6.
Single end PD measurement using a high frequency current transformer (HFCT) sensor.
In addition to the visual analysis to give a quick overview, a consistent analysis of the PD activity needs careful study of the PD data. The usual practice is to acquire the data in digital form using a DAS with suitable vertical and horizontal resolution. The vertical resolution refers to the number of distinguishable digital levels, expressed in number of bits, while the horizontal resolution refers to the sampling rate expressed as samples per second. During our different studies in laboratory environments, 8–12 bits DSOs (corresponding to 28–212 (256–4096) vertical levels) with a sampling rate of 1–5 × 10⁹ samples per second (GS/s) are considered to be suitable for reliable acquisition of PD data. Considering different characteristics of the PD mechanism and propagation discussed earlier, two data acquisition methods are presented below.
4.2. PRPD Based Acquisition Technique
PRPD measurements provide first-hand information about the presence of the PD signals at specific phase locations within the positive and negative half of the power frequency cycle [22,27]. Due to the nature of the PD mechanism, the PD pulses continuously appear and disappear in a fraction of a second. With the same defect and under the same electrical stress condition, different PD activity (considering the number and amplitude of the pulses) is recorded. As can be seen in Figure 7, one plot has a different number of pulses as compared to the other. Here, the possibility is to select the recordings (data window) that have a greater number of pulses. The recordings having the highest number of pulses have the probability of having pulses from all the active PD sources.
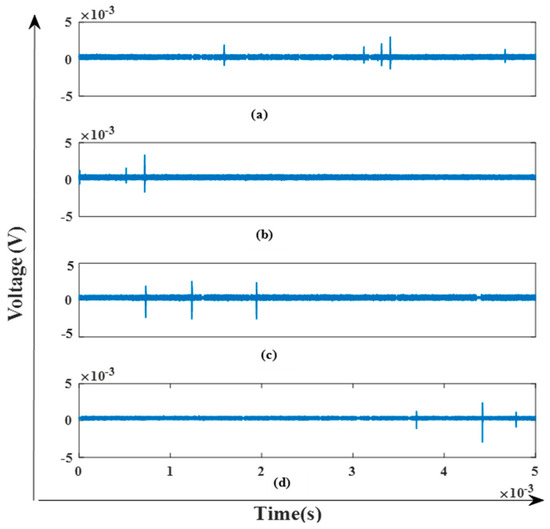
Figure 7.
PD pulses captured based on phase resolved partial discharge (PRPD) data recording (1st quarter of power frequency cycles is shown).
It was observed that within several PD recordings, there were only a few recordings that contain two types of PD pulses in a single PD data window. Figure 7 presents four PRPD-based recordings captured at different instants and the 1st quarter of the cycle of each data recording is shown in the plots (a) and (d). Because of the stochasticity of the PD activity, it is observed that among the four recordings, PD signals from PD source 1 and PD source 2 were present in plot 6 (a) as highlighted. The presence of the PD sources has been assessed based on the pulse reflection time. The PD source, located at point P1 is at a distance of 27.42 m from line end A (see Figure 6). Similarly, the PD source 2 is located at point P2 at a distance of 2.56 m from line end A, while the HFCT sensor is installed at the shielding of line end A. When a PD pulse appears at a defect point, it propagates towards both ends of the line. The PD pulse (incident pulse) moving towards end A is captured by the HFCT sensor installed at end A at a certain time t. The PD pulse moving towards the line end B is reflected from end B, reaches the end A, and is captured by the HFCT after a pulse reflection time (time difference of arrival) dt. The reflection of these pulses continues until the pulses are attenuated to a significantly small amplitude. If the PD sources are located at different locations along the line, then the corresponding pulse reflection time is based on the distance of these sources from the measuring sensor. Therefore, in this work, pulse reflection time is used to identify if these PD pulses are emerging from the same or different PD sources. The pulse reflection time dt1 of the pulses from PD source 1 is 1.97 μs while the pulse reflection time dt2 for the PD pulses from PD source 2 is 2.25 μs as shown in Figure 8. The time dt1 and dt2 is determined based on the location of the peaks of the 1st (incident) and the 2nd (1st reflected) pulse. The following pulses are the reflections of the 1st and 2nd pulses.
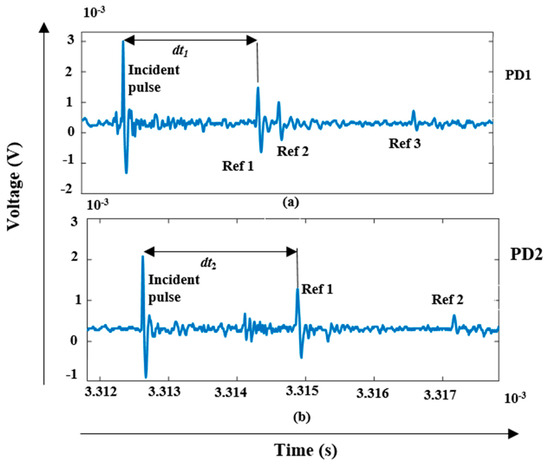
Figure 8.
PD signals from the active PD sources using PRPD measurements (* Ref: Reflection): (a) PD source 1; (b) PD source 2.
The PRPD recording shown in Figure 7b has two PD pulses and based on the studied reflections, both PD pulses are from the same PD source because their reflections were during the same time interval. Based on the same criterion, in the third and fourth PRPD recordings shown in Figure 7c,d respectively, it is found that all the recorded PD pulses are from a single PD source.
4.3. Pulse Acquisition Technique
PRPD-based measurements provide the acquisition of data continuously during the whole power frequency cycle when the PD signal appears as well as during silent times when no PD signal is appearing, as can be seen in the plots in Figure 7. Due to the stochastic nature of the PD process, a larger amount of data is preferred for reliable diagnostics. That means that a greater number of pulses should be monitored in order to maximize the probability that the PDs appearing from all the active PD sources have been captured [6,21]. The PA technique is referred to capture the data only when a PD pulse appears (above a certain threshold). The purpose of applying the PA technique is to avoid capturing the data during silent times.
In carrying out the measurements using the PA technique, 500 signals were captured that are presented as a single time-series data recording as shown in Figure 9. Considering average amplitude of the PD, the vertical limit was set to ±50 mV. The pulses with maxima above the vertical limit were not considered.
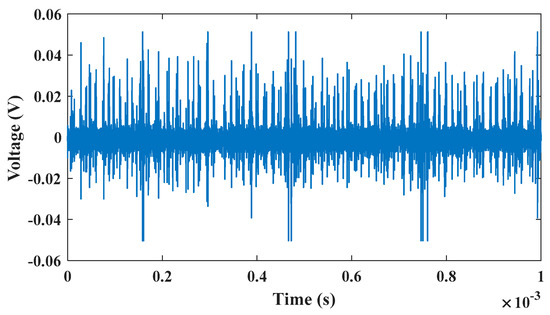
Figure 9.
Pulse acquisition (PA) based data recording.
Each PD signal is captured as a specified length (number of data samples). The number of data samples depends upon the length of the cable under test and its wave propagation velocity. The length of the PD signal is specified in order to capture both the incident pulse and its reflections. In this test, a cable of 150 m was used, having a wave propagation velocity of 1.57 × 10⁸ m/s. The two-way propagation (distance of 300 m) requires about 2 μs. To observe further details of the PD propagation, two reflections are captured that require 4 μs. In order to capture the signals completely, the time window was finally set to 5 μs (5000 samples). Processing the 500 pulses, 382 pulses were found to be from PD source 1, 32 pulses from PD source 2, while rest of the pulses were considered as noise. A set of 10 consecutive pulses have been shown in Figure 10.
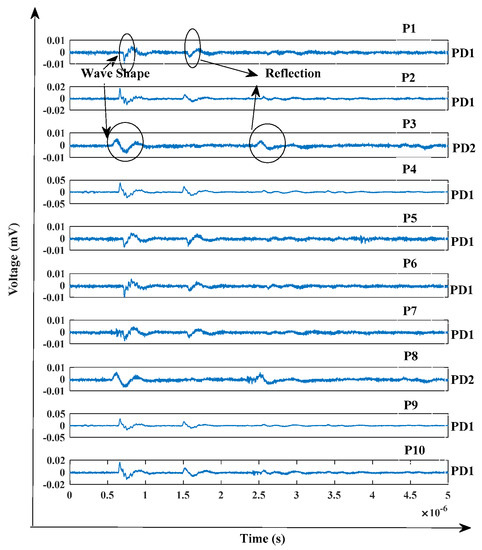
Figure 10.
PD signals from the active PD sources using PA measurements.
5. Performance Comparison of Data Acquisition Techniques
5.1. Reliability of Data Acquisition
As mentioned above, a number of PD pulses appear and disappear in rapid succession. When a data window is observed at a certain time there is an equal possibility that the captured data does not present the complete information of an ongoing PD activity in a component under test. The PRPD data windows shown in Figure 7 are measured from the cable at which two different PD sources are active. However, when analyzing the measurements, it is revealed that only one of the data windows shown in Figure 7a contains the PD signals from both PD sources while the rest of the three data windows (Figure 7b–d) have captured the signals from only one PD source. The performance of the PRPD technique can be improved; firstly, by selecting those data recordings that contain higher numbers of PD signals and secondly, by having a higher number of recordings. However, considering the stochasticity of the phenomenon, the ambiguity is expected to remain, which makes this methodology of data acquisition still unreliable.
The second set of measurements (pulse acquisition technique) as shown in Figure 9 captures the consecutive pulses appearing during the PD activity. During this measurement, the acquisition system continuously acquires the PD pulses that are emitted from any of the PD sources in the vicinity. In this measurement, 500 PD pulses were recorded. The recoding of a large number of PD signals appearing consecutively provides good reliability because all of the PD signals emerging from the active PD sources are captured.
Considering another PRPD measurement scenario from a highly deteriorated insulation defect, Figure 11 shows a PD recording in which a larger number of PD pulses are obtained. During the whole power frequency cycle of 20 ms, approximately 60 PD pulses can be seen during the time interval marked as 2 and 4. Here, 20 PD pulses are captured during the positive half-cycle and 40 PD pulses are captured the during negative half-cycle. On the other hand, using the PA technique, out of 500 captured signals in Figure 12, there were 420 valid signal while the rest were considered as noise or clipped. This was during 1 ms time which is 20 times less than that of the PRPD data time (20 ms). Therefore, it can be considered that PA technique has the capability to provide the useful PD data in a more compact form (with a large number of PD signals during less time) for diagnostics.
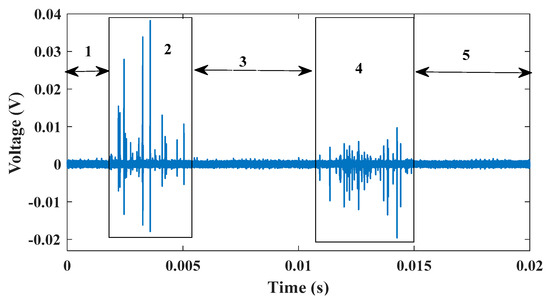
Figure 11.
Evaluation of the useful signals in PRPD based data acquisition.
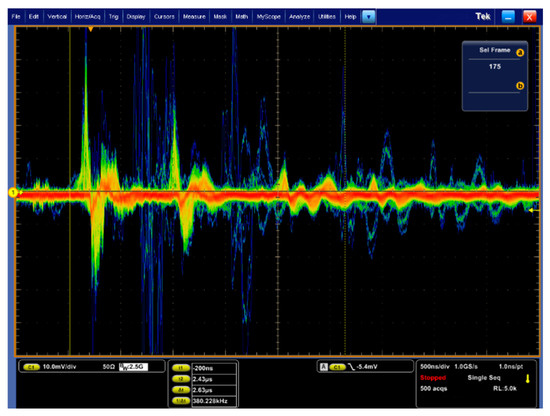
Figure 12.
Acquisition of 500 pulses.
5.2. Reduction in Data Size
Because of the rapid proliferation of the smart grid technologies, automated monitoring is gaining popularity. Field sensors are proposed to be equipped with the onsite units with pre-processing before sending the data [28]. The high sampling frequency of DAS makes it possible that all the pulses sensed by the PD sensor are captured. The size of the data using PRPD based measurements is significantly large. On the other hand, by adopting the PA technique, not only is improved reliability achieved, but also the size of the data is reduced significantly.
The size of the data has a critical impact on the data handling attributes such as data transmission, storage, data processing speed, analysis and visualization. Considering the sampling rate of 1 GS/s, it takes 2,500,000 samples to capture 500 PD signals (5000 samples per event) using the pulse acquisition technique. Using the PRPD technique with the same sampling rate, the data size for 20 ms is 20,000,000 samples, which is approximately 8 times larger than that of the PA technique. Furthermore, several recordings are required to increase the accuracy of the diagnostics while using the PRPD technique. This consequently increases the recorded data size significantly.
An overall comparison between both the data acquisition techniques for power cables is presented in Figure 13. The PA technique can be equally applied for the other close size components such as power transformers and switchgears. In that case, it is not required to take into account the reflections and the used time window should cover only observations of a single PD pulse. Considering the typical width of a PD pulse, a few hundred samples are required to capture one PD pulse. Therefore, for closed sized power system components, the size of the data will be considerably smaller.
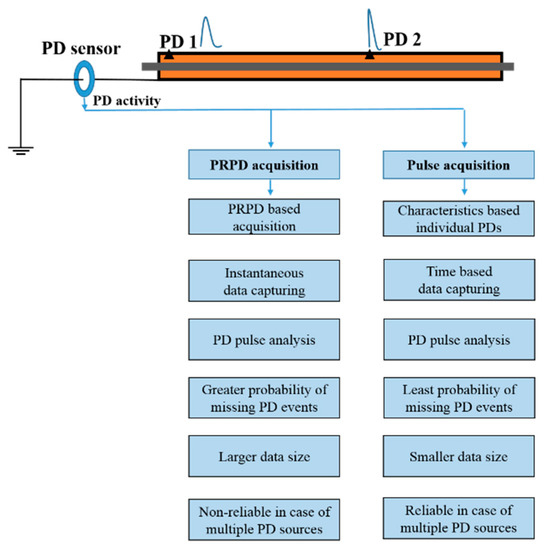
Figure 13.
Comparison of the PRPD and PA techniques.
6. Conclusions
Growing networks, smart grid implementation, distribution automation, self-healing capabilities and increased reliability demand for continuous monitoring of the network equipment. Due to the very nature of PD signals, continuous monitoring requires a large amount of digital data that not only overloads the data processing units but also makes the processing highly expensive. One possibility of improvement is to develop high speed and low-cost computing and processing modules. The other direction is to explore efficient measurement processes. This paper presents a solution by extracting the useful PD signals during the measurement process. The proposed solution is built by carrying out efficient data acquisition based on expert knowledge of the PD mechanism, propagation characteristics of the cables, PD pulse parameters, and digital functionality of the data acquisition modules. The acquisition scheme is designed to record the data of the PD events without capturing the silent time intervals.
The PA technique not only reduces the amount of data significantly, but more importantly, it provides greater reliability of fault diagnostics by eliminating the probability of missing the useful PD signal considerably, as compared to the PRPD technique. In this paper, the proposed technique is presented in the perspective of MV cables by taking into account the length of the cable and thus, the associated reflections of the PD signals. The presented concept can also be adopted accordingly for PD monitoring of the other power grid equipment such as power transformers, switchgears, etc.
Author Contributions
Conceptualization, M.S., I.K. and K.K.; methodology, M.S. and I.K.; software, M.S.; validation, M.S., I.K. and L.K.; formal analysis, M.S., I.K. and L.K.; investigation, M.S. and I.K.; resources, M.S., K.K., and P.T.; data curation, M.S. and P.T.; writing—original draft preparation, M.S. and I.K.; writing—review and editing, K.K., P.T. and I.P.; visualization, M.S. and I.K.; supervision, K.K. and I.P.; project administration, M.S. and I.P.; funding acquisition, M.S. and K.K. All authors have read and agreed to the published version of the manuscript.
Funding
This work was supported by the project Smart Condition Monitoring of Power Grid, funded by the Academy of Finland, under Grant No. 309412.
Acknowledgments
The authors are grateful to Guillermo Robles for their support in performing the experimental investigations.
Conflicts of Interest
The authors declare no conflict of interest.
References
- Catterson, V.M.; Castellon, J.; Pilgrim, A.J.; Saha, T.K.; Ma, H.; Vakilian, M.; Moradnouri, A.; Gholami, M.; Sparling, B.D. The Impact of Smart Grid Technology on Dielectrics and Electrical Insulation. IEEE Trans. Dielectr. Electr. Insul. 2015, 22, 3505–3512. [Google Scholar] [CrossRef]
- Johae, C.; Beerboom, D.; Pawlowski, E.; Zdrallek, M.; Schultze, N.; Timmreck, R. Economical and Practicable Condition Assessment of MV-And LV-Distribution Grids. CIRED-Open Access Proc. J. 2017, 2017, 128–131. [Google Scholar] [CrossRef][Green Version]
- Amin, M. Toward a More Secure, Strong and Smart Electric Power Grid. In Proceedings of the 2011 IEEE Power and Energy Society General Meeting, Detroit, MI, USA, 24–28 July 2011; pp. 1–4. [Google Scholar]
- Shafiq, M.; Kauhaniemi, K.; Robles, G.; Isa, M.; Kumpulainen, L. Online Condition Monitoring of MV Cable Feeders Using Rogowski Coil Sensors for PD Measurements. Electr. Power Syst. Res. 2019, 167, 150–162. [Google Scholar] [CrossRef]
- Hernández-Callejo, L. A Comprehensive Review of Operation and Control, Maintenance and Lifespan Management, Grid Planning and Design, and Metering in Smart Grids. Energies 2019, 12, 1630. [Google Scholar] [CrossRef]
- Mor, A.R.; Heredia, L.C.C.; Muñoz, F.A. Effect of Acquisition Parameters on Equivalent Time and Equivalent Bandwidth Algorithms for Partial Discharge Clustering. Int. J. Electr. Power Energy Syst. 2017, 88, 141–149. [Google Scholar]
- Álvarez, F.; Garnacho, F.; Ortego, J.; Sánchez-Urán, M.Á. Application of HFCT and UHF Sensors in On-Line Partial Discharge Measurements for Insulation Diagnosis of High Voltage Equipment. Sensors 2015, 15, 7360–7387. [Google Scholar] [CrossRef] [PubMed]
- Xiao, C.; Zhao, L.; Asada, T.; Odendaal, W.G.; van Wyk, J.D. An Overview of Integratable Current Sensor Technologies. In Proceedings of the 38th IAS Annual Meeting on Conference Record of the Industry Applications Conference, Salt Lake City, UT, USA, 12–16 October 2003; pp. 1251–1258. [Google Scholar]
- Mulroy, P.; Gilbert, I.; Hurtado, A. Continuous Online Monitoring of PD Activity in the Medium Voltage Distribution Network. In Proceedings of the 22nd International Conference and Exhibition on Electricity Distribution (CIRED 2013), Stockholm, Sweden, 10–13 June 2013; pp. 1–4. [Google Scholar]
- Kane, C.; Golubev, A. Advantages of Continuous Monitoring of Partial Discharges in Rotating Equipment and Switchgear. In Proceedings of the Conference Record of the 2003 Annual Pulp and Paper Industry Technical Conference, Charleston, SC, USA, 16–20 June 2003; pp. 117–122. [Google Scholar]
- Diamantoulakisa, P.D.; Kapinasa, V.M.; Karagiannidisa, G.K. Big Data Analytics for Dynamic Energy Management in Smart Grids. Big Data Res. 2015, 2, 94–101. [Google Scholar] [CrossRef]
- Gu, F.C.; Chang, H.C.; Hsueh, Y.M.; Kuo, C.C.; Chen, B.R. Development of a High-Speed Data Acquisition Card for Partial Discharge Measurement. IEEE Access 2019, 7, 140312–140318. [Google Scholar] [CrossRef]
- Yang, G.; Wang, F.; Cui, S.; Zhao, L. Design and Implementation of Data Acquisition for Partial Discharge in Power Cable. Advances in Computer, Communication, Control and Automation; Wu, Y., Ed.; Springer: Berlin/Heidelberg, Germany, 2011; Volume 121, pp. 189–195. [Google Scholar]
- Wen, L.; Zhou, K.; Yang, S.; Li, L. Compression of Smart Meter Big Data: A Survey. Renew. Sustain. Energy Rev. 2018, 91, 59–69. [Google Scholar] [CrossRef]
- Ardila-Rey, A.; Martínez-Tarifa, J.M.; Robles, G.; Rojas-Moreno, M.; Albarracín, R. A Partial Discharges Acquisition and Statistical Analysis Software. In Proceedings of the 2012 IEEE International Instrumentation and Measurement Technology Conference Proceedings, Graz, Austria, 13–16 May 2012; pp. 1670–1675. [Google Scholar]
- Luo, Y.; Li, Z.; Wang, H. A Review of Online Partial Discharge Measurement of Large Generators. Energies 2017, 10, 1694. [Google Scholar] [CrossRef]
- Brunt, R.J.V. Physics and Chemistry of Partial Discharge and Corona. Recent Advances and Future Challenges. IEEE Trans. Dielectr. Electr. Insul. 1994, 1, 761–784. [Google Scholar] [CrossRef]
- Bahadoorsingh, S.; Rowland, S. A Framework Linking Knowledge of Insulation Aging to Asset Management—[Feature Article]. IEEE Electr. Insul. Mag. 2008, 24, 38–46. [Google Scholar] [CrossRef]
- Ramachandra, B.; Nema, R.S. Characterisation of Partial Discharge Pulses in Artificial Voids in Polypropylene Films Used in Capacitors. In Proceedings of the Conference Record of the 1996 IEEE International Symposium on Electrical Insulation, Montreal, QC, Canada, 16–19 June 1996; pp. 517–520. [Google Scholar]
- Aumann, S.; Becker, S.; Berton, F.; Friederici, G.; Gauer, M.; Jovalekic, M.; Kohlhof, J.; Kübler, F.; Radbruch, J.; Winter, R. Guideline Measurement and Diagnosis of Partial Discharges in Low Voltage Applications ≤ 1000 Volts; ZVEI: Frankfurt, Germany, 2017. [Google Scholar]
- Djamal, B. Pulse Sequence Analysis and Pulse Shape Analysis: Methods to Analyze Partial Discharge Processes. Ph.D. Thesis, University Library of Siegen, Siegen, Germany, June 2008. [Google Scholar]
- Ghaffarian, M. Partial Discharge Signatures of Defects in Insulation Systems Consisting of Oil and Oil-Impregnated Paper. Ph.D. Thesis, KTH Royal Institute of Technology, Stockholm, Sweden, December 2012. [Google Scholar]
- Shafiq, M.; Kauhaniemi, K.; Robles, G.; Hussain, G.A.; Kumpulainen, L. Partial Discharge Signal Propagation in Medium Voltage Branched Cable Feeder. IEEE Electr. Insul. Mag. 2018, 34, 18–29. [Google Scholar] [CrossRef]
- Shafiq, M.; Kiitam, I.; Taklaja, P.; Kütt, L.; Kauhaniemi, K.; Palu, I. Identification and Location of PD Defects in Medium Voltage Underground Power Cables Using High Frequency Current Transformer. IEEE Access J. 2019, 7, 103608–103618. [Google Scholar] [CrossRef]
- Mor, A.R.; Morshuis, P.H.F.; Llovera, P.; Fuster, V.; Quijano, A. Localization Techniques of Partial Discharges at Cable Ends in Off-Line Single-Sided Partial Discharge Cable Measurements. IEEE Trans. Dielectr. Electr. Insul. 2016, 23, 428–434. [Google Scholar] [CrossRef]
- IEC Standard. IEC 60270, High Voltage Test Techniques-Partial Discharge Measurements; International Electrotechnical Commission: Geneva, Switzerland, 2000. [Google Scholar]
- Albarracín-Sánchez, R.; Álvarez-Gómez, F.; Vera-Romero, C.A.; Rodríguez-Serna, J.M. Separation of Partial Discharge Sources Measured in the High-Frequency Range with HFCT Sensors Using PRPD-teff Patterns. Sensors 2020, 20, 382. [Google Scholar] [CrossRef] [PubMed]
- Ghasempour, A. Internet of Things in Smart Grid: Architecture, Applications, Services, Key Technologies, and Challenges. Inventions 2019, 4, 22. [Google Scholar] [CrossRef]


© 2020 by the authors. Licensee MDPI, Basel, Switzerland. This article is an open access article distributed under the terms and conditions of the Creative Commons Attribution (CC BY) license (http://creativecommons.org/licenses/by/4.0/).