Abstract
The present work investigated a solar assisted heat pump system for drying Chinese wolfberry. The kinetic characteristic was firstly analyzed through a series of lab experiments. It was concluded that the Page model was the most suitable for predicting the heat and mass transfer of the wolfberry. Based on the wolfberry kinetic model, solar collector model and chamber air model, the coupled drying system model was developed. The accuracy of the mathematic model was determined through comparing with the preliminary experimental results. The influence of operating conditions on the thermal and energy performance of the dryer for the different operating mode was discussed. The drying weight of no more than 75 kg may be preferable in the stand-alone solar drying mode, and less than 15 h was needed to be dried. The electric energy consumption in the solar assisted the heat pump drying mode was lower than that in the stand-alone heat pump mode, and it was recommended that about 50 kg of wolfberry to be dried in the solar assisted heat pump system. Compared to the autumn drying, the reduction in the electric energy consumption was around 9.1 kWh during the 11 h summer drying process. The obtained results demonstrated the feasibility of the combined system for drying wolfberry, and also can provide the basic theoretical and experimental data support for the following research.
1. Introduction
Drying is a processing technique to preserve the agricultural product for long periods of time. Various drying methods are available following the energy sources, such as fossil fuel, natural gas, biomass and solar energy. Solar drying is popularly used in recent decades because solar energy is abundant, free and environment-friendly [1,2]. Among the different types of solar dryers, indirect type solar dryer exhibits better on the final product quality as it can provide the required temperature, better control over drying and is highly recommended for photo-sensitive materials such as lemon, cucumber and papaya [3,4].
Flat solar air collectors (FPACs) can supply hot air at low and moderate temperature and are widely coupled with the indirect type dryer, as seen in Figure 1. The FPACs is one of the most important components in the indirect type drying system [5,6]. Various optimization designs have been proposed to increase the heat transfer, such as expanded surfaces area (finned absorber and corrugated surface), multi-pass collector (double and triple-pass solar air collector) and absorber fixed with reflectors. Satchunanathan and Deonarine [7] performed experimental studies on a double-pass solar air heater (DPSAC) and concluded that the DPSAC had a thermal efficiency of about 10–15% higher than the single-pass design. Further, they explained the better performance of the DPSAC was due to the reduced top loss to the environment since the outer glass cover was cooled by the working fluid. Fudholi et al. [8,9] investigated a finned DPSAC for drying the oil palm fronds under the Malaysia climate conditions with an amount of 4–5 kWh/m2 daily solar radiation intensity. Six DPSACs with fins absorber in the lower channel are arranged in series. Experimental results showed that the moisture content (MC) of the fronds decreased to 10% (wet basis, wb) from 60% (wb) in 22 h. Additionally, they performed energy and exergy analyses of the DPSAC drying system for chili drying [10]. The exergy efficiency varied between 43 and 97% with an average of 57%. The specific energy consumption (SEC) was 5.26 kW h/kg. Yahya et al. [11] designed a drying system with an array of V-groove solar collector for drying the herbal tea in Malaysia. The MC of the fresh tea of 10.03 kg was decreased from 87% (wb) to 54% (web) at 50 °C drying temperature and 15.1 m3/min flow rate. The collector and drying system efficiency ranged from 40–65% and 20–30%, respectively.
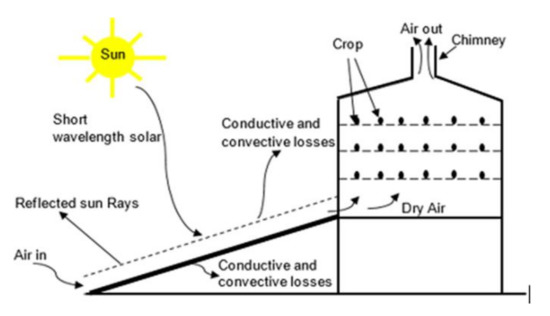
Figure 1.
Schematic view of a solar dryer with a solar collector [3].
However, the drying efficiency using the FPAC is highly sensitive to solar radiation. The consecutive drying cannot be performed in an indirect type dryer, and in some cases, the dryers for high MC products operated for more than a day, especially for the natural convection indirect dryer. The solar dryer with the integrated thermal storage medium is an option to prolong the drying time to some degree [12,13], whereas an auxiliary heater with fan or blower is more frequently used in the solar drying system, such as a heat pump. The solar assisted heat pump (SAHP) drying system possessed a continuous drying operation, high-quality dried products and adjustable air flow rate inside the dryer [14,15,16]. Many studies on the SAHP drying system with or without thermal storage have been reported. Sopian et al. [17] demonstrated that the drying performance of the DPSAC system increased with the presence of a storage medium. Mohanraj [18] investigated the performance of a solar-ambient hybrid source heat pump drier for copra under hot-humid weather conditions. The specific moisture extraction rate (SMER) was 0.79 kg/kWh and the moisture content (on wet basis) of the copra was reduced from about 52% to about 9.8% in 40 h. The quality of copra was higher compared to other drying methods. In the similar climate condition, Hawlader et al. [19,20] tested and simulated a SHAP dryer and water heater operating in Singapore. The results showed that the specific moisture extraction rate (SMER) depended on the weight being dried and it was 0.65 kg/kWh for 20 kg of green beans. Additionally, they found the drying time was affected by the air flow rate, drying air temperature and the air relative humidity. Ceylan et al. [21] experimentally compared a heat pump and solar dryer through drying apples. They recommended that better drying performance can be achieved with solar heaters firstly and then the heat pump dryers used. At the same time, they also considered that apples could be dried more efficiently with a combination of both dryers. Based on the study by Saensabai and Prasertsan [22,23], a condenser was a major component influencing the heat pump dryer performance. Five different heat pump dryer configurations were compared, and the results indicated that the closed-loop heat pump dryer with air bypassing over the evaporator could achieve the optimum performance. Additionally, some solar hybrid dryers were reported, such as solar and ground-source heat pump dryer [24], hybrid photovoltaic/thermal dryer [25,26] and hybrid waste-heat/solar dryer [27].
As per the literature survey, no robust studies were reported on the numerical analysis of the SAHP drier especially for the wolfberry drying. While the numerical evaluation was important before extending the actual application of the large-scale drying system because the simulation can help to analyze the short and long term performances of drying system. This is what motivated the present work in which both the wolfberry drying kinetic model and the SAHP drying system model were developed. At the same time, the controlled lab experiments and the preliminary field tests on the wolfberry drying under the natural environment were carried out for the model validation. Adopting the validated model, the wolfberry drying performance using the heat pump with and without the solar collector was predicted. Additionally, some influencing parameters were investigated, including drying temperature, the total product load being dried and weather conditions.
2. Materials and Methods
2.1. Lab Experiment and Kinetic Model
2.1.1. Lab Experiment
The drying kinetics varied with the product, thus the drying kinetic of the Chinese wolfberry was developed firstly to simulate and estimate the SAHP drying system in the following section. The drying rate involves multiple variables such as drying temperature, mass flow rate and relative humidity of air. In this study, the drying kinetic of the Chinese wolfberry was developed through the lab experiments in a controlled drying oven where the air temperature, relative humidity and mass flow rate can be adjusted to the desired values (Figure 2). The material (fresh wolfberry) was supplied from the planting base in Chinese Qinghai, as seen in Figure 2. Before the drying process, the initial moisture content of the wolfberry was measured using the hot air oven method in which fresh product being dried was set at 105 °C for 24 h [28].
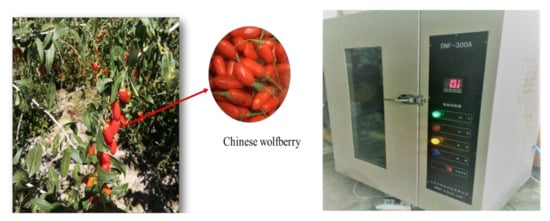
Figure 2.
Photos of wolfberry (left) and thermostat-humidistat oven (right).
The cases conducted are summarized in Table 1. Generally, the parameter to be investigated was variable while keeping other parameters constant within the time tested. The operating conditions was varied from 40 to 70 °C for air temperature, 30 to 60% for relative humidity and 0.4 to 1.0 m/s for mass flow rate. Wolfberry was placed on the loading tray of 0.2 × 0.3 m2 that is made of stainless steel wire mesh. The hourly variation of the mass of the product was measured by a digital balance during drying and using this data the transient moisture content was estimated. The drying process would be ended until the wolfberry moisture content was below 12% for three consecutive measurements. The descriptions of the instrument used are illustrated in Table 2.

Table 1.
Summarization of the operating cases in the lab experiment.
Table 2.
Specifications of the instruments used in the lab experiment.
2.1.2. Kinetic Model
Drying models widely used in the published literature mainly included theoretical, semi-theoretical or purely empirical models, as shown in Table 3. The equations in Table 3 were compared to select the most suitable model for describing the drying curve of the wolfberry during the drying process in the SAHP dryer. The moisture ratio (MR) and drying rate (DR) during drying experiments were respectively calculated by Equations (1) and (2) [29]. After obtaining the MR parameter in different cases, nonlinear regression analysis was adopted using ORIGIN software for the MR with drying time and undetermined constants in Table 3 can be obtained.
where is the moisture ratio, the moisture content (db) and is the initial moisture content (db).
Table 3.
Kinetic models reported in various literature for drying curves.
2.2. Description of the SAHP Drying System
To analyze the preliminary performance and validate the theoretical model of the SAHP drying system developed, an experimental platform was built as shown in Figure 3. It consists of a drying chamber, solar collector array, heat pump, blower and process control devices. The chamber was built with interior dimensions of 2 m (length) × 3 m (width) × 2 m (height) and are equipped with some shelves to load the product to be dried. The solar collector array includes four FPSACs, arranged as two banks of two collectors in series and installed on the roof of the chamber with an inclination of 30°. Each FPSAC length and width were 2 m and 0.9 m respectively. Additionally, the FPSAC is single-pass collector with a trapezoidal absorber. This chamber air is delivered to the collector inlet for the absorption of solar energy. The heat pump mainly consists of an evaporator, condenser, compressor and expansion valve. The condenser placing in the chamber is to provide hot air for drying products.
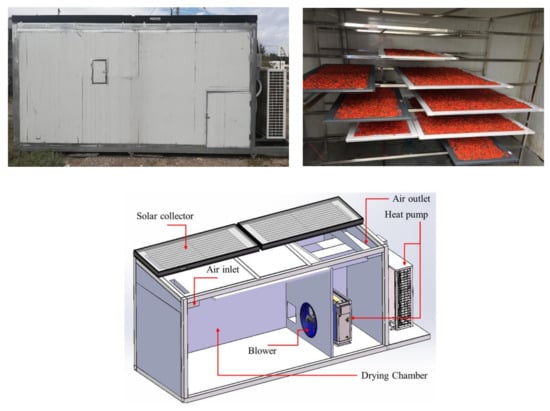
Figure 3.
Photos and schematic diagram of the drying system.
Products are heated by hot air coming from the collector or the heat pump and then the moisture contained in the products is removed to the chamber. An exhaust duct is designed to carry away the chamber air in case that the interior air humidity reaches a set value by decision-makers. To enable the recovery of the sensible energy from the exhaust air, a heat transfer exchanger is employed between the coming fresh air and the discharge air. In addition, two fans are used in the drying system. One is to bring the collector air in the chamber, the other is used to discharge moist air in the chamber. The fan installed in the solar collector was controlled by considering both the solar radiation and the outlet temperature of the collector. The fan was opened after sunrise and closed if the outlet temperature was lower than the chamber temperature, which can maximize the solar energy utilization and reduce the heat loss. For the drying process, three operating strategies can be selected including the stand-alone solar drying, the stand-alone heat pump drying and the drying mode with the combination of collector and heat pump. The working principle of the SAHP drying system was given in Figure 4.
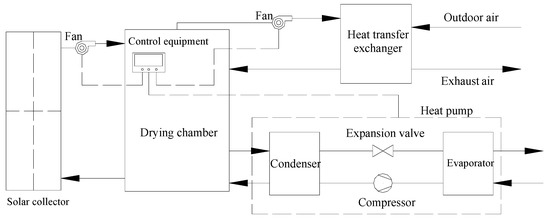
Figure 4.
Working principle of the solar assisted heat pump (SAHP) drying system.
In the preliminary experiment, the wolfberry of 50 kg was equally distributed on eight trays and placed in the drying chamber (see Figure 3). The drying was divided into three stages at different temperatures, including the warm-up stage (7:00–9:00, 50 °C), constant rate drying stage (9:00–11:00, 58 °C) and decelerating drying stage (11:00–18:00, 66 °C). The drying process was continued until the required moisture content was reached (12%). Camry R9364 digital electronic balance with an accuracy of 0.01 g were placed on the bottom of the shelf, which can measure the weight changes of the wolfberry and then determine the moisture loss. The temperatures of collector outlet, chamber air and ambient were measured through T-type thermocouples. Additionally, the hourly electric power consumed by the drying system was measured by a watt-hour meter.
3. Drying System Model
To predict the drying system performance, the coupled models including the solar collector, drying chamber and the wolfberry kinetics were respectively given from Equations (3)–(13).
Solar collector:
The wolfberry:
Drying chamber:
for the stand-alone solar drying mode,
for the solar assisted heat pump or the stand-alone heat pump drying mode,
where is temperature (°C); is heat transfer coefficient (W·m−2·K−1); is solar radiation (W·m−2); is mass flow rate (kg/s); is the thickness (m); is the sensible heat of the wolfberry (J); is the latent heat of the wolfberry (J); is the drying chamber thermal loss (J); is the thermal energy contribution from the solar collector (J); is the initial content moisture (wb); is the mass of the exactly dried wolfberry (kg); is the coefficient of performance of heat pump; is the total electric energy consumption of heat pump (kW·h) and the subscripts of , , , , and are respectively the ambient, glazing cover, absorber plate, back plate, drying chamber and wolfberry.
4. Results and Discussion
4.1. Drying Kinetic Characteristics
The variations of the moisture ratio (MR) and drying rate (DR) with temperature, velocity and relative humidity of drying air were respectively given in Figure 5, Figure 6 and Figure 7. It can be seen from Figure 5a that the MR was decreased with the drying time, especially a more discernible decreasing rate was expressed in a larger air temperature. The drying process needed about 59 h at 40 °C while that was only 8 h at 70 °C, which implies that it dried more rapidly in the larger temperature. The result is that the drying depended on both the moisture diffusion rate of the inside and the moisture evaporation rate of the outside surface of the wolfberry. The increase of drying temperature could not only accelerate the diffusion rate but also reduced the drying air relative humidity, which further carried away the wolfberry moisture. On the other hand, as indicated in Figure 5b, there was no constant drying rate period in the drying of the wolfberry, which was similar to the drying curve of many products [33].
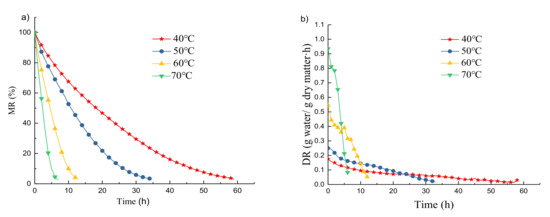
Figure 5.
Variations of the moisture ratio (a) and drying rate (b) with drying time at a different temperature of drying air.
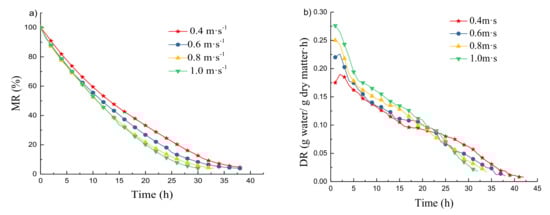
Figure 6.
Variations of the moisture ratio (a) and drying rate (b) with drying time at a different velocity of drying air.
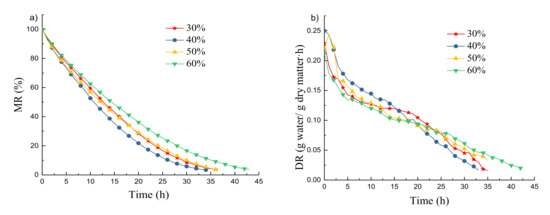
Figure 7.
Variations of the moisture ratio (a) and drying rate (b) with drying time at a different relative humidity of drying air.
The results on the impact of drying air velocity on the MR and drying rate were presented in Figure 6, where the air temperature and relative humidity were kept constants of 50 °C and 40% respectively. Generally, the higher the velocity, the smaller the MR and the larger the drying rate. This can be explained that the larger air velocity corresponds to the lager convection heat and mass transfer coefficients, which results in the better removal of moisture on the wolfberry. On the other hand, unlike the obvious difference shown in Figure 5, the drying time observed in Figure 6 was reduced by 15 h when the velocity was increased from 0.4 to 1.0 m/s.
Similarly, the MR and drying rate with time for a different relative humidity were plotted in Figure 7. Firstly, the results can also be found that there was less impact of relative humidity on the drying performance compared to that of air temperature. Secondly, it was interesting that the relative humidity of 40% was preferable to drying the wolfberry (about 35 h), and the drying was worsened for either less or more than a humidity of 40%. It is because the higher relative humidity means the smaller driving force of moisture mass transfer (the water vapor partial pressure difference). The lower relative humidity could accelerate the moisture removal capacity of the outside surface while the moisture diffusion rate of the inside could not be increased at the same rate, namely, the imbalance of the moisture removal rate between the inner and outer side of the wolfberry. The phenomenon further causes the hardened outer side of the wolfberry and the reduced drying rate. As to the smallest drying rate after 20 h for the case of 40% from the Figure 7b, it is due to the minimum moisture content after that moment and then the smallest drying driving force. Combining Figure 5, Figure 6 and Figure 7, it can be concluded that the drying air temperature was the most influencing factor in the drying process in terms of reducing the drying time. This conclusion was similar to other products [3].
Based on the experimental results above, drying curves for the wolfberry was fitted with three thin-layer drying models in Table 3 to correlate the drying time (t) and moisture ratio (MR). The regression analysis was conducted for three drying models by using the Origin 9.0 program. The goodness of fits was reflected by the determination of coefficient (R2) for these models. As given in Table 4, the R2 of the three models were almost more than 0.9, and the highest R2 was found in the Page model, thus, the Page model was selected as the best curve fitting technique for drying kinetics analysis of the wolfberry. To correlate the regression constant (k, m) and the drying conditions (T, V and RH), the equations are respectively given as follows:
where the , and are respectively the temperature, relative humidity and velocity of drying air. According to the results in Table 4, linear regression was carried out by MATLAB software to obtain the constants in Equations (14) and (15). The equation of the correlation of the moisture ratio (MR) with drying air temperature (T), relative humidity and velocity (v) was given as follows.
Table 4.
Kinetic characteristics with temperature, velocity, relative humidity of drying air and coefficient of determinations (R2).
Validation of the Equation (16) was confirmed by comparing the predicted moisture contents with the measured moisture contents (T = 50 °C, RH = 40% and v = 0.8 m/s), as seen in Figure 8, which indicted a good agreement between the predicted results and experimental data.
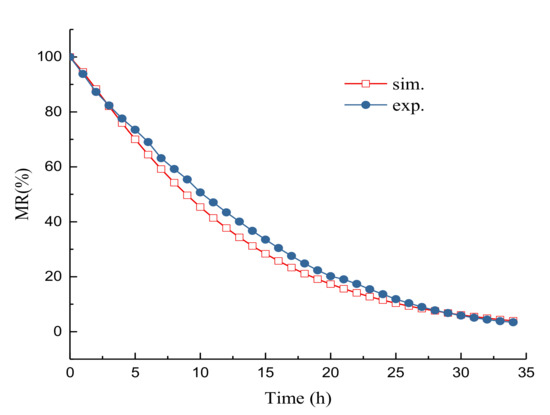
Figure 8.
Comparison of experimental moisture ratio with the predicted moisture ratio from the Page model.
4.2. Validation of Drying System Model
To determine the accuracy of the numerical model in Section 3, preliminary testing on the solar assisted heat pump dryer was carried out for three operation modes (as described in Section 2.2). The stand-alone solar drying was run from 8:30 to 16:00 on the 15th October, as shown in Figure 9. The stand-alone heat pump drying and the drying with the combination of the collector and heat pump were respectively operated under three stages as described in Section 2.2, and the solar radiation and ambient temperature from 8:00 to 16:00 on 22th October (the stand-alone heat pump drying) and that on 24 October (the mixed drying) were respectively presented in Figure 9. The simulated and experimental results in the stand-alone solar drying were compared in Figure 10, including the outlet temperature, heat gains, chamber temperature and moisture ratio of wolfberry. For the cases of the controlled drying temperature (stand-alone heat pump drying and mixed drying assisted with collector), the electric energy consumption was simulated and compared with experimental data, as indicated in Figure 11. In all of the figures, the shape and magnitude matched very well. To analyze the error between the simulation and experiment, a root means square deviation (RMSD) was calculated as [34]:
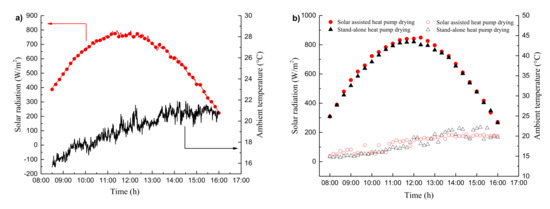
Figure 9.
Weather data of the stand-alone solar drying (a) and the stand-alone heat pump and the solar assisted heat pump drying (b).
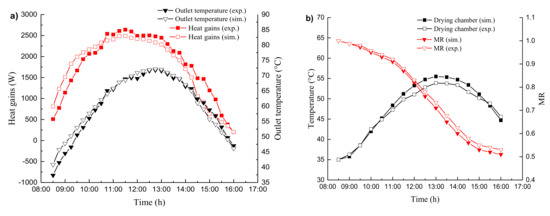
Figure 10.
Comparison of experimental and simulated outlet temperature, heat gains chamber (a) temperature and moisture ratio (b) of wolfberry in stand-alone solar drying.
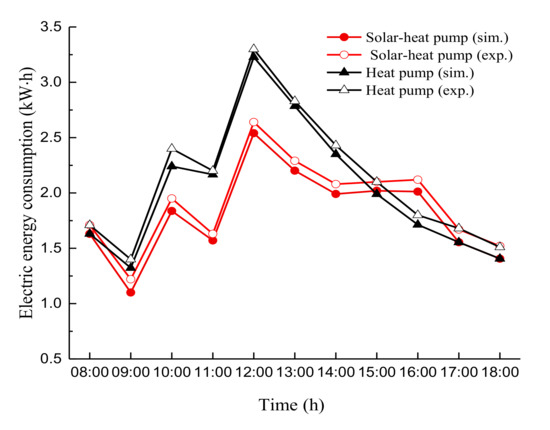
Figure 11.
Comparison of the measured and the simulated electric energy consumption.
The corresponding values of the RMSD are listed in Table 5, and it demonstrated that the developed model could predict the wolfberry drying performance of the solar assisted heat pump drying system operated in different cases.
Table 5.
Summary of the root mean square deviation between the simulation and experiment.
4.3. Parametric Study
Adopting the above validated model, the influence of some operating conditions was investigated, including the drying weight of the wolfberry drying temperature and the operated season. The weather data on 10th July in Hefei city was used as the case study to evaluate the performance of different drying modes, as shown in Figure 12. The highest, smallest and average values of solar radiation (ambient temperature) from 8:00 to 16:00 were respectively about 947 W/m2 (42 °C), 340 W/m2 (33 °C) and 700 W/m2 (38 °C), which represents a typical summer condition in Hefei.
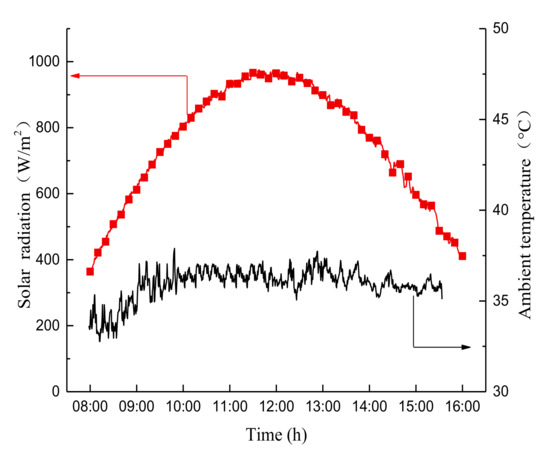
Figure 12.
Solar radiation and ambient temperature on 10th July in Hefei.
The drying performance in the stand-alone solar drying was firstly investigated for different drying weights of wolfberry (25, 50, 75 and 100 kg). Figure 13 gives the hourly variations of the chamber temperature and moisture ratio (MR) with a different drying weight. It is mentioned that to predict the suitable drying weight, the system was operated within two days until the required moisture ration of 0.038 was reached. From Figure 13a, the changing tendency of the chamber temperature was similar to the solar radiation except for the drying weight of 25 kg. This is because the ventilation system was operated once the chamber temperature exceeded 70 °C, and then the chamber temperature changed within a narrow range. Additionally, it can be seen from Figure 13a that the chamber temperature in a large drying weight was lower than that in a small drying weight, which is reasonable that the larger the drying weight, the more heat is absorbed by wolfberry and then the lower the chamber temperature. From Figure 13a,b, it was found that the drying time was about 8 h for 25 kg of wolfberry, 12 h for 50 kg of wolfberry and 15 h for 75 kg, while the MR was larger than the required value of 0.038 at the end of drying of 100 kg. Thus, the wolfberry weight of less than 75 kg may be preferable for the drying chamber when it was operated in the presented cases.
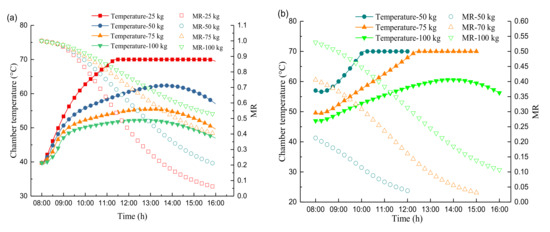
Figure 13.
Hourly variations of the chamber temperature and moisture ratio (MR) with a different drying weight of wolfberry (a) on the first day and (b) on the second day.
Three drying stages were respectively set in the stand-alone heat pump and the solar assisted heat pump, including the warm-up stage (7:00–9:00, 50 °C), constant rate drying stage (9:00–11:00, 58 °C) and decelerating drying stage (11:00–18:00, 66 °C). Hourly electric energy consumption of the drying system for a different drying weight of wolfberry was recorded and plotted in Figure 14. It was observed that the energy consumption was increased as the increasing drying weight for the two drying modes. The electric energy in the drying rate of 25 kg was nearly constant during the drying process, which demonstrated that the solar energy could afford the energy consumption in the removal of wolfberry moisture. Further, the energy consumption of the heat pump drying system was significantly larger than that of the solar assisted heat pump drying system, especially at around 12:00 due to the higher solar radiation. Additionally, the energy consumption was substantially increased after the drying temperature was changed at 7:00, 9:00 and 11:00, while it was then scarcely increased and even decreased after that moment. The reason was that in 1 h after increasing the drying temperature, most of the electric energy was used to elevate the temperatures of the chamber air and wolfberry in the form of sensible energy. The following electric energy consumption was due to the removal of wolfberry moisture in the latent heat way, so the energy consumption was gradually decreased. Figure 15 compares the total electric energy consumption of the solar assisted heat pump drying and that of the heat pump drying under different drying weight. Obviously, the electric energy consumption of the solar assisted heat pump drying was lower than that of the stand-alone heat pump. On the other hand, the increment of energy consumption from 50 to 75 kg was larger than that from 25 to 50 kg. For the sake of energy saving, it was recommended about 50 kg of wolfberry to be dried in the designed system.
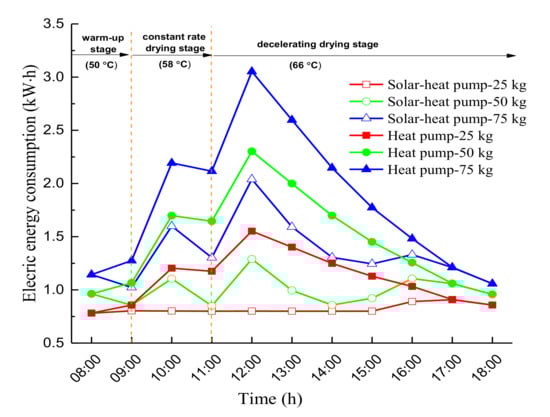
Figure 14.
Hourly variation of electric energy consumption with a different drying weight of wolfberry for two drying modes.
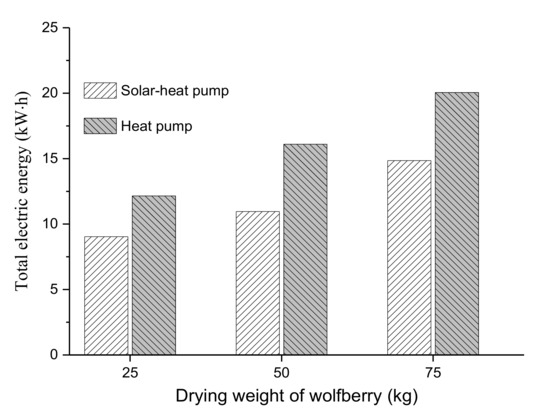
Figure 15.
Variation of total electric energy consumption with a different drying weight of wolfberry.
According to the mathematical model, the variation of the electric energy consumption with different drying temperature, relative humidity and velocity can be obtained through a control variate. Considering the dominant influence of the temperature setting, the impact of temperature on the electrical energy consumption was investigated. Here, the results on the solar heat pump with the temperature setting in Figure 15 were named Case 1, and another two cases were calculated. Cases 2, 50 °C (8:00–10:00), 58 °C (10:00–12:00) and 66 °C (12:00–16:00, and 9:00–12:00 in the second day). Case 3, 50 °C (8:00–10:00), 55 °C (10:00–14:00), 60 °C (14:00–16:00, and 9:00–11:00 in the second day) and 11:00–15:00 (65 °C). That is to say, cases 2 and 3 were operated within two continuous days in the moderate temperature gradient. Figure 16 presents the electrical energy consumption of three cases. It can be seen that the energy consumption in cases 2 and 3 was lower than that in case 1, which is reasonable that the smaller heat loss for the lower drying temperature occurred. Therefore, the small temperature increment would be energy-efficient if the wolfberry allows the dryers to work for more than a day.
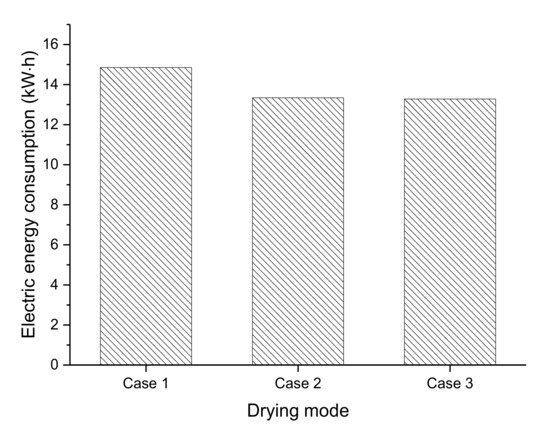
Figure 16.
Electric energy consumption of the solar assisted heat pump drying system on a different temperature setting.
The wolfberry is generally ripe in summer and autumn, and the drying also operated from June to October. Thus, the drying behavior in the two seasons was predicted and analyzed taking the solar assisted heat pump drying system as an example. As indicated in Figure 17, the drying was divided into three stages as shown in Figure 15. From the two curves, the electric energy consumption in summer was significantly lower than that in autumn, which further demonstrated the advantage of using the solar collector. Compared to drying in autumn, the reduction in electric energy consumption was around 9.1 kWh during the 11 h summer drying process.
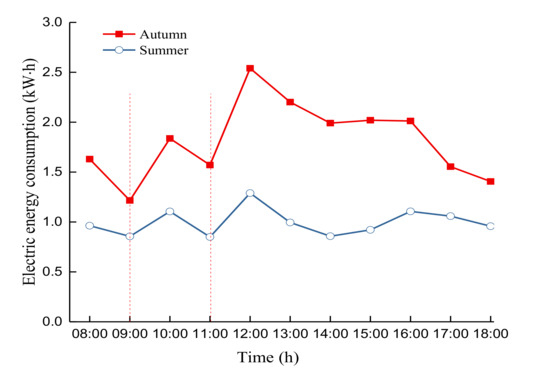
Figure 17.
Hourly variation of electric energy consumption for one typical summer day and one typical autumn day.
5. Conclusions
In the present study, a solar assisted heat pump (SAHP) system was used to dry the wolfberry, and the thermal and energy performance in different operating modes was investigated. To that end, the wolfberry drying kinetic characteristic especially the equation of the correlation of the moisture ratio with drying air temperature, relative humidity and velocity was given, which is useful for optimizing the dryer to minimize the electric energy consumption. Based on the wolfberry drying kinetic model, solar collector model and drying chamber model, the coupled drying system model was developed. Additionally, the lab and field experiment were respectively carried out to validate the above numerical model. The drying system model for the wolfberry was given in detail in few of the published literature.
The first part of this study found that the drying air temperature was the most influencing factor in the drying process in terms of reducing the drying time, for example, the drying time was around 59 h at 40 °C while that was only 8 h at 70 °C. Further, the Page model was determined as the best curve fitting technique for the drying kinetics analysis of the wolfberry. It was interesting that the relative humidity of 40% was preferable to drying the wolfberry.
The second part of parametric study showed that the drying weight of wolfberry and operating seasons have a great influence on the thermal and energy performance of the SHAP drying system. The wolfberry weight of less than 75 kg may be preferable in the stand-alone solar drying mode, which needed no more than 15 h. In the heat pump system or that combined with the solar collector, energy consumption was increased as the increasing drying weight. The electric energy consumption of the solar assisted heat pump drying was lower than that of the stand-alone heat pump, and it was recommended about 50 kg of wolfberry to be dried in the mixed system. The drying results in autumn and summer time were indicated that compared to drying in autumn, the reduction in electric energy consumption was around 9.1 kWh during the 11 h summer drying process. It was mentioned that the auxiliary dehumidifier might be needed if the high relative humidity occurs in the drying process to maintain the quality of the wolfberry.
Author Contributions
Conceptualization, W.H. and Z.H.; methodology, Z.H. and W.H.; validation, W.C. and S.Z.; formal analysis, S.Z. and H.Y.; writing—original draft preparation, Z.H.; writing—review and editing, C.Y. and S.Z. All authors have read and agreed to the published version of the manuscript.
Funding
This research was funded by Anhui Provincial Natural Science Foundation, grant number 1908085QE206; Fundamental Research Funds for the Central Universities of China, grant number JZ2019HGTA0041 and JZ2018HGBZ0121.
Conflicts of Interest
The authors declare no conflict of interest. The funders had no role in the design of the study; in the collection, analyses, or interpretation of data; in the writing of the manuscript, or in the decision to publish the results.
References
- Morad, M.M.; El-Shazly, M.A.; Wasfy, K.I.; El-Maghawry, H.A.M. Thermal analysis and performance evaluation of a solar tunnel greenhouse dryer for drying peppermint plants. Renew. Energy 2017, 101, 992–1004. [Google Scholar] [CrossRef]
- Montero, I.; Teresa Miranda, M.; Jose Sepulveda, F.; Ignacio Arranz, J.; Victoria Rojas, C.; Nogales, S. Solar dryer application for olive oil mill wastes. Energies 2015, 8, 14049–14063. [Google Scholar] [CrossRef]
- Lingayat, A.B.; Chandramohan, V.P.; Raju, V.R.K.; Meda, V. A review on indirect type solar dryers for agricultural crops—Dryer setup, its performance, energy storage and important highlights. Appl. Energy 2020, 258, 114005. [Google Scholar] [CrossRef]
- Chaouch, W.B.; Khellaf, A.; Mediani, A.; Slimani, M.E.A.; Loumani, A.; Hamid, A. Experimental investigation of an active direct and indirect solar dryer with sensible heat storage for camel meat drying in Saharan environment. Solar Energy 2018, 174, 328–341. [Google Scholar] [CrossRef]
- Azouma, Y.O.; Drigalski, L.; Jegla, Z.; Reppich, M.; Turek, V.; Weiss, M. Indirect convective solar drying process of pineapples as part of circular economy strategy. Energies 2019, 12, 2841. [Google Scholar] [CrossRef]
- Kumar, V.B.; Manikandan, G.; Kanna, P.R.; Taler, D.; Taler, J.; Nowak-Oclon, M.; Mzyk, K.; Toh, H.T. A performance evaluation of a solar air heater using different shaped ribs mounted on the absorber plate—A review. Energies 2018, 11, 3104. [Google Scholar] [CrossRef]
- Satcunanathan, S.; Deonarine, S. A two-pass solar air heater. Solar Energy 1973, 15, 41–49. [Google Scholar] [CrossRef]
- Fudholi, A.; Ruslan, M.H.; Othman, M.Y.; Azmi, M.S.M.; Zaharim, A.; Sopian, K. Drying of palm oil fronds in solar dryer with finned double-pass solar collectors. WSEAS Trans. Heat. Mass. Transf. 2012, 4, 105–114. [Google Scholar]
- Ruslan, M.H.; Fudholi, A.; Othman, M.Y.; Azmi, M.S.M.; Yahya, M.; Zaharim, A.; Sopian, K. The double-pass solar dryer for drying palm oil fronds. In Proceedings of the 10th WSEAS International Conference on System Science and Simulation in Engineering (ICOSSSE’11), Stevens Point, WI, USA; 2011; pp. 143–149. [Google Scholar]
- Fudholi, A.; Sopian, K.; Yazdi, M.H.; Ruslan, M.H.; Gabbasa, M.; Kazem, H.A. Performance analysis of solar drying system for red chili. Solar Energy 2014, 99, 47–54. [Google Scholar] [CrossRef]
- Yahya, M.; Ruslan, M.H.; Othman, M.Y.; Yatim, B.; Sulaiman, M.; Mat, S.; Lim, C.H.; Alghoul, M.; Zaharim, A.; Sopian, K. Evaluation of energy requirement for drying of green tea using a solar assisted drying system (V-groove solar collector). In Proceedings of the 3rd WSEAS International Conference on Renewable Energy Sources, Kuala Lumpur, Malaysia, 2–4 April 2013; pp. 298–303. [Google Scholar]
- Raj, A.K.; Srinivas, M.; Jayaraj, S. A cost-effective method to improve the performance of solar air heaters using discrete macro-encapsulated PCM capsules for drying applications. Appl. Therm. Eng. 2019, 146, 910–920. [Google Scholar] [CrossRef]
- Atalay, H. Performance analysis of a solar dryer integrated with the packed bed thermal energy storage (TES) system. Energy 2019, 172, 1037–1052. [Google Scholar] [CrossRef]
- Pal, U.S.; Khan, M.K. Calculation steps for the design of different components of heat pump dryers under constant drying rate condition. Dry. Technol. 2008, 26, 864–872. [Google Scholar] [CrossRef]
- Fudholi, A.; Sopian, K. A review of solar air flat plate collector for drying application. Renew. Sustain. Energy Rev. 2019, 102, 333–345. [Google Scholar] [CrossRef]
- Daghigh, R.; Ruslan, M.H.; Sulaiman, M.Y.; Sopian, K. Review of solar assisted heat pump drying systems for agricultural and marine products. Renew. Sustain. Energy Rev. 2010, 14, 2564–2579. [Google Scholar] [CrossRef]
- Sopian, K.; Supranto; Othman, M.; Daud, W.; Yatim, B. Double-pass solar collectors with porous media suitable for higher-temperature solar-assisted drying systems. J. Energy Eng. 2007, 133, 13–18. [Google Scholar] [CrossRef]
- Mohanraj, M. Performance of a solar-ambient hybrid source heat pump drier for copra drying under hot-humid weather conditions. Energy Sustain. Develop. 2014, 23, 165–169. [Google Scholar] [CrossRef]
- Hawlader, M.N.A.; Jahangeer, K.A. Solar heat pump drying and water heating in the tropics. Solar Energy 2006, 80, 492–499. [Google Scholar] [CrossRef]
- Hawlader, M.N.A.; Chou, S.K.; Jahangeer, K.A.; Rahman, S.M.A.; Eugene Lau, K.W. Solar-assisted heat-pump dryer and water heater. Appl. Energy 2003, 74, 185–193. [Google Scholar] [CrossRef]
- Aktaş, M.; Ceylan, İ.; Yilmaz, S. Determination of drying characteristics of apples in a heat pump and solar dryer. Desalination 2009, 239, 266–275. [Google Scholar] [CrossRef]
- Saensabai, P.; Prasertsan, S. Effects of component arrangement and ambient and drying conditions on the performance of heat pump dryers. Dry. Technol. 2003, 21, 103–127. [Google Scholar] [CrossRef]
- Saensabai, P.; Prasertsan, S. Condenser coil optimization and component matching of heat pump dryer. Dry. Technol. 2007, 25, 1571–1580. [Google Scholar] [CrossRef]
- Bi, Y.; Guo, T.; Zhang, L.; Chen, L. Solar and ground source heat-pump system. Appl. Energy 2004, 78, 231–245. [Google Scholar] [CrossRef]
- Chauhan, P.S.; Kumar, A.; Nuntadusit, C. Heat transfer analysis of PV integrated modified greenhouse dryer. Renew. Energy 2018, 121, 53–65. [Google Scholar] [CrossRef]
- Tiwari, S.; Agrawal, S.; Tiwari, G.N. PVT air collector integrated greenhouse dryers. Renew. Sustain. Energy Rev. 2018, 90, 142–159. [Google Scholar] [CrossRef]
- Maurer, C.; Mueller, J. Drying characteristics of biogas digestate in a hybrid waste-heat/solar dryer. Energies 2019, 12, 1294. [Google Scholar] [CrossRef]
- Chandramohan, V.P.; Talukdar, P. Estimation of Equilibrium Moisture Content and Drying Time of Potato Through Hot Air Drying; Springer India: New Delhi, India, 2017; pp. 205–213. [Google Scholar]
- Diamante, L.M.; Munro, P.A. Mathematical modeling of hot air drying of sweet potato slices. Int. J. Food Sci. Technol. 2007, 26, 99–109. [Google Scholar] [CrossRef]
- Akpinar, E.; Midilli, A.; Bicer, Y. Single layer drying behaviour of potato slices in a convective cyclone dryer and mathematical modeling. Energy Convers. Manag. 2003, 44, 1689–1705. [Google Scholar] [CrossRef]
- Diamante, L.M.; Munro, P.A. Mathematical modelling of the thin layer solar drying of sweet potato slices. Solar Energy 1993, 51, 271–276. [Google Scholar] [CrossRef]
- Asiru, W.B.; Raji, A.O.; Igbeka, J.C.; Elemo, G.N. Mathematical modelling of thin layer dried cashew kernels. Nigerian Food J. 2013, 31, 106–112. [Google Scholar] [CrossRef][Green Version]
- Wang, W.; Li, M.; Hassanien, R.H.E.; Wang, Y.; Yang, L. Thermal performance of indirect forced convection solar dryer and kinetics analysis of mango. Appl. Therm. Eng. 2018, 134, 310–321. [Google Scholar] [CrossRef]
- Guo, C.; Ji, J.; Sun, W.; Ma, J.; He, W.; Wang, Y. Numerical simulation and experimental validation of tri-functional photovoltaic/thermal solar collector. Energy 2015, 87, 470–480. [Google Scholar] [CrossRef]


© 2020 by the authors. Licensee MDPI, Basel, Switzerland. This article is an open access article distributed under the terms and conditions of the Creative Commons Attribution (CC BY) license (http://creativecommons.org/licenses/by/4.0/).