Article

The Identification and Rebound Effect Evaluation of Equipment Energy Efficiency Improvement Policy: A Case Study on Japan’s Top Runner Policy

Department of Architecture, The University of Kitakyushu, Kitakyushu 808-0135, Japan
*
Author to whom correspondence should be addressed.
Energies 2020, 13(17), 4397; https://doi.org/10.3390/en13174397
Submission received: 6 August 2020 / Revised: 24 August 2020 / Accepted: 25 August 2020 / Published: 26 August 2020
(This article belongs to the Section B: Energy and Environment)

Abstract

:
The equipment energy efficiency improvement policy (EEEIP) is one of the important measures of energy conservation and emission reduction in various countries. However, due to the simultaneous implementation of variety policies, the effect of the single policy cannot be clearly reflected. In this paper, a method of identification and evaluation of EEEIP was proposed, and the application was verified by analyzing the example of EEEIP in Japan (Top Runner policy, TRP). Firstly, through the factor decomposition model, this paper studied the energy conservation and emission reduction potential of this policy area in Japan. Then, the TRP was identified by using moving windows and correlation analysis, and the impact of specific equipment in TRP was analyzed. Finally, through the calculation of the rebound effect of the carbon footprint (REC), this paper analyzed the energy consumption and emission reduction effects of TRP in the short-term and whole life cycle. It showed that the policy has a good effect in tertiary industry and transportation, while the effect in residential is poor. For life cycle, the TRP of air conditioning and passenger car can bring better CO2 emission reduction effect, but the emission reduction effect of lighting is basically offset.

Graphical Abstract

1. Introduction

At present, the two major challenges in the global energy transformation stage are the increasing demand for energy and the limitation of carbon emissions. According to International Energy Agency (IEA) statistics, the industry, transportation and residential sectors are the highest energy consumption areas. The three sections with the most CO2 emissions are electricity and heat producing, industry and transportation [1]. In the BP World Energy Outlook by British Petroleum (BP), the growth of energy demand will be largely offset by the decline in energy intensity in a gradual transformation scenario [2]. The improvement of energy efficiency can effectively reduce energy consumption and CO2 emissions. So many countries have introduced relevant policies aimed at improving energy efficiency [3,4].

1.1. Review on Impact Analysis of Energy Efficiency Improvement and Carbon Emission Reduction at National Level

At present, there are many studies on energy efficiency at the national level, mainly investigating the role of trade openness, technological innovation [5], energy construction [6] and industrial construction [7] in energy intensity. The main research methods include statistics and decomposition [8]. The analysis of influencing factors on energy intensity is mainly concentrated on the national and regional scope [9], or a specific industry and a specific sector [10,11]. S Okajima [12] uses the Fisher Ideal index decomposition method to analyze the relationship between the decreasing trend of energy intensity and the improvement of energy efficiency. J Huang [13] analyzed the impact of technological factors on energy intensity. P Petrović [14] explored the main factors influencing the energy intensity of the European Union and compared different panel data from 1995 to 2015. O Gandhi [15] studied the energy intensity changes in the state of São Paulo from 1995 to 2012 through factor decomposition and found that the impact of economic activities is gradually increasing.
In the field of carbon emission, research is also divided into regions, and industry sectors, and most of them are researched together with energy intensity [16,17]. Fredrik N. G [18] analyzed the impact of factors, such as increased production efficiency and fluctuations in oil prices on energy intensity and carbon intensity. V Moutinho [19] studied the impact of fossil fuel consumption, primary energy consumption and GDP on carbon emissions, and carried out a factor decomposition analysis of carbon emission intensity. S Gui [20] studied the factors that affect carbon emissions and analyzed the correlation between these factors through path analysis. L Cruz [21] studied the impact of structural factors and efficiency factors on energy consumption and carbon emissions in the EU-27 countries. H Kim [22] counted the energy consumption of Seoul’s urban water cycle in each stage in 2012 and 2015, and analyzed the changes in energy and carbon emissions during this stage.

1.2. Content and Contribution

In the national level of energy consumption and carbon emissions policy analysis, there is less research involved in specific equipment energy efficiency improvement policy [23]. Based on Japan’s equipment energy efficiency improvement policy, “Top Runner policy (TRP)”, this paper analyzes the effect of policy implementation, and studies the energy and environmental benefits of equipment energy efficiency improvement.
The logic of the study is shown in Figure 1. Firstly, this paper studies the energy conservation and emission reduction potential of this policy related field in Japan through factor decomposition. Then, the energy-saving effect of TRP is identified by moving window and correlation analysis. Next, the correlation between specific equipment and corresponding fields is analyzed by stages. Finally, the rebound effect of CO2 is analyzed to study the emission reduction effect of the policy.
The contributions of the study are:
(1)
The energy and environmental contribution evaluation method of equipment energy efficiency improvement policy is proposed and verified by the case study of Japan (Top Runner Policy, TRP).
(2)
The CO2 rebound effect of energy efficiency improvement of passenger cars, air conditioning and lighting equipment are analyzed, and the emission reduction effects of short-term and life cycle are compared.
(3)
It provides a theoretical reference for the energy and environmental impact analysis of equipment energy efficiency at the national level.

2. Methodology

2.1. Factor Decomposition

It is very meaningful to distinguish the influence of various factors, because in economic or other complex systems many variables are affected by multiple factors, that is, the change of variables is caused by multiple factors [24,25]. The objects of this paper are energy intensity (EI) and energy consumption CO2 emission intensity (ECCEI).
E I = E n e r g y   c o n s u p t i o n / G D P
E C C E I = C O 2   e m i s s i o n / E n e r g y   c o n s u p t i o n
This paper uses factor analysis method to analyze, which is to divide the change of variables into several parts and each factor corresponds one by one through mathematical method. Taking EI as an example, the definition formula of EI is as follows:
e t = E t G t
where e t is the EI; E t is the energy consumption during the t period; G t is the GDP in the t period.
It is decomposed as follows:
e t = E t G t = i E i t i G i t = i e i t G i t i G i t = i e i t G i t i G i t = i e i t p i t
where E i t refers the energy consumption of the i industry in the t time period; e i t refers the EI of the i industry in the t time period; G i t refers the EI of the i industry in the t time period; p i t refers the GDP ratio of the i industry in the t time period.
In the process of factor analysis, the value in a certain time period needs to be used as a comparison. If t = 0, the difference between the other time periods and their EI is:
e = e t e 0 = i e i t p i t i e i 0 p i 0

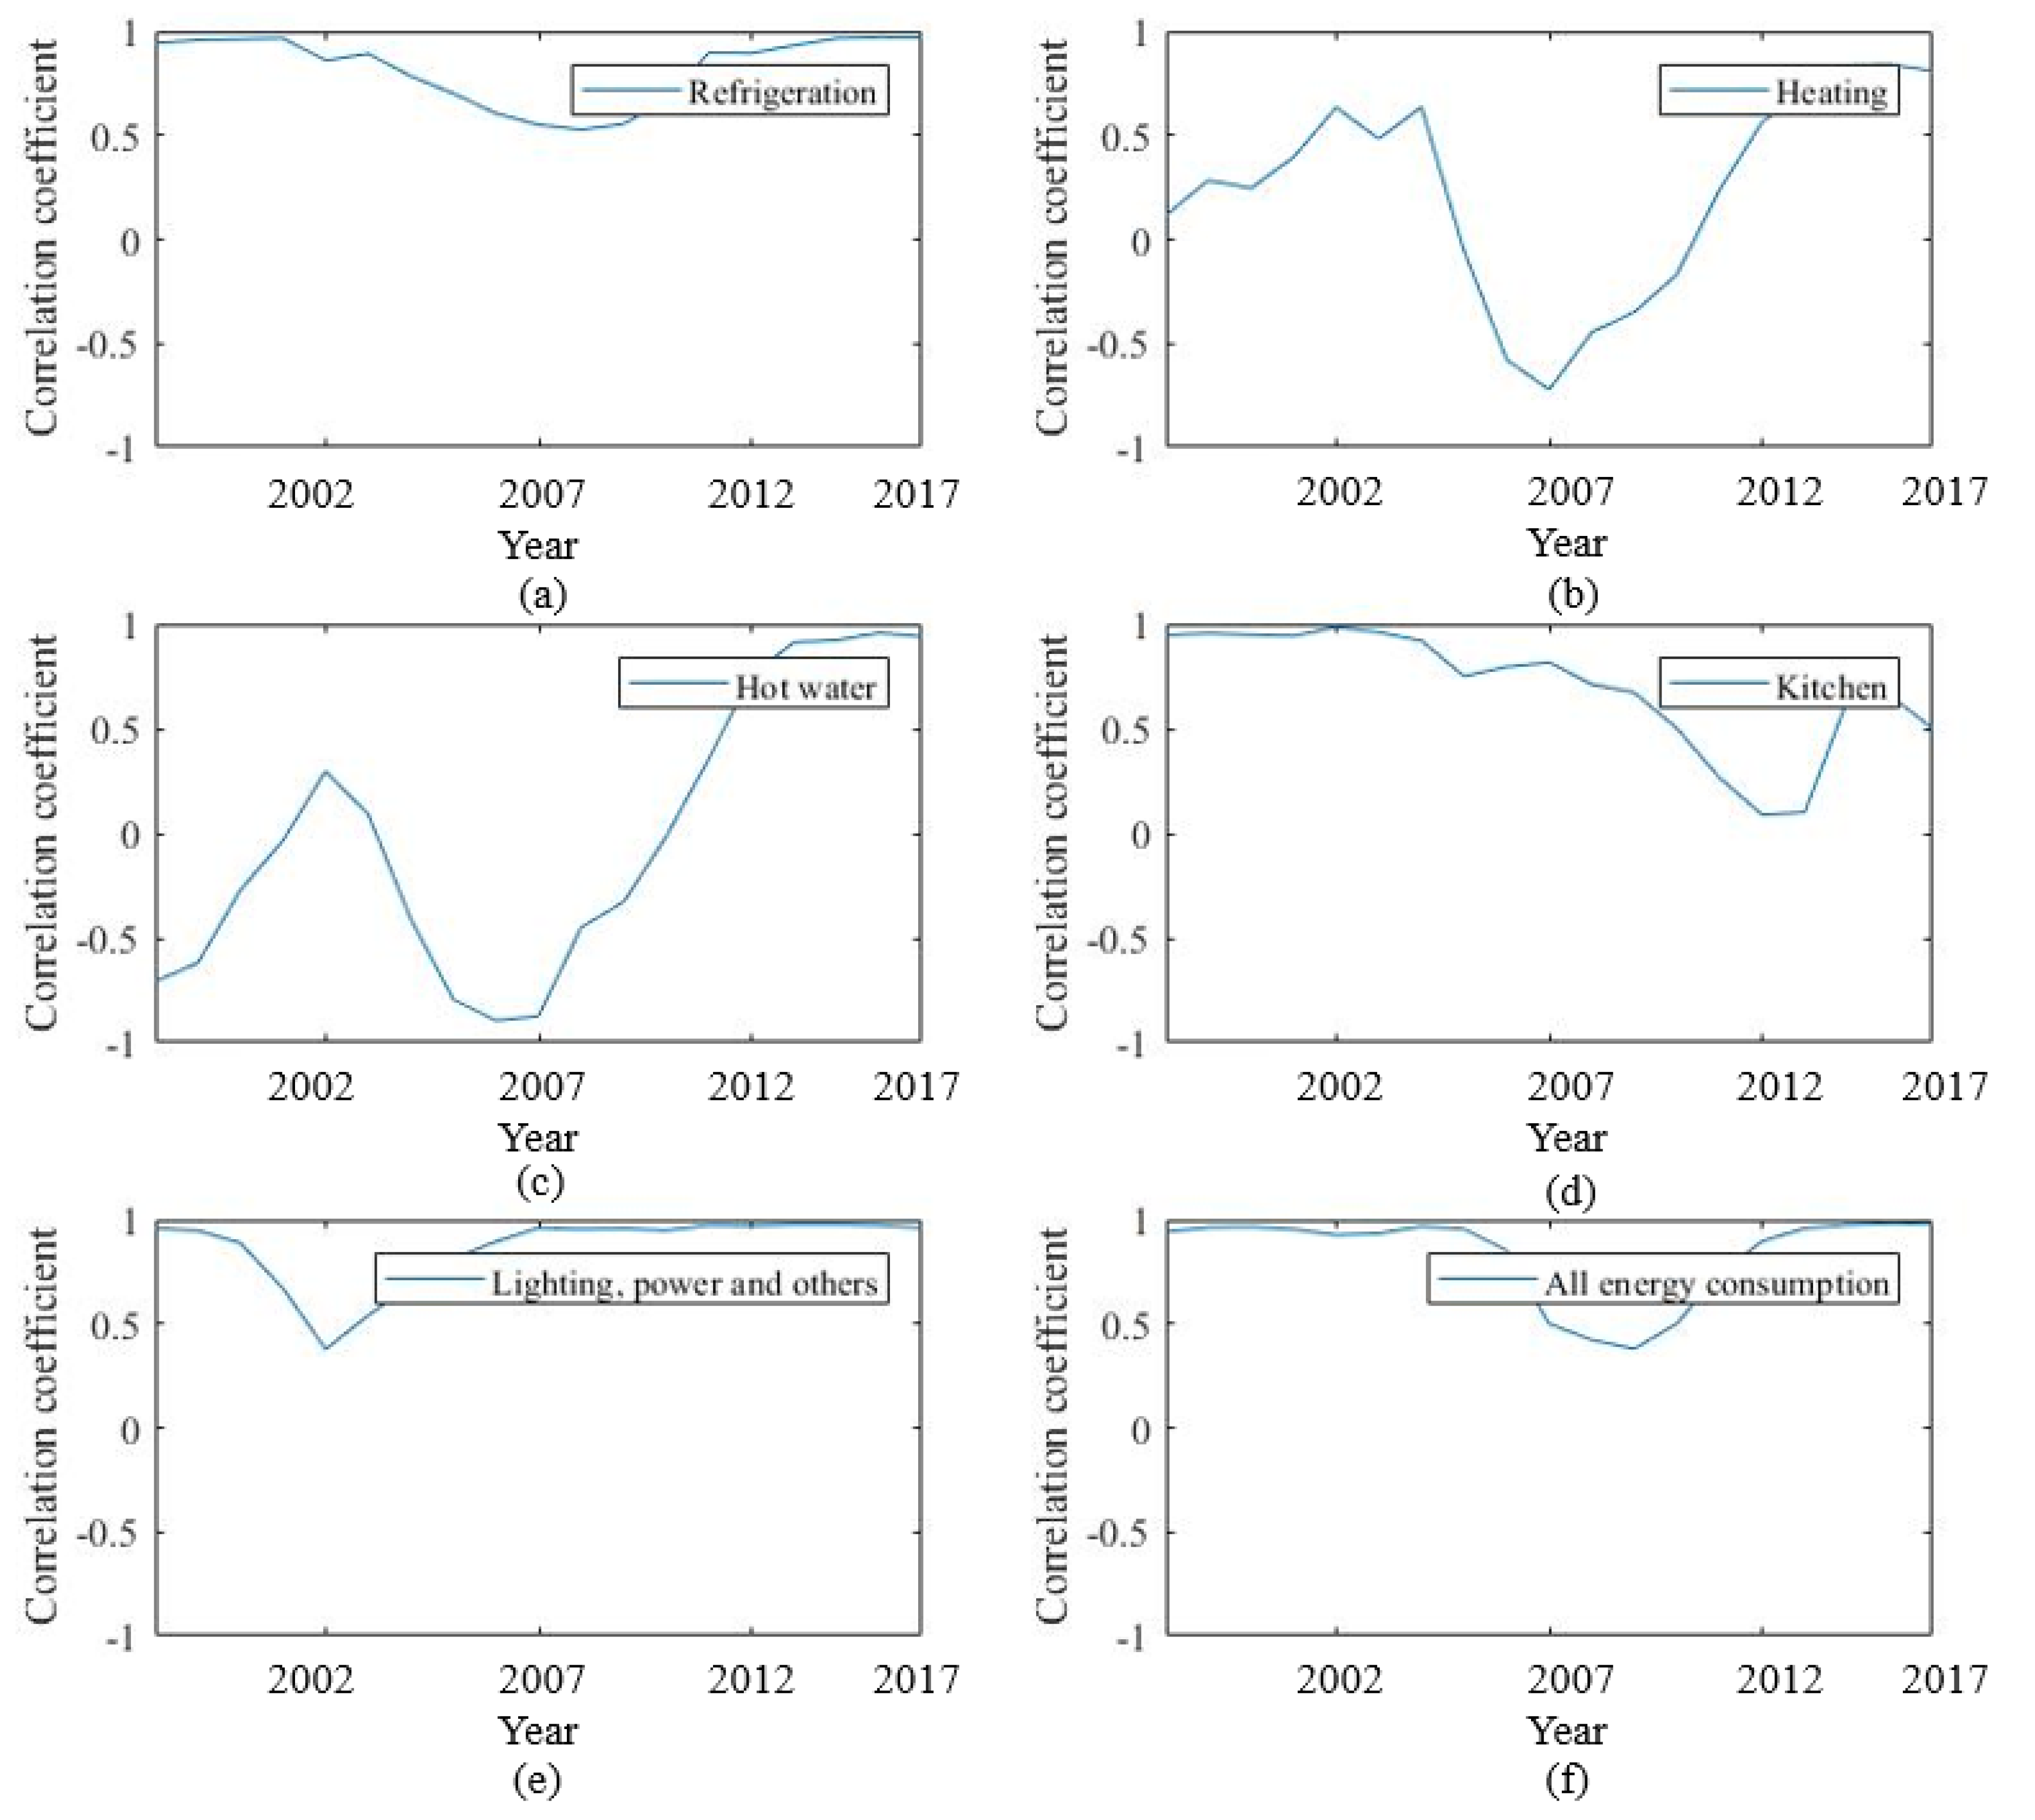
2.2. Moving Windows and Correlation Analysis

The combination of moving window and correlation analysis can effectively identify the policy and analyze the impact of policy implementation. C i t is defined as each moving window, where t is different starting time, i is different energy consumption types (refrigeration, heating, domestic hot water, lighting, etc.), and the size of each moving window is s [26].
The main method of correlation analysis is to draw correlation charts and calculate correlation coefficients [27]. There are three kinds of correlation coefficients that are often used, and among them, Pearson correlation coefficient is a measure of the degree of linear correlation, which is also commonly used at present [28]. In this paper, Pearson correlation coefficient will be calculated and analyzed by MATLAB.
Pearson’s correlation coefficient is one of the important indicators to analyze the degree of correlation between variables, and it has been widely used in various fields.
ρ X , Y = c o v ( X , Y ) σ X σ Y = E ( ( X μ X ) ( Y μ Y ) ) σ X σ Y = E ( X Y ) E ( X ) E ( Y ) E ( X 2 ) E 2 ( X ) E ( Y 2 ) E 2 ( Y )
The formula is defined as: The Pearson correlation coefficient (Px, y) of two continuous variables (X, Y) is equal to the covariance cov (X, Y) between them divided by the product of their respective standard deviations ( σ X , σ Y ) . Coefficients are always between −1.0 and 1.0. Variables close to 0 are called uncorrelated, and those close to 1 or −1 are called strongly correlated. Usually, the correlation intensity of variables is judged by the following range of values: (1) very strong correlation: 0.8–1.0; (2) strong correlation: 0.6–0.8; (3) moderate correlation: 0.4–0.6; (4) weak correlation: 0.2–0.4; (5) very weak correlation or no correlation: 0.0–0.2 [29].

2.3. Life Cycle Rebound Effect

The use of high-efficiency energy technology can enable consumers to obtain the same amount of services with lower money expenditure, reduce the financial pressure of consumers, and may consume more energy. This phenomenon is called the “direct rebound effect” [30].
In this paper, the rebound effect of the carbon footprint (REC) is used to calculate the rebound effect. REC is defined as:
R E C = ( C 0 C 1 ) ( C 1 C 1 ) ( C 0 C 1 ) × 100 %
where C 0 is the carbon footprint without energy efficiency improvement; C 1 is the carbon footprint with energy efficiency improvement; C 1 is the actual carbon footprint.

3. Research Objects and Analysis

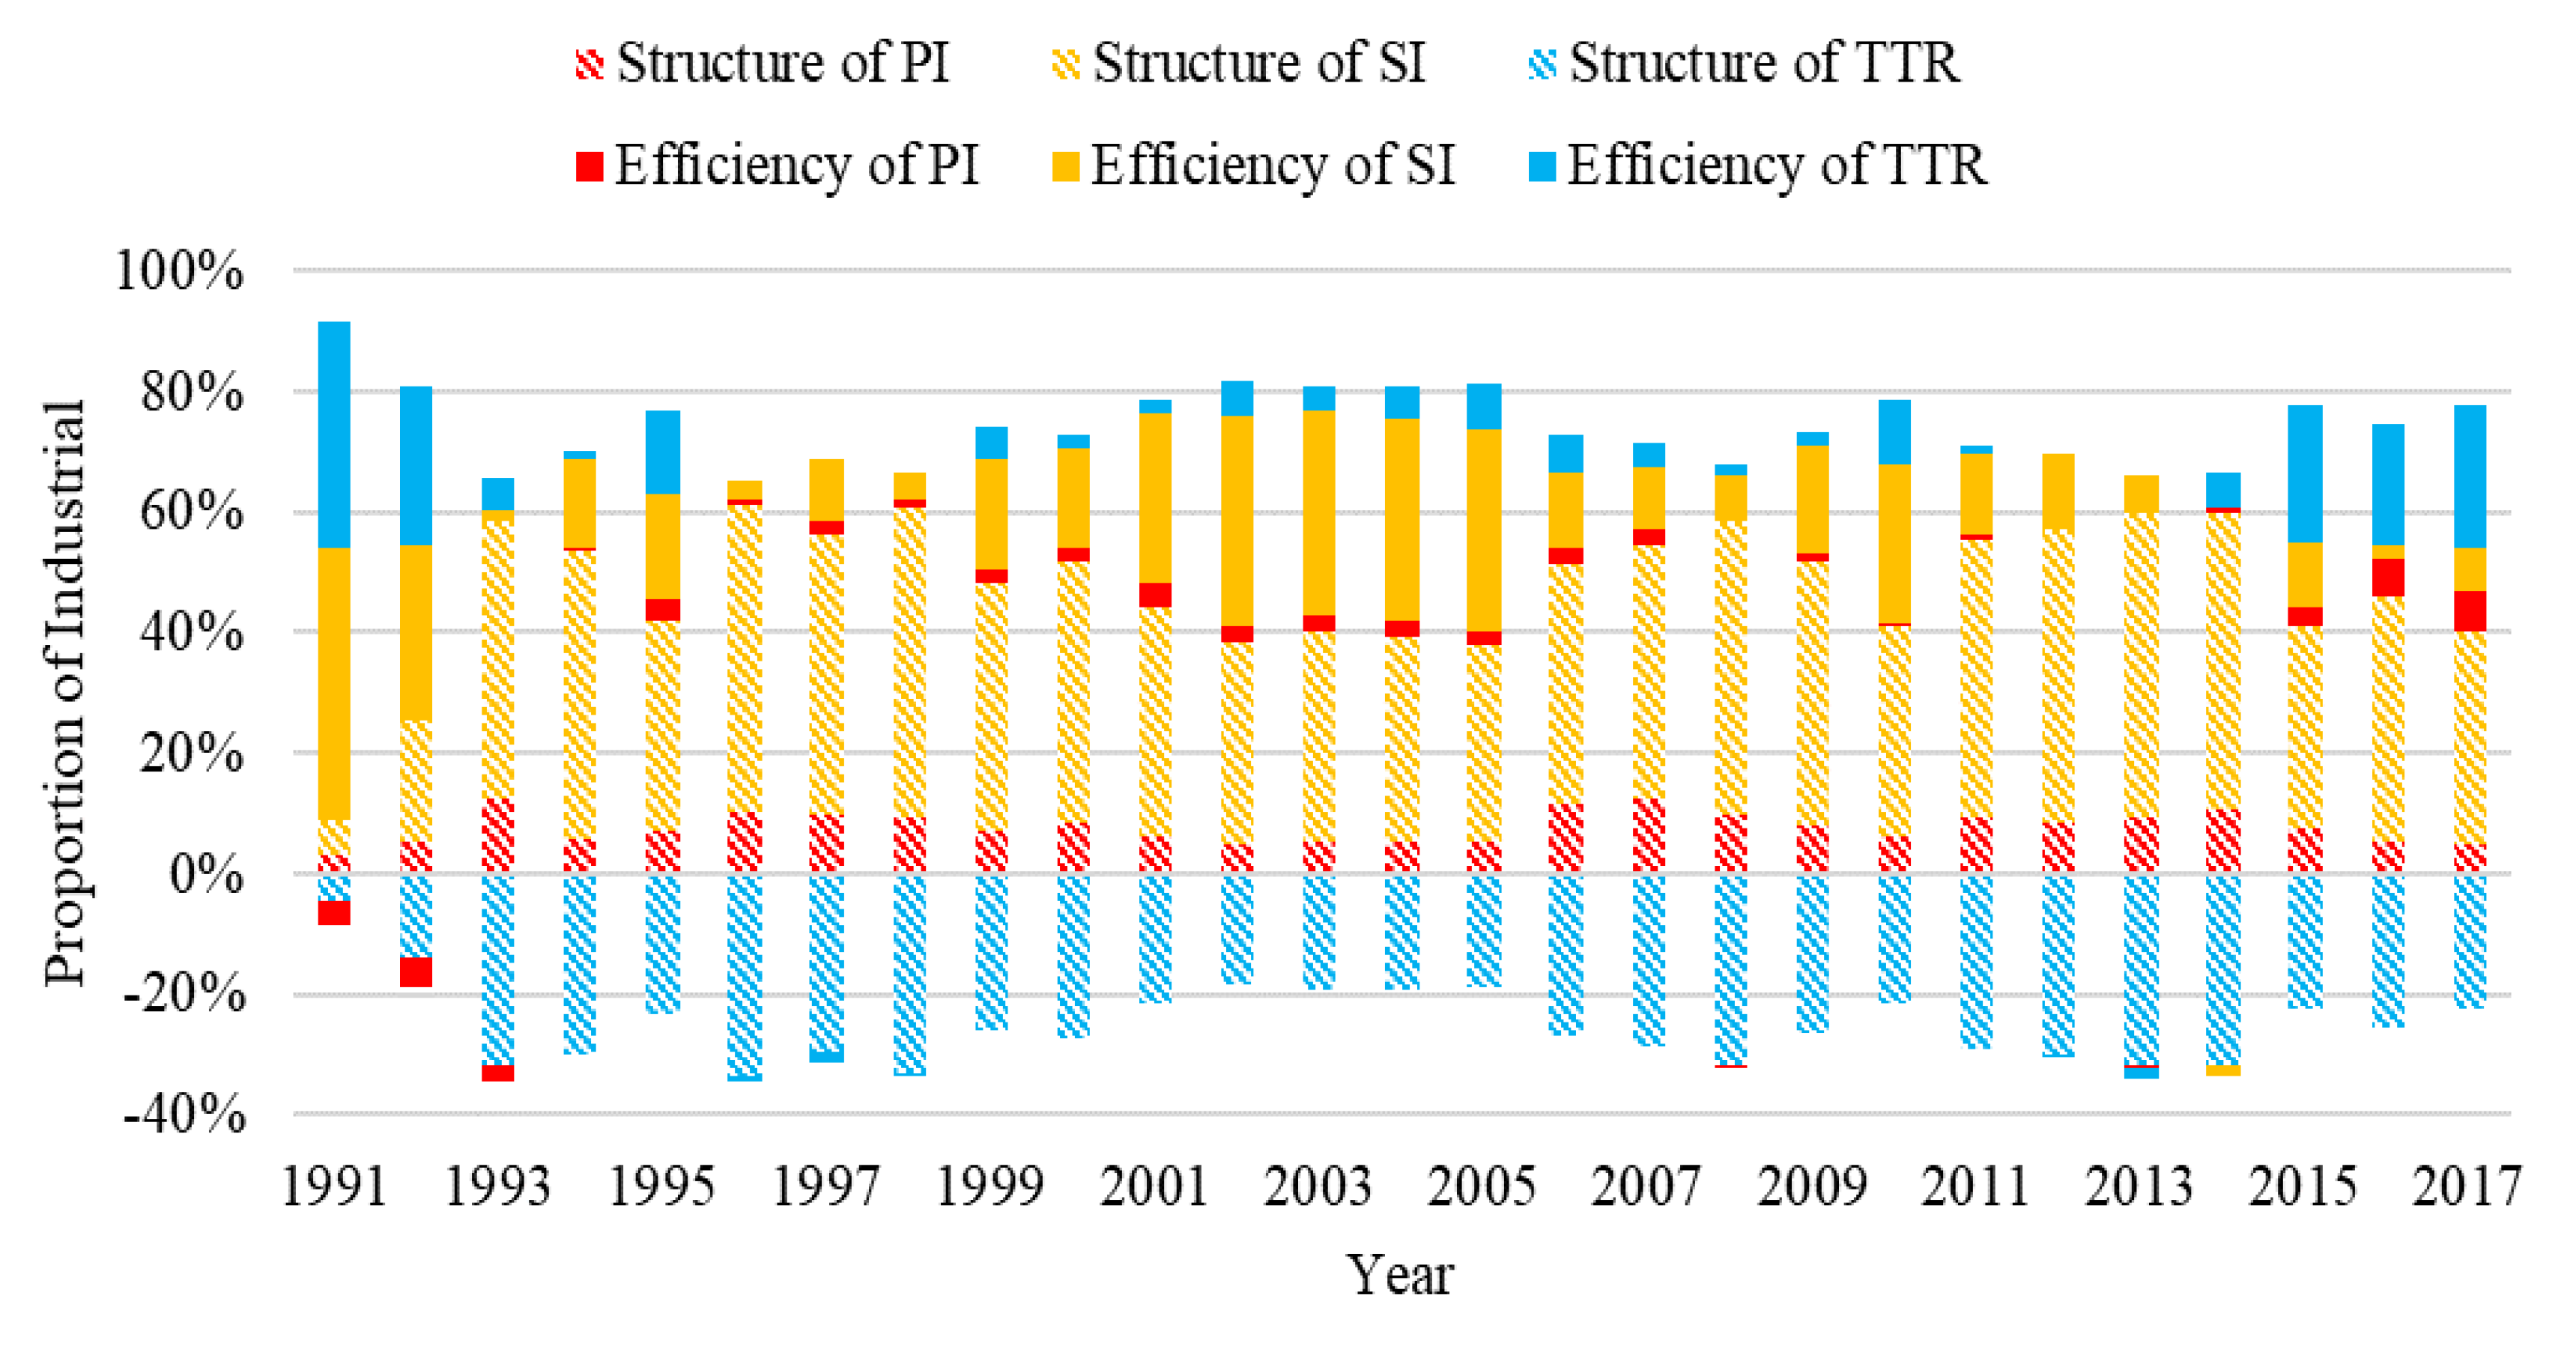
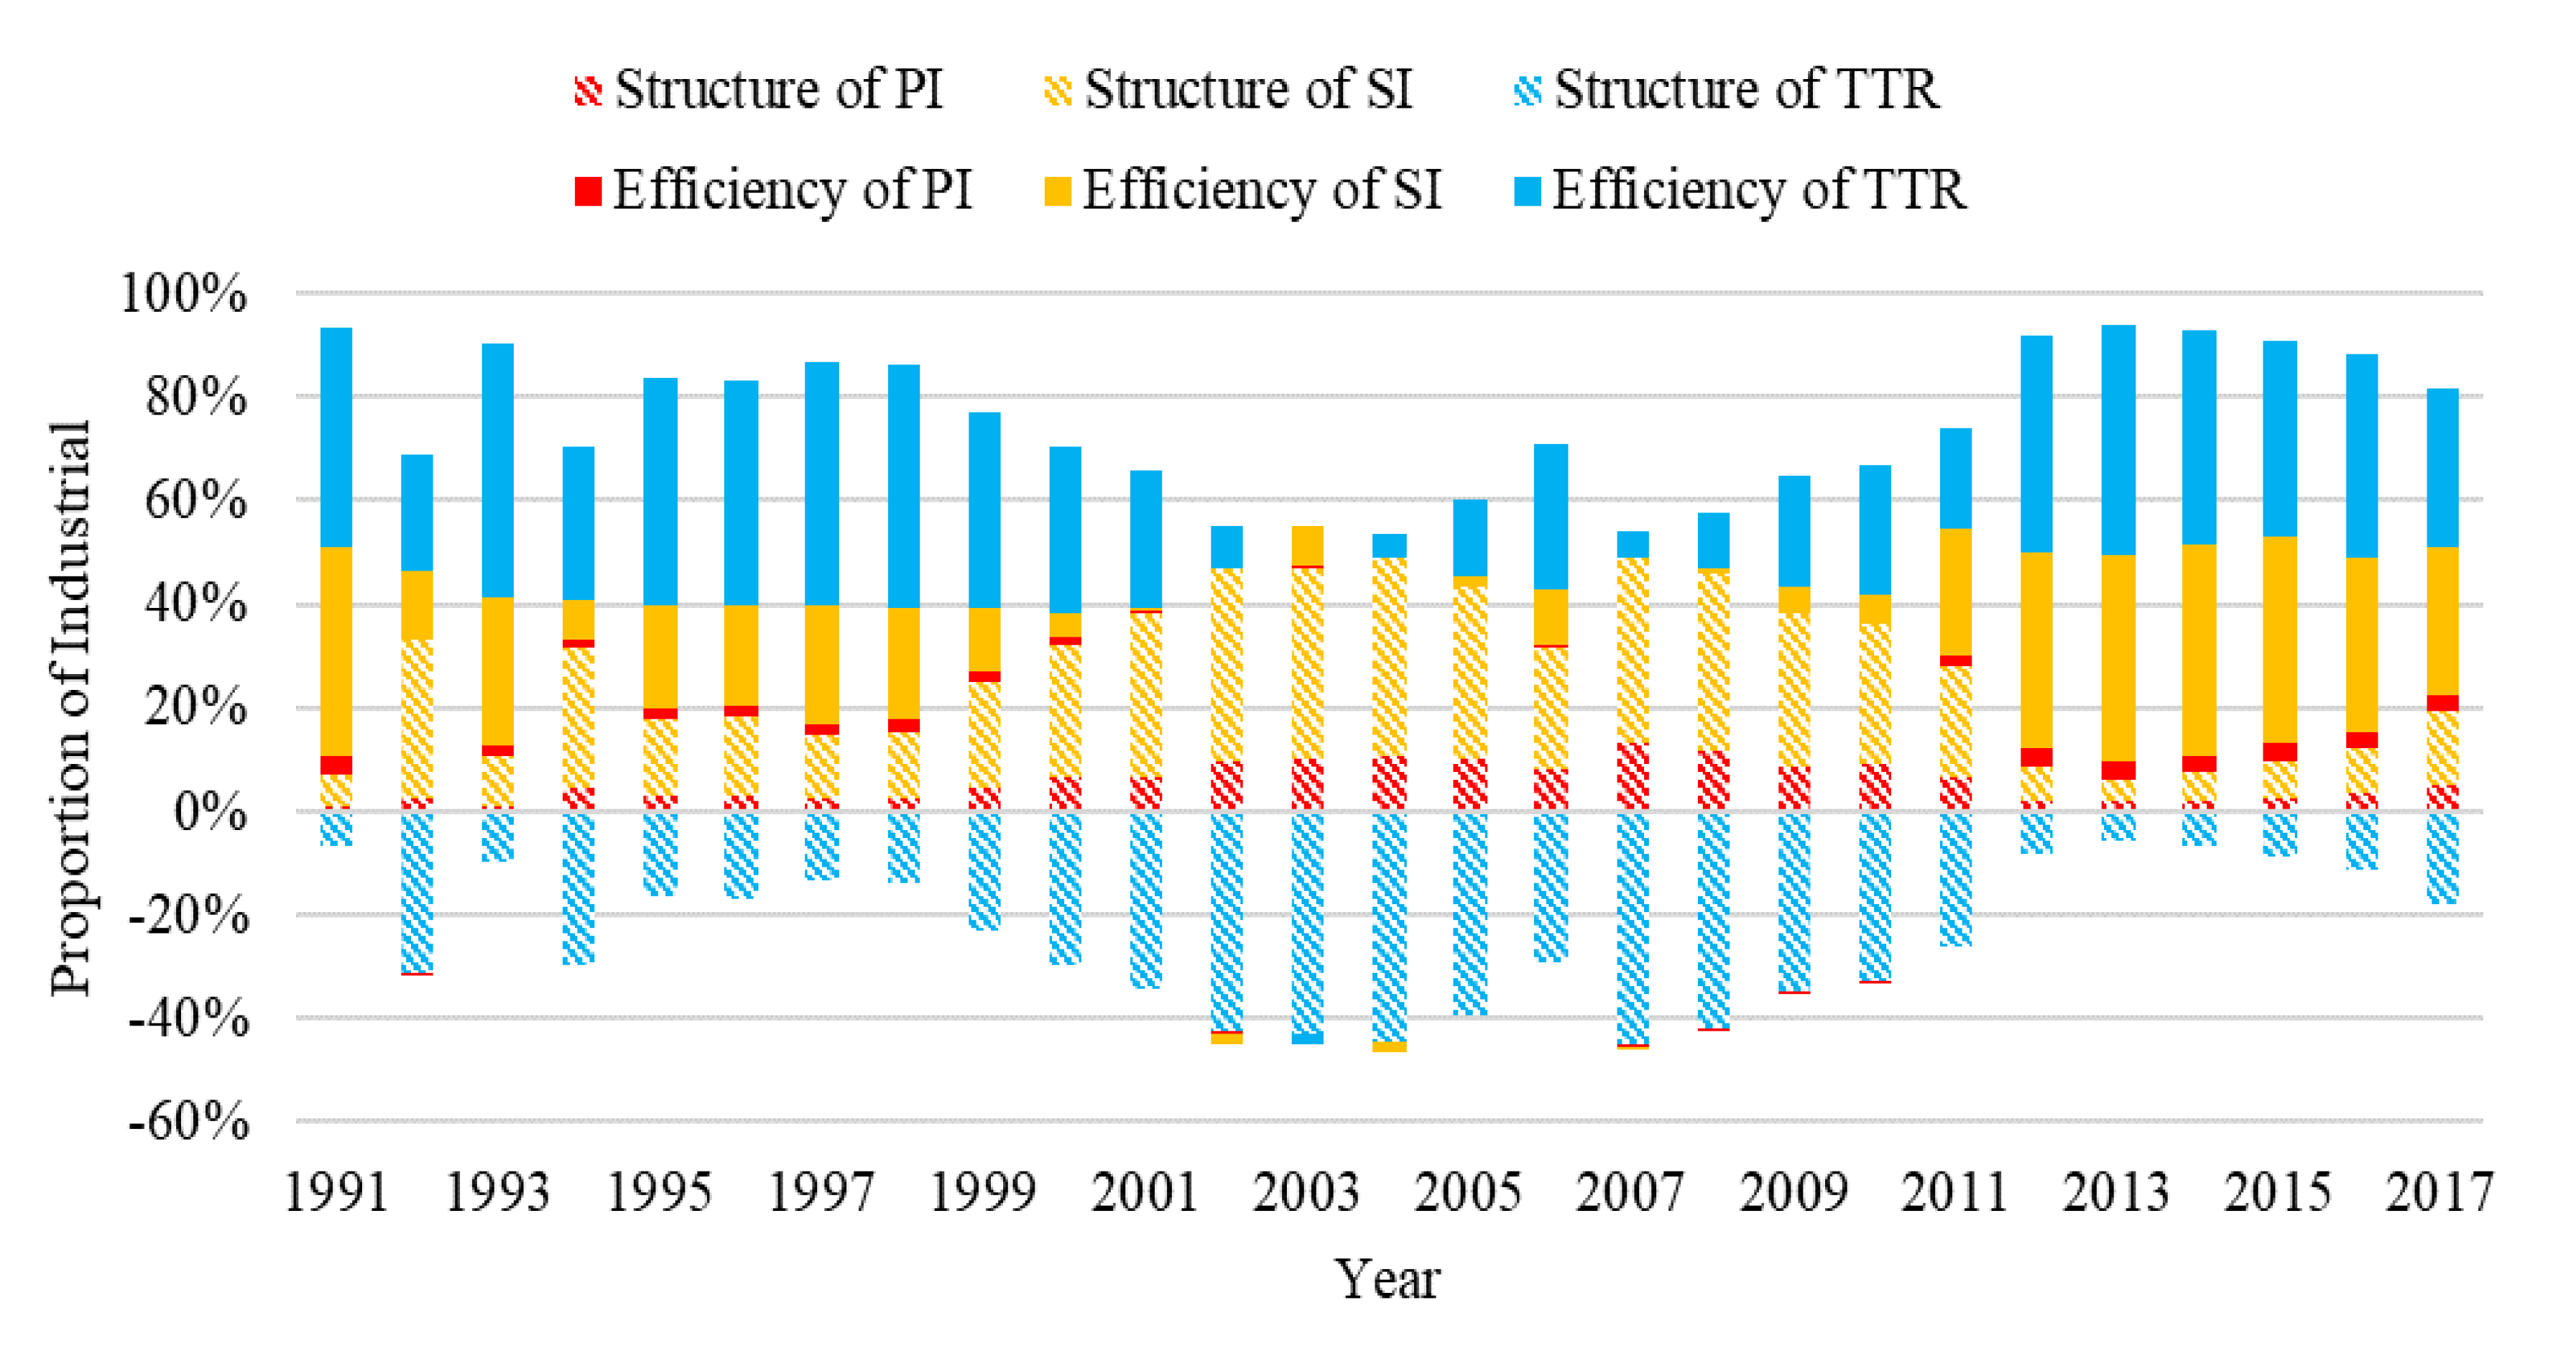
3.1. Factor Decomposition of Energy Saving and Emission Reduction Potential

Firstly, through the factor decomposition of EI and ECCEI, the potential of energy conservation and emission reduction in different fields is analyzed. According to the national economic statistics of the Cabinet Office of Japan, the 1990–2017 GDP of different industries is obtained [31]. According to the comprehensive energy statistics of the Ministry of Economy, Trade and Industry of Japan, the energy consumption and carbon emissions of different industries from 1990 to 2017 are sorted out [32].
In addition to the primary and secondary industries (PI and SI), energy consumption and carbon emissions of the tertiary industry, transportation and residential are highly correlated. At the same time, the calculation standard of GDP in the field of residential is different from that in other fields, and the energy consumption generated by residential will increase the GDP of the tertiary industry through payment. Residents’ consumption can drive the increase in the GDP and energy consumption of the tertiary industry, and the increase in GDP through the tertiary industry will be returned to the residents in the form of wages. At the same time, the increase in the GDP of the tertiary industry and residents represents an increase in demand for transportation, which drives the growth of GDP and energy consumption in the transportation sector. Therefore, the energy consumption and carbon emissions of the tertiary industry, transportation and residential (TTR) are combined to analyze the factors. Figure 2 and Figure 3 show the factor decomposition results of EI and energy consumption CO2 emission intensity ECCEI. The structure and efficiency in Figure 2 and Figure 3 are the structure factor and efficiency factor in the factor decomposition model. The structure factor represents the increase in the overall structure, and the efficiency factor represents the increase in energy utilization efficiency, that is, the decrease in unit energy consumption. Therefore, when the structure factor is negatively correlated with EI and ECCEI, it means that the increase of the structure ratio has led to the decrease of EI and ECCEI, which has a positive effect. When the efficiency factor is positively correlated with EI and ECCEI, it means that the decrease in unit energy consumption has led to the decrease in EI and ECCEI, which has a positive effect.
In the aspect of energy saving, the structure change of SI and TTR has obvious influence. The decrease of SI proportion and the increase of TTR will cause the decrease of overall EI. In terms of emission reduction, the structure change and efficiency change of TTR have obvious influence. The increase of TTR proportion and the decrease of ECCEI will cause the decrease of ECCEI.
It can be seen that both the increase in the proportion of TTR and the improvement of its own energy and environment have a significant impact on Japan’s overall energy consumption and carbon reduction. This shows that TTR is the core of the field of energy conservation and environmental protection in Japan. Therefore, Japan has launched a series of energy conservation and environmental protection laws to promote the energy efficiency and environmental protection of TTR. In addition to similar policies in other countries, such as construction, residential energy consumption and promotion of distributed energy system, Japan has also launched equipment energy efficiency improvement policy (Top Runner policy, TRP) to promote the improvement of equipment energy utilization efficiency through equipment assessment. This study will make a detailed analysis on the implementation effect of this policy.

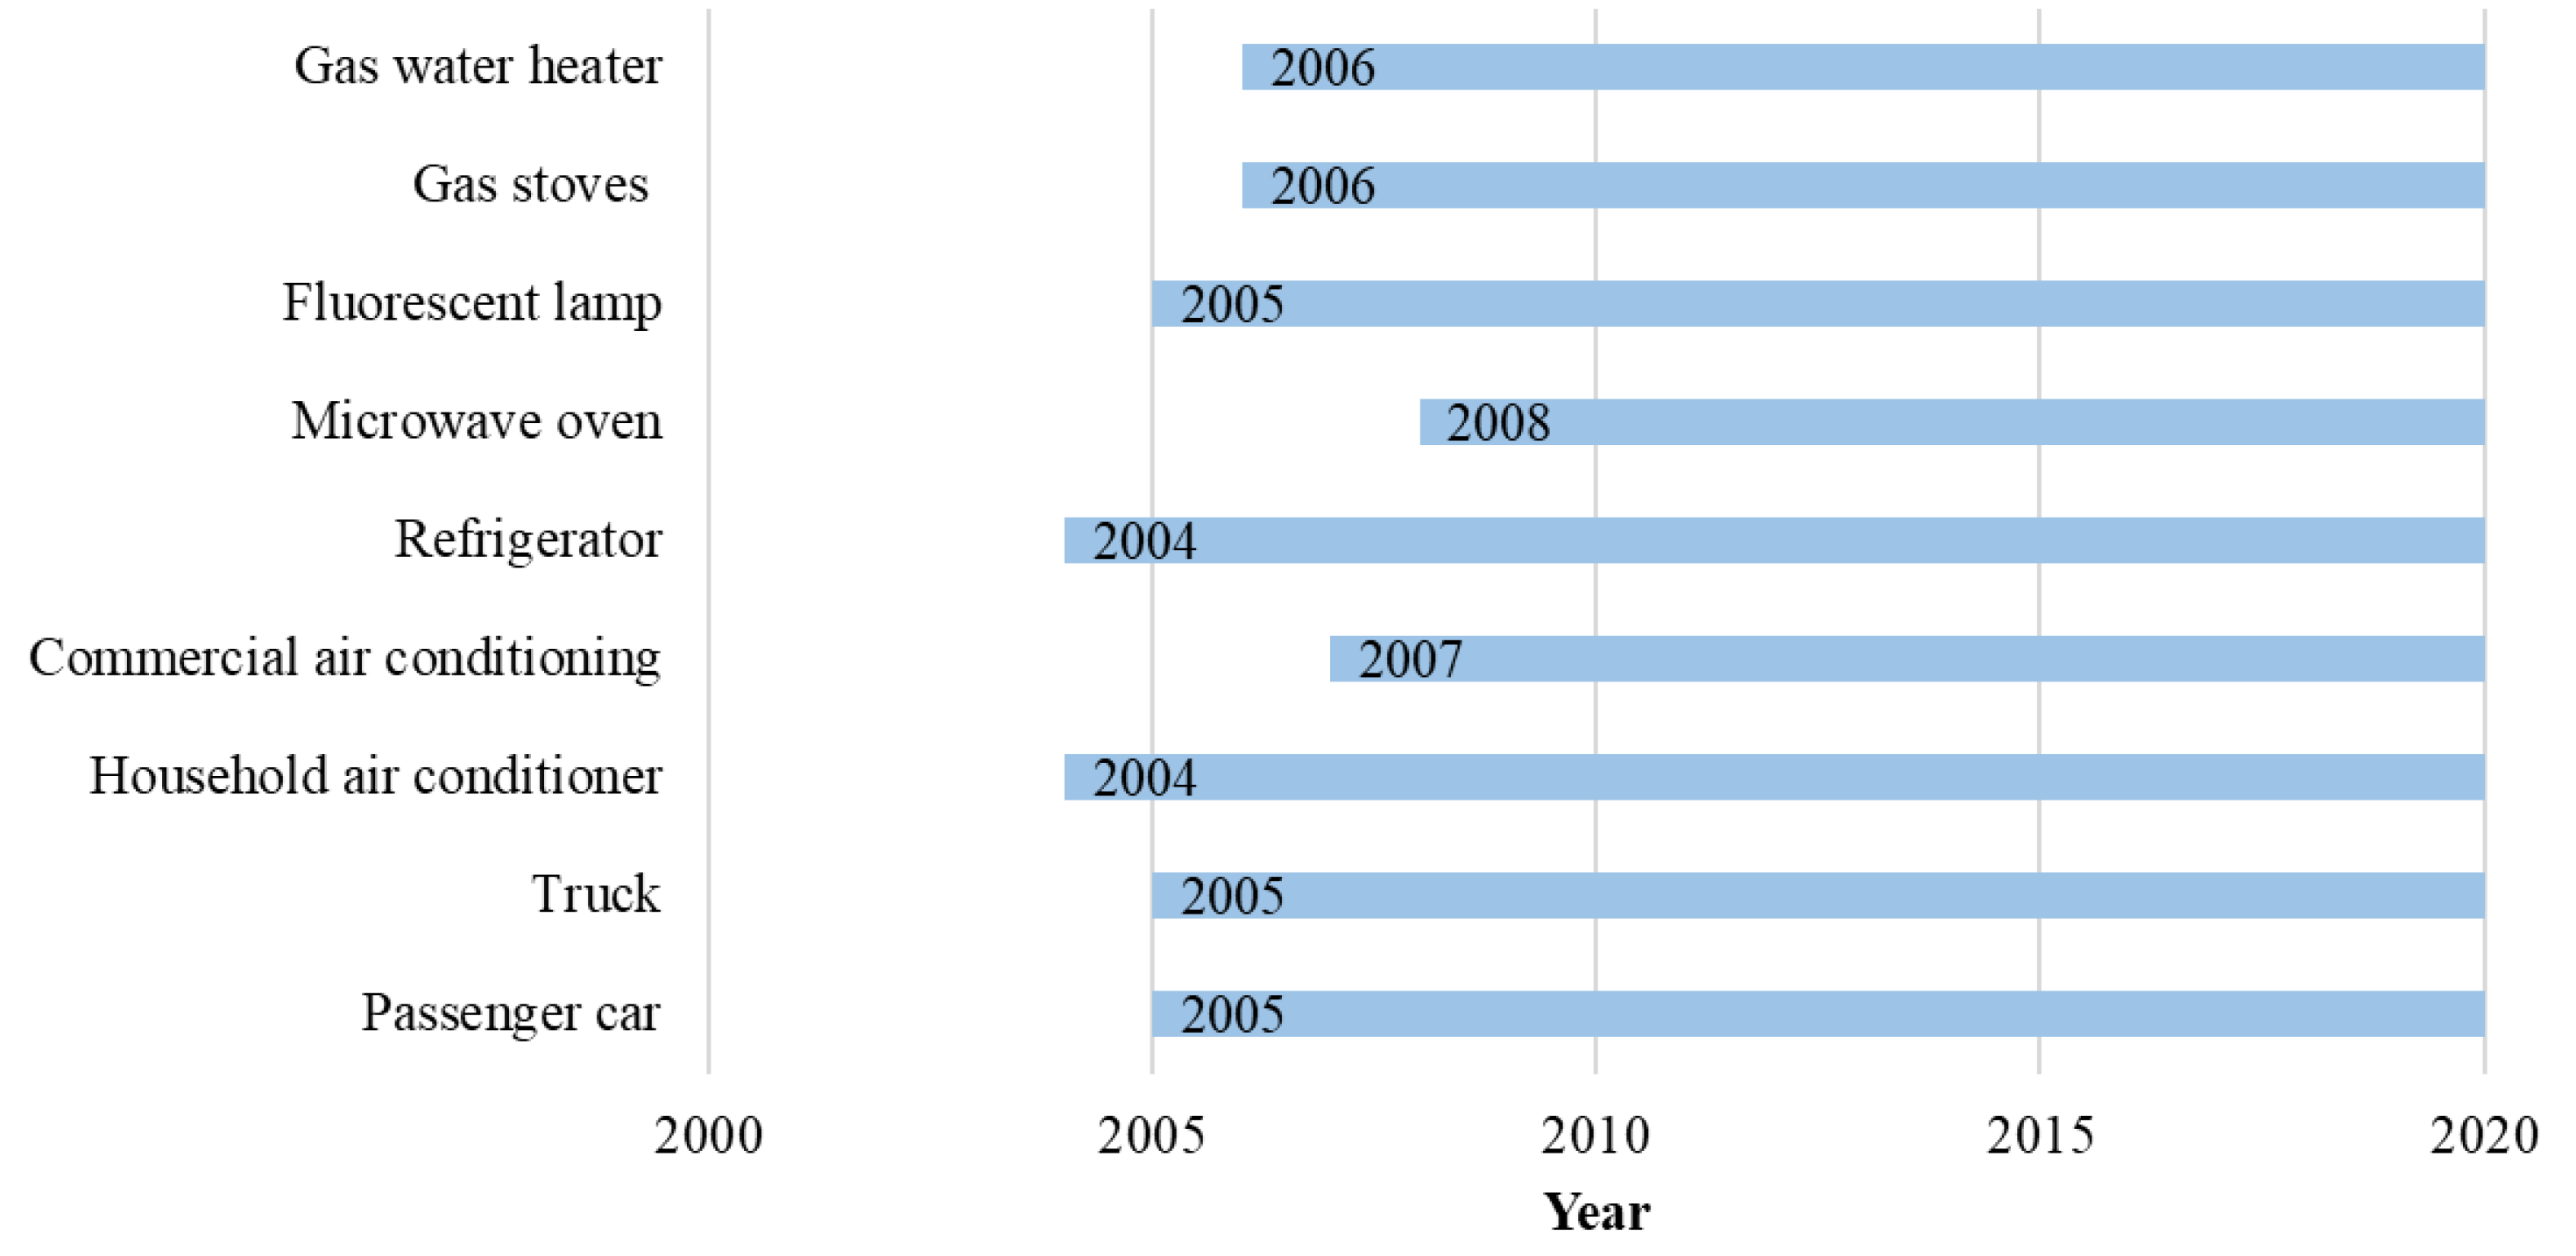
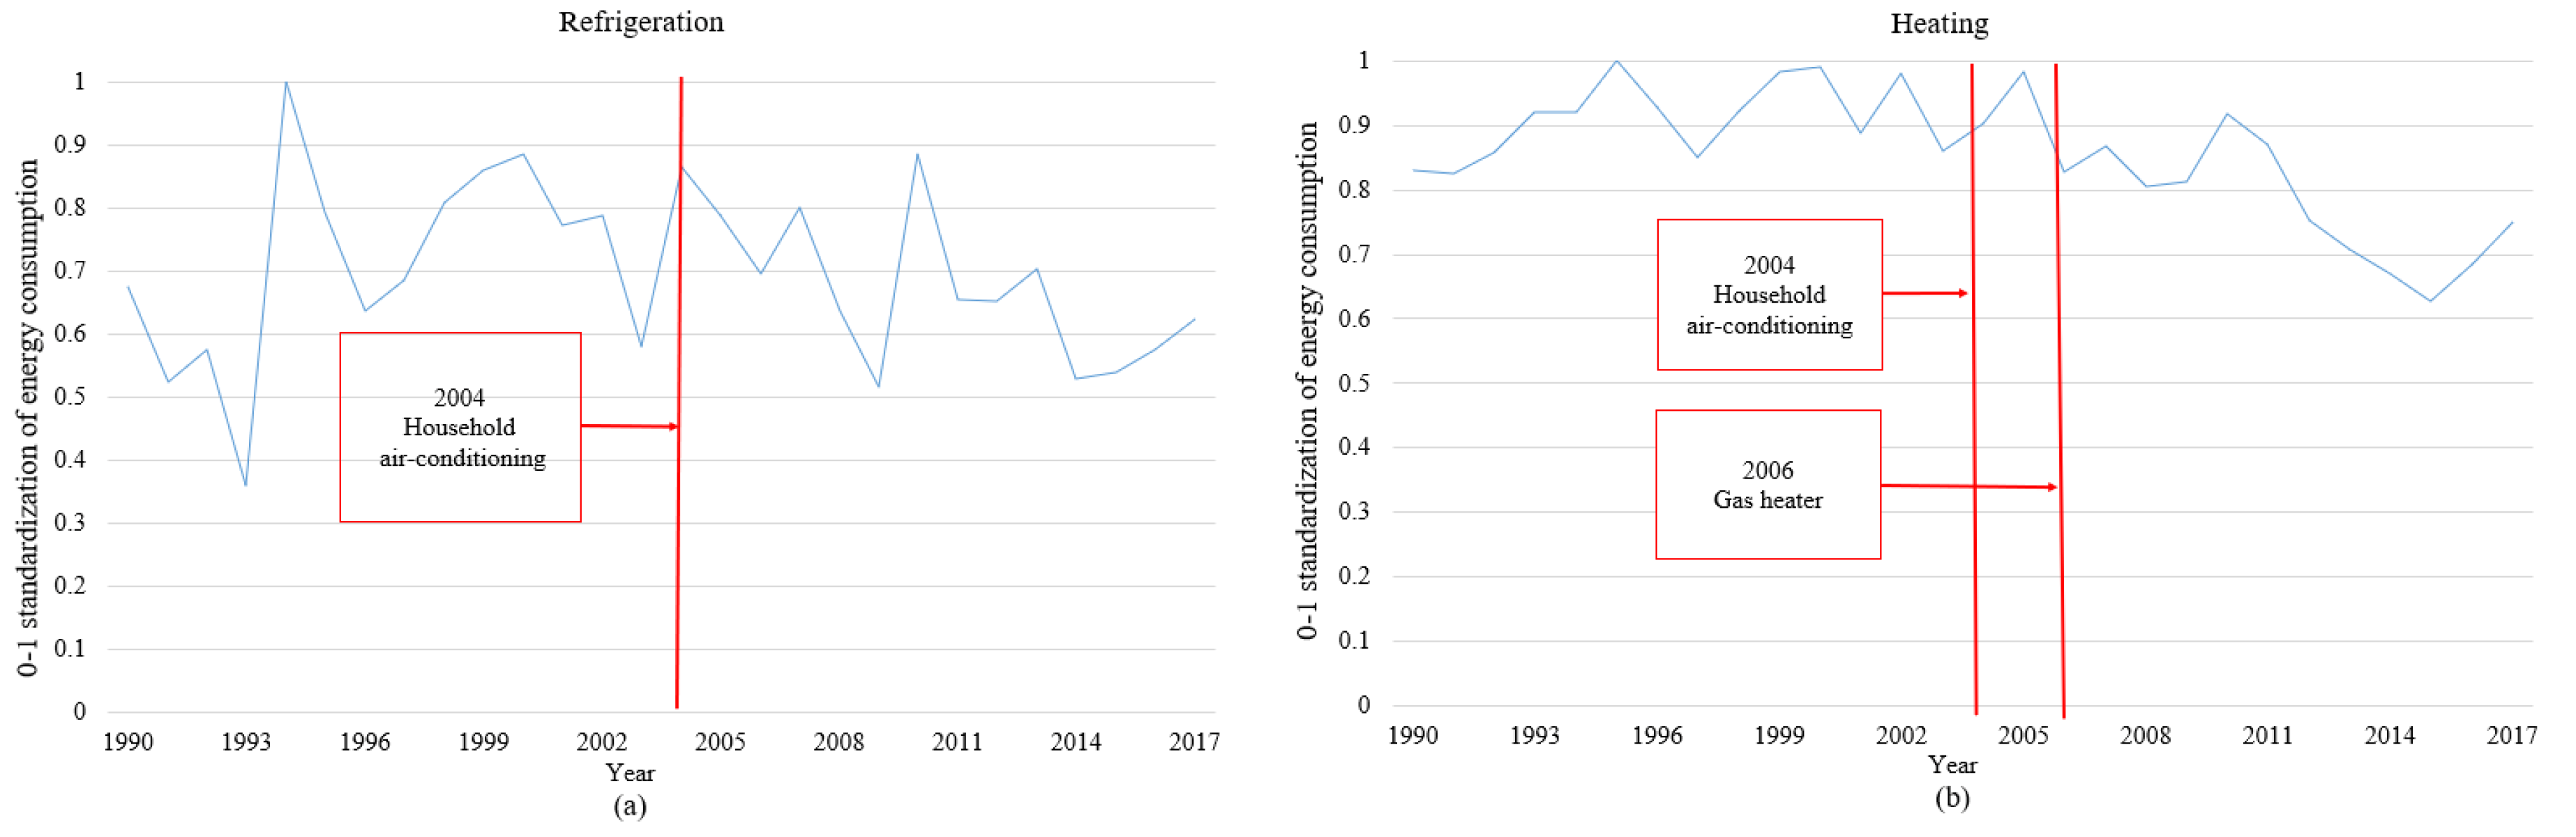
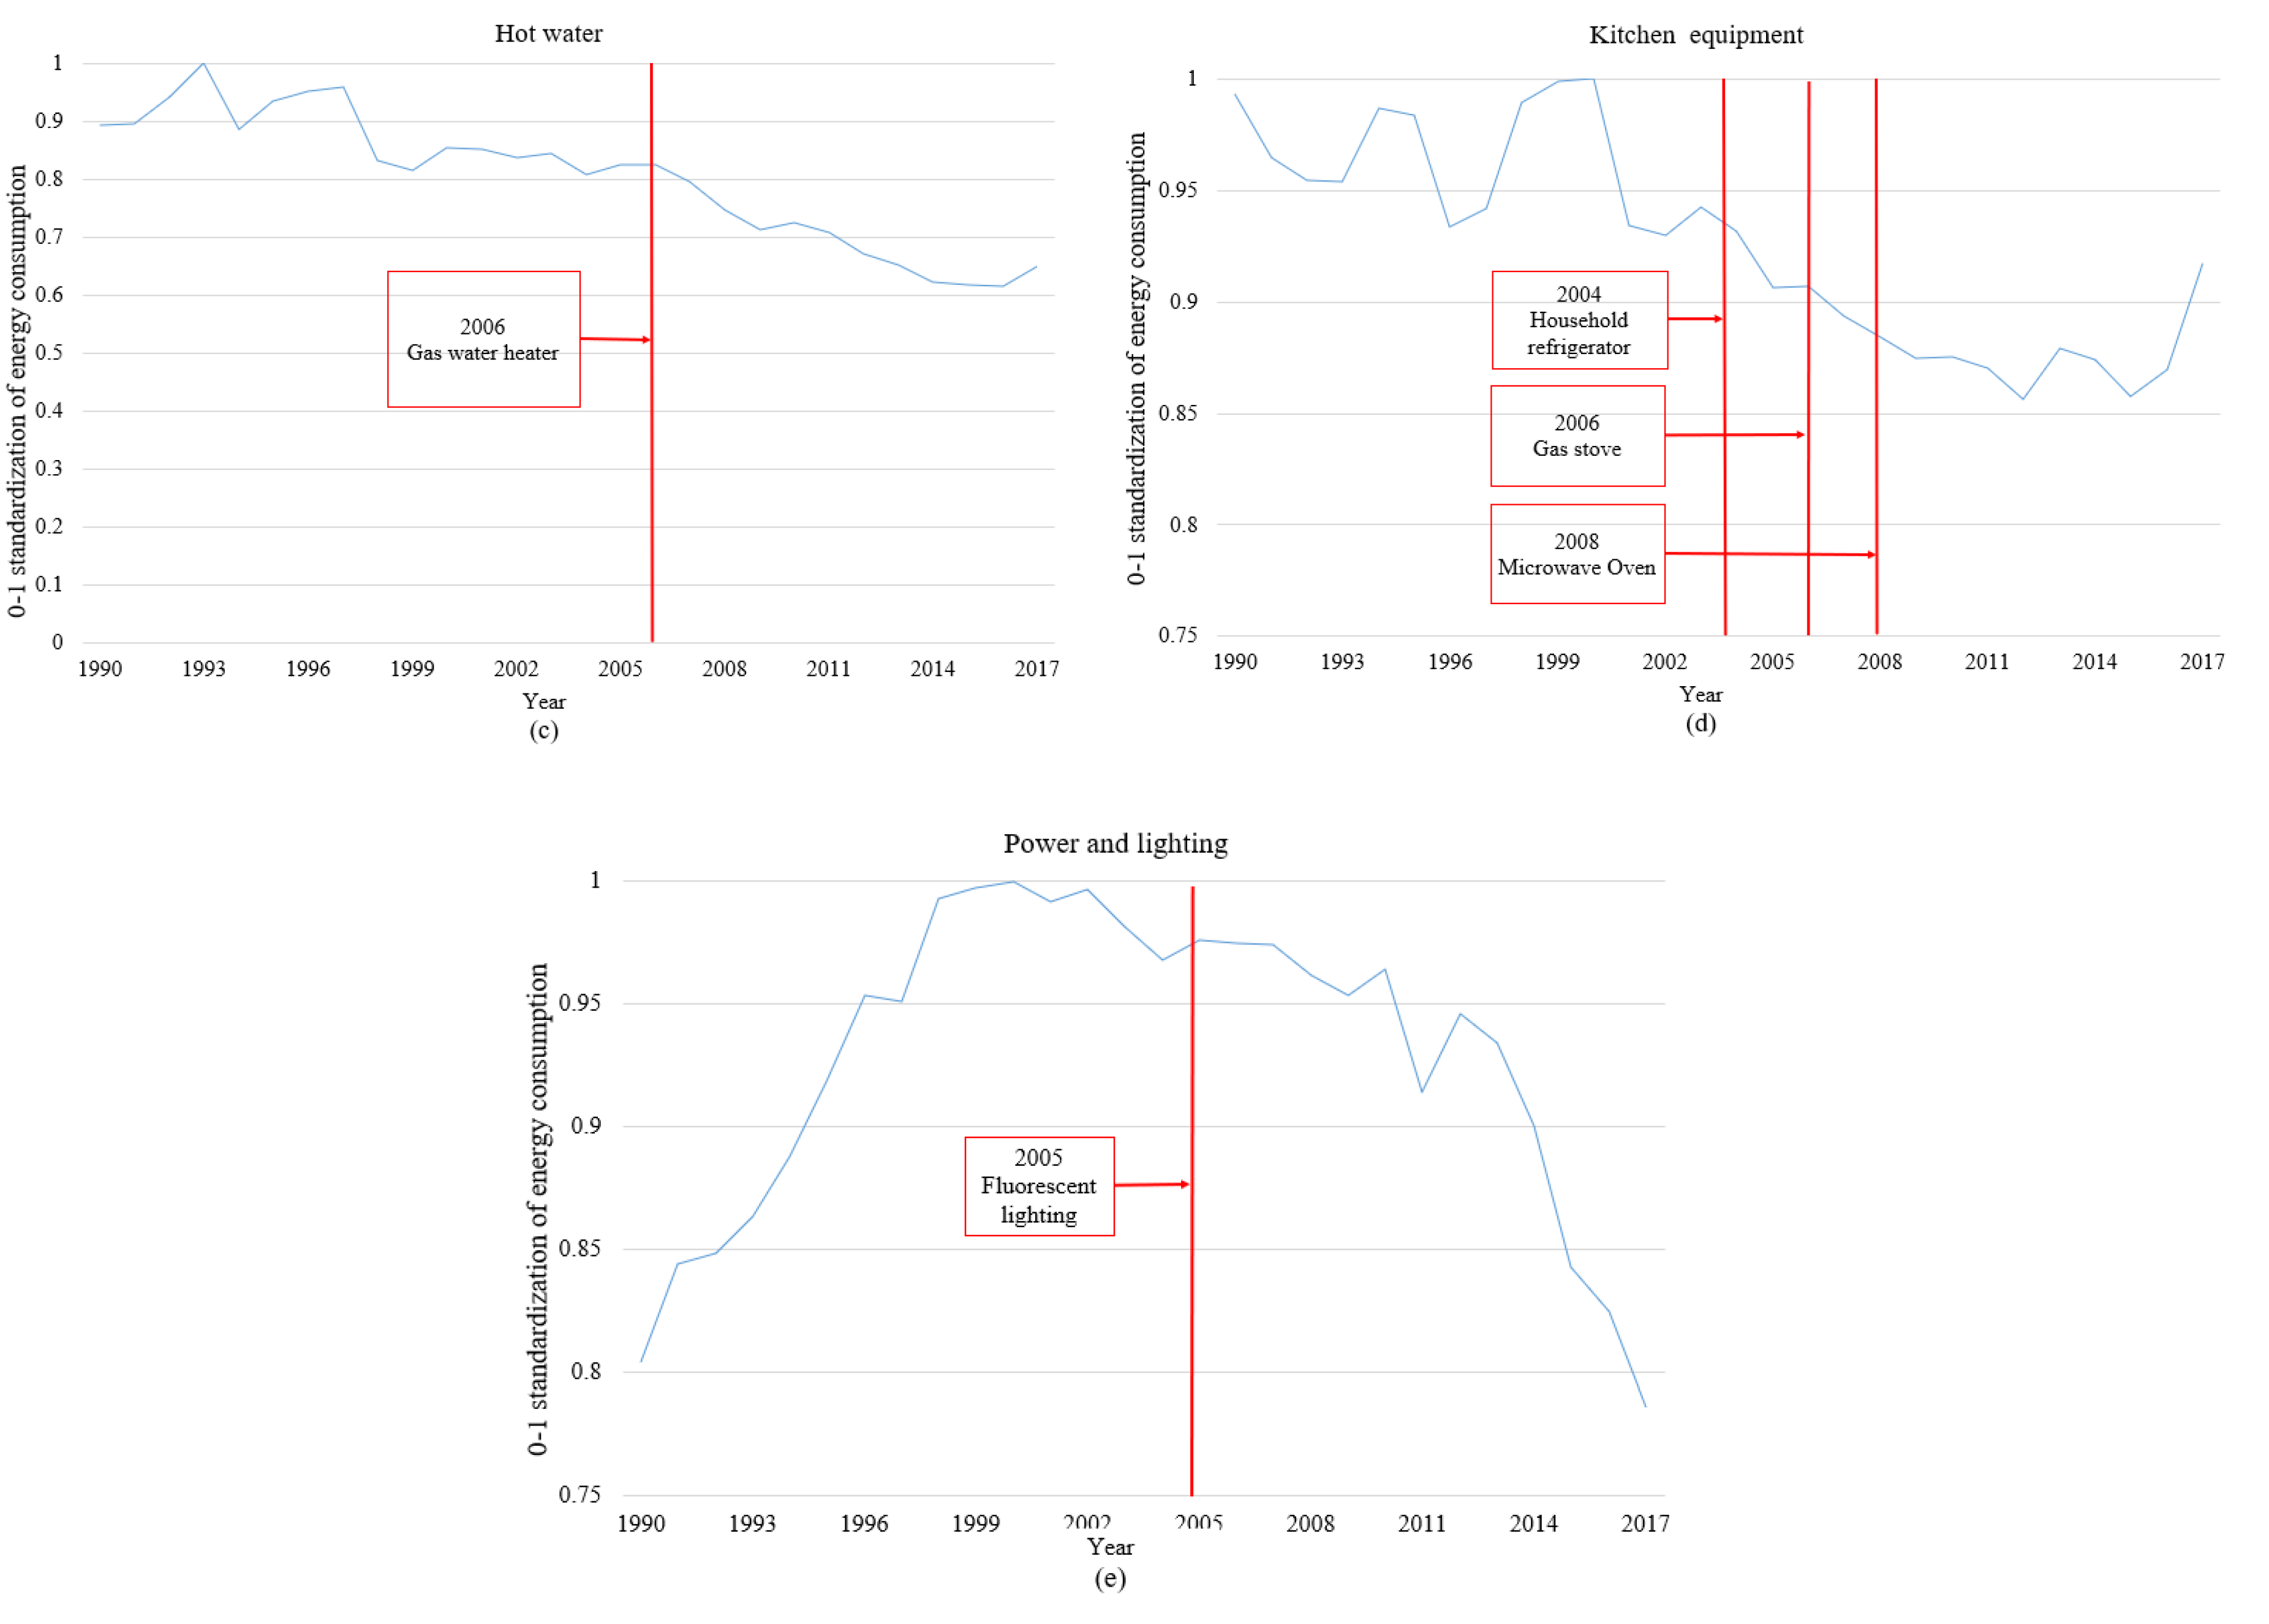
3.2. Identification of Top Runner Policy (TRP) and Analysis of Its Influence Lag

3.2.1. Overview of TRP

The TRP, combined with the energy consumption statistics of the initial assessment year of the equipment and the energy efficiency decline in the past few years, sets the energy efficiency decline target within the next 5 to 10. The targets of the policy are various energy equipment for the TTR, including passenger cars, trucks, household air conditioners, business air conditioners, fluorescent lighting, etc. Figure 4 shows the starting time of the assessment of different equipment.
Most of the equipment energy efficiency assessment started from 2004–2005. From the statistical report of the system, most of the equipment has completed or exceeded the energy-saving target, and the energy efficiency of the equipment has been improved [33]. However, this efficiency improvement requires an in-depth analysis of the specific energy and environmental improvement in various fields of TTR.

3.2.2. Policy Identification and Impact Lag Analysis

(1) Policy effect identification in different energy consumption types
Through the statistical data of Japan’s Ministry of resources and energy, the Institute of Energy Economics, the Ministry of General Affairs and other government departments, different types of energy in TTR are obtained. The tertiary industry and residential are divided into six aspects, including: (1) Refrigeration; (2) heating; (3) hot water; (4) kitchen; (5) lighting, power and others; (6) all energy consumption. Transportation is divided into tourism and freight. Since the new statistical method used in 1990 is obviously different from the data before 1989, different energy consumption data from 1990 to 2017 are used for analysis. The energy consumption data for the three areas of TTR as the basis of analysis are shown in Figure 5.
In order to avoid the uncertainty of the correlation coefficient obtained by moving the window, it is necessary to expand the window size as much as possible [34]. Although the extended window cannot analyze the fast fluctuation, it can make the recognition effect more obvious. Considering that the implementation of the TRP is divided into different stages according to 5 to 10 years, the size of the window here is set as 10 years. The total energy consumption and different types of unit energy consumption of TTR are divided into moving windows. Then, the policy is identified by correlation analysis. Then, the policy identification results are shown in Figure 6, Figure A1 and Figure A2. (Take the tertiary industry as an example to explain)
Taking tertiary industry as an example to explain, except for domestic hot water, other energy types showed strong positive correlation with tertiary industry at the beginning. Then all types of energy fluctuate in the direction of negative correlation, which is due to the different beginning time of energy efficiency improvement. Finally, for all types of energy efficiency have entered the stage of improvement, the overall energy consumption of the tertiary industry also began to decline, and the correlation returned to a strong positive correlation. Among them, the correlation between refrigeration and the overall unit energy consumption change trend is the most similar, indicating that the effect of energy efficiency improvement in refrigeration is the most obvious. At the same time, the overall unit energy consumption correlation fluctuated in 2005, which is completely consistent with the implementation time of the policy, indicating that the effect of the policy on energy consumption reduction is very obvious.
Compared with the situation in Figure A1 and Figure A2, it can be seen that the energy efficiency improvement research in transportation and housing has been paid attention to at an earlier stage [32], and the energy consumption has decreased before the promotion of the policy. Therefore, although there are obvious correlation changes, but the time volatility is large. Only tourism, household refrigeration, lighting and power are consistent with the implementation time of the policy.
(2) The independence and hysteresis of policy analysis
Although the policy identification shows that the policy has an obvious effect on the reduction of energy consumption, the identification effect is not ideal in some energy consumption types which started earlier. Therefore, through the comparison of different types of unit energy consumption and the corresponding policy promotion time, this paper studies the impact of policies on energy consumption decline rate and the lag of promotion effect. The comparative results of the tertiary industry are shown in Figure 7. The comparison results of transportation and residential are shown in Figure A3 and Figure A4.
In the fields of refrigeration, kitchen, lighting and power, unit energy consumption peaked and began to decline 1–2 years after the implementation of the policy. In terms of heating and domestic hot water, unit energy consumption decreased before the implementation of the policy, but the implementation of the policy increased the rate of decline and brought more obvious energy-saving effect. According to Figure A3 and Figure A4, due to the earlier attention paid to the transportation and residential sectors, the unit energy consumption has been in the decline stage for a long time. However, the implementation of the policy can accelerate the decline rate.
Therefore, it is considered that the TRP can effectively reduce the energy consumption of TTR. Next, the impact of specific equipment will be analyzed, and a comprehensive evaluation combined with carbon emissions will be conducted.

4. Comprehensive Evaluation of Specific Equipment in TRP

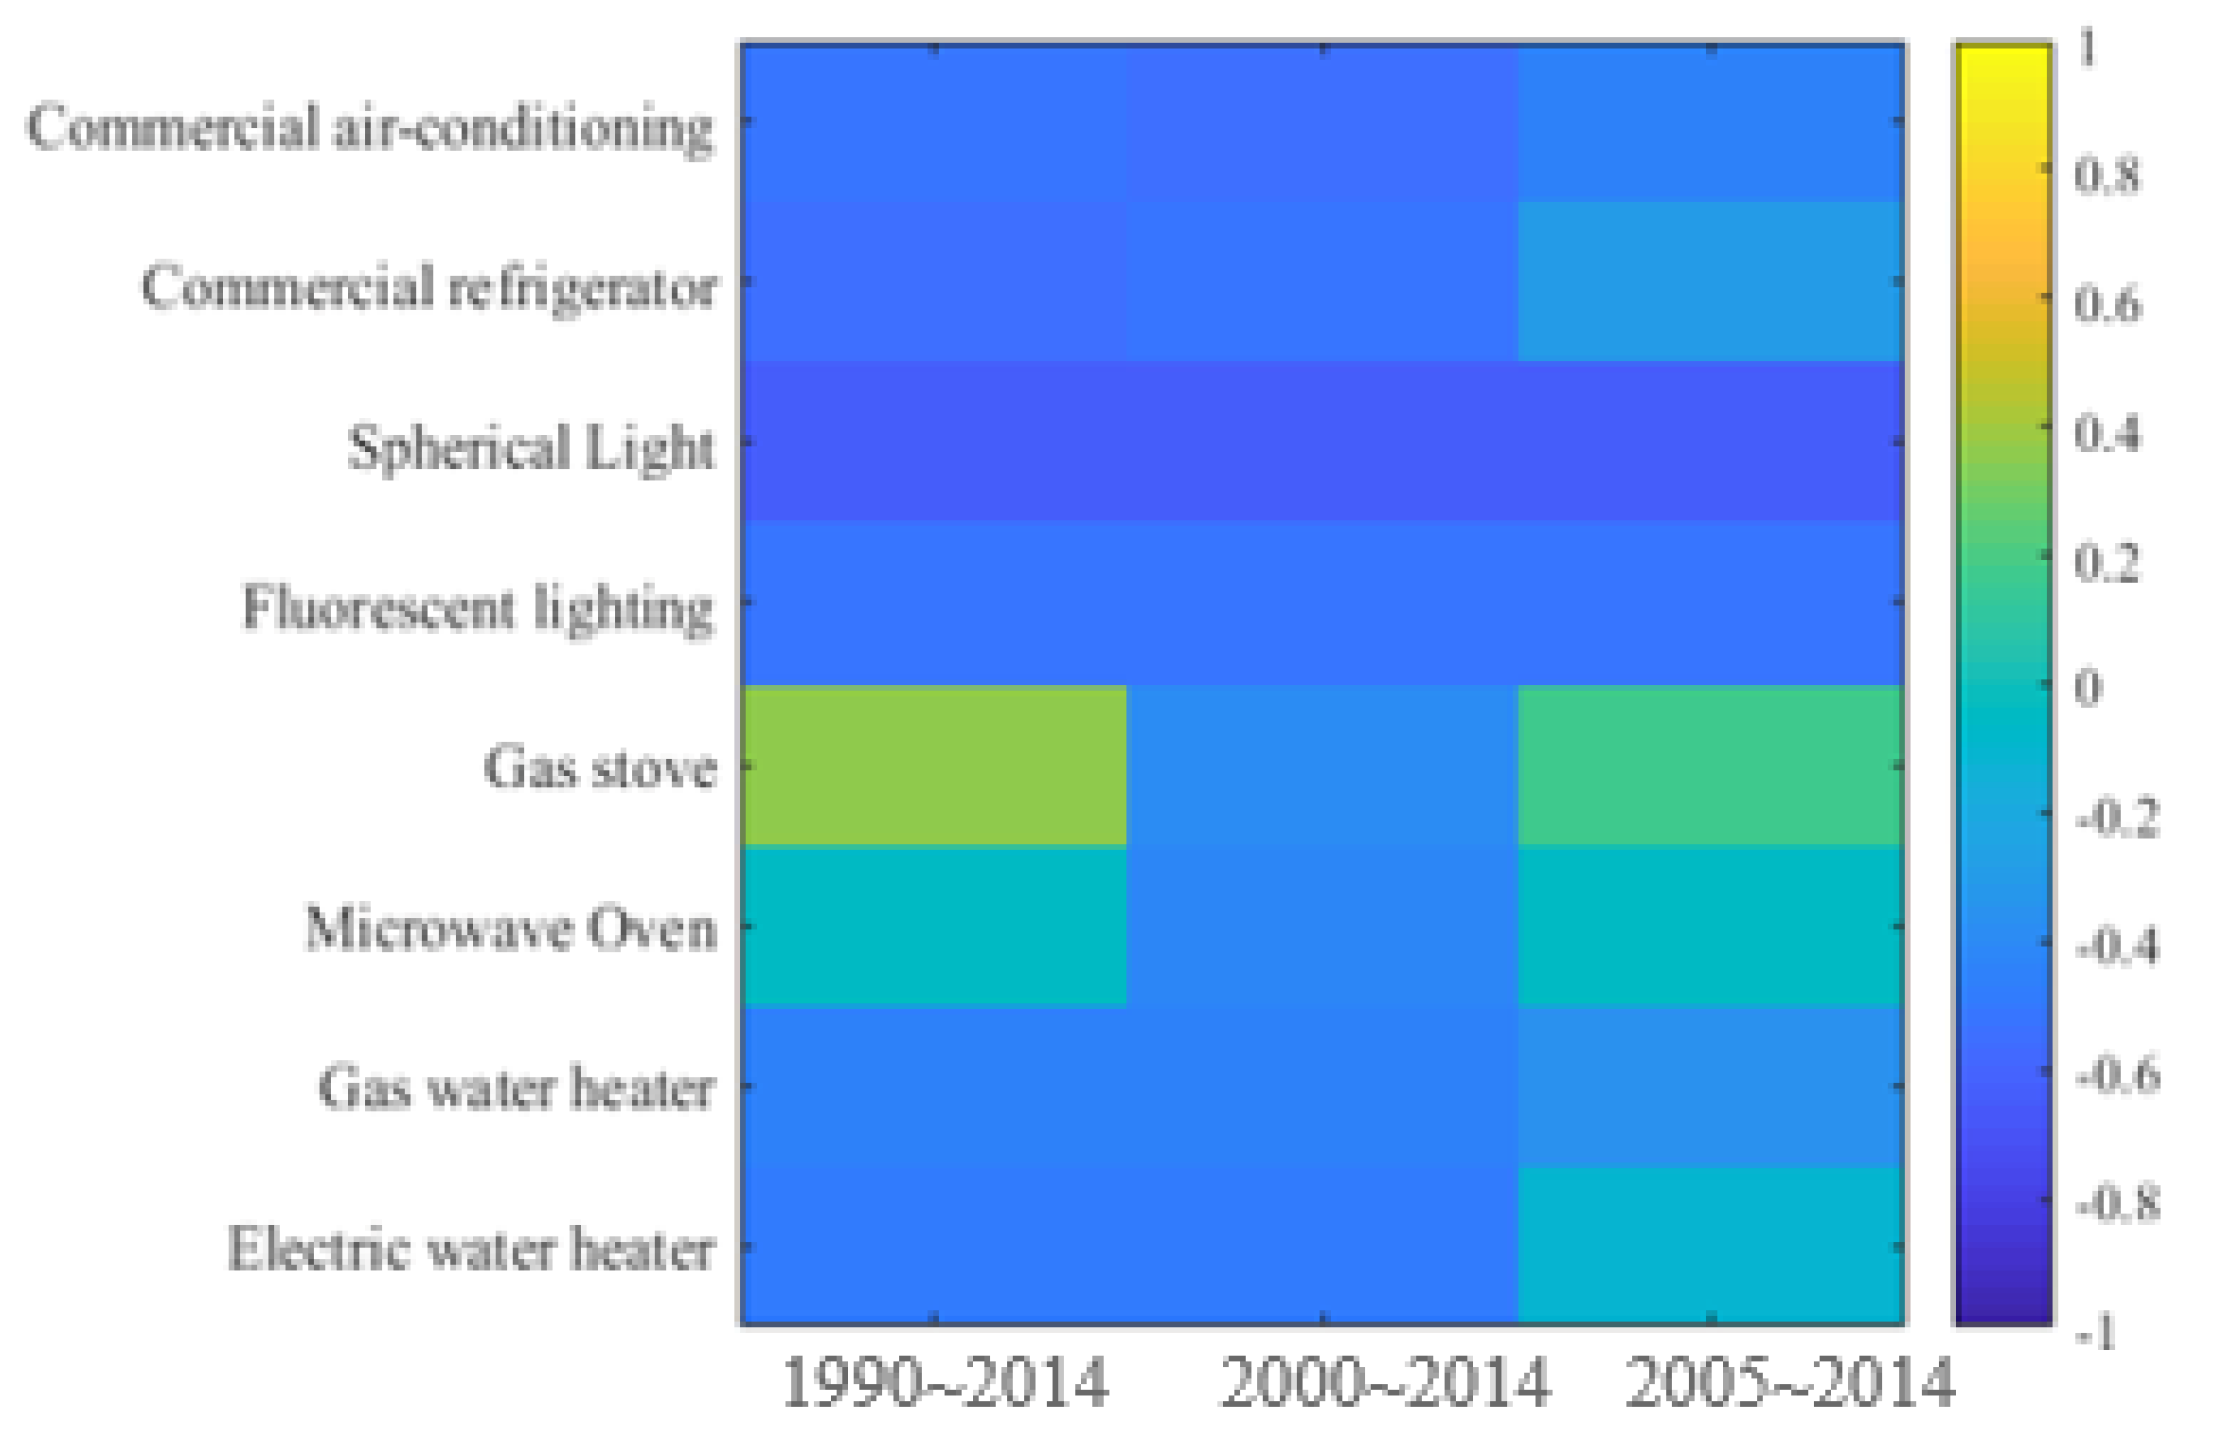
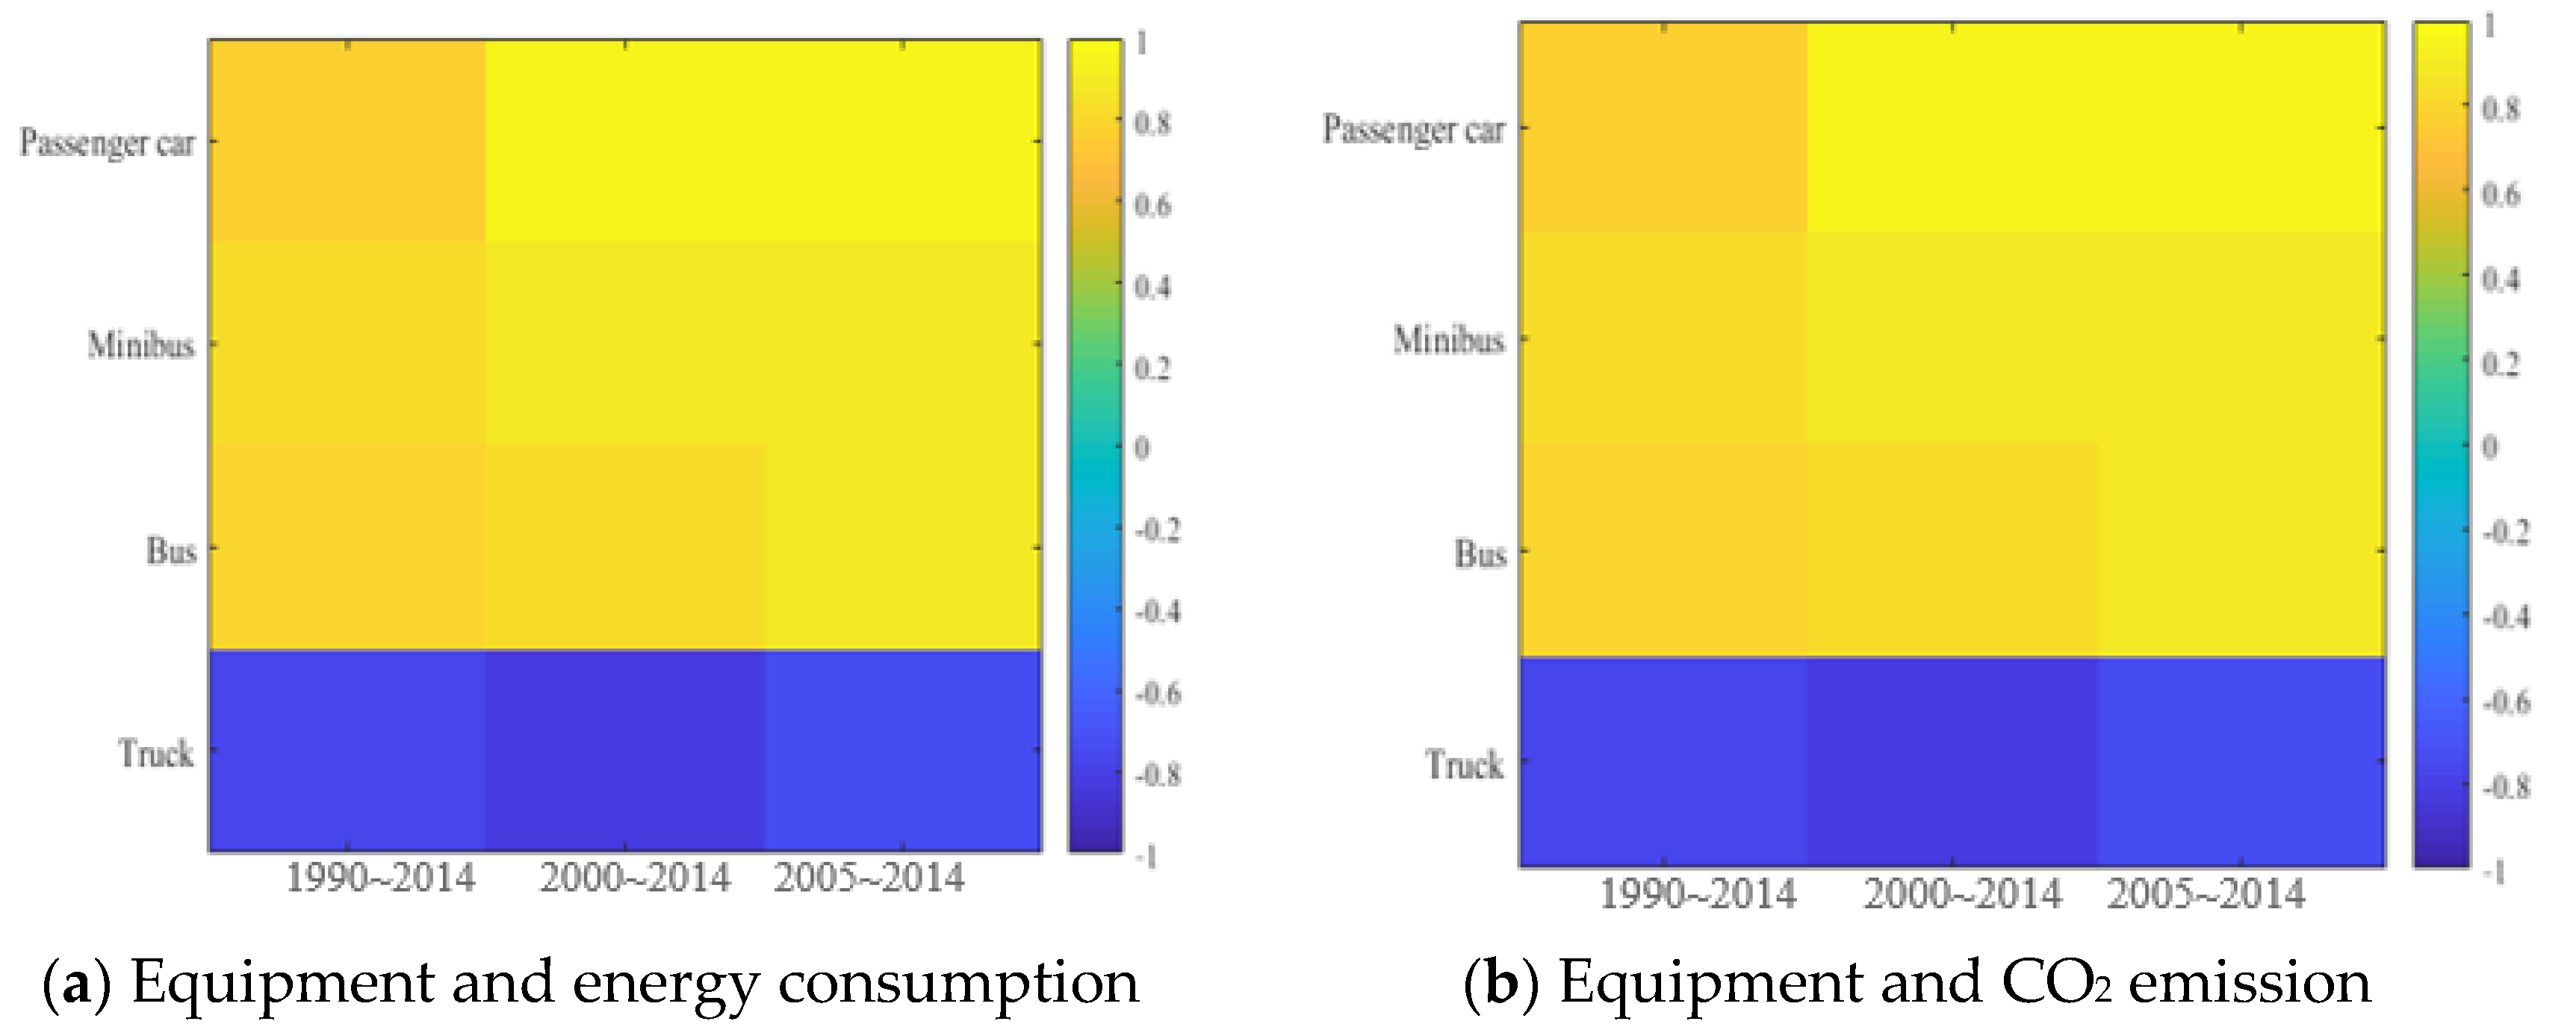
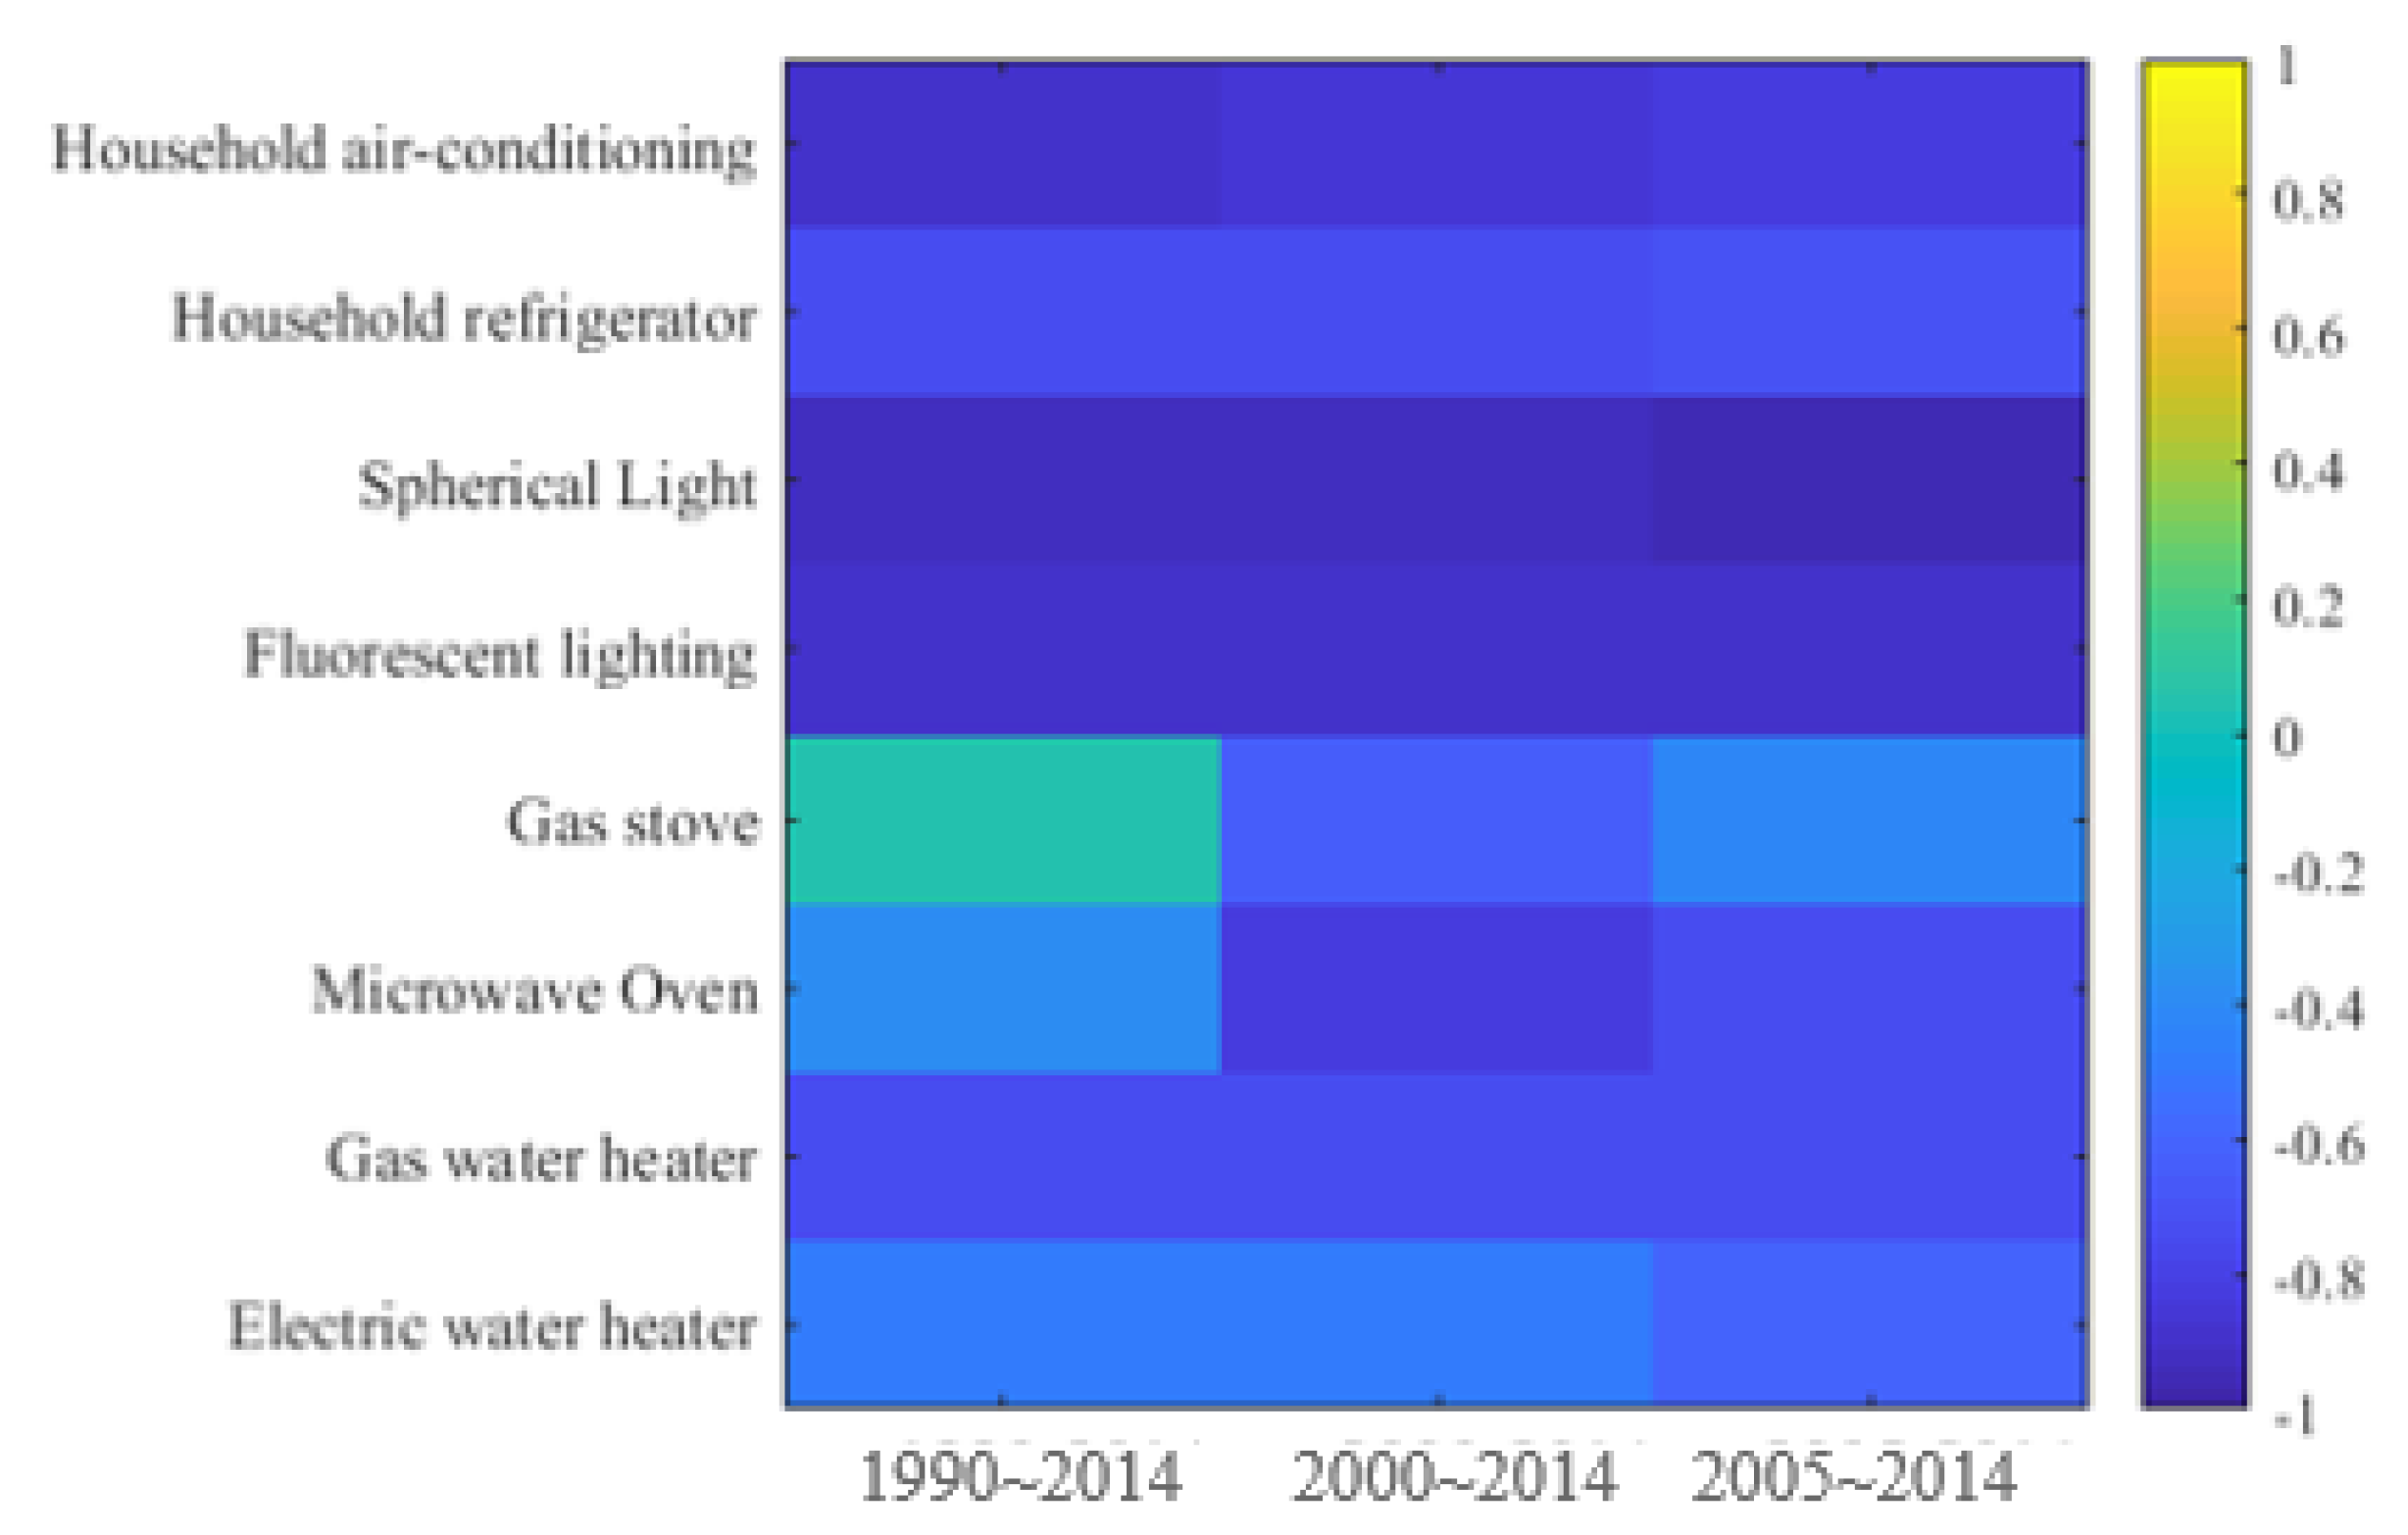
4.1. Impact Analysis of Equipment Energy Efficiency Improvement

According to the self-statistics of different equipment industries and the combing of some government departments, the statistics of equipment energy efficiency changes up to 2014 (ten years after the implementation of the policy) are obtained, including: Commercial air conditioner, commercial refrigerator, residential air conditioner, residential refrigerator, spherical light, fluorescent light, gas stove, microwave oven, gas water heater, electric water heater, passenger car, minibus, bus and truck. The average energy consumption of these equipment in one year will be analyzed with energy consumption and carbon emissions in the corresponding fields. In order to analyze the impact of the policy more clearly, the correlation is divided into stages 1990–2014, 2000–2014 and 2005–2014. The results of the three stages will be compared to analyze the effect of policy implementation.
(1) Tertiary industry
The correlation between equipment and the tertiary industry energy consumption and carbon emission at different stages is shown in Figure 8 and Figure 9. The correlation between equipment and energy consumption showed a strong positive correlation in the 2005–2014 stage, especially in air conditioning, refrigeration and microwave ovens. In terms of carbon emissions, it is negatively correlated at the beginning, and turned to positive correlation in the 2005–2014 stage. In the tertiary industry, the improvement of equipment energy efficiency can significantly reduce energy consumption, but the effect on CO2 emission reduction is weak. The correlation coefficient of energy consumption and the carbon emission of the tertiary industry is 0.9128, with strong correlation. However, as the energy consumption in the business field is mainly composed of gas, oil and electricity, the reduction of energy consumption mainly comes from the conversion of oil consumption to natural gas consumption, and the effect on CO2 emission reduction is not obvious.
(2) Transportation
The correlation between equipment and transportation energy consumption and carbon emission at different stages is shown in Figure 10. Due to the increasing demand for trucks, more heavy-duty trucks with higher energy consumption have been introduced, resulting in the continuous improvement of the average energy consumption of trucks. In addition to trucks, other equipment has a strong positive correlation with energy consumption and CO2 emissions from the beginning. However, there is still a positive improvement in the correlation in the 2005–2014 stage. Although affected by other energy-saving policies, the TRP still plays a certain role. At the same time, the analysis results of energy consumption and carbon emission in the field of transportation are similar, because the correlation coefficient of energy consumption and carbon emission in transportation field is 0.9957. The CO2 emissions of energy used in the field of transportation are similar, and the change of energy consumption structure has little impact on carbon emissions, resulting in the energy-saving effect of equipment, which has a great effect on CO2 emission.
(3) Residential
The correlation between equipment and residential energy consumption and carbon emission at different stages is shown in Figure 11 and Figure 12. It can be seen that the improvement of equipment energy utilization efficiency has a positive correlation with the decrease of household energy consumption, and the increase in 2005–2014 stage. But in terms of CO2 emissions, it has been in a negative correlation state. It shows that the improvement of energy utilization efficiency of equipment in the residential field cannot contribute to the emission reduction. Even, due to the improvement of living standards of residents and the popularization of electrification, CO2 emissions show an upward trend.
According to the above analysis results of the equipment, the TRP has played a positive role in reducing energy consumption in the three areas of TTR, but there are differences in the results of CO2 emission reduction. In the field of transportation, the effect of emission reduction is very obvious. In the tertiary industry, the effect of carbon dioxide emission reduction shows a positive trend, but in the residential sector, the impact on CO2 emission reduction is not significant. Therefore, the CO2 rebound effect of equipment will be analyzed to study the actual effect of equipment energy efficiency improvement brought by the policy.

4.2. CO2 Rebound Effect Analysis

Referring to the building energy efficiency evaluation system of Japan and other countries [35], it can be seen that the energy equipment of the tertiary industry and residential buildings can be divided into two types: (1) Heating, ventilation and air conditioning; (2) lighting and power. Therefore, air conditioning and lighting are chosen to represent these two types of energy equipment. Passenger cars are chosen to represent energy equipment in the transportation sector. The research takes this three equipment as representatives to analyze the rebound effect of production, use and scrapping in the life cycle stage. Since the energy consumption structure of the three equipment in the production and scrapping stage has little change, the energy consumption and carbon emission in the whole life cycle stage are basically linear correlation, so the rebound effect of carbon emissions is explained. The carbon emission parameters of the equipment life cycle are shown in Table 1 below.
According to the policy stages, the starting years of lighting, air conditioning and passenger cars are 2005, 2004 and 2005, respectively, and the average rebound effect of the carbon footprint (REC) within 10 years from the beginning of the policy is calculated. Three types of REC calculation are carried out, which are (1) use stage; (2) whole stage; (3) life cycle. The whole stage refers to the CO2 emission in the whole stage of production, use and end of use in each year, and compares with the theoretical CO2 emission reduction caused by the energy efficiency improvement of the equipment. Compared with REC which only considers the use stage, the impact of annual production and end of use is increased. The whole life cycle is to analyze the long-term CO2 emission impact based on the whole stage and considering the service life of the equipment. The REC comparison of lighting, air conditioning and passenger cars in three stages is shown in Table 2.
It can be seen that the rebound effect in the operation stage is very close to that in the whole life cycle. In these two stages, air conditioning REC is the highest, which represents the best CO2 emission reduction effect brought by the improvement of air conditioning energy efficiency. The REC of fluorescent lamp is very small, and there is no benefit of energy saving and emission reduction. Among them, the carbon dioxide emissions of passenger cars in the manufacturing and scrap recovery stage account for a high proportion, which leads to the strong volatility of REC. This also results in the best energy-saving and emission reduction effect of passenger cars in the whole stage.
According to the results of the rebound effect during the implementation of the policy, the energy efficiency improvement of passenger cars can bring the largest short-term CO2 emission reduction. From the perspective of the whole life cycle, the energy efficiency improvement of air conditioning system has the most obvious emission reduction effect. It shows that although the emission reduction effect of the TRP is only obvious in the field of transportation, as the promotion rate of electrification rate tends to be slow, the emission reduction effect of the policy will be more obvious from the perspective of the whole life.

5. Conclusions

The policy of improving energy efficiency of equipment can help to offset the increase in energy consumption and CO2 emissions as demand increases. However, the implementation of a variety of energy conservation and emission reduction policies at the same time often results in the failure to effectively analyze the effect of single policy. In this paper, the identification and comprehensive evaluation method of equipment energy efficiency improvement policy (EEEIP) was proposed, and the Japan’s Top Runner policy (TRP) was taken as an example to verify. Firstly, the potential of energy conservation and emission reduction in policy-related fields is analyzed by factor decomposition model. The results show that the increase of the proportion of energy consumption and energy utilization efficiency of tertiary industry, transportation and residential has a positive significance for the overall energy consumption and CO2 emissions. Through the identification and effect analysis of TRP, the evaluation results are as follows.
(1)
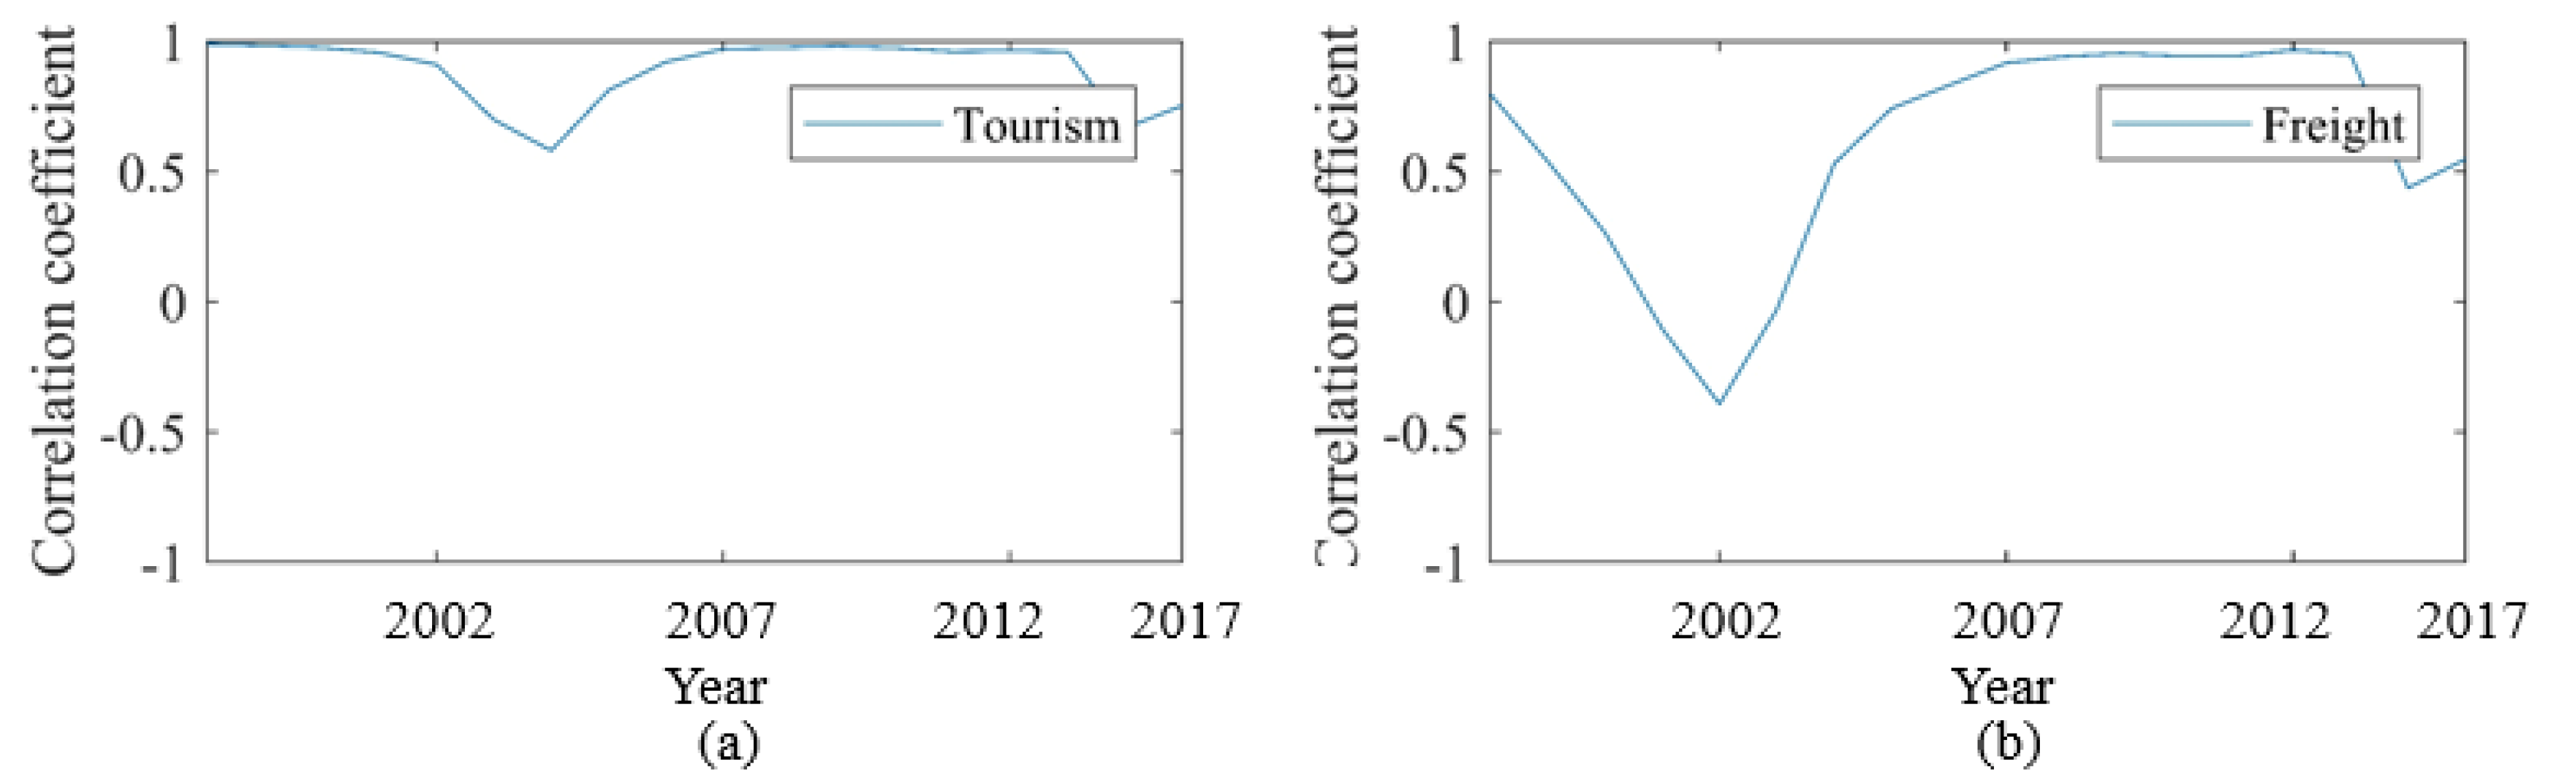
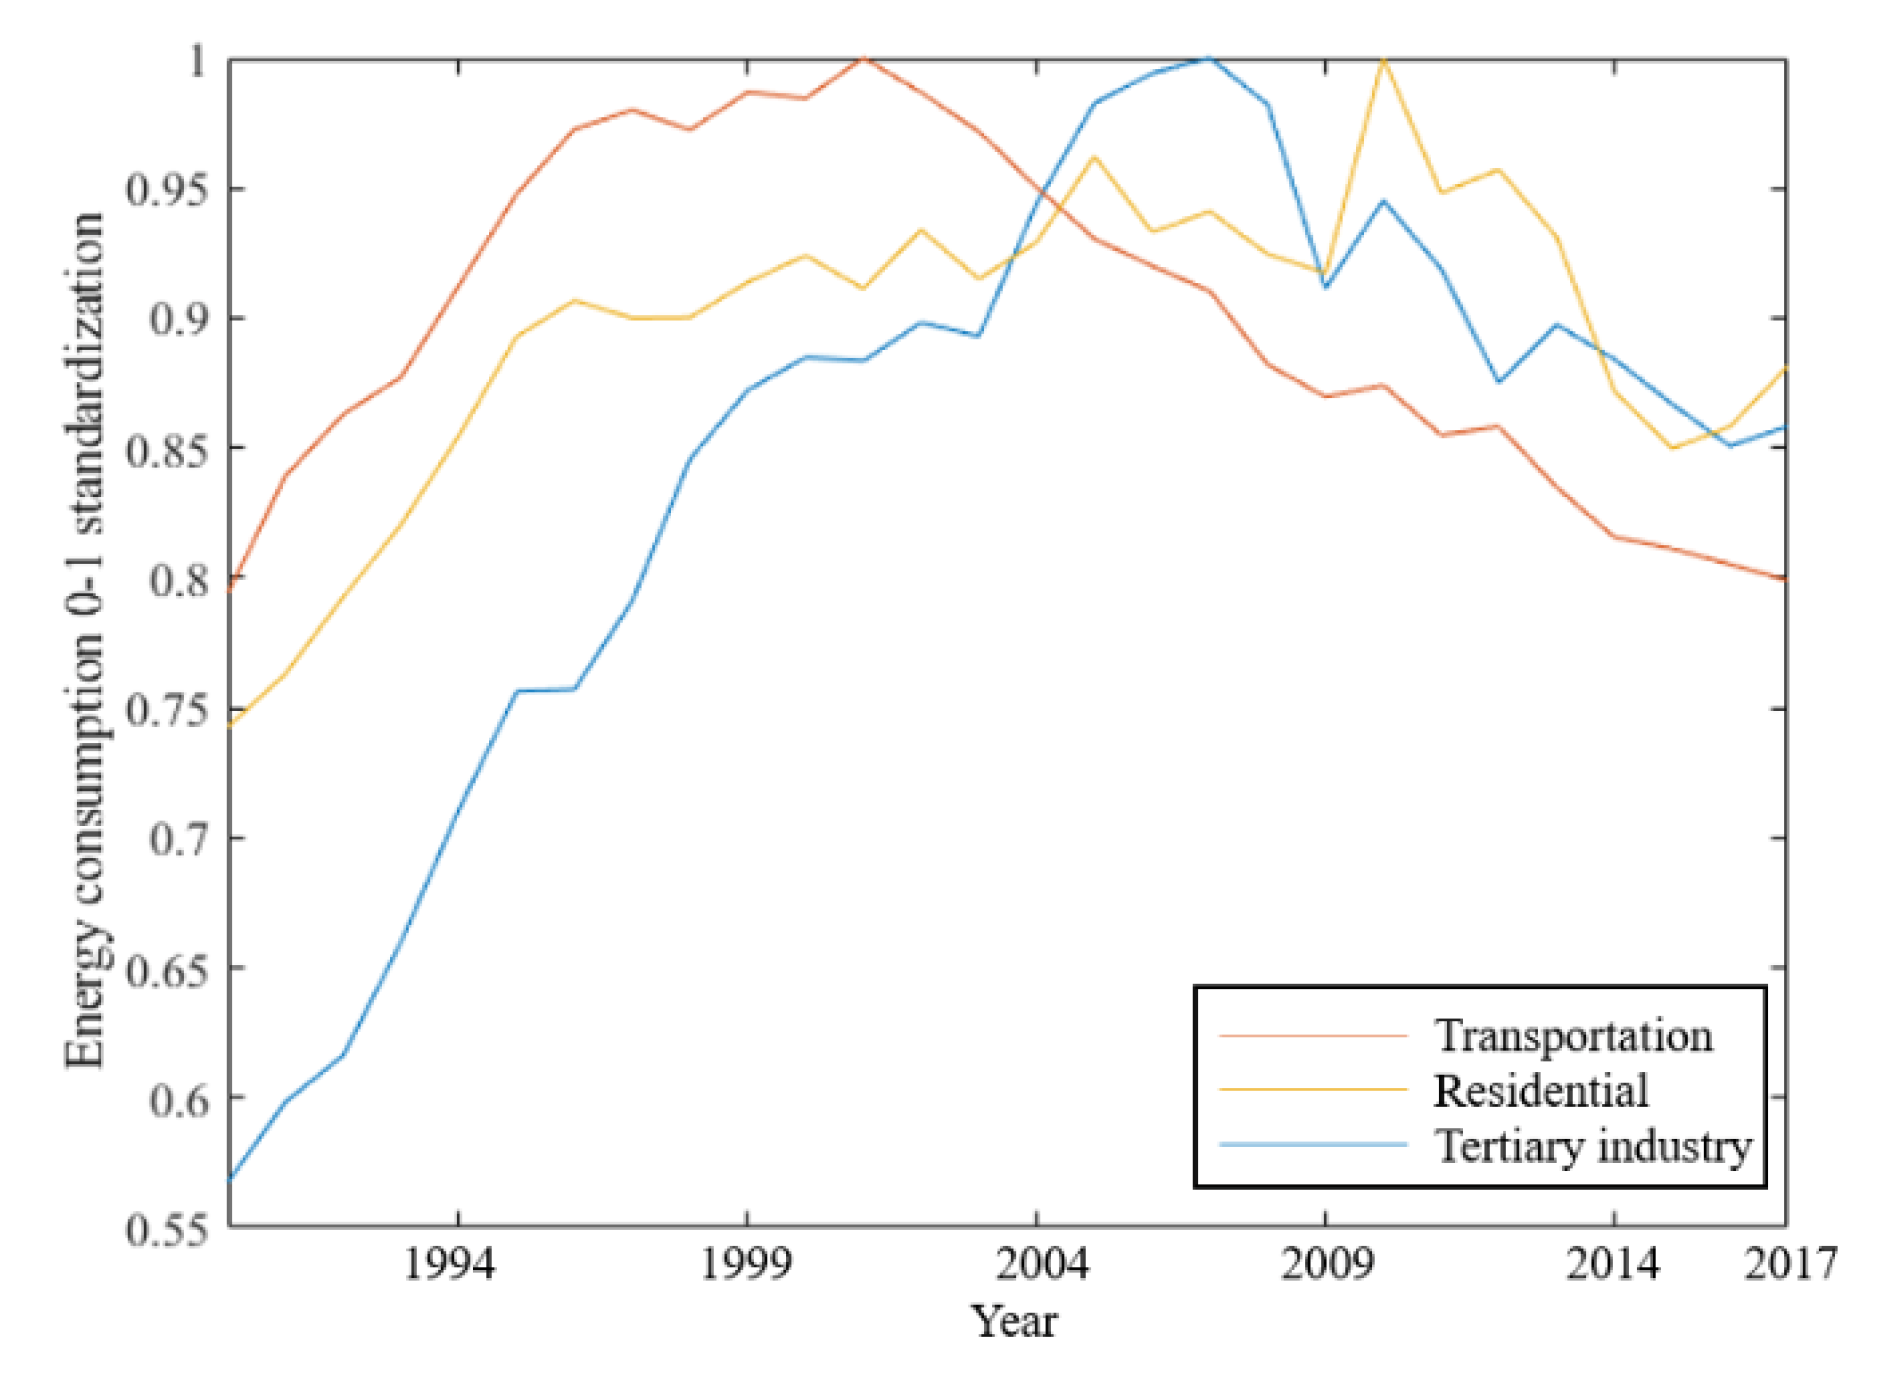
In terms of the overall effect of the policy, through moving window and correlation analysis, the effects of TRP in the tertiary industry, transportation and residential were identified and analyzed. Among them, the effect in the tertiary industry was the best. In the field of transportation and family, although affected by other earlier energy-saving policies, it still had a certain effect.
(2)
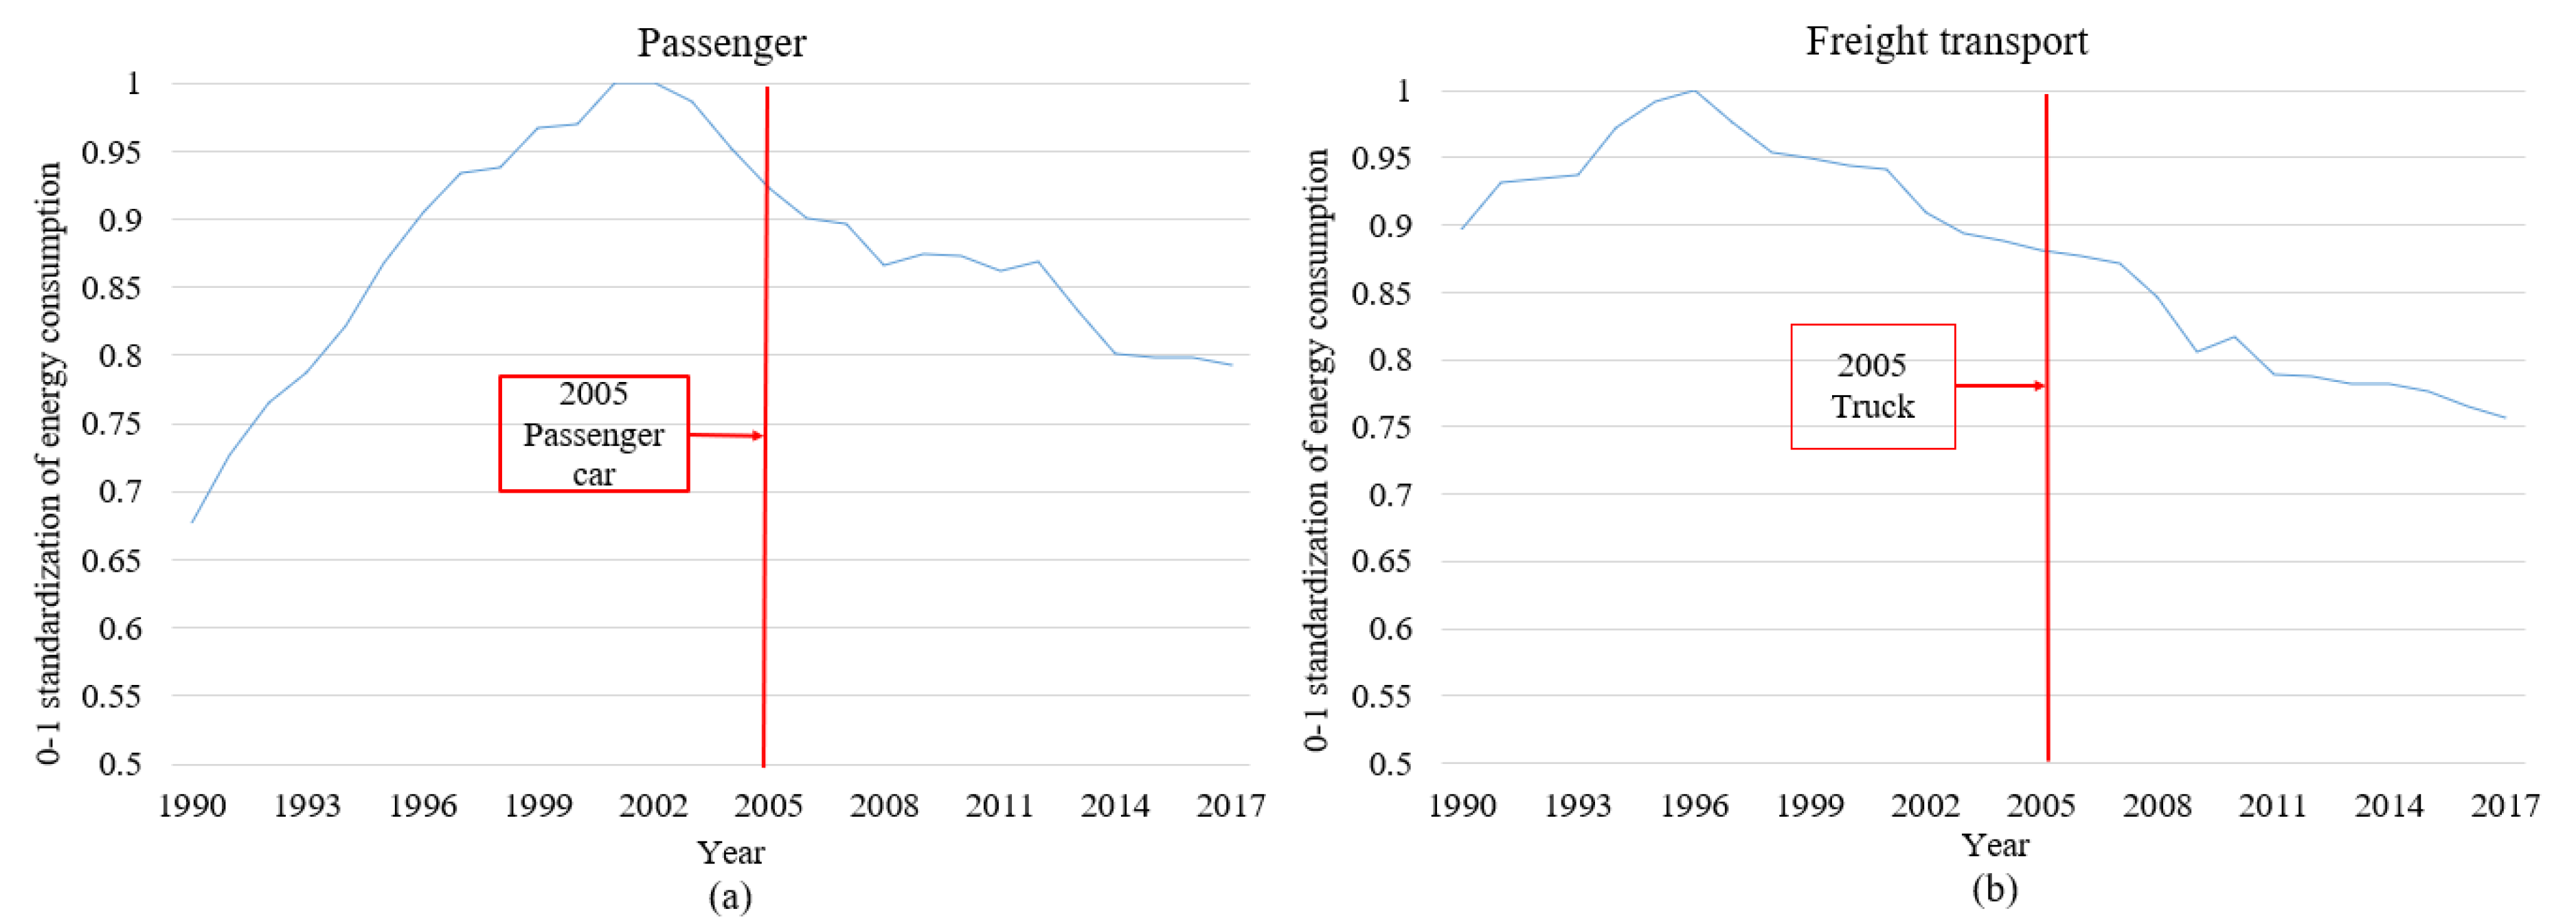
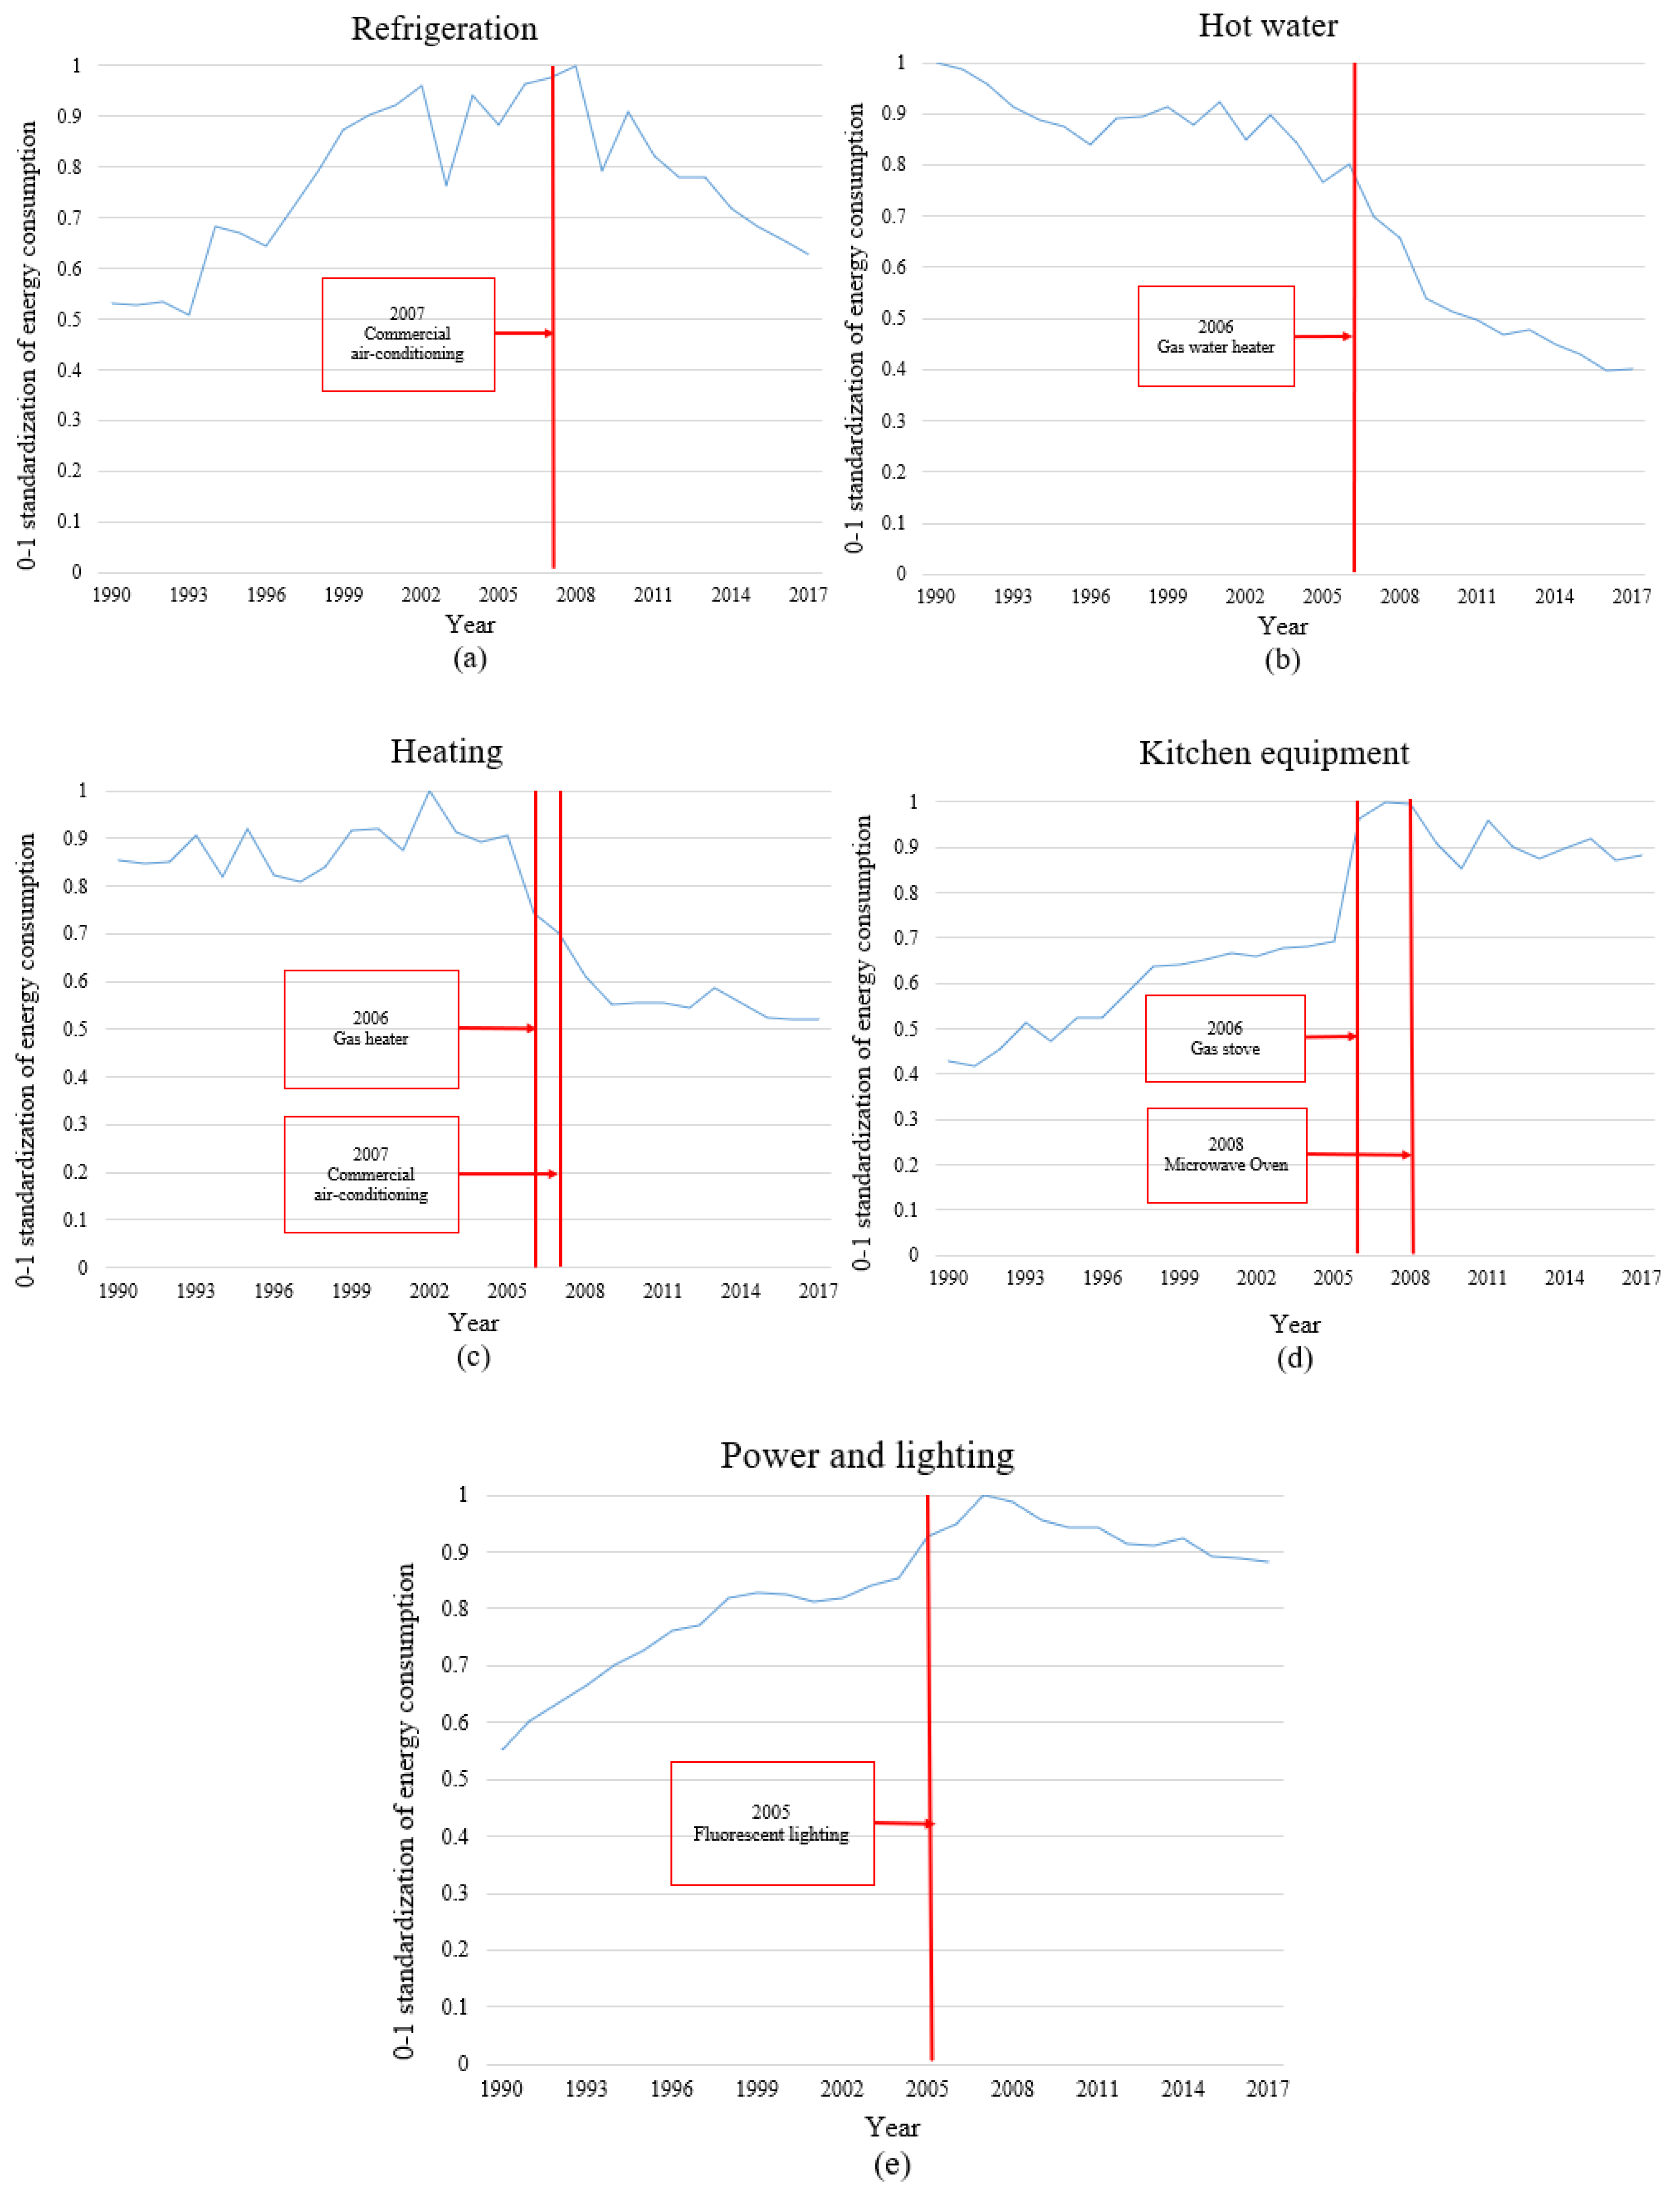
In terms of specific equipment, the energy and environmental impacts of the specific equipment involved in the TRP were analyzed through correlation analysis in different stages. For energy saving, most of the equipment had a positive impact, especially business air conditioning, business cold storage, microwave oven and passenger cars. For emission reduction, the tertiary industry and transportation had a positive impact, but the effect in the family area was not obvious.
(3)
In terms of short-term and long-term impacts, the short-term and long-term rebound effects of CO2 emissions were analyzed from use stage, whole stage and life cycle perspectives. The REC of fluorescent lamp lighting was only 0.15 in both short-term and long-term, and the effect of energy-saving and emission reduction was basically offset. Air conditioning and passenger cars had better short-term effect, and the index REC of rebound effect was 1.16 and 1.24, respectively. For long-term effect, air conditioning had the best effect. Therefore, although the effect of TRP in the field of emission reduction was not obvious at present, the effect of equipment will gradually appear over time.
This paper took Japan’s TRP as an example to verify the identification and evaluation methods of equipment energy efficiency improvement policy, involving two aspects of energy consumption and CO2 emissions, as well as two dimensions of short-term and long-term, which has high reference value for the evaluation of equipment energy efficiency improvement policies. However, factors such as the early introduction of energy-saving policies for some equipment and the increase in electrification rates still affected the analysis results. Therefore, there is still room for further improvement in the study of rebound effects.

Author Contributions

Conceptualization, D.Y.; methodology, D.Y., B.D. and F.Q.; software and validation, D.Y. and F.Q.; formal analysis, D.Y.; writing—original draft preparation, D.Y.; writing—review and editing, D.Y., B.D. and F.Q.; supervision, B.D. All authors have read and agreed to the published version of the manuscript.

Funding

This research received no external funding.

Conflicts of Interest

The authors declare no conflict of interest.

Appendix A

Figure A1. The policy identification results of transportation ((a) tourism and (b) freight).
Energies 13 04397 g0a1
Figure A2. The policy identification results of residential (refrigeration, heating, hot water, kitchen, lighting, power and others) ((a) Refrigeration; (b) Heating; (c) Hot water; (d) Kitchen; (e) Lighting, power and others; (f) All energy consumption).
Energies 13 04397 g0a2
Figure A3. Comparison of different types of energy consumption and the starting time of corresponding policies in transportation ((a) Passenger and (b) Freight transport).
Energies 13 04397 g0a3
Figure A4. Comparison of different types of energy consumption and the starting time of corresponding policies in residential ((a) Refrigeration; (b) Hot water; (c) Heating; (d) Kitchen equipment; (e) Power and lighting).
Energies 13 04397 g0a4

References

  1. International Energy Agency; Birol, F. World Energy Outlook 2019; International Energy Agency: Paris, French, 2019. [Google Scholar]
  2. British Petroleum. Outlook, BP Energy, 2019 ed.; British Petroleum: London, UK, 2019. [Google Scholar]
  3. Locmelis, K.; Blumberga, D.; Blumberga, A.; Kubule, A. Benchmarking of industrial energy efficiency. Outcomes of an energy audit policy program. Energies 2020, 13, 2210. [Google Scholar] [CrossRef]
  4. Lee, C.Y.; Lotsu, S.; Islam, M.; Yoshida, Y.; Kaneko, S. The impact of an energy efficiency improvement policy on the economic performance of electricity-intensive firms in Ghana. Energies 2019, 12, 3684. [Google Scholar] [CrossRef] [Green Version]
  5. Nahla, S. Energy intensity and its determinants in OPEC countries. Energy 2019, 186, 115803. [Google Scholar]
  6. Fang, G.; Tian, L.; Fu, M.; Sun, M.; Du, R. The impacts of energy construction adjustment on energy intensity and economic growth—A case study of China. Energy Procedia 2016, 104, 239–244. [Google Scholar] [CrossRef]
  7. Soni, A.; Mittal, A.; Kapshe, M. Energy intensity analysis of indian manufacturing industries. Resour. Effic. Technol. 2017, 3, 353–357. [Google Scholar] [CrossRef]
  8. Guang, F.; He, Y.; Wen, L.; Sharp, B. Energy intensity and its differences across China’s regions: Combining econometric and decomposition analysis. Energy 2019, 180, 989–1000. [Google Scholar] [CrossRef]
  9. Calcagnini, G.; Giombini, G.; Travaglini, G. Modelling energy intensity, pollution per capita and productivity in Italy: A structural VAR approach. Renew. Sustain. Energy Rev. 2016, 59, 1482–1492. [Google Scholar] [CrossRef]
  10. Silva, F.I.A.; Guerra, S.M.G. Analysis of the energy intensity evolution in the Brazilian industrial sector—1995 to 2005. Renew. Sustain. Energy Rev. 2009, 13, 2589–2596. [Google Scholar] [CrossRef]
  11. De Jesus, D.O.; Paulo, M. Effect of generation capacity factors on carbon emission intensity of electricity of Latin America & the Caribbean, a temporal IDA-LMDI analysis. Renew. Sustain. Energy Rev. 2019, 101, 516–526. [Google Scholar]
  12. Okajima, S.; Okajima, H. Analysis of energy intensity in Japan. Energy Policy 2013, 61, 574–586. [Google Scholar] [CrossRef]
  13. Huang, J.; Du, D.; Tao, Q. An analysis of technological factors and energy intensity in China. Energy Policy 2017, 109, 1–9. [Google Scholar] [CrossRef]
  14. Petrović, P.; Filipović, S.; Radovanović, M. Underlying causal factors of the European Union energy intensity: Econometric evidence. Renew. Sustain. Energy Rev. 2018, 89, 216–227. [Google Scholar] [CrossRef]
  15. Gandhi, O.; Oshiro, A.H.; deMedeiros Costa, H.K.; Santos, E.M. Energy intensity trend explained for Sao Paulo state. Renew. Sustain. Energy Rev. 2017, 77, 1046–1054. [Google Scholar] [CrossRef]
  16. Li, J.; Lin, B. Inter-factor/inter-fuel substitution, carbon intensity, and energy-related CO2 reduction: Empirical evidence from China. Energy Econ. 2016, 56, 483–494. [Google Scholar] [CrossRef]
  17. Zhu, L.; He, L.; Shang, P.; Zhang, Y.; Ma, X. Influencing factors and scenario forecasts of carbon emissions of the Chinese power industry: Based on a generalized divisia index model and monte carlo simulation. Energies 2018, 11, 2398. [Google Scholar] [CrossRef] [Green Version]
  18. Fredrik, N.G.; Andersson, P.K. CO2 emissions and economic activity: Short- and long-run economic determinants of scale, energy intensity and carbon intensity. Energy Policy 2013, 61, 1285–1294. [Google Scholar]
  19. Moutinho, V.; Robaina-Alves, M.; Mota, J. Carbon dioxide emissions intensity of Portuguese industry and energy sectors: A convergence analysis and econometric approach. Renew. Sustain. Energy Rev. 2014, 40, 438–449. [Google Scholar] [CrossRef]
  20. Gui, S.; Wu, C.; Qu, Y.; Guo, L. Path analysis of factors impacting China’s CO2 emission intensity: Viewpoint on energy. Energy Policy 2017, 109, 650–658. [Google Scholar] [CrossRef]
  21. Cruz, L.; Dias, J. Energy and CO2 intensity changes in the EU-27: Decomposition into explanatory effects. Sustain. Cities Soc. 2016, 26, 486–495. [Google Scholar] [CrossRef]
  22. Kim, H.; Chen, W. Changes in energy and carbon intensity in Seoul’s water sector. Sustain. Cities Soc. 2018, 41, 749–759. [Google Scholar] [CrossRef]
  23. Rocchi, P.; Rueda-Cantuche, J.M.; Boyano, A.; Villanueva, A. Macroeconomic effects of EU energy efficiency regulations on household dishwashers, washing machines and washer dryers. Energies 2019, 12, 4312. [Google Scholar] [CrossRef] [Green Version]
  24. Liu, Y. Exploring the relationship between urbanization and energy consumption in China using ARDL (autoregressive distributed lag) and FDM (factor decomposition model). Energy 2009, 34, 1846–1854. [Google Scholar] [CrossRef]
  25. Liu, H.; Wang, C.; Tian, M.; Wen, F. Analysis of regional difference decomposition of changes in energy consumption in China during 1995–2015. Energy 2019, 171, 1139–1149. [Google Scholar] [CrossRef]
  26. Sun, M.; Li, J.; Gao, C.; Han, D. Identifying regime shifts in the US electricity market based on price fluctuations. Appl. Energy 2017, 194, 658–666. [Google Scholar] [CrossRef]
  27. Han, J.; Du, T.; Zhang, C.; Qian, X. Correlation analysis of CO2 emissions, material stocks and economic growth nexus: Evidence from Chinese provinces. J. Clean. Prod. 2018, 180, 395–406. [Google Scholar] [CrossRef]
  28. Cao, Z.; Wei, J.; Chen, H.-B. CO2 emissions and urbanization correlation in China based on threshold analysis. Ecol. Indic. 2016, 61, 193–201. [Google Scholar]
  29. Zhou, H.; Lin, B.; Qi, J.; Zheng, L.; Zhang, Z. Analysis of correlation between actual heating energy consumption and building physics, heating system, and room position using data mining approach. Energy Build. 2018, 166, 73–82. [Google Scholar] [CrossRef]
  30. Liu, J.; Sun, X.; Lu, B.; Zhang, Y.; Sun, R. The life cycle rebound effect of air-conditioner consumption in China. Appl. Energy 2016, 184, 1026–1032. [Google Scholar] [CrossRef]
  31. Cabinet Office, Japan. National Economic Statistics. Available online: https://www.esri.cao.go.jp/jp/sna/data/data_list/kenmin/files/files_kenmin.html (accessed on 9 March 2020).
  32. Ministry of Economy. Trade and Industry (MIT). Japan. Comprehensive Energy Statistics. Available online: https://www.enecho.meti.go.jp/statistics/total_energy/results.html (accessed on 14 April 2020).
  33. Ministry of Economy and Industry, Department of Resources and Energy. Japan "Top Runner Policy"; Ministry of Economy and Industry, Department of Resources and Energy: Tokyo, Japan, 2015.
  34. Meng, H.; Xie, W.-J.; Jiang, Z.-Q.; Podobnik, B.; Zhou, W.-X.; Stanley, H.E. Systemic risk and spatiotemporal dynamics of the US housing market. Sci. Rep. 2014, 4, 1–7. [Google Scholar] [CrossRef] [Green Version]
  35. Zhang, Y.; Wang, H.; Gao, W.; Wang, F.; Zhou, N.; Kammen, D.M.; Ying, X. A survey of the status and challenges of green building development in various countries. Sustainability 2019, 11, 5385. [Google Scholar] [CrossRef] [Green Version]
  36. Up, Hydrogen Scaling. A Sustainable Pathway for the Global Energy Transition. Hydrogen Council. Available online: https://hydrogencouncil.com/wp-content/uploads/2017/11/Hydrogen-scaling-up-Hydrogen-Council.pdf (accessed on 26 August 2020).
  37. Chen, S.; Zhang, J.; Kim, J. Life cycle analysis of greenhouse gas emissions for fluorescent lamps in mainland China. Sci. Total Environ. 2017, 575, 467–473. [Google Scholar] [CrossRef] [PubMed]
  38. Viñoles-Cebolla, R.; Bastante-Ceca, M.J.; Capuz-Rizo, S.F. An integrated method to calculate an automobile’s emissions throughout its life cycle. Energy 2015, 83, 125–136. [Google Scholar] [CrossRef]
Figure 1. Research flow chart.
Energies 13 04397 g001
Figure 2. The proportion of structural factors and efficiency factors of energy intensity (EI).
Energies 13 04397 g002
Figure 3. The proportion of structural factors and efficiency factors of energy consumption CO2 emission intensity (ECCEI).
Energies 13 04397 g003
Figure 4. Assessment starting year of different equipment.
Energies 13 04397 g004
Figure 5. The 0–1 standardization of energy consumption in tertiary industry, transportation and residential.
Energies 13 04397 g005
Figure 6. The policy identification results of the tertiary industry ((a) Refrigeration; (b) Heating; (c) Hot water; (d) Kitchen; (e) Lighting, power and others; (f) All energy consumption).
Energies 13 04397 g006
Figure 7. Comparison of different types of energy consumption and the starting time of corresponding policies in tertiary industry ((a) Refrigeration; (b) Hot water; (c) Heating; (d) Kitchen equipment; (e) Power and lighting).
Energies 13 04397 g007aEnergies 13 04397 g007b
Figure 8. Correlation between equipment energy efficiency improvement and energy consumption of tertiary industry in different stages.
Energies 13 04397 g008
Figure 9. Correlation between equipment energy efficiency improvement and CO2 emission of tertiary industry in different stages.
Energies 13 04397 g009
Figure 10. Correlation between equipment energy efficiency improvement, energy consumption and CO2 emission of transportation in different stages ((a) with energy consumption and (b) with CO2 emission).
Energies 13 04397 g010
Figure 11. Correlation between equipment energy efficiency improvement and energy consumption of residential in different stages.
Energies 13 04397 g011
Figure 12. Correlation between equipment energy efficiency improvement and CO2 emission of residential in different stages.
Energies 13 04397 g012
Table 1. The carbon emission parameters of the equipment life cycle [30,36,37,38].
TypeManufacture and Transportation (kgCO2)The End of Use (kgCO2)Service Life (Year)Use
Energy TypeCarbon Emission
Spherical light11.5250.897.5electricity0.455 kgCO2/kWh
Household air-conditioning1471015.7electricity0.455 kgCO2/kWh
Passenger car600030013gasoline2.3 kgCO2/L
Table 2. The rebound effect of lighting, air conditioning and passenger cars in three stages.
TypeRebound Effect of the Carbon Footprint (REC)
Use StageWhole StageLife CycleVolatility in Life Cycle (Variance)
Spherical light0.1500.1670.1520.016
Household air-conditioning1.1441.1611.1450.028
Passenger car0.4141.2350.4482.182

