Article

Analysis of the Relationship of the Improvement of Façades and Thermal Bridges of Spanish Building Stock with the Mitigation of Its Energy and Environmental Impact

by
David Bienvenido-Huertas
Department of Building Construction II, University of Seville, 41012 Seville, Spain
Energies 2020, 13(17), 4499; https://doi.org/10.3390/en13174499
Submission received: 28 July 2020 / Revised: 21 August 2020 / Accepted: 25 August 2020 / Published: 1 September 2020
(This article belongs to the Special Issue Energy Efficiency in Buildings: Both New and Rehabilitated Ⅱ)

Abstract

:
The energy improvement of building stock is essential to achieve a low-carbon economy. The improvement of façades is among the most common measures to reduce energy consumption. However, the effect of thermal bridges is undervalued in most cases. This study assesses the effect of improving building façades and thermal bridges. For this purpose, a case study is assessed for all climate zones in Spain, both in current and future scenarios, considering operational patterns from the COVID-19 pandemic. The study shows that the application of energy conservation measures focusing on reducing the thermal transmittance of façades and the linear thermal transmittance of thermal bridges has a more significant energy and environmental effect than other, more economical energy conservation measures that do not improve the effect of thermal bridges. Likewise, the application of energy conservation measures to improve façades can reduce carbon dioxide emissions but are far from achieving the 90% reduction set by the European Union by 2050. Consequently, these measures should be combined with other measures.

1. Introduction

The energy improvement of building stock is among the main challenges for architects and engineers due to deficient energy performance resulting from building standards without energy efficiency goals [1]. Consequently, building energy consumption plays a significant role in the energy consumption generated by anthropogenic activities and thus in greenhouse gas emissions. According to quantified data, the building sector is responsible for 40% of the energy consumption and 25% of the greenhouse gas emissions globally [2,3]. This deficient energy performance of buildings faces demanding goals by international bodies, such as the European Union, to reduce greenhouse gas emissions. By 2050, European buildings should reduce greenhouse gas emissions by 90% [4].
The adoption of energy conservation measures (ECMs) in buildings is required to achieve these goals. ECMs are understood as any type of modification which allows the building energy performance to be improved [5]. Those ECMs focusing on improving various building elements could be adopted. However, envelope elements are the main element to be treated because of their narrow relationship with energy demand [6,7,8,9]. The effectiveness of applying ECMs to building envelopes has been widely analyzed, particularly for the energy improvement of buildings located in cold climate zones. Aksoy and Inalli [10] analyzed the influence of passive design parameters, such as form factor and orientation, in a building located in a cold region of Turkey. Similarly, Güçyeter and Günaydin [11] assessed the improvement of the envelope of an office building located in Turkey using six ECMs. Invidiata et al. [12] analyzed the influence of six ECMs in a residential building located in the north of Italy in order to select the best option to improve building sustainability. A greater scale study was conducted by Qian et al. [13], who assessed the savings achieved at a national scale by combining various ECMs in commercial buildings.
Most studies have focused on the analysis of ECMs of the envelope on the improvement of thermal transmittance. However, the effect of thermal bridges could significantly vary the energy consumption of the building being improved. Some studies have quantified the importance of thermal bridges with regard to energy consumption. Theodosiou and Papadopoulos [14] assessed the influence of thermal bridge designs on the energy demand of representative buildings of the Greek building stock and the importance of correct characterization. Later, Theodosiou et al. [15] determined that thermal bridges should also be quantified in metal claddings of the ventilated façades. In addition, other studies quantified the effect of thermal bridges on the energy demand. Ramalho de Freitas and Grala da Cunha [16] assessed how the impact of the thermal bridges of reinforced concrete structures of a Brazilian building could vary its energy performance up to 20%. Ge et al. [17] also analyzed reinforced concrete elements. Their study assessed how the thermal bridges of balconies could vary the energy demand of Canadian residential buildings between 1 and 13%. Evola et al. [18] studied the effect of thermal bridges in two semi-detached houses located in a mild Mediterranean climate, determining that the improvement of thermal bridges resulted in a 25% reduction in the heating load and an 8.5% reduction in cooling load. Finally, Bienvenido-Huertas et al. [19] analyzed the energy improvement achieved with patents on the thermal bridge of the slab front, obtaining overall reductions of heating energy demand greater than 18%, and reductions greater than 2.80% for cooling energy demand.
However, no existing studies have analyzed the effect of focusing ECMs on the improvement of buildings or a simultaneous assessment of the effect of thermal bridges and how their energy performance could be influenced. Likewise, the economic and environmental profitability of the analyzed ECMs is crucial in this analysis because of the energy consumed and the CO2 emissions produced by the ECMs during the stages of manufacturing materials, transport to the construction site, and placement or installation in the existing building [20]. Assessing the true profitability of these ECMs is fundamental to achieving the goal of reducing greenhouse gas emissions. In addition, tests to assess the energy performance in current and future climate change scenarios are required using available estimations of how building energy performance could vary throughout the 21st century [21,22,23]. The research by Bienvenido-Huertas et al. [19] is the sole study partially analyzing the possible performance of the thermal bridge in future years, although this study focuses on new buildings and very specific designs of slab fronts. Thus, the knowledge gap that is discussed in this work is the reliability of the improvement of façades considering the effect of thermal bridges and the expected building performance throughout the 21st century. Likewise, the payback period of both consumed energy and CO2 emissions in the manufacturing phases, as well as the reliability of these types of measures to achieve the low-carbon goals by 2050, are also analyzed. These aspects are studied from the perspective of existing climates in Spain, a country with the largest surface area in southern Europe. This work is important as few studies have analyzed the importance of improving façades and the enhancement of the effect of thermal bridges from a varied perspective. Furthermore, this study also aims to improve the energy performance of existing buildings. In this regard, the design of new energy-efficient buildings is a complex task for engineers and architects, which is more difficult in the case of existing buildings [24]. In addition, the long useful life of buildings implies the need to analyze the building performance over a longer period of use compared to other sectors, such as the automotive industry.
This study employs a multidisciplinary perspective to analyze the possibilities of using ECMs to improve façades to reduce the energy consumption and greenhouse gas emissions of existing buildings, assessing the effect of thermal bridges simultaneously. For this purpose, an existing building in Spain was selected and analyzed in various climate zones of the country. Spain was selected because of the difficulties found by some studies to implement nearly zero energy buildings (NZEB) correctly in the southern countries of Europe [1]. NZEB is included in the Energy Performance of Buildings Directive (EPBD) [25], and there have been significant difficulties achieving this category in existing buildings [24]. Thus, this study’s orientation to existing buildings aims to address the limitations of reaching NZEB in such buildings. Furthermore, this work adopts new operational patterns that users could employ as a result of the COVID-19 pandemic [26]. The study shows that the application of ECMs focused on reducing the thermal transmittance of façades and the linear thermal transmittance of thermal bridges has a more significant energy and environmental effect than other more economical energy conservation measures that do not improve the effect of thermal bridges. Likewise, the application of ECMs to improve façades, although in energy terms clearly reduces greenhouse gas emissions and other problems such as energy poverty [27], is far from achieving the goals set by the European Union to reduce these emissions by 90%. As such, these measures should be combined with other measures.
The structure of the article is as follows: Section 2 describes the methodology, Section 3 presents and discusses the results of the research. Finally, Section 4 summarizes the main conclusions of the study.

2. Methodology

The methodological framework of this research consisted of a process of two-dimensional thermal bridge simulations carried out with HTflux and energy simulations carried out with DesignBuilder. Three types of façade were considered in the analysis (the original case study and two ECMs), as well as two climate scenarios (current and future). The number of energy simulations was 648. The payback period of the economic cost of the ECMs and the energy and emissions produced in the manufacture and construction stages were also analyzed. Figure 1 shows the steps followed in the research.

2.1. Case Study

To assess the influence of improving façades on the energy and environmental performance of buildings in Spain within the context of climate change, a case study representing a large percentage of Spanish building stock was selected. A residential building built in 1981 was selected. Figure 2 shows photos of the case study. This building was constructed according to the basic building norm NBE-CT 79 [28], characterized by having narrow insulating material layers in their envelopes [28]. As Table 1 indicates, the design of the façade is constituted by a double-leaf brick with an air gap and insulating material of 2 cm, whose thermal transmittance value is 0.73 W/(m2K). Experimental campaigns were conducted according to International Organization for Standardization (ISO) 9869-1, thus validating the thermal transmittance value of the façade. The building had 5 floors, with 24 dwellings in each. The surface area per floor was 1305 m.
One of the most important aspects of the building was the heat loss through the thermal bridges of its envelope (Figure 3). The measurements were performed with infrared thermography and showed that the thermal bridges of the slab front were the most influential thermal bridges, together with the corners due to the geometric form of floors.

2.2. Energy Conservation Measures Analyzed

Two ECMs were analyzed in the energy simulation processes. These ECMs, the achieved thermal transmittance and the investment required, are shown in Table 2. Measures employed were an external thermal insulation composite system (ETICS) with mineral wool insulation of 5 cm and an internal plasterboard with mineral wool insulation of 5 cm. Both measures were selected according to the most common measures to improve façade performance in Spain [29]. In addition, both measures were designed to obtain similar thermal transmittance results in an improved façade: ETICS obtained a thermal transmittance of 0.371 W/(m2K), and the plasterboard obtained a thermal transmittance of 0.364 W/(m2K). The budget to perform ECMs was obtained through a database of construction prices included in the construction products and systems (CYPE) database [30]. This database was used to obtain CO2 emissions and the energy consumed in the manufacture and construction stages of the ECMs (i.e., in stages A1, A2, A3, A4, and A5 of the life cycle). Table 3 includes the energy and emission values of these stages. These data were used to determine that the level of CO2 emissions related to ETICS was 87,868.18 kg CO2, and the emissions of the plasterboard were 131,133.22 kg CO2, whereas the energy consumed was 1,139,614.77 MJ with ETICS and 2,179,927.16 MJ with the plasterboard. These values of emissions and energy consumed in the manufacturing stage of the ECM, together with the price of the ECM itself, were used to determine the payback periods. Furthermore, three aspects were used to assess the payback periods: (i) Regarding the payback period of the economic cost, the price established in the electricity bill was always the same. For this purpose, a value of 0.1233 €/kW per day was used for the power term, and 0.1349 €/kWh for the energy term. A percentage of electricity tax in Spain (5.113%) and a percentage of value-added tax (21%) were also used; (ii) Also regarding the payback period of economic cost, in Spain, it is possible to finance the energy improvements in buildings through the State Housing Plan. This plan reduces the economic cost of the investment by 40%. For this research, both the economic payback period of not obtaining financing and the payback period with financing of 40% were analyzed; (iii) To determine the payback period of the CO2 emissions generated by the ECMs in the manufacturing and construction stages, the savings obtained in emissions generated by the building because of its energy consumption was considered. For this purpose, the conversion factor established in Spanish legislation to determine CO2 emissions related to the energy consumption of a dwelling and with a value of 0.357 kg CO2/kWh was used [31].

2.3. Cities and Climate Data

Spain has a wide climate variability. These variations in climate between cities could result in huge variations in building energy performance. To control this aspect, the Spanish Technical Building Code established a climate classification according to the combination of two indicators: winter climate severity (WCS) and summer climate severity (SCS). WCS and SCS are determined by the relationships between the degrees of winter and summer days and the number of hours of sun. A fundamental aspect when obtaining these indicators is that WCS is related to the months between October and May, and SCS to the months between June and September. After determining the value of WCS and SCS, the class that corresponds to the region was determined with the values included in Table 4. A total of 12 various combinations were obtained in the country by combining WCS and SCS. Figure 4 shows the climate zones of the provincial capitals in Spain. Each climate zone was also analyzed. For this purpose, 12 cities corresponding to each climate zone of the Spanish Technical Building Code were selected: Malaga (A3), Almeria (A4), Murcia (B3), Seville (B4), Bilbao (C1), Barcelona (C2), Granada (C3), Caceres (C4), Oviedo (D1), Girona (D2), Albacete (D3), and Soria (E1). In addition, Meteonorm was used to obtain the climate data of these cities. Meteonorm is a software composed of 8325 weather stations, by which the EnergyPlus weather (EPW) files of the locations selected were obtained. Through this process, EPW files were generated for current and future scenarios throughout the 21st century. The A2 scenario from the Intergovernmental Panel on Climate Change was selected to generate the future climate files because this scenario is among the most unfavorable [32], with an increase between 2 and 5.4 °C in 2100 in comparison with the values from the beginning of the 21st century. Through this scenario of emissions, the EPW files were generated for 2030, 2040, 2050, 2060, 2070, 2080, 2090, and 2100.

2.4. Simulation Process

The data described in the previous subsections were used to model the building in DesignBuilder. Figure 5 shows the obtained building model. Two operational patterns were defined: (i) in the case of teleworking users; (ii) in the case of users working outside their homes. This division is the result of changes in working conditions due to the COVID-19 pandemic [26] in which building users working in offices are now more likely to telework from home. To reflect this aspect, the residential profile established in the Spanish Technical Building Code was adapted [33]. Table 5 presents the profiles used. The maximum values of loads correspond to those defined in the Spanish Technical Building Code. For the characteristics of heating, ventilation and air conditioning (HVAC) systems, dwellings were considered to have a heat pump with an energy efficiency ratio (EER) of 2.00 and a coefficient of performance (COP) of 2.10.
Finally, thermal bridges were also simulated to determine the linear thermal transmittance and included in the inputs of the simulation model. The thermal bridges were simulated with the HTflux software [34], which was validated according to ISO 10211 [35]. The thermal bridges of slab fronts and corners were analyzed because of their high impact on the previous assessment of the building. Limit conditions and junction dimensions were defined according to the criteria set in ISO 10211 [35].

2.5. Limitations of the Study

It should be noted that this study has several limitations. First, this study does not consider ECMs focused on active systems. Likewise, photovoltaic self-consumption is not considered as a possible ECM as it is not often used in Spanish buildings. In this regard, the design of ECMs for existing buildings in Spain is usually adapted to comply with the requirements established in the Spanish Technical Building Code (CTE). The CTE does not require self-consumption systems in residential buildings [36], so the implementation of this type of measure in Spain is not very developed (except in the case of non-residential buildings [37]). However, the improvement of façades is among the main measures adopted. For this reason, this study is aimed at improving passive systems because they are the main measure developed in existing buildings in Spain. Likewise, façade improvement ECMs are considered due to being widely used in traditional systems. Other systems, such as green façades [38] or the use of phase change materials [39], are not considered in this study. The use of these designs could lead to variations with respect to the results obtained in this study.

3. Results and Discussion

Thus study first assessed the linear thermal transmittance of the thermal bridges in the building. For this purpose, two-dimensional transitory simulations of the thermal bridges of both the slab front and the pillar located at the corner were performed, both with the original design of the building and with the two ECMs presented, thus obtaining the linear thermal transmittance. Figure 6 includes the results obtained from the simulation process of the thermal bridges. The building presented a major heat transmission in the thermal bridges that could contribute to a diminished energy performance of the building. The linear thermal transmittance of the slab front was 0.855 W/(mK), and that of the protruding corner with pillar, which would be a negative value in a case where there was no material of other thermal properties, was 0.155 W/(mK). These junctions therefore contributed to a greater building energy demand. If one of the two presented ECMs were used, their effects on the linear thermal transmittance of junctions would be different. On the one hand, the implementation of an ETICS in the building was an optimal solution to improve the thermal transmittance of the façade and to mitigate the linear thermal transmittance of the thermal bridges, obtaining a value of 0.124 W/(mK) in the slab front and −0.001 W/(mK) in the corner. On the other hand, the internal plasterboard had different tendencies in the two thermal bridges: the lowest linear thermal transmittance value was obtained in the corner, and the linear thermal transmittance value was increased in the slab front in comparison with the value obtained in the existing building. Although ETICS and the plasterboard resulted in a similar improvement of the thermal transmittance of the façade, their effects on the thermal bridges could lead to different energy performances.
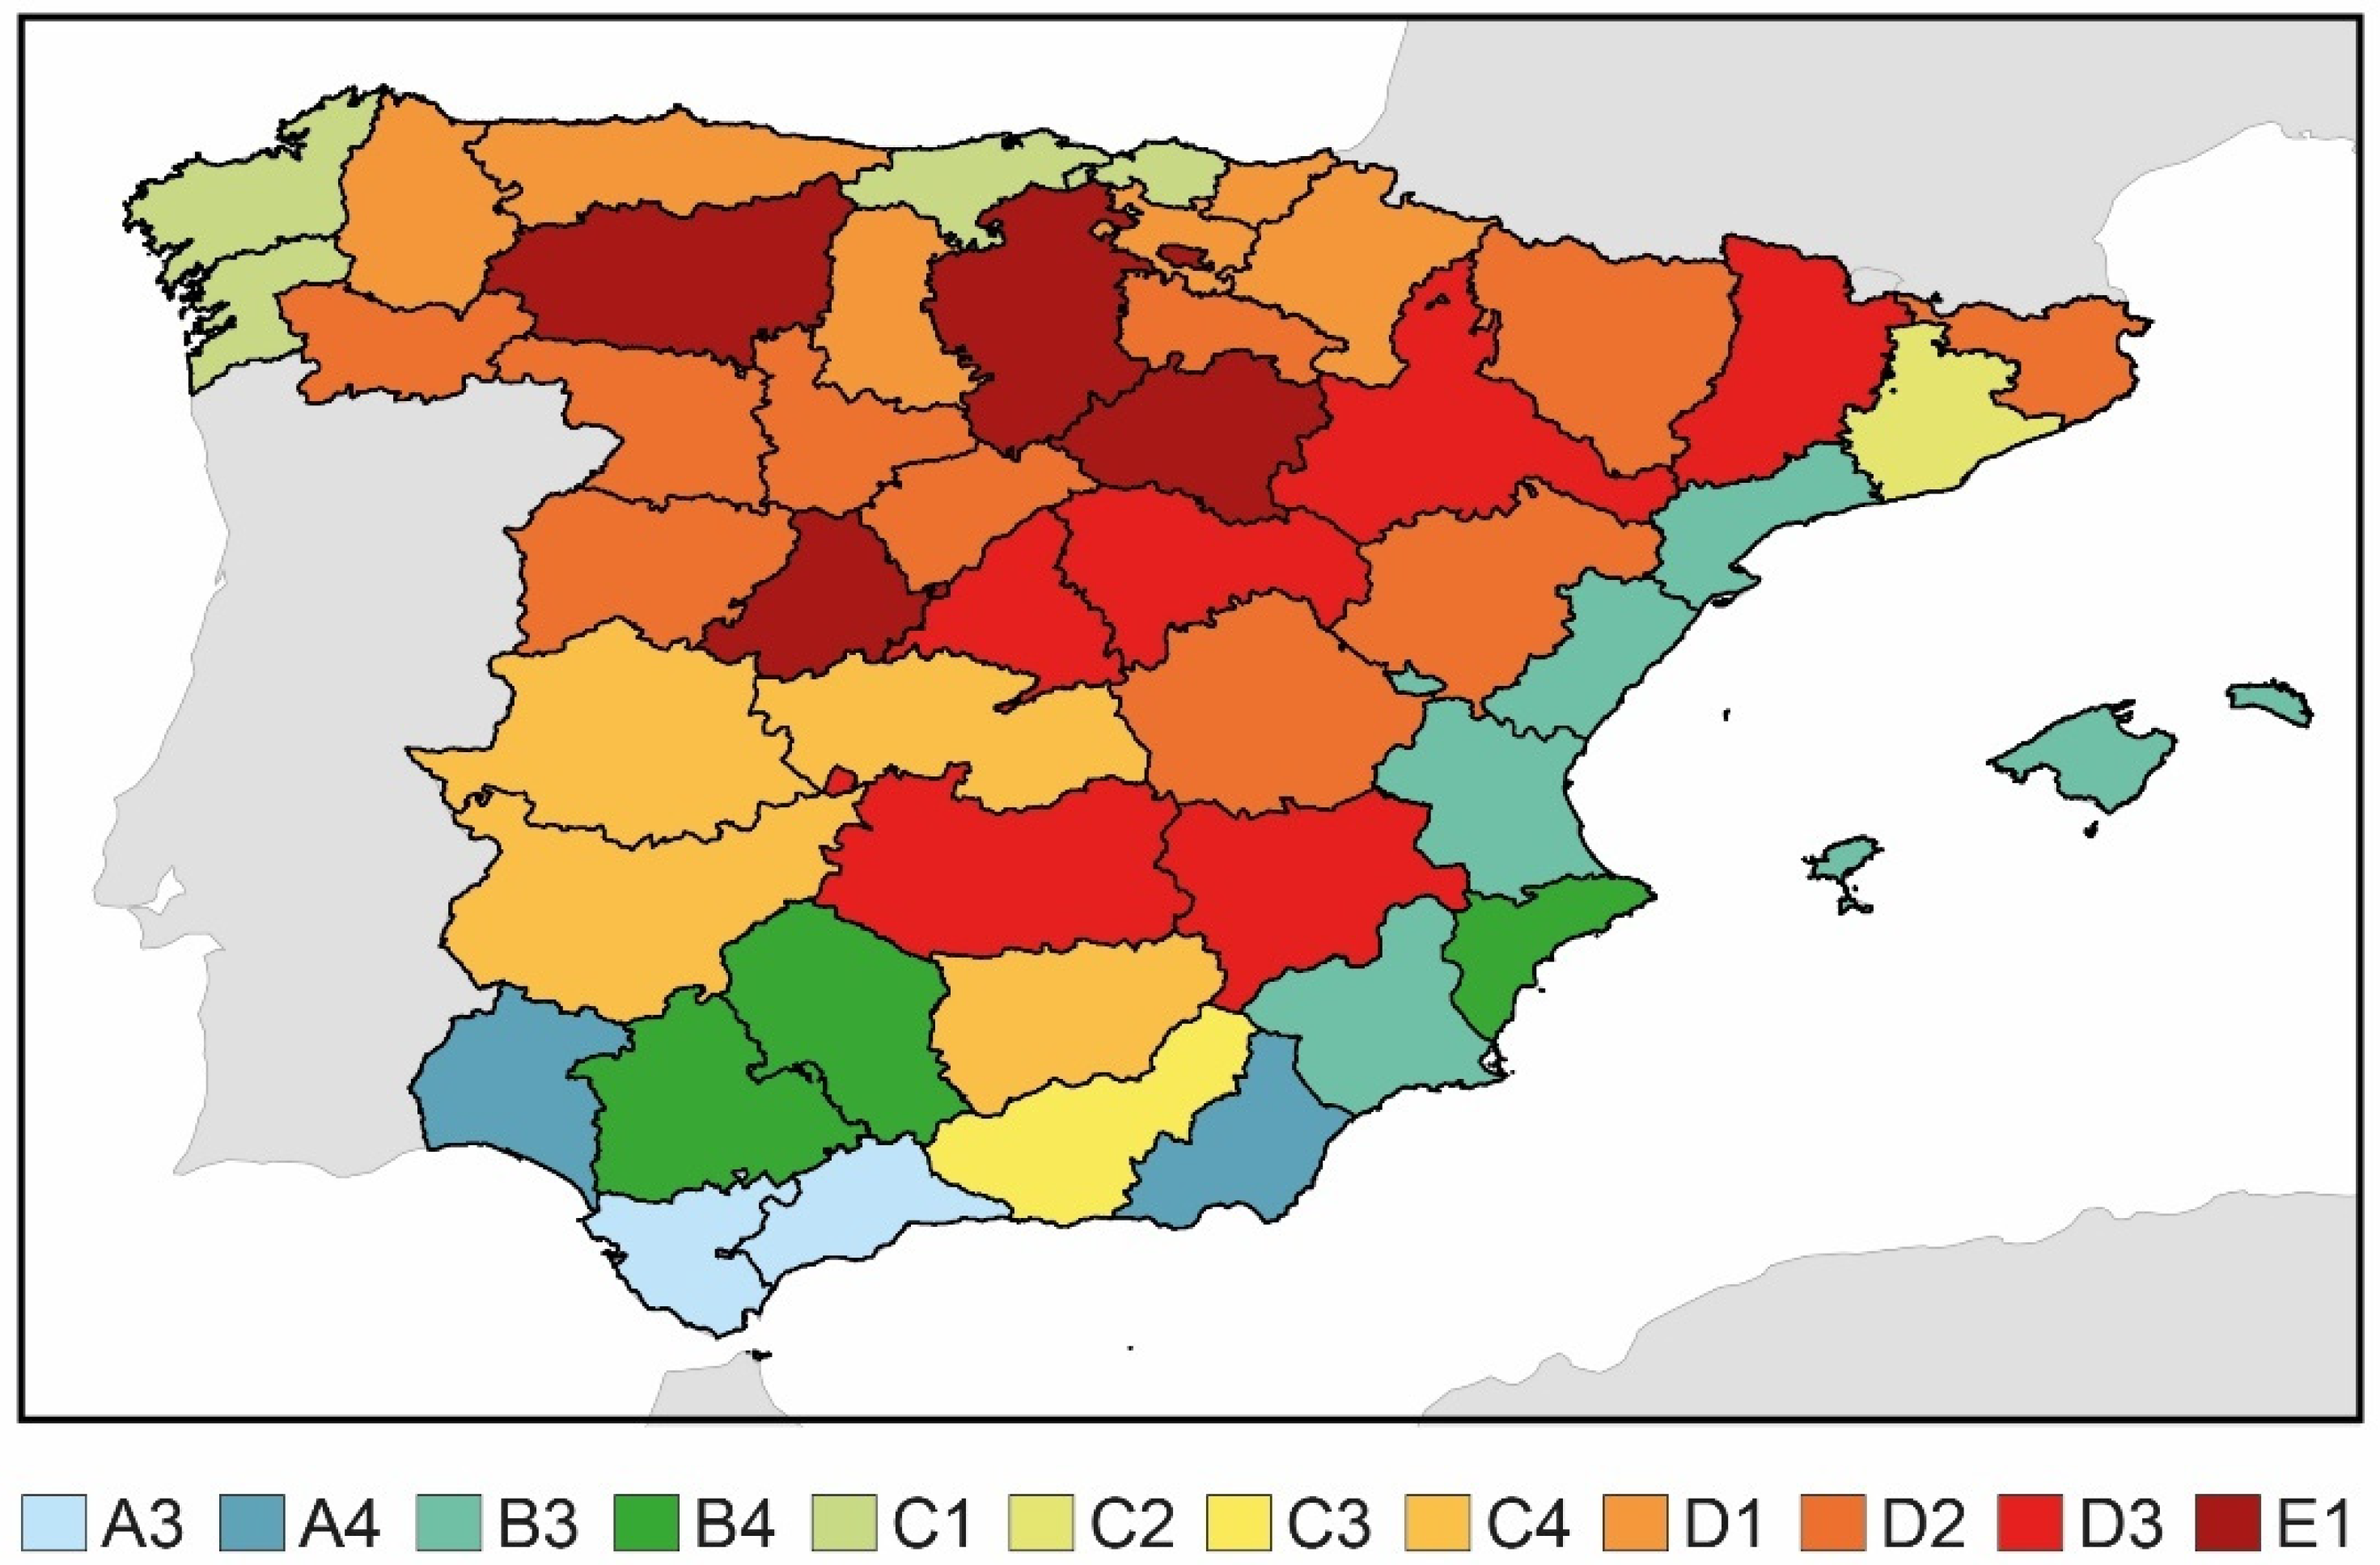
The energy performance obtained in the building was analyzed by improving the façade. However, the energy performance of the building was first assessed in the climate zones in Spain, both in the current scenario and throughout the 21st century, with the A2 climate change scenario. Figure 7 includes the yearly results of the current scenario, and Figure 8 and Figure 9 show the yearly results of the climate change scenario. Two operational patterns were considered according to the new working tendencies as a result of the COVID-19 pandemic: working outside the home and teleworking. According to this operational pattern, the intensity of the energy demand of the building will be greater with teleworking users. An analysis of the results determined how the energy performance of the building in the current scenario was different according to the climate zone, with greater energy consumption in the coldest climate zones. The climate zones with a greater WCS were characterized by obtaining the greatest energy consumption because of the high heating energy consumption. However, the combination of the winter climate zones C and D with zones of high SCS obtained the highest combinations of energy consumption in the country, except zone E1. The climate classification in Spain is made independently for winter and summer, so there could be very cold regions in winter and very hot regions in summer. The climate zones C3, C4, and D3 obtained a greater energy consumption following zone E1. In some regions, high cooling energy consumption could also contribute to high energy consumption at the end of the year. In this regard, zones with a low severity in winter, such as climate zones B3 and B4, obtained high energy consumption values. In general terms, this energy consumption value surpassed 10 MWh, which corresponded to emission values greater than 3.57 t equivalent CO2. Likewise, the significant rise in users teleworking in their dwellings considerably increased the energy consumption of the building. The increase generated in energy consumption with respect to an operational pattern in which individuals worked outside was between 63.5 and 339.8% for cooling energy consumption, between 39.1 and 46% for heating energy consumption, and between 46 and 78.6% of the total energy consumption. Thus, the influence of new working conditions established as a result of the COVID-19 pandemic could significantly influence the energy performance of building stock and the possibility of energy poverty. These results showed that greater use of the building could increase its energy consumption by up to 78.6%, thus generating greater energy expenditure for family units.
Regarding the future tendency of the energy performance of the building, the climate evolution expected throughout the 21st century will progressively reduce heating energy consumption and increase cooling energy consumption. Consequently, the relationship between climate zones and the greatest energy consumption will vary throughout the 21st century, and at the end of the century, the hot zones B3 and B4 will obtain similar values of energy consumption to that of zones D3 and E1, which are the zones with the greatest value in the current scenario. This aspect increased the energy consumption of the hottest zones between 30% and 33%, while reductions between 5% and 17% were obtained in the coldest zones. Thus, it is obvious that the energy performance and impact of Spanish building stock will vary throughout the century, with the buildings located in the hottest climate zones being more important. This aspect will also depend on the operational pattern of users. In general terms, teleworking was found to increase energy consumption between 51.4% and 66.1% by 2050, and between 51.9% and 68.6% by 2100. Thus, new use tendencies could generate a greater environmental impact and greater greenhouse gases emitted to the atmosphere, increasing the effect of climate change.
For this reason, the improvement of the energy performance of the building stock with ECMs is crucial. Both ECMs analyzed in this study significantly reduced energy consumption. Table 6 and Table 7 present the savings in energy consumption obtained with the ECMs when users worked at home, and Table 8 and Table 9 present the savings in energy consumption when users worked outside the home. The application of the ECMs clearly improved the energy performance of the building. In this regard, the application of ETICS with teleworking users obtained savings oscillating between 26.61 and 115.96 MWh in the current scenario, between 21.68 and 104.58 MWh in 2050, and between 29.83 and 93.47 MWh in 2100. This reduction in energy saving was different according to the climate zone, obtaining a greater saving in the coldest zones. Thus, the climate zones D1, D2, and E1 obtained a greater saving in energy consumption, and the hot zones A3 and A4 obtained a lower saving in energy consumption. Another aspect to be emphasized is the differences in the energy saving obtained with plasterboard in comparison with that obtained with ETICS. The energy saving obtained with the plasterboard was lower than that obtained with ETICS, with a percentage reduction in energy savings between 37.5% and 43.7% in the current scenario, between 32.8% and 43.3% in 2050, and between 33.5% and 41.9% in 2100. One of the reasons for this lower energy saving could be the increase generated in the linear thermal transmittance of the slab front with the plasterboard, although both solutions implied a similar improvement in the thermal transmittance of the façade (0.371 W/(m2K) with ETICS and 0.364 W/(m2K) with the plasterboard). The linear thermal transmittance of the slab went from 0.855 W/(mK) in the existing building to 0.124 W/(mK) with ETICS, and with the plasterboard, a value of 0.881 W/(mK) was obtained, resulting in an increase of 0.026 W/(mK) in comparison with the building. Thus, the implementation of ECMs inside, which could be cheaper, could also be less advantageous because of their low effectiveness and could even increase the effect of certain thermal bridges of the building, such as slab fronts. Finally, the possible effect of teleworking in comparison with working outside the home is worth emphasizing. The energy consumption of the building with teleworking was greater than when users worked outside the home, and this aspect also implied that the energy saving obtained in the building was greater when users worked at home. In this regard, teleworking implied that the energy savings presented a percentage increase in comparison to that obtained when users worked outside the home between 66.1% and 145.9% with ETICS and between 15.4% and 209.5% with plasterboard with insulation.
These variations in the savings of energy consumption obtained with the ECMs and the operational patterns affected the payback periods expected with the measures and savings in CO2 emissions. To assess this aspect, the payback period required to recover the economic cost of the implementation of the ECMs was analyzed, as well as the recovery of the energy and CO2 emissions produced by the ECMs in the stages of manufacture, transport, and implementation in the building. As the energy simulation data corresponded to the EPW files generated and were coincident with each decade of the 21st century (e.g., 2030 or 2040), linear interpolations between each decade were conducted to obtain the economic, energy, and CO2 emission savings achieved in each year. Figure 10 shows the number of recovery years required. Recovery periods presented different values according to the climate zone, the type of ECM, and the operational pattern. In general terms, the determinants that allowed greater energy savings to be obtained (cold climate zones and teleworking) contributed to shorter recovery periods. As for the economic recovery, plasterboard was the ECM with the greatest facility of economic recovery due to its low price; thus the years of economic recovery oscillated between 13 and 55 years with teleworking, and between 23 and 71 years with working outside the home (economic recovery was not possible in zone A4). These data contrasted with those of ETICS, which presented longer recovery periods (between 27 and 71 years with teleworking and between 46 and 77 years working outside the home), with difficulties for the economic recovery in many climate zones. However, the possibilities of financing through aid, such as the financing program for energy rehabilitation in the State Housing Plan in Spain, reduced the payback periods of the economic cost of the ECMs. This plan achieved reductions of 40% in the economic cost of the investment, so the amount that users should amortize is 60%. With this reduced value of the economic cost of the ECMs, the payback period obtained with ETICS presented values similar to those obtained with the plasterboard without financing. However, in the plasterboard, the financing reduced the number of years required and the possibility of economic recovery in all the combinations of climate zones and operational patterns. Based on these results, the plasterboard constituted an interesting ECM from an economic point of view because of its possibility of rapid economic recovery in comparison with ETICS. Nevertheless, the recovery of the energy and the CO2 emissions generated in the manufacture, transport, and installation of the ECMs was lower with ETICS. The reasons were as follows: (i) the greatest value of energy and emissions generated by the plasterboard was mainly due to the manufacture of the laminar plaster plate; (ii) the greatest energy saving was achieved with ETICS. The combination of these two aspects meant that the recovery period of CO2 emissions oscillated between 3 and 24 years with ETICS, and between 6 and 44 years with the plasterboard. Finally, and regarding this last aspect, the percentage saving in CO2 emissions achieved with both ECMs in 2050 with respect to emissions in the current scenario was notable. As Table 10 shows, the emission savings obtained with ETICS oscillated between 6.9% and 36.7%, so these values were far from the general goals of 90% set in the roadmap towards a low-carbon economy by the European Union [4]. These results are in accordance with the indications included in various works related to limitations in the modernization of façades [29]. Although the improvement of the envelope clearly reduces the percentage of CO2 emissions of the building, combining this measure with others, such as a more intelligent use of HVAC systems [40], self-consumption [41], and a greater generation of electrical energy with renewable sources at a national scale [42], is required. The combination of these measures, together with the improvement of the envelope, would more easily achieve a low-carbon building stock. Nonetheless, the role of the thermal bridges should be considered in these energy improvements. Based on the results obtained, an improvement of the envelope focusing only on obtaining a low thermal transmittance value could be an inappropriate option if, due to design reasons, the linear thermal transmittance of the thermal bridges is not reduced or is considerably increased. Both ECMs analyzed in this study obtained similar thermal transmittance values, but their effects in terms of energy saving and reduction of CO2 emissions were clearly different because of the effects generated by the thermal bridge of the slab front. For this reason, it is necessary to develop decision-making support systems that consider the possible building improvements from an interdisciplinary perspective [43,44]. These support systems could help architects and engineers to determine the most suitable ECM to achieve the sustainability goals foreseen for the entire building stock of the European Union by 2050.

4. Conclusions

The achievement of a low-carbon building stock by 2050 is among the main challenges of today’s society. For this purpose, one of the lines of action to improve the building stock is dealing with envelopes, which could be significantly influenced by thermal bridges, together with other aspects, such as users’ operational patterns and the climate zone in which the building is located. To study these aspects, the performance of a case study representing a large percentage of the Spanish building stock was assessed in 12 climate zones. Performance was assessed in both the current scenario and throughout the 21st century by using the A2 climate change scenarios. The building was assessed with its original envelope design and two different ECMs: ETICS and plasterboard with insulation.
The results showed that the energy consumption presented by the building with its original design was greater in the coldest climate zones in Spain, and the energy consumption was lower in the other zones. However, these energy consumption values in the current scenario presented variations throughout the 21st century that tended to reduce the heating energy consumption and to increase the cooling energy consumption, so at the end of the 21st century, less cold climate zones (e.g., B3 or B4) achieved similar or greater values than those obtained in the coldest zone in Spain (zone E1). In addition, these energy consumption values could be mitigated by improving the envelope. Important energy saving values were achieved using the two ECMs analyzed in this work. However, the saving values were different between these ECMs, although both achieved similar values in the thermal transmittance of the façade. In quantified data, ETICS achieved reductions between 21.08 and 115.96 MWh, and the plasterboard achieved reductions between 13.87 and 66.24 MWh. This variation was mainly based on the effects generated by both ECMs on the linear thermal transmittance of the slab front of the building. The buildings built with the first energy efficiency regulations of the country were characterized by having thermal insulation in the façade, but their design implied that the linear thermal transmittance of the façade junctions (particularly significant in the slab front) was high. As for the two ECMs presented, ETICS significantly reduced the linear thermal transmittance, but the plasterboard increased the linear thermal transmittance in comparison with the value obtained with the original design of the façade. Although both ECMs could similarly improve the thermal transmittance of the façade, there were different effects on the energy improvement achieved. Therefore, it is crucial to focus on the ECMs presented in the existing buildings, not only on the improvement of the heat transmission of the façade but also on the treatment of the various thermal bridges. Additionally, two other aspects related to the effectiveness of the ECMs should be emphasized: the climate zone of the building and users’ operational pattern. On the one hand, the cold zones obtained a greater energy saving, and the hot zones obtained a low energy saving. On the other hand, users’ operational patterns played an important role in the quantification of the energy saving achieved and the reduction of the environmental impact. The COVID-19 pandemic has led to a new working model through teleworking, thus generating a greater use of buildings in comparison to those users working outside the home. As a result, the energy consumption and the energy savings significantly increased, so the energy savings obtained by improving the envelope could be between 15.4% and 209.5% greater compared to that obtained with teleworking users.
These aspects became more important when the periods were analyzed not just in relation to economic terms, but also in relation to the emissions and the energy consumed by the ECMs in the manufacture, transport, and installation stages. The energy savings obtained with ETICS achieved rapid recovery periods of emissions and energy consumed during the A stages of the life cycle of the ECM, and the recovery periods were greater with the plasterboard. This aspect was opposed to the economic recovery period, in which the plasterboard had a lower economic recovery time. However, if the government establishes financing programs, then an appropriate economic feasibility for the most expensive ECMs, such as ETICS, could be ensured. Thus, the relationship of economic-environmental amortization stresses the importance of ETICS to the detriment of other ECMs, such as plasterboards. The significant reduction of the thermal transmittance and the linear thermal transmittance of thermal bridges considerably influenced the reduction of the energy consumption, thus treating aspects such as CO2 emissions or the energy poverty risk. Nonetheless, the improvement achieved by ETICS was insufficient to achieve the goals of a low-carbon building stock established by the European Union for 2050. In this regard, the reduction percentages achieved in 2050 oscillated between 6.9 and 36.7%, which were far from the goal established by the European Union (90%). The difficulties related to the implementation of nearly zero energy consumption buildings in the south of Europe require the combination of traditional ECMs, such as the improvement of the envelope, with other ECMs, such as the intelligent use of HVAC systems or self-consumption. Further studies will be focused on the analysis of the possibilities of energy savings achieved by combining the improvement of the envelope, the appropriate use of HVAC systems, and self-consumption. In this regard, it is crucial to analyze the importance of photovoltaic systems to achieve a low-carbon building stock in southern European countries.

Funding

This research received no external funding.

Conflicts of Interest

The authors declare no conflict of interest.

References

  1. Attia, S.; Eleftheriou, P.; Xeni, F.; Morlot, R.; Ménézo, C.; Kostopoulos, V.; Betsi, M.; Kalaitzoglou, I.; Pagliano, L.; Cellura, M.; et al. Overview and future challenges of nearly zero energy buildings (nZEB) design in Southern Europe. Energy Build. 2017, 155, 439–458. [Google Scholar] [CrossRef]
  2. European Environment Agency. Final Energy Consumption by Sector and Fuel (2016); European Environment Agency: Copenhagen, Denmark, 2018. [Google Scholar]
  3. European Commission. Action Plan for Energy Efficiency: Realising the Potential; European Commission: Brussels, Belgium, 2006; pp. 1–37. [Google Scholar]
  4. European Commission. A Roadmap for Moving to a Competitive Low Carbon Economy in 2050; European Commission: Brussels, Belgium, 2011. [Google Scholar]
  5. Costa, G.; Sicilia, Á.; Oregi, X.; Pedrero, J.; Mabe, L. A catalogue of energy conservation measures (ECM) and a tool for their application in energy simulation models. J. Build. Eng. 2020, 29. [Google Scholar] [CrossRef]
  6. De Lieto Vollaro, R.; Guattari, C.; Evangelisti, L.; Battista, G.; Carnielo, E.; Gori, P. Building energy performance analysis: A case study. Energy Build. 2015, 87, 87–94. [Google Scholar] [CrossRef]
  7. Escorcia, O.; García, R.; Trebilcock, M.; Celis, F.; Bruscato, U. Envelope improvements for energy efficiency of homes in the south-central Chile. Inf. La Construcción 2012, 64, 563–574. [Google Scholar] [CrossRef] [Green Version]
  8. Friedman, C.; Becker, N.; Erell, E. Energy retrofit of residential building envelopes in Israel: A cost-benefit analysis. Energy 2014, 77, 183–193. [Google Scholar] [CrossRef]
  9. Pacheco, R.; Ordóñez, J.; Martínez, G. Energy efficient design of building: A review. Renew. Sustain. Energy Rev. 2012, 16, 3559–3573. [Google Scholar] [CrossRef]
  10. Aksoy, U.T.; Inalli, M. Impacts of some building passive design parameters on heating demand for a cold region. Build. Environ. 2006, 41, 1742–1754. [Google Scholar] [CrossRef]
  11. Güçyeter, B.; Günaydin, H.M. Optimization of an envelope retrofit strategy for an existing office building. Energy Build. 2012, 55, 647–659. [Google Scholar] [CrossRef] [Green Version]
  12. Invidiata, A.; Lavagna, M.; Ghisi, E. Selecting design strategies using multi-criteria decision making to improve the sustainability of buildings. Build. Environ. 2018, 139, 58–68. [Google Scholar] [CrossRef]
  13. Qian, D.; Li, Y.; Niu, F.; O’Neill, Z. Nationwide savings analysis of energy conservation measures in buildings. Energy Convers. Manag. 2019, 188, 1–18. [Google Scholar] [CrossRef]
  14. Theodosiou, T.G.; Papadopoulos, A.M. The impact of thermal bridges on the energy demand of buildings with double brick wall constructions. Energy Build. 2008, 40, 2083–2089. [Google Scholar] [CrossRef]
  15. Theodosiou, T.; Tsikaloudaki, K.; Bikas, D. Analysis of the thermal bridging effect on ventilated facades. Procedia Environ. Sci. 2017, 38, 397–404. [Google Scholar] [CrossRef]
  16. Ramalho de Freitas, J.; Grala da Cunha, E. Thermal bridges modeling in South Brazil climate: Three different approaches. Energy Build. 2018, 169, 271–282. [Google Scholar] [CrossRef]
  17. Ge, H.; McClung, V.R.; Zhang, S. Impact of balcony thermal bridges on the overall thermal performance of multi-unit residential buildings: A case study. Energy Build. 2013, 60, 163–173. [Google Scholar] [CrossRef]
  18. Evola, G.; Margani, G.; Marletta, L. Energy and cost evaluation of thermal bridge correction in Mediterranean climate. Energy Build. 2011, 43, 2385–2393. [Google Scholar] [CrossRef]
  19. Bienvenido-Huertas, D.; Quiñones, J.A.F.; Moyano, J.; Rodríguez-Jiménez, C.E. Patents analysis of thermal bridges in slab fronts and their effect on energy demand. Energies 2018, 11, 2222. [Google Scholar] [CrossRef] [Green Version]
  20. Thibodeau, C.; Bataille, A.; Sié, M. Building rehabilitation life cycle assessment methodology–state of the art. Renew. Sustain. Energy Rev. 2019, 103, 408–422. [Google Scholar] [CrossRef]
  21. Coelho, G.B.A.; Silva, H.E.; Henriques, F.M.A. Impact of climate change in cultural heritage: From energy consumption to artefacts’ conservation and building rehabilitation. Energy Build. 2020, 110250. [Google Scholar] [CrossRef]
  22. Mikulic, D.; Slijepcevic, S.; Buturac, G. Energy renovation of multi apartment buildings: Contributions to economy and climate changes. Energy Build. 2020, 224. [Google Scholar] [CrossRef]
  23. Verichev, K.; Zamorano, M.; Carpio, M. Effects of climate change on variations in climatic zones and heating energy consumption of residential buildings in the southern Chile. Energy Build. 2020, 215, 109874. [Google Scholar] [CrossRef]
  24. Felgueiras, M.; Caetano, N. ZELab: Planning a living lab to educate modern engineering professionals. In Proceedings of the Proceedings of the Sixth International Conference on Technological Ecosystems for Enhancing Multiculturality, Salamanca, Spain, 24–26 October 2018; pp. 535–540. [Google Scholar]
  25. European Union. Directive 2010/31/EU of the European Parliament and of the Council of 19 May 2010 on the Energy Performance of Buildings; European Union: Brussels, Belgium, 2010; Volume 153, pp. 13–35. [Google Scholar]
  26. Kawashima, T.; Nomura, S.; Tanoue, Y.; Yoneoka, D.; Eguchi, A.; Shi, S.; Miyata, H. The relationship between fever rate and telework implementation as a social distancing measure against the COVID-19 pandemic in Japan. Public Health 2020. [Google Scholar] [CrossRef]
  27. Thomson, H.; Bouzarovski, S.; Snell, C. Rethinking the measurement of energy poverty in Europe: A critical analysis of indicators and data. Indoor Built Environ. 2017, 26, 879–901. [Google Scholar] [CrossRef]
  28. Kurtz, F.; Monzón, M.; López-Mesa, B. Energy and acoustics related obsolescence of social housing of Spain’s post-war in less favoured urban areas. The case of Zaragoza. Inf. La Construcción 2015, 67, m021. [Google Scholar] [CrossRef]
  29. Bienvenido-Huertas, D.; Sánchez-García, D.; Rubio-Bellido, C. Comparison of energy conservation measures considering adaptive thermal comfort and climate change in existing Mediterranean dwellings. Energy 2020, 190. [Google Scholar] [CrossRef]
  30. CYPE Ingenieros SA. Construction Price Generator 2020; CYPE Ingenieros, SA: Madrid, Spain, 2020; Available online: http://www.generadordeprecios.info/#gsc.tab=0 (accessed on 8 February 2020).
  31. The Government of Spain. CO2 Emission Factors and Transition Coefficients to Primary Energy from Different Final Energy Sources Consumed in the Building Sector in Spain; The Government of Spain: Madrid, Spain, 2016.
  32. Nakićenović, N.; Swart, R. Special Report on Emissions Scenarios. A Special Report of Working Group III of the Intergovernmental Panel on Climate Change; Cambridge University Press: Cambridge, UK, 2000; ISBN 0-521-8008-1. [Google Scholar]
  33. The Government of Spain. Royal Decree 314/2006. Approving the Spanish Technical Building Code; The Government of Spain: Madrid, Spain, 2013.
  34. HTFlux HTFlux Hygric and Thermal Simulation. Available online: https://www.htflux.com/en/ (accessed on 31 July 2018).
  35. International Organization for Standardization. ISO 10211:2017—Thermal Bridges in Building Construction—Heat Flows and Surface Temperatures—Detailed Calculations; International Organization for Standardization: Geneva, Switzerland, 2017. [Google Scholar]
  36. López-Ochoa, L.M.; Las-Heras-Casas, J.; López-González, L.M.; Olasolo-Alonso, P. Towards nearly zero-energy buildings in Mediterranean countries: Energy Performance of Buildings Directive evolution and the energy rehabilitation challenge in the Spanish residential sector. Energy 2019, 176, 335–352. [Google Scholar] [CrossRef]
  37. D’Agostino, D.; Zangheri, P.; Castellazzi, L. Towards nearly zero energy buildings in Europe: A focus on retrofit in non-residential buildings. Energies 2017, 10, 117. [Google Scholar] [CrossRef]
  38. Besir, A.B.; Cuce, E. Green roofs and facades: A comprehensive review. Renew. Sustain. Energy Rev. 2018, 82, 915–939. [Google Scholar] [CrossRef]
  39. Kuznik, F.; David, D.; Johannes, K.; Roux, J.J. A review on phase change materials integrated in building walls. Renew. Sustain. Energy Rev. 2011, 15, 379–391. [Google Scholar] [CrossRef] [Green Version]
  40. Bienvenido-Huertas, D.; Sánchez-García, D.; Pérez-Fargallo, A.; Rubio-Bellido, C. Optimization of energy saving with adaptive setpoint temperatures by calculating the prevailing mean outdoor air temperature. Build. Environ. 2020, 170. [Google Scholar] [CrossRef]
  41. Luthander, R.; Nilsson, A.M.; Widén, J.; Åberg, M. Graphical analysis of photovoltaic generation and load matching in buildings: A novel way of studying self-consumption and self-sufficiency. Appl. Energy 2019, 250, 748–759. [Google Scholar] [CrossRef]
  42. García-Gusano, D.; Iribarren, D. Prospective energy security scenarios in Spain: The future role of renewable power generation technologies and climate change implications. Renew. Energy 2018, 126, 202–209. [Google Scholar] [CrossRef]
  43. Mela, K.; Tiainen, T.; Heinisuo, M. Comparative study of multiple criteria decision making methods for building design. Adv. Eng. Inform. 2012, 26, 716–726. [Google Scholar] [CrossRef]
  44. Carli, R.; Dotoli, M.; Pellegrino, R.; Ranieri, L. Using multi-objective optimization for the integrated energy efficiency improvement of a smart city public buildings’ portfolio. In Proceedings of the 2015 IEEE International Conference on Automation Science and Engineering (CASE), Gothenburg, Sweden, 24–28 August 2015; pp. 21–26. [Google Scholar]
Figure 1. Flowchart of the research.
Energies 13 04499 g001
Figure 2. The case study analyzed.
Energies 13 04499 g002
Figure 3. Thermography with thermal bridges found in the building.
Energies 13 04499 g003
Figure 4. Climate zones in Spain according to the Spanish Technical Building Code.
Energies 13 04499 g004
Figure 5. Model of the case study in DesignBuilder.
Energies 13 04499 g005
Figure 6. Simulation and linear thermal transmittance (Ψ) values of the thermal bridges in the building (both with the building envelope and the two improvements of the façade).
Energies 13 04499 g006
Figure 7. Annual energy consumption of the building without improving its envelope in the current scenario.
Energies 13 04499 g007
Figure 8. Energy consumption of the building without improving its envelope throughout the 21st century and considering an operational pattern based on teleworking users.
Energies 13 04499 g008
Figure 9. Energy consumption of the building without improving its envelope throughout the 21st century and considering an operational pattern based on users working outside the home.
Energies 13 04499 g009
Figure 10. Periods of economic recovery, carbon dioxide emissions, and the energy related to the implementation of the ECMs. Whether the cost of the ECMs is conducted with or without financing is distinguished in the economic recovery period. Likewise, the graphs show the influence of the operational pattern of the user on recovery periods (working outside the home or teleworking).
Energies 13 04499 g010
Table 1. Thermal properties of the façade layers of the building.
LayersThickness (m)Thermal Resistance ((m2K)/W)Thermal Transmittance (W/(m2K))
Cement mortar0.010.010.73
Perforated brick0.110.19
Cement mortar0.010.01
Insulation0.020.67
Air gap0.040.18
Hollow brick0.050.11
Gypsum plaster0.010.03
Table 2. Energy conservation measures (ECMs) analyzed in the research.
ECMDescriptionThermal Transmittance
(W/(m2K))
Investment (€)
External thermal insulation composite systems (ETICS)Insulation with mineral wool of 5 cm (λ = 0.038 W/(mK))0.371496,256.35
Internal plasterboard with insulationInsulation with mineral wool of 5 cm (λ = 0.037 W/(mK))0.364142,544.19
Table 3. Equivalent carbon dioxide emissions and energy consumed during manufacture, transport, and construction stages of the ECMs.
ECMStage of the Life Cycle
ManufactureConstruction
A1-A2-A3A4A5
Energy Added (MJ/m2)Equivalent
CO2 Emissions (kg/m2)
Energy Added (MJ/m2)Equivalent
CO2 Emissions (kg/m2)
Energy Added (MJ/m2)Equivalent
CO2 Emissions (kg/m2)
ETICS234.73318.10810.1580.7520.390.052
Plasterboard with insulation460.76827.5948.2890.6130.1320.017
Table 4. Climate classification related to winter climate severity (WCS) and summer climate severity (SCS).
ClassValueClassValue
A 0 < W C S 0.23 1 S C S 0.50
B 0.23 < W C S 0.50 2 0.50 < S C S 0.83
C 0.50 < W C S 0.93 3 0.83 < S C S 1.38
D 0.93 < W C S 1.51 4 S C S > 1.38
E W C S > 1.51
Table 5. Operational profiles.
ModeLoads/Setpoint Temperatures0:00–6:5907:00–7:5908:00–18:5919:00–22:5923:00–23:59
Working outside the homeOccupancy load (W/m2)3.51003.513.51
Equipment load (W/m2)4.40004.404.40
Lighting load (W/m2)4.40004.404.40
Heating setpoint temperature (°C)17--2017
Cooling setpoint temperature (°C)27--2527
TeleworkingOccupancy load (W/m2)3.513.513.513.513.51
Equipment load (W/m2)4.402.204.404.404.40
Lighting load (W/m2)4.402.204.404.404.40
Heating setpoint temperature (°C)1720202017
Cooling setpoint temperature (°C)2725252527
Table 6. Energy saving obtained with ETICSS considering an operational pattern based on teleworking.
ZoneSavings in Annual Energy Consumption (MWh)
Current 20302040205020602070208020902100
A3−37.91−31.44−31.08−32.43−31.94−33.01−34.99−38.11−37.90
A4−26.61−22.81−21.08−21.68−24.12−24.27−25.77−29.45−29.83
B3−46.22−41.64−40.52−37.47−41.01−42.03−41.33−44.06−46.63
B4−45.26−48.73−48.05−49.78−50.70−52.03−52.04−55.60−55.94
C1−67.04−60.81−58.69−54.61−49.34−45.49−46.88−42.65−42.51
C2−59.89−55.81−54.02−52.66−51.20−48.25−48.61−47.79−48.12
C3−78.00−45.96−44.01−44.99−43.74−48.16−44.58−49.34−49.74
C4−73.53−62.37−59.98−60.61−57.75−56.56−54.91−57.38−56.31
D1−80.70−74.11−70.43−66.07−64.05−58.15−55.31−51.80−49.20
D2−67.53−72.94−69.23−69.28−64.77−66.57−63.23−62.30−63.93
D3−95.16−92.75−89.92−88.29−87.44−86.01−83.72−77.87−79.92
E1−115.96−111.26−105.34−104.58−100.94−97.44−91.99−89.05−93.47
Table 7. Energy savings obtained with the plasterboard considering an operational pattern based on teleworking.
ZoneSavings in Annual Energy Consumption (MWh)
Current 20302040205020602070208020902100
A3−23.71−19.37−19.54−20.29−20.03−20.60−22.12−24.09−23.94
A4−16.53−14.83−13.87−14.58−16.24−16.40−17.54−19.74−19.83
B3−28.56−25.10−24.74−23.08−25.62−26.38−26.02−27.77−28.98
B4−28.00−29.34−28.70−29.77−30.63−31.56−31.60−33.74−33.96
C1−38.96−35.48−33.84−31.85−28.88−26.96−28.33−25.71−25.79
C2−35.63−33.07−32.28−31.65−31.14−29.61−30.19−29.59−29.85
C3−44.14−27.28−26.57−27.09−26.21−29.38−27.54−30.17−30.27
C4−42.95−36.77−35.96−36.18−34.59−34.18−33.69−35.23−34.17
D1−45.66−42.35−40.17−37.44−36.54−33.51−32.36−30.60−29.06
D2−38.03−41.98−40.00−40.26−37.90−39.47−37.84−37.82−38.47
D3−54.43−53.55−52.06−51.41−50.97−50.60−49.85−46.64−47.79
E1−66.24−62.94−60.05−59.32−57.58−55.28−52.95−51.79−54.35
Table 8. Energy savings obtained with ETICS considering an operational pattern based on users working outside the home.
ZoneSavings in Annual Energy Consumption (MWh)
Current 20302040205020602070208020902100
A3−21.09−16.14−15.01−15.90−15.22−14.75−15.40−17.10−17.33
A4−14.76−9.81−8.71−8.81−10.62−11.30−12.72−15.13−15.75
B3−25.42−24.44−23.17−21.14−23.55−24.43−23.63−25.96−27.15
B4−24.49−27.34−26.02−27.14−26.76−26.86−27.03−28.57−29.02
C1−38.94−36.18−34.87−32.24−29.71−27.00−27.36−24.48−24.68
C2−34.84−31.88−30.50−29.86−28.48−26.86−27.27−25.95−26.01
C3−45.47−25.69−24.41−24.41−22.96−25.61−23.27−26.04−25.71
C4−42.15−35.51−33.21−32.76−31.28−30.54−29.77−31.50−30.45
D1−48.06−44.12−42.26−39.65−37.21−34.13−32.39−30.40−29.02
D2−40.58−43.10−40.72−40.15−37.21−37.95−35.06−35.25−36.01
D3−55.71−54.19−51.80−50.98−50.02−49.15−47.07−43.97−45.52
E1−67.50−66.55−62.94−62.59−60.12−57.33−53.83−52.31−54.42
Table 9. Energy savings obtained with plasterboard considering an operational pattern of users working outside the home.
ZoneSavings in Annual Energy Consumption (MWh)
Current 20302040205020602070208020902100
A3−14.32−11.37−10.95−11.47−11.46−11.48−12.29−13.21−13.29
A4−9.73−8.36−7.99−8.13−9.08−9.41−9.72−11.11−11.43
B3−17.18−15.46−14.99−14.30−15.39−15.89−15.10−15.43−15.89
B4−17.16−17.54−17.06−17.91−17.81−18.11−17.80−18.17−18.65
C1−22.02−20.16−19.48−17.96−17.01−15.84−16.57−15.56−15.98
C2−21.11−19.12−18.72−18.55−18.09−17.60−17.98−17.37−17.63
C3−26.30−16.61−15.97−16.50−15.84−17.38−16.49−17.73−17.64
C4−25.33−21.74−20.77−20.65−19.87−19.50−19.44−20.27−19.43
D1−26.08−24.17−22.97−21.69−20.56−19.02−18.64−17.74−17.13
D2−22.60−24.82−23.51−23.54−22.59−23.44−21.81−21.72−22.14
D3−32.29−31.53−30.55−30.20−30.13−30.11−29.19−27.48−28.70
E1−38.13−36.75−35.19−35.04−33.93−32.77−31.53−31.13−32.42
Table 10. Percentage of reduction of CO2 emissions in 2050 in comparison with emissions in the current scenario.
ZonePercentage of Reduction of CO2 Emissions (%)
TeleworkingWorking Outside the Home
ETICSPlasterboardETICSPlasterboard
A37.12.85.83.2
A4−17.4−20.6−28.4−29.0
B318.414.017.113.8
B46.91.34.50.4
C137.229.538.430.8
C220.414.020.214.8
C329.725.331.328.3
C421.315.320.916.2
D136.727.238.830.1
D216.78.314.97.2
D321.012.817.910.9
E127.918.925.817.4

