Article

Thermal Analysis of Dry-Type Air-Core Coils for the Optimization of Passive Filtering Systems

by
Josué Rodríguez D.
1,*,
G. Alonso Orcajo
2,
José M. Cano
2,
Joaquín G. Norniella
2 and
Asier Vicente
1
1
Basque Country Research Centre of Arcelor Mittal, 48910 Sestao, Spain
2
Electrical Engineering Department, University of Oviedo, 33204 Gijón, Spain
*
Author to whom correspondence should be addressed.
Energies 2020, 13(17), 4540; https://doi.org/10.3390/en13174540
Submission received: 15 July 2020 / Revised: 10 August 2020 / Accepted: 31 August 2020 / Published: 2 September 2020
(This article belongs to the Special Issue Harmonics and Quality of Power)

Abstract

:
The analysis of harmonic currents in distribution networks of industrial facilities and the associated filtering stages is essential to optimize the production of these installations. Dry-type air-core reactors are one of the main elements of harmonic filter banks. A thermal analysis of these reactors in conventional steel plants and an evaluation of the criteria used to adjust the corresponding thermal protections are proposed in this paper. Accordingly, harmonic currents through the different filter branches are assessed. The proposed methodology builds a thermal magnetic model using the finite element method (FEM) whereby electromagnetic fields, currents and losses are emulated, to allow for recreating the actual coil temperature. The study aims at increasing the reliability of filtering systems by lowering the number of unscheduled shutdowns due to conservative adjustments of thermal protections.

Graphical Abstract

1. Introduction

Energy efficiency is considered a strategic pillar of industry. From the 1980s until the early 1990s, steel production plants—which belong to the industrial sector with the highest energy demand in numerous countries—predominantly employed passive filtering and compensation systems for power quality enhancement [1,2,3]. These solution are sensitive to spurious tripping of their thermal protections [4,5]. Despite the technological advances achieved in the field of power electronics, countless plants of different industrial sectors are still operating under this configuration. Therefore, studies aimed at improving the efficiency and productivity of steel plants by analysing the response of the said protections to harmonic currents are undoubtedly of the greatest interest.
Dry-type air-core reactors are commonly used in the filtering and compensation systems. The study of the temperature reached by these coils is an important concern due to its influence on the behavior of the protection system. International Electrotechnical Commission (IEC)and Institute of Electrical and Electronics Engineers (IEEE) standard tests for determining temperatures and hot spots are conceived to be applied at the surface of these components because the windings of dry-type air-core reactors tend to be fully encapsulated, direct access to the said windings is thus inviable [6,7]. Nevertheless, it is possible to measure the surface temperature of the windings with some degree of accuracy.
The study of the temperature reached by the coil is of great interest. There exist different strategies to predict its value:
  • The average temperature rise method, which cannot reveal the hot spots.
  • The finite difference method (FDM), which cannot compute the local fluid temperature or obtain the hot spots despite describing the heat transfer process.
  • The finite element method (FEM), which is the best option to obtain a detailed distribution of the temperatures in the coil.
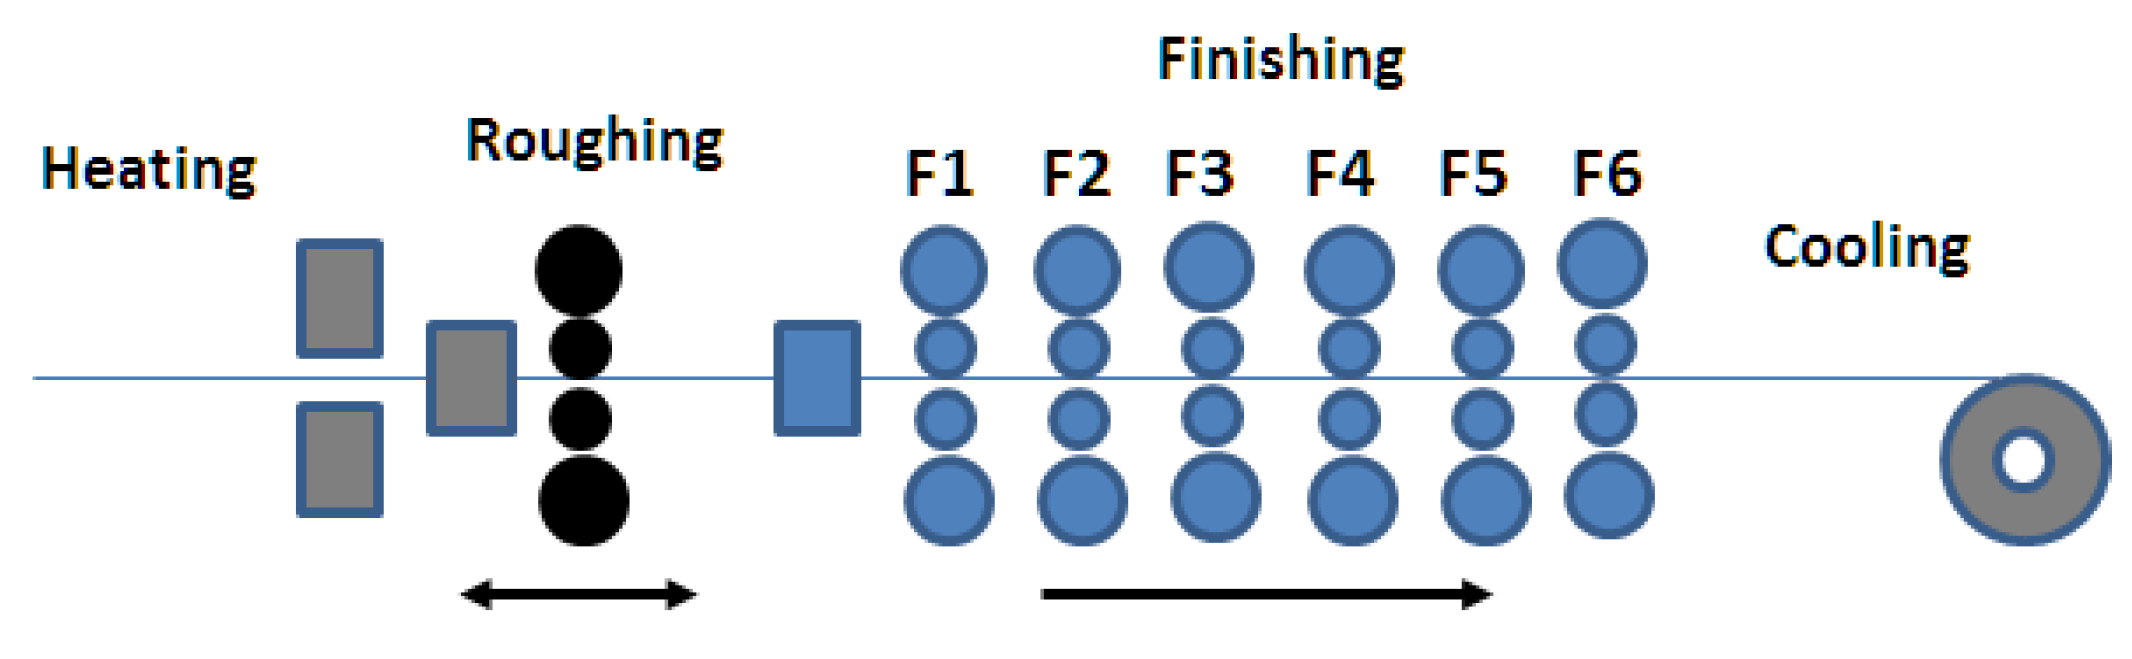
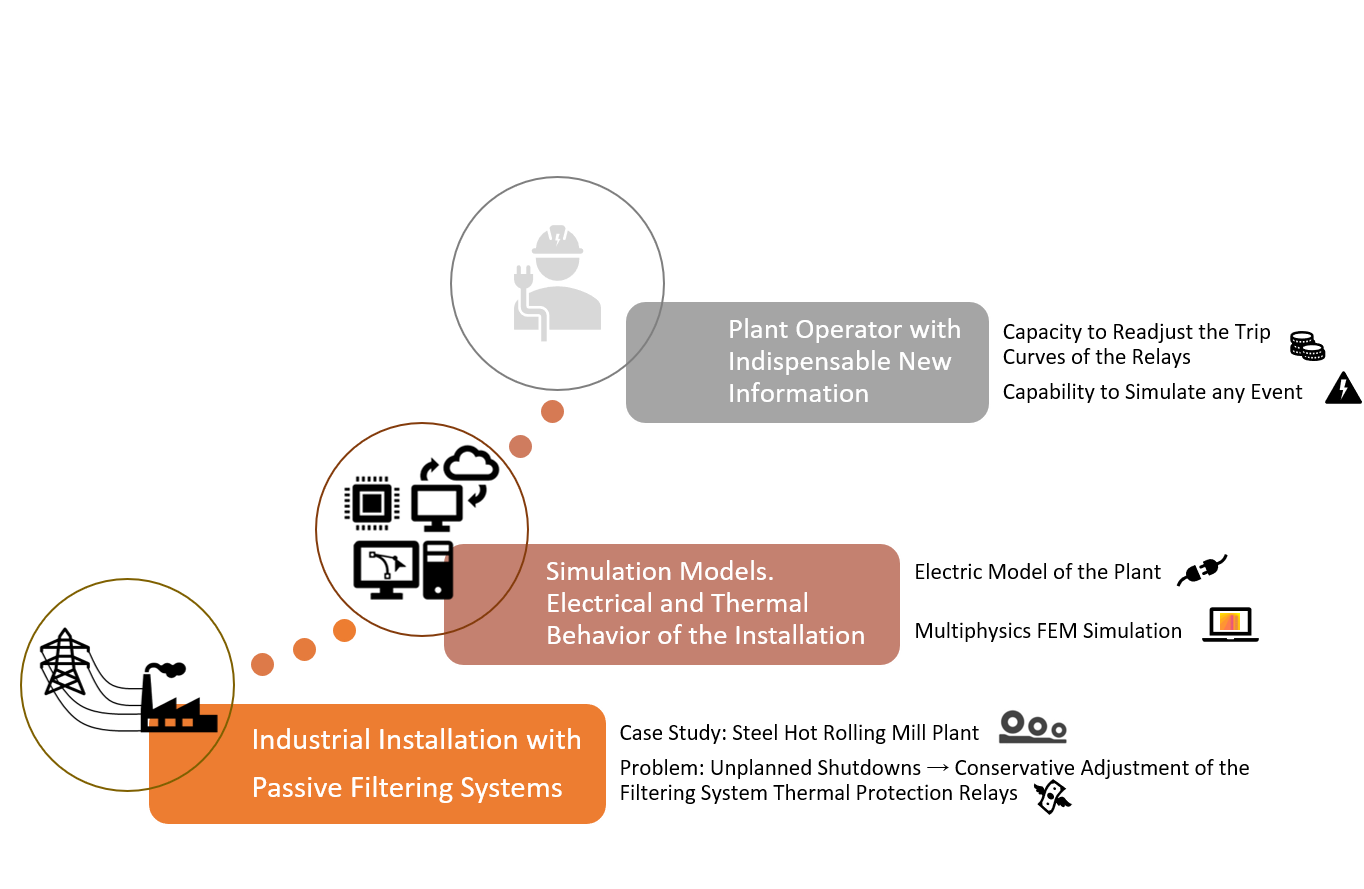
The use of the FEM to determine the thermal behavior of the coils provides an insight into the performance of the installation [8]. This new knowledge may eventually lead to a reduction of unscheduled shutdowns, often caused by a conservative adjustment of protections. The reduction in the number of scheduled shutdowns may result, in turn, in a significant increase of production and decline of economic losses.
The passive filtering system ensures reactive power compensation and harmonic attenuation. The undesired tripping of any of the filter branches can lead to an abnormal operation of the rolling mill drives and to a breach of total harmonic distortion (THD) or voltage limits. All the mentioned drawbacks can result in penalty charges.
In this paper, a study aimed at optimizing the tripping thresholds of overload protection devices associated to filter banks is proposed. Although the study is conducted in steel plants, the analysis of the problem, suggested methodology and proposed solution are applicable to any industrial sector using this type of passive systems. A simplified model of the plant is developed to estimate the current distribution in the dry-type air-core coils of the filter banks. An equivalent 60 Hz current, causing the same thermal effects of the distorted real current, is calculated. Reactors are characterized according to their physical and electrical features. Then, the FEM is used to conduct magnetic simulations which allow the calculation of coil losses. In the next step, heat flow simulations are performed by using the previous losses as a heat source to obtain the temperature of the reactor windings. The study of the reactor temperature is undertaken by using FEMM software (FEMM 4.2, 30 April 2020, David Meeker, Waltham, MA, USA) [9]. FEMM is a suite of programs for solving low frequency electromagnetic problems on two-dimensional planar and axisymmetric domains. The program currently addresses linear/nonlinear magnetostatics problems, linear/nonlinear time harmonic magnetic problems, linear electrostatic problems, and steady-state heat flow problems. Finally, the operation of the overload protection devices is discussed under real operating conditions and in the context of the calculated windings temperature.
The harmonics absorbed by the filter are largely responsible for the temperature overloads experienced by the filter coils. Harmonic injection is a function of the operating conditions of the plant and the characteristics of the drives [4,10,11]. Since the main objective of the paper is based on the analysis of the role of the filtering banks during working conditions, evaluating the current and voltage harmonics associated with the normal operation of the drives of the steel plant is crucial. For the selected rolling mill plant, drives are 12-pulse three-phase cycloconverters, the spectrum of the supply currents contains frequency harmonics at multiples of 12k ± 1 times the grid frequency, around which there are two sidebands dependent on the output frequency of the cycloconverter, that, in turn, depends on the motor speed and the number of pole pairs [12,13].
The relays that monitor the temperature of the filter coils assess that temperature indirectly from the measurement of the currents flowing through them. Occasionally, these relays are analog and utilize the measurement of the root mean square (RMS) values of various current harmonic components to determine whether the coil is overloaded or not. Analog relays are robust, the adjustment of their tripping thresholds being based on both the manufacturer recommendations, and the experience of the plant operator. In other cases, relays are intelligent electronic devices capable of obtaining the thermal image of the coil from the measurement of the current harmonics, and the estimation of the electrical resistance at each frequency, the thermal resistance with respect to the circulating air, the thermal capacity and the ambient temperature. These relays are more flexible and assess the response of the coil founded on a remarkably approximate thermal model [14,15,16].
The rest of this paper is structured as follows. Section 2 describes the general characteristics of the industrial plant. Section 3 details the proposed study and the associated calculations. Section 4 summarizes the results. Finally, Section 5 depicts the conclusion reached from the proposed approach.

2. Case Study

A hot rolling mill plant with the typical layout of the 1990s is considered in this work. As shown in Figure 1, the plant comprises one roughing and six finishing mill stands. The roughing mill consists of two stands, one at the top and another one at the bottom. These stands, from the roughing mill and the three first finishing stands, are driven by circulating-current-free, double cascade-connected cycloconverters. On the other hand, the remaining three finishing stands are driven by circulating-current cycloconverters [13], which enable an increase in the reactive power demand at low loads. Therefore, reactive power overcompensation at the point of common coupling (PCC), i.e., upstream from the filtering systems, can be avoided. All the drives are equipped with synchronous motors which are fed by the cycloconverters using field-oriented control (FOC). The rated parameters of these devices can be seen in Table 1.
As it is shown in Figure 2, the plant under study is connected to a 138 kV, 60 Hz, 3250 MVA power distribution network through a 75 MVA, 138/34.5 kV transformer. The global passive filter is designed to improve the harmonic response and enables the compensation of 45 Mvar at 34.5 kV [4].

3. Proposed Study and Calculations

The steps followed in this work to analyze dry-type air-core reactors are shown in Figure 3 and can be summarized as: (a) Building of a simplified electric model of the plant, (b) characterization of the coil and validation using FEM-based simulations and (c) use of multiphysics simulations to obtain the thermal behavior of the coil under real operating conditions. Although the first step has already been described in detail in previous works [4,10], a general review is presented in this paper for the benefit of the reader.
The creation of the models enables the determination of the temperature reached by the coil. An algorithm to assess the distribution of currents and the effects of harmonics on the dry-type air-core coil through a thermal model is developed. This model has dynamic capabilities to analyze the effect of transient events, e.g., those caused by the variability of the load.

3.1. Electric Model of the Plant

The main stands of the mill, the filter banks and the power network are modelled through MATLAB/Simulink (MATLAB 2019b, MathWorks, Natick, MA, USA) [17]. A detailed Simulink model including the eight rolling stands enables the calculation of their respective current demands from the expected rolling conditions. The model reproduces the interaction between the stands, the filtering stage and the network. A simplified single-phase model suitable for analysing filtering stages is designed according to Figure 4a. Figure 4b shows an equivalent circuit to that in Figure 4a which facilitates the analysis of the current through the coil because all the elements are connected in parallel. The current through the coil can be calculated by applying the superposition principle. Moreover, the trigger of overload protections is emulated by disconnecting the corresponding filtering branch when the set limits are exceeded.

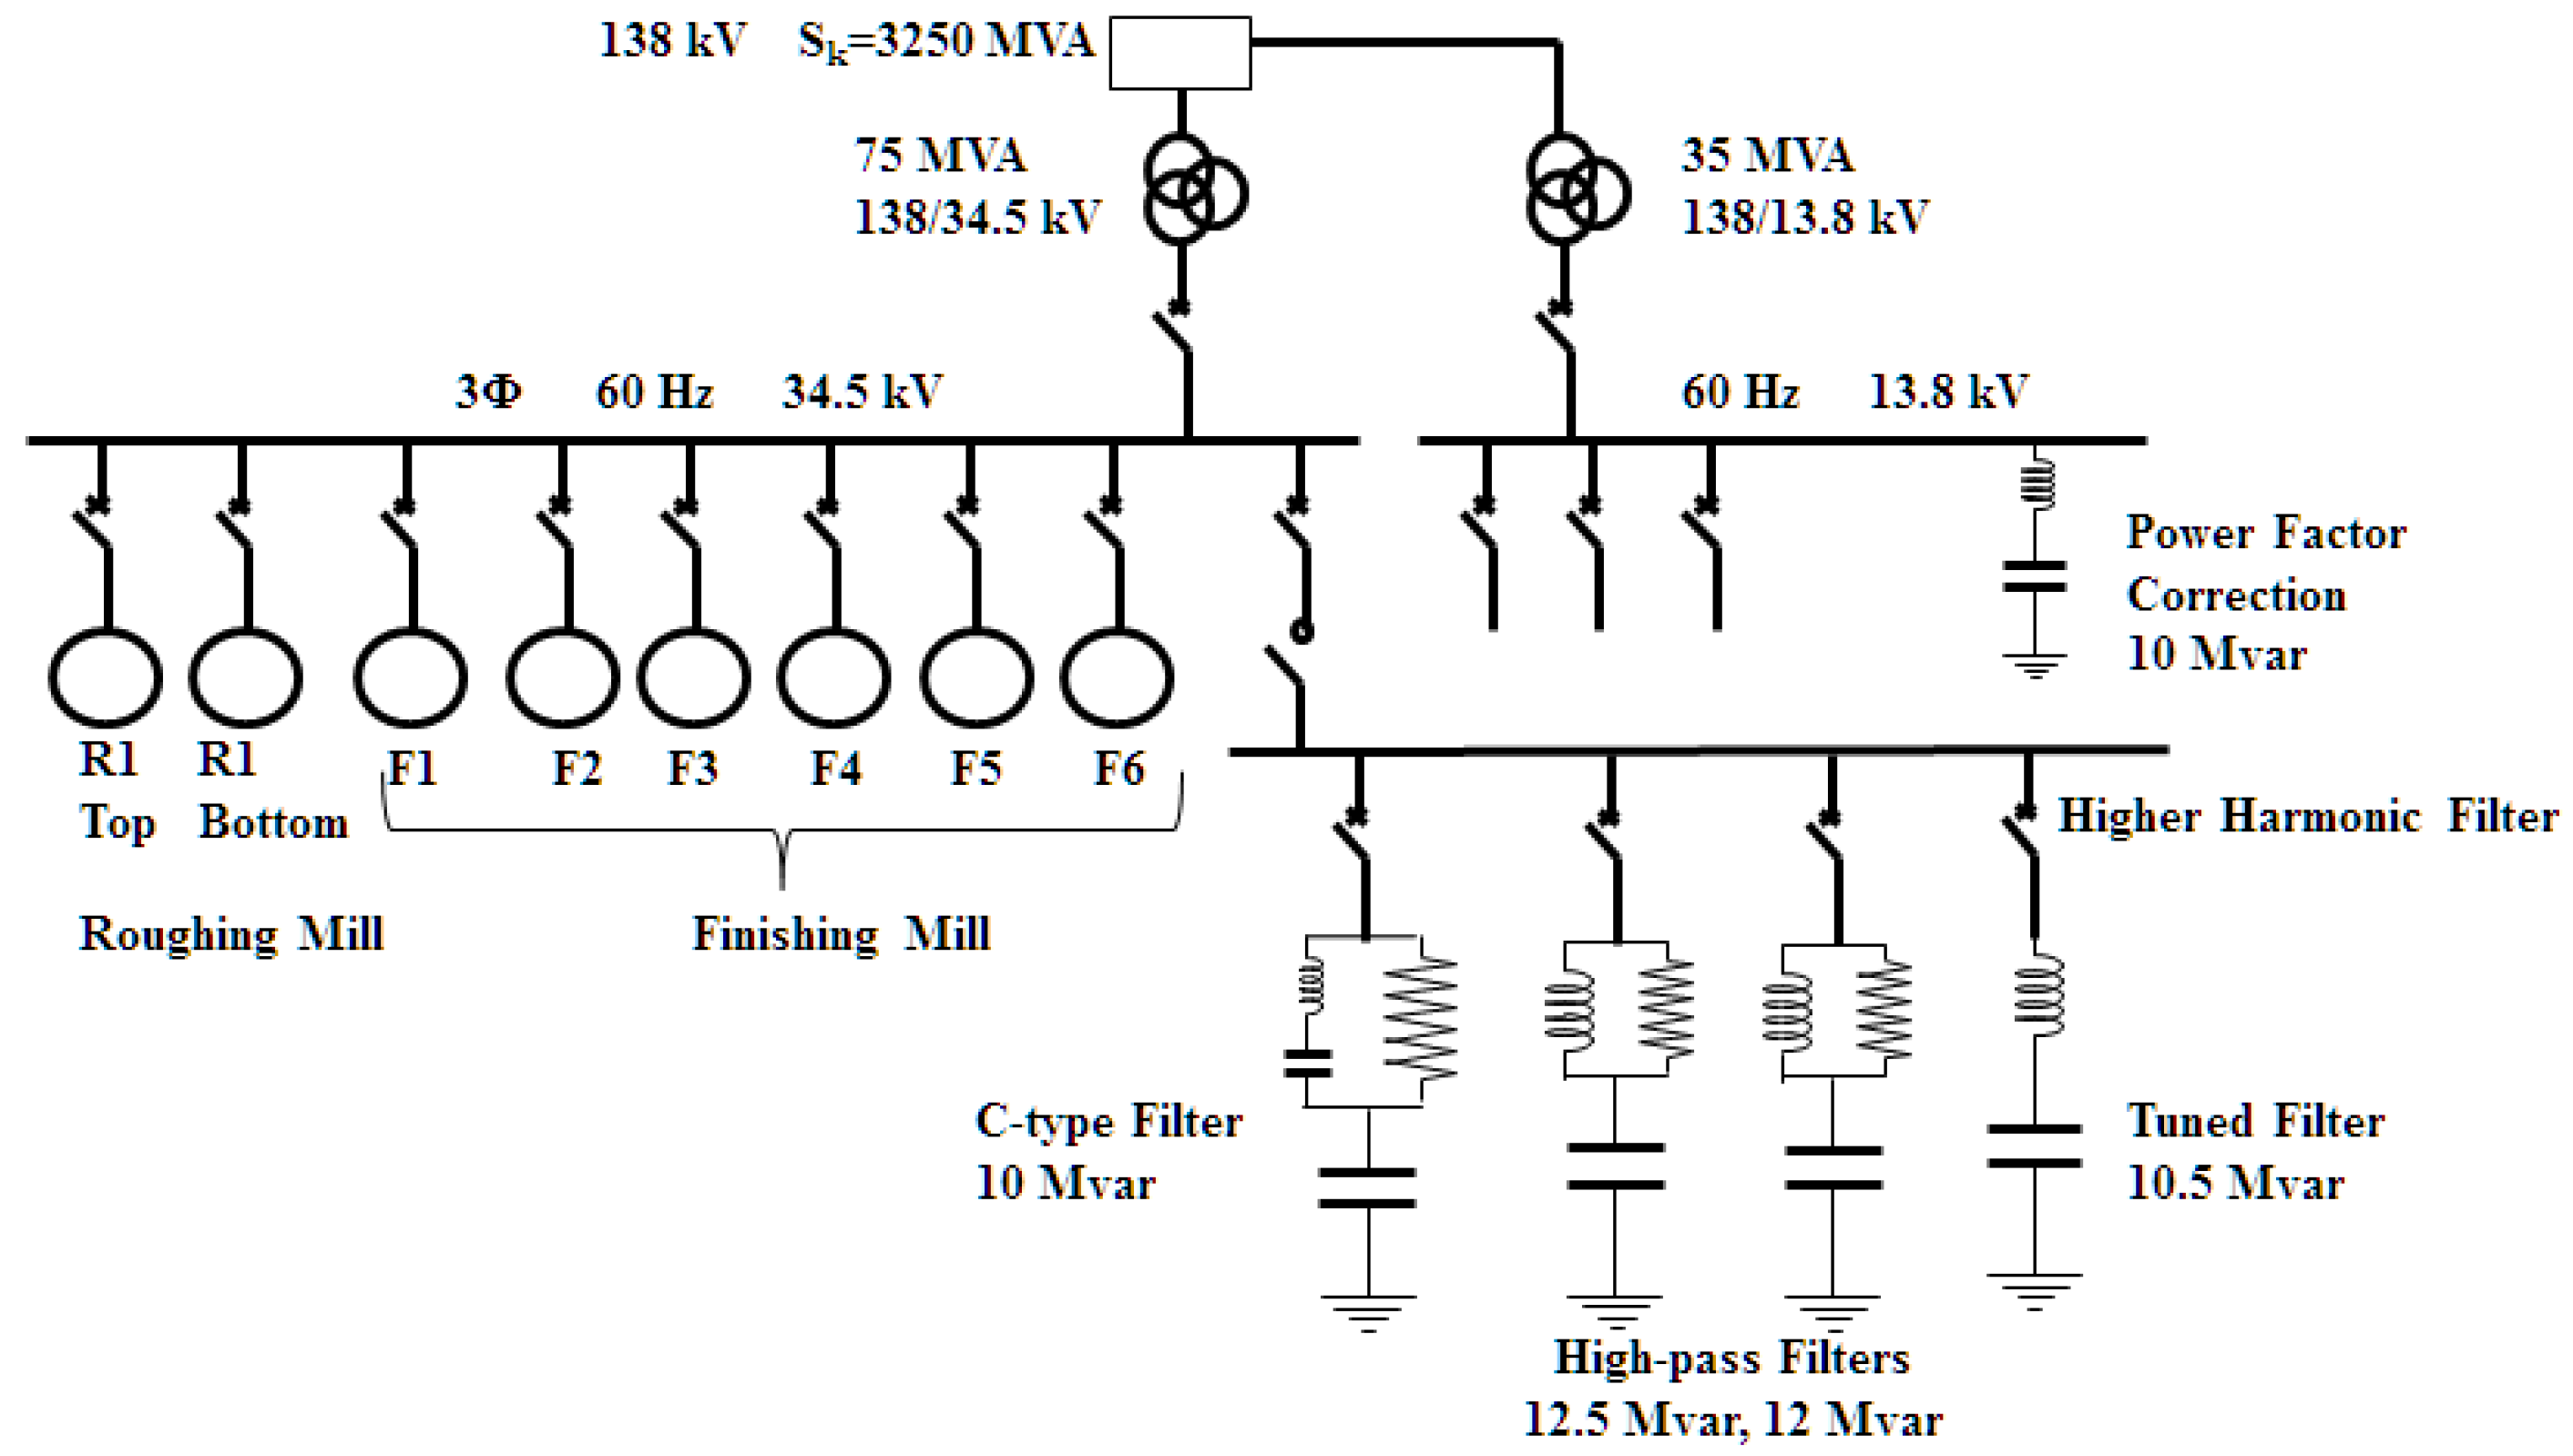
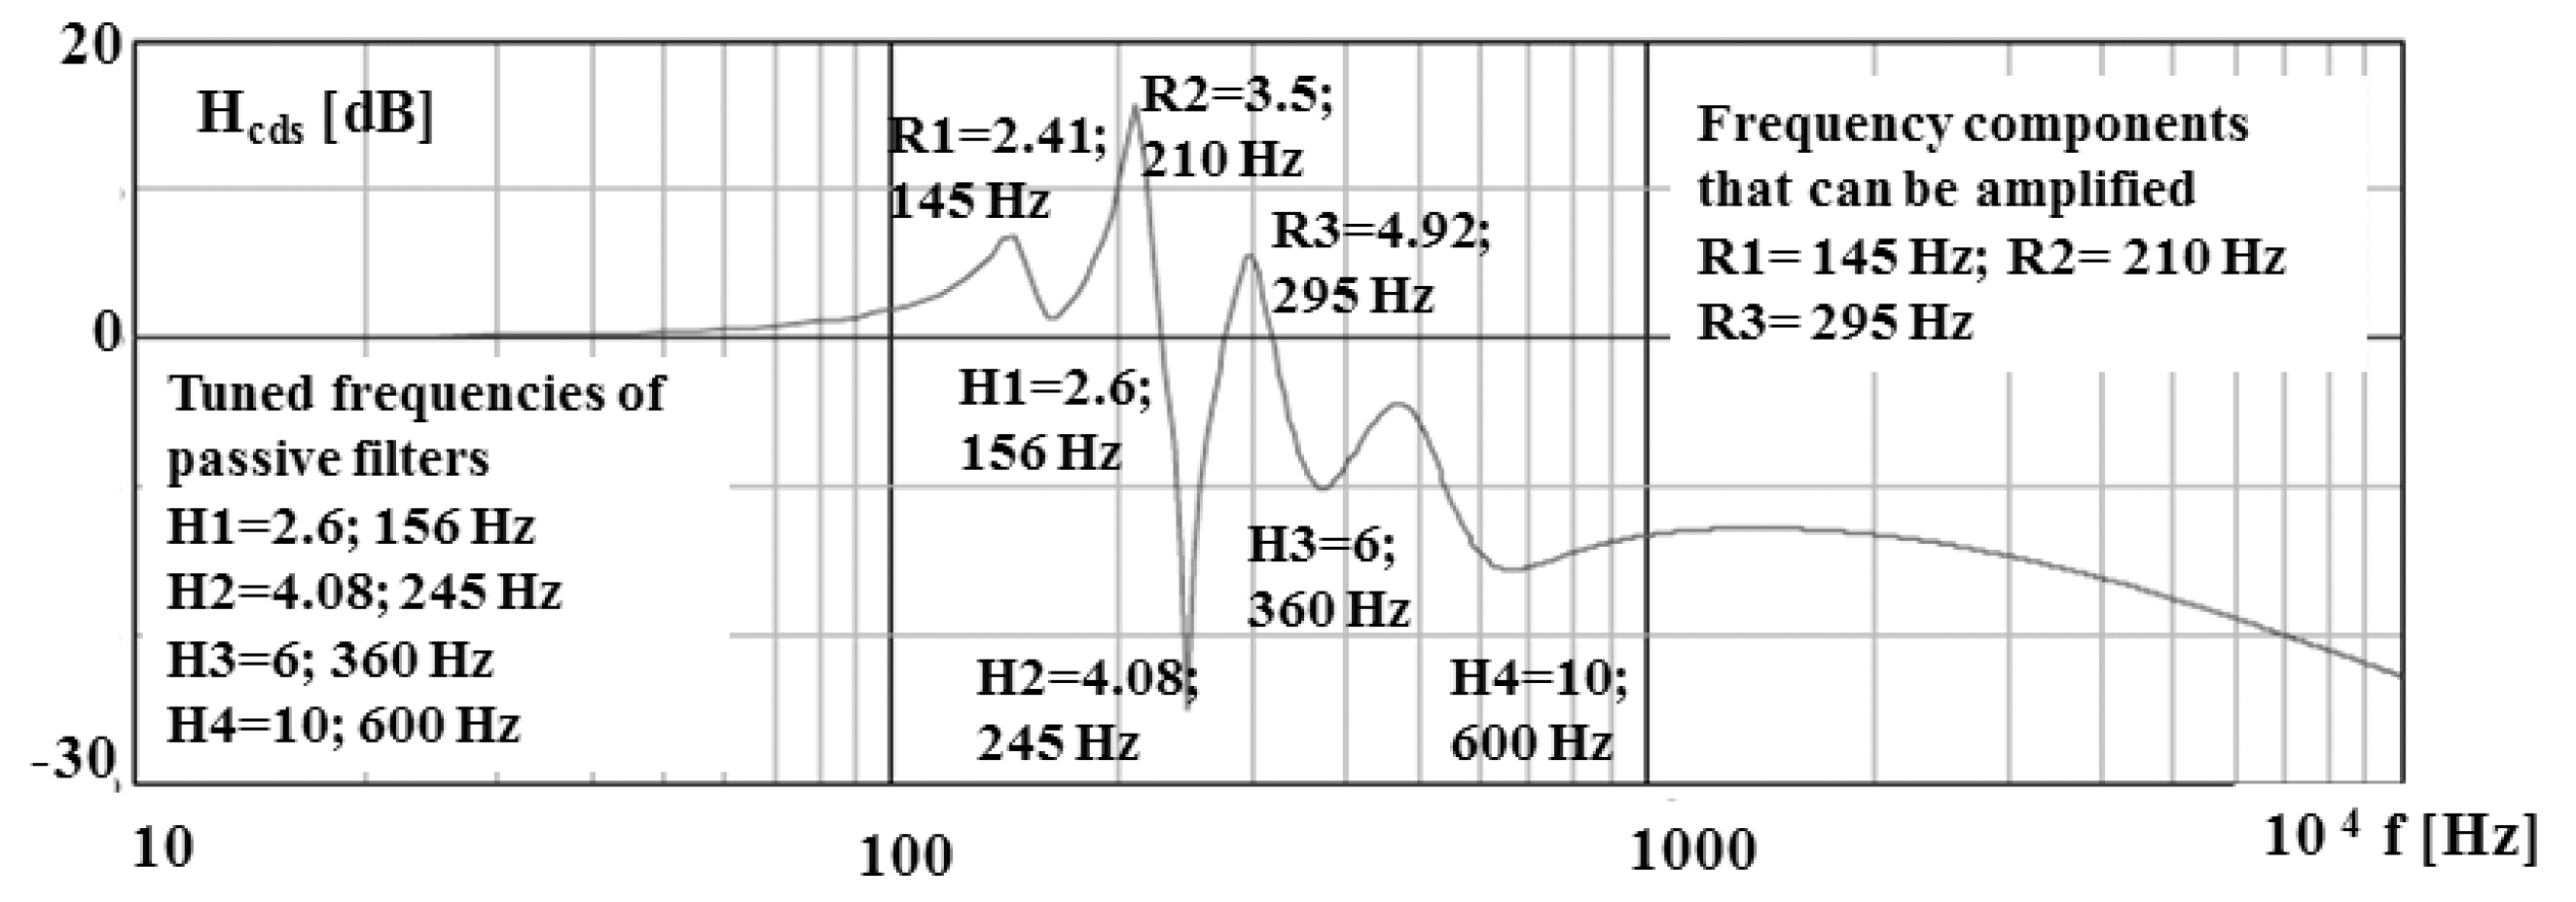
3.1.1. Distribution Network Topology and Filtering System

The characteristics of the passive filtering system are presented in Table 2. This system is designed both to achieve reactive power compensation at the fundamental frequency and to limit harmonic distortion at the PCC. The rated voltage of the filters is 34.5 kV.
The current harmonic injection of the installation is a function of the operating conditions, especially those affecting the rolling mill drives. These drives are 12-pulse three-phase cycloconverters, and thus, the current drawn from the network contains harmonics related with frequencies located at multiples of 12 times the grid frequency, fi. Around these frequencies, two sidebands appear, which are dependent on the output frequency of the cycloconverters, f0. The latter frequency, in turn, depends on the motor speed and the number of pole pairs [10].
An analysis of the behavior of the complete system was conducted in [4,10]. The impedance of the different filter branches and the short-circuit impedance at the PCC (Zs = 0.199 + 1.615j Ω) are considered in this study. Several critical cases are detected and analyzed [10,11].
Table 3 shows the characteristics of the main current harmonics caused by the use of the drives. Uncharacteristic 5th- and 7th-order harmonics appear due to non-ideal nature of the drives supply voltage. The presence of the fifth harmonic is one of the main sources of overload. The fifth harmonic at the 6th-order high-pass filter (case study) is 2.25 times higher than that flowing through the load. The first pass of the slab through the roughing mill (at t = 288 s) increases the impact of the said harmonic. In fact, the 5th-order harmonic current is amplified under normal operating conditions (see Figure 5). Figure 6 shows the peak value of the current and the THD of the voltage upstream from the PCC, with and without filter bank.

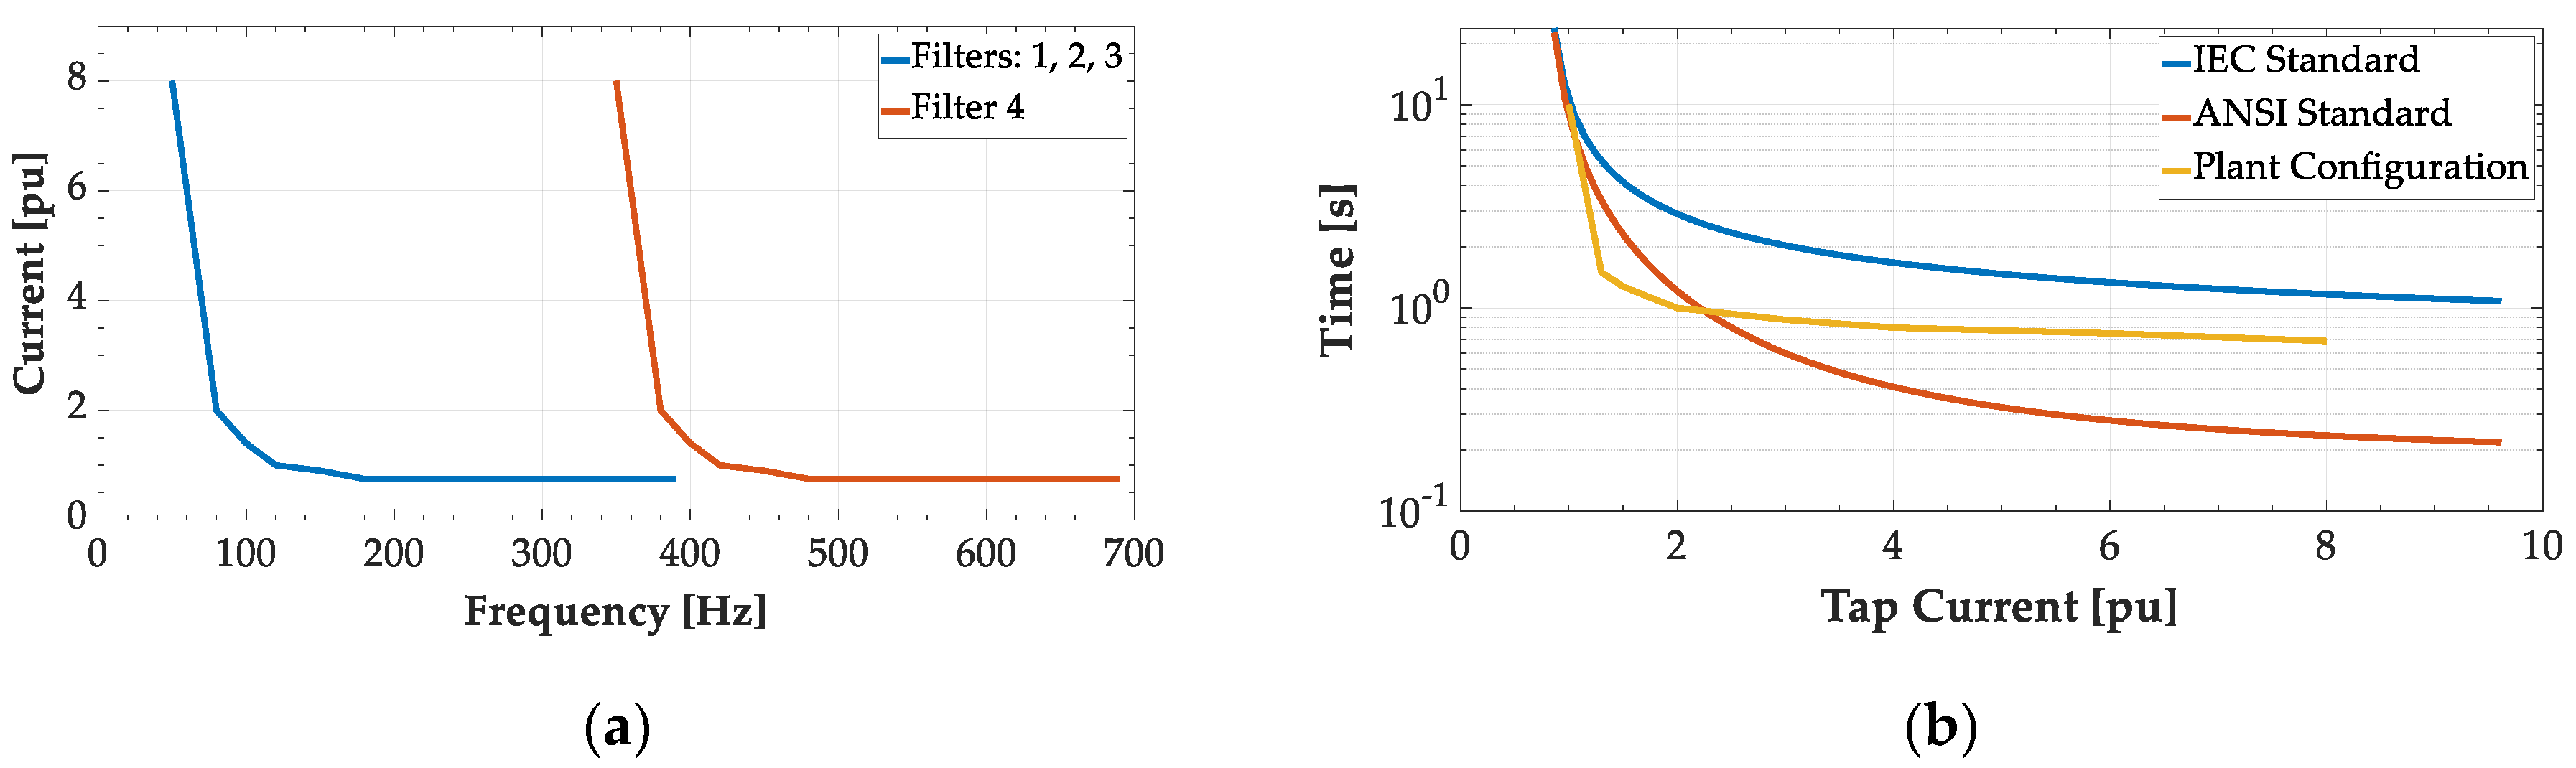
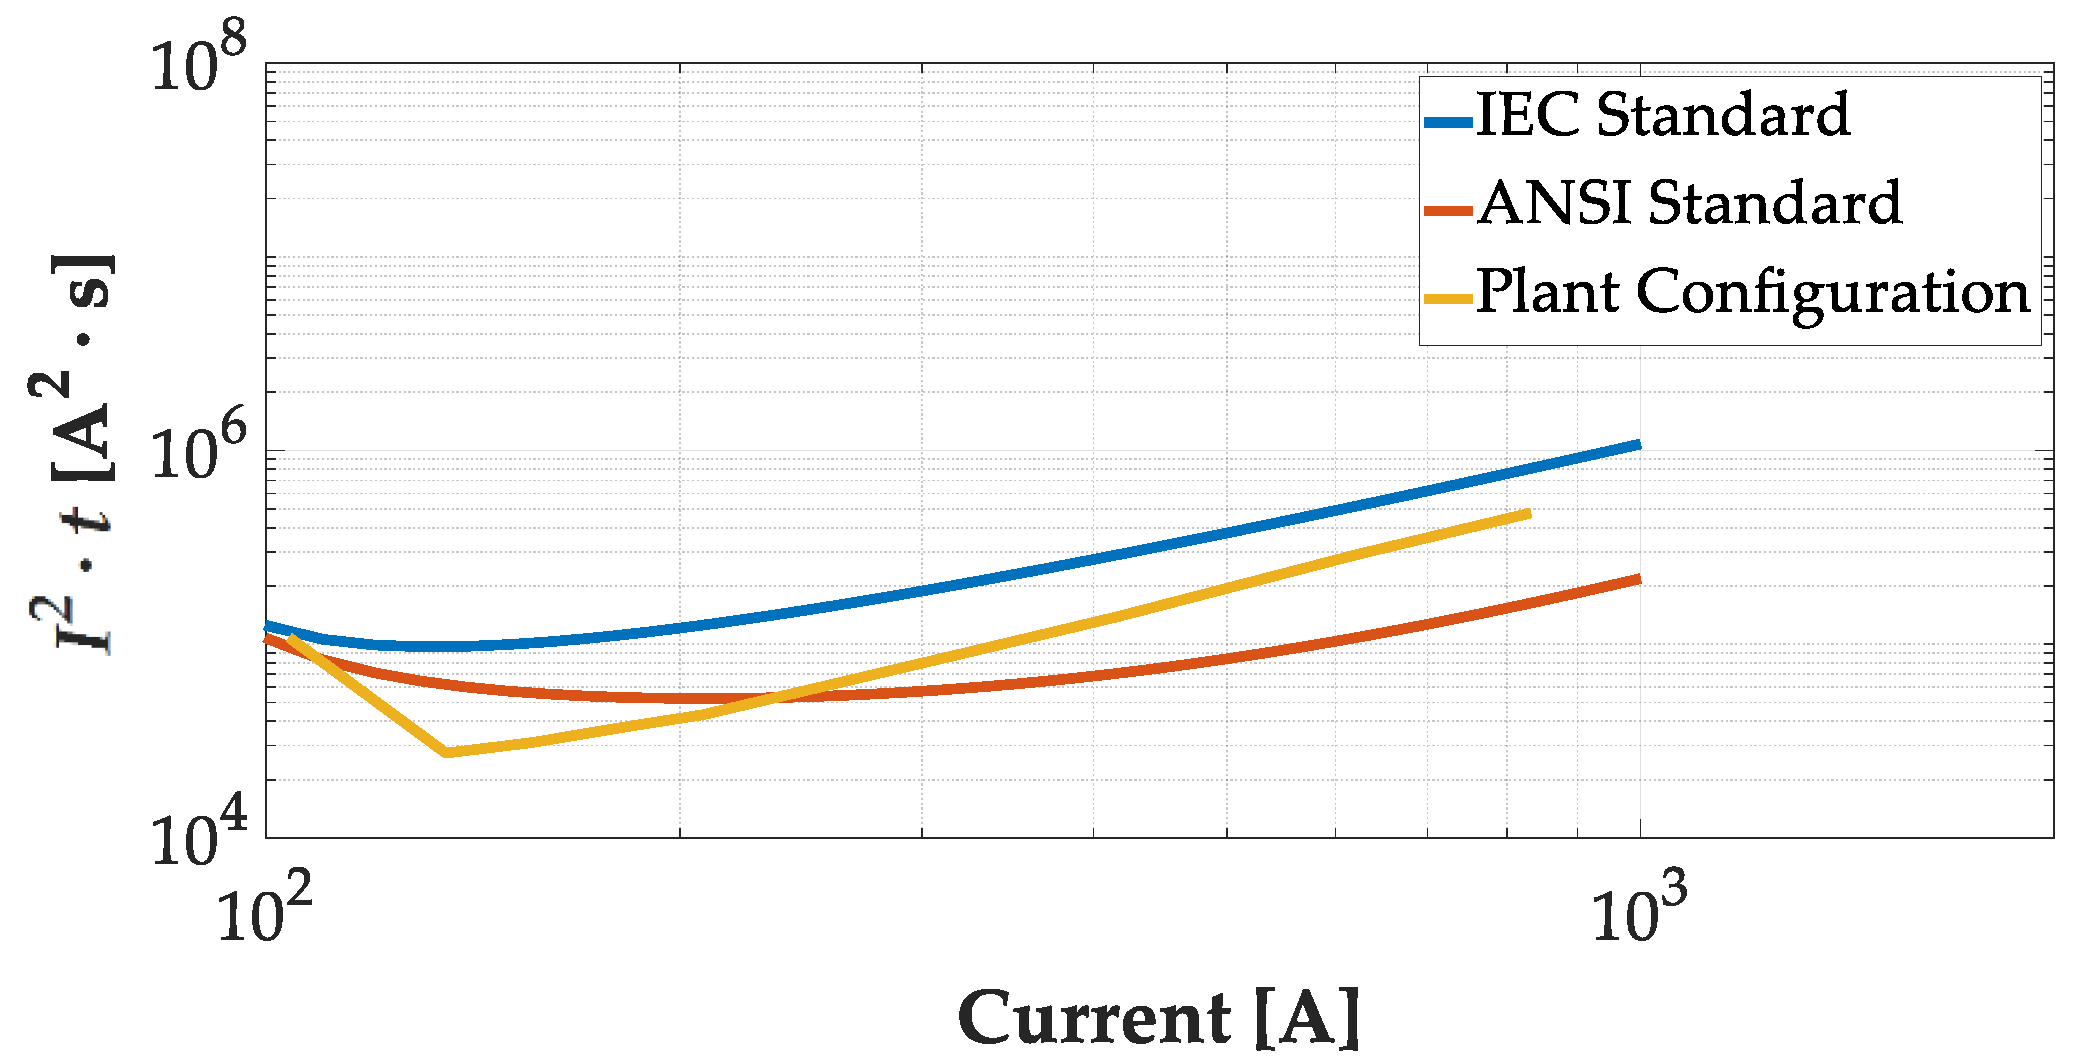
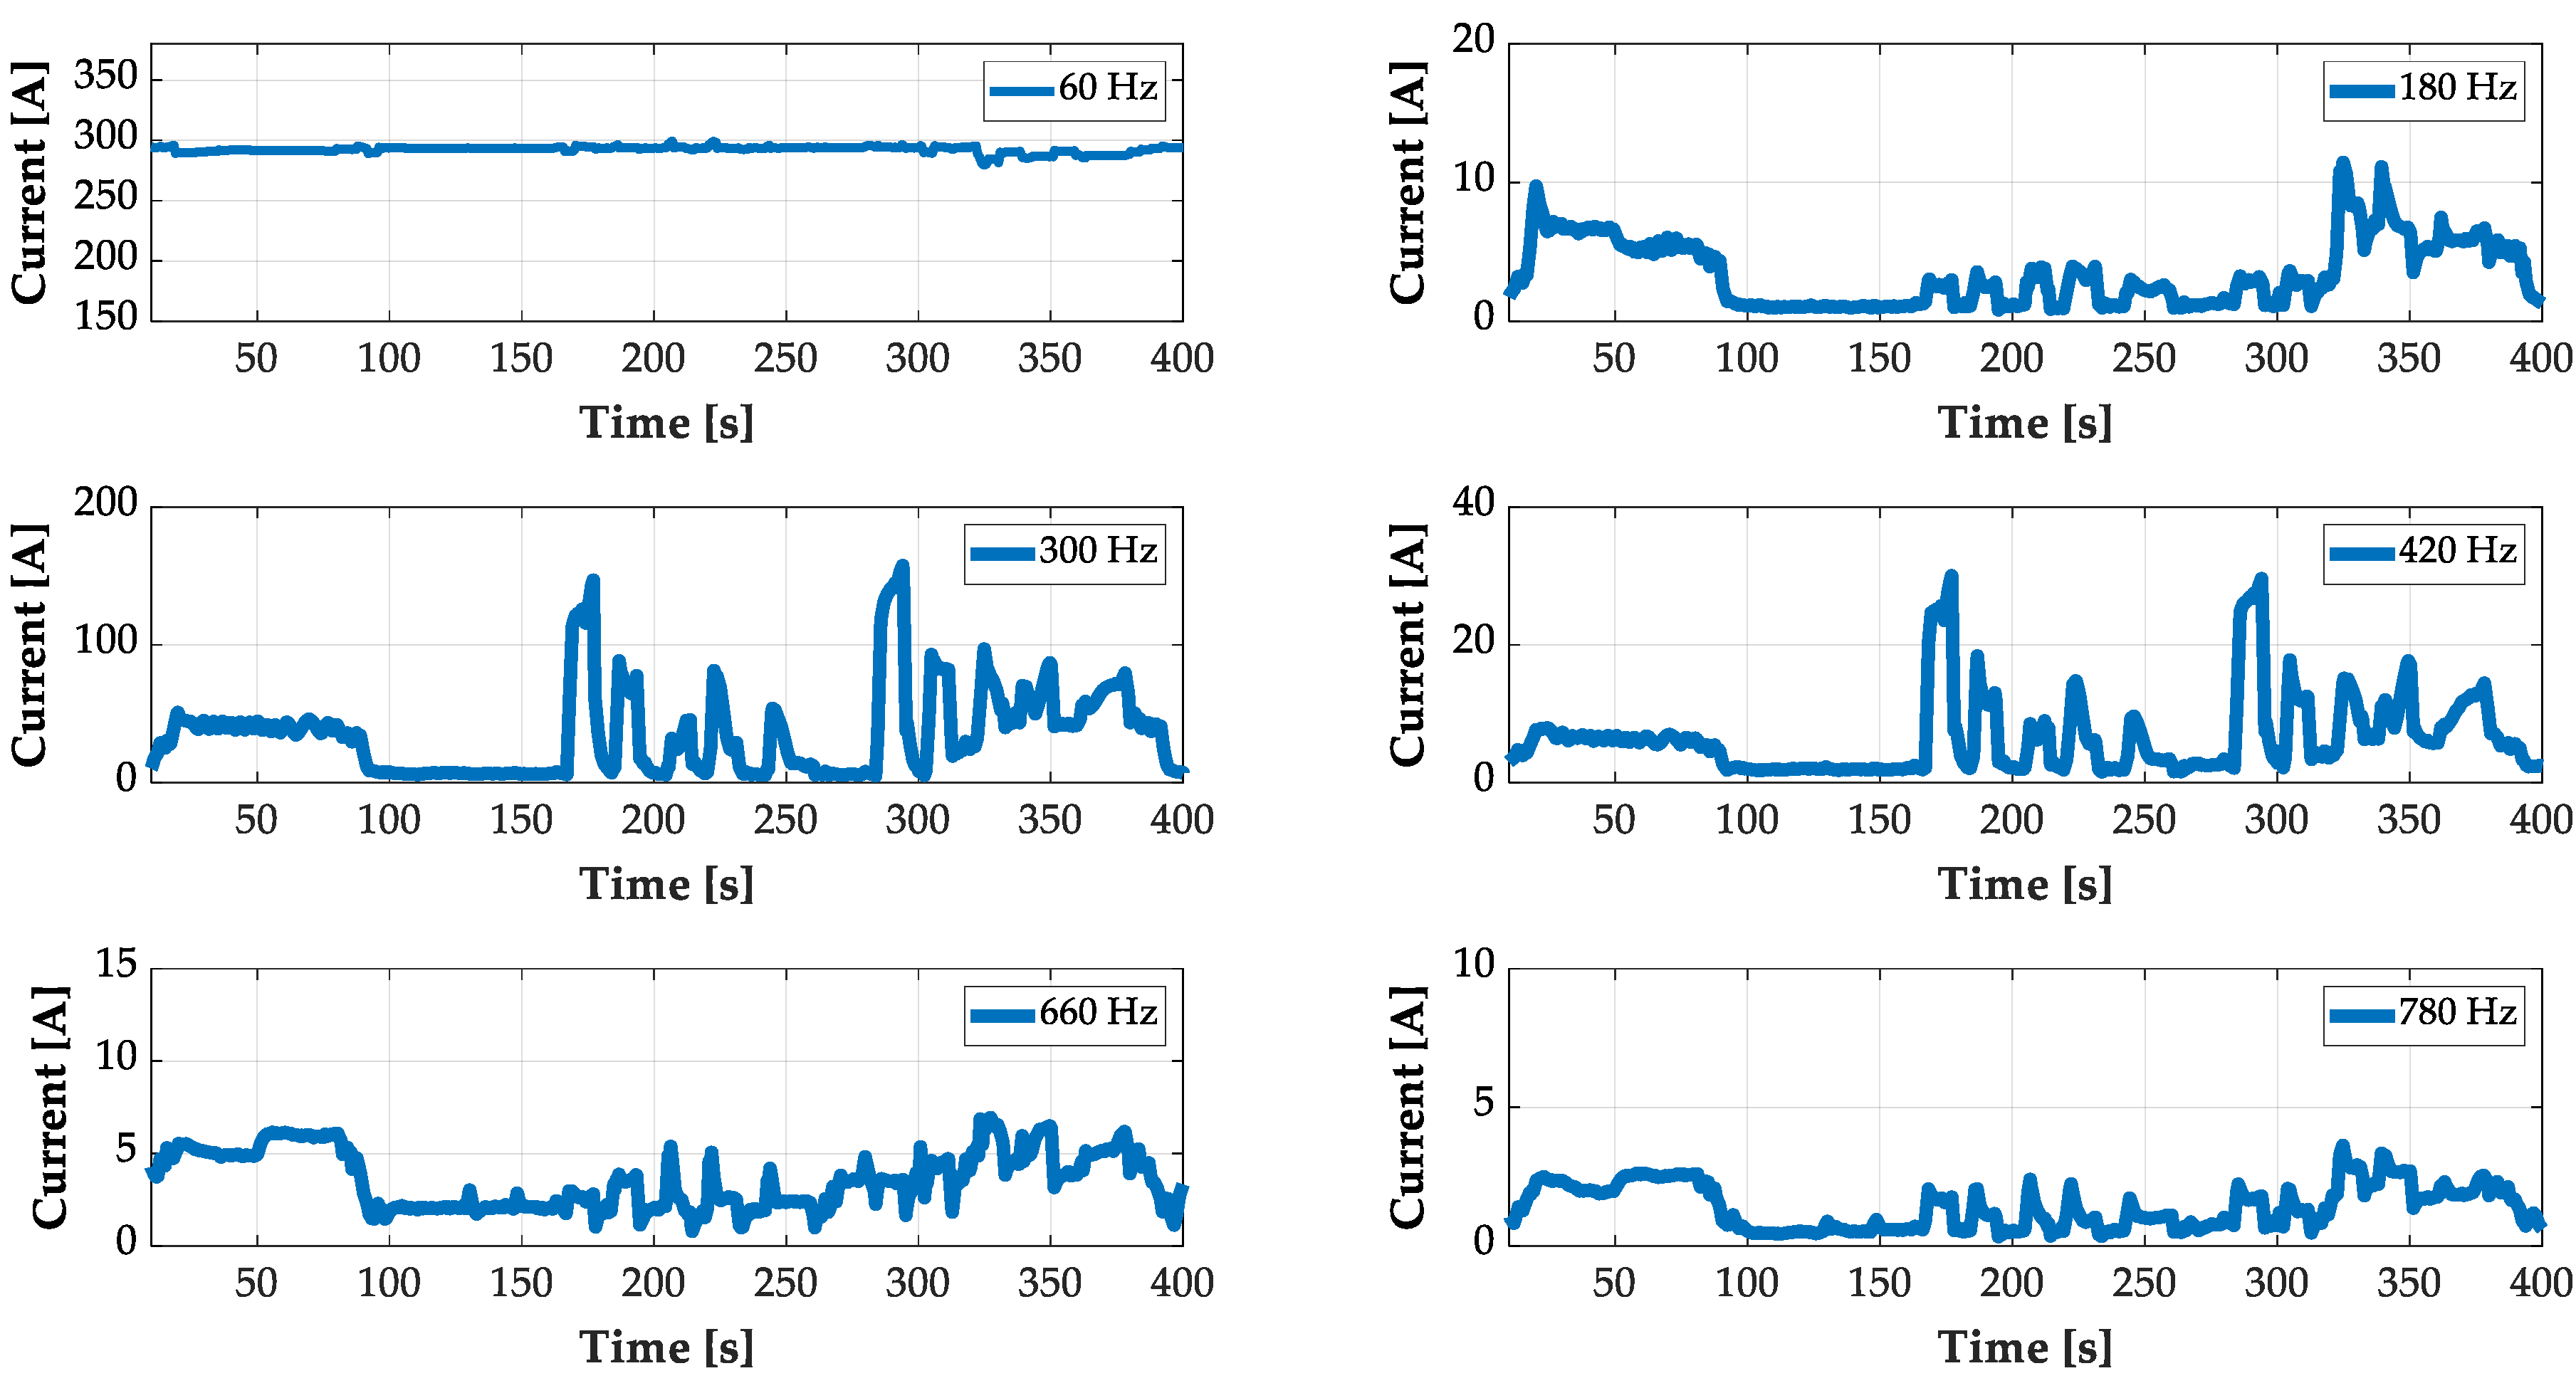
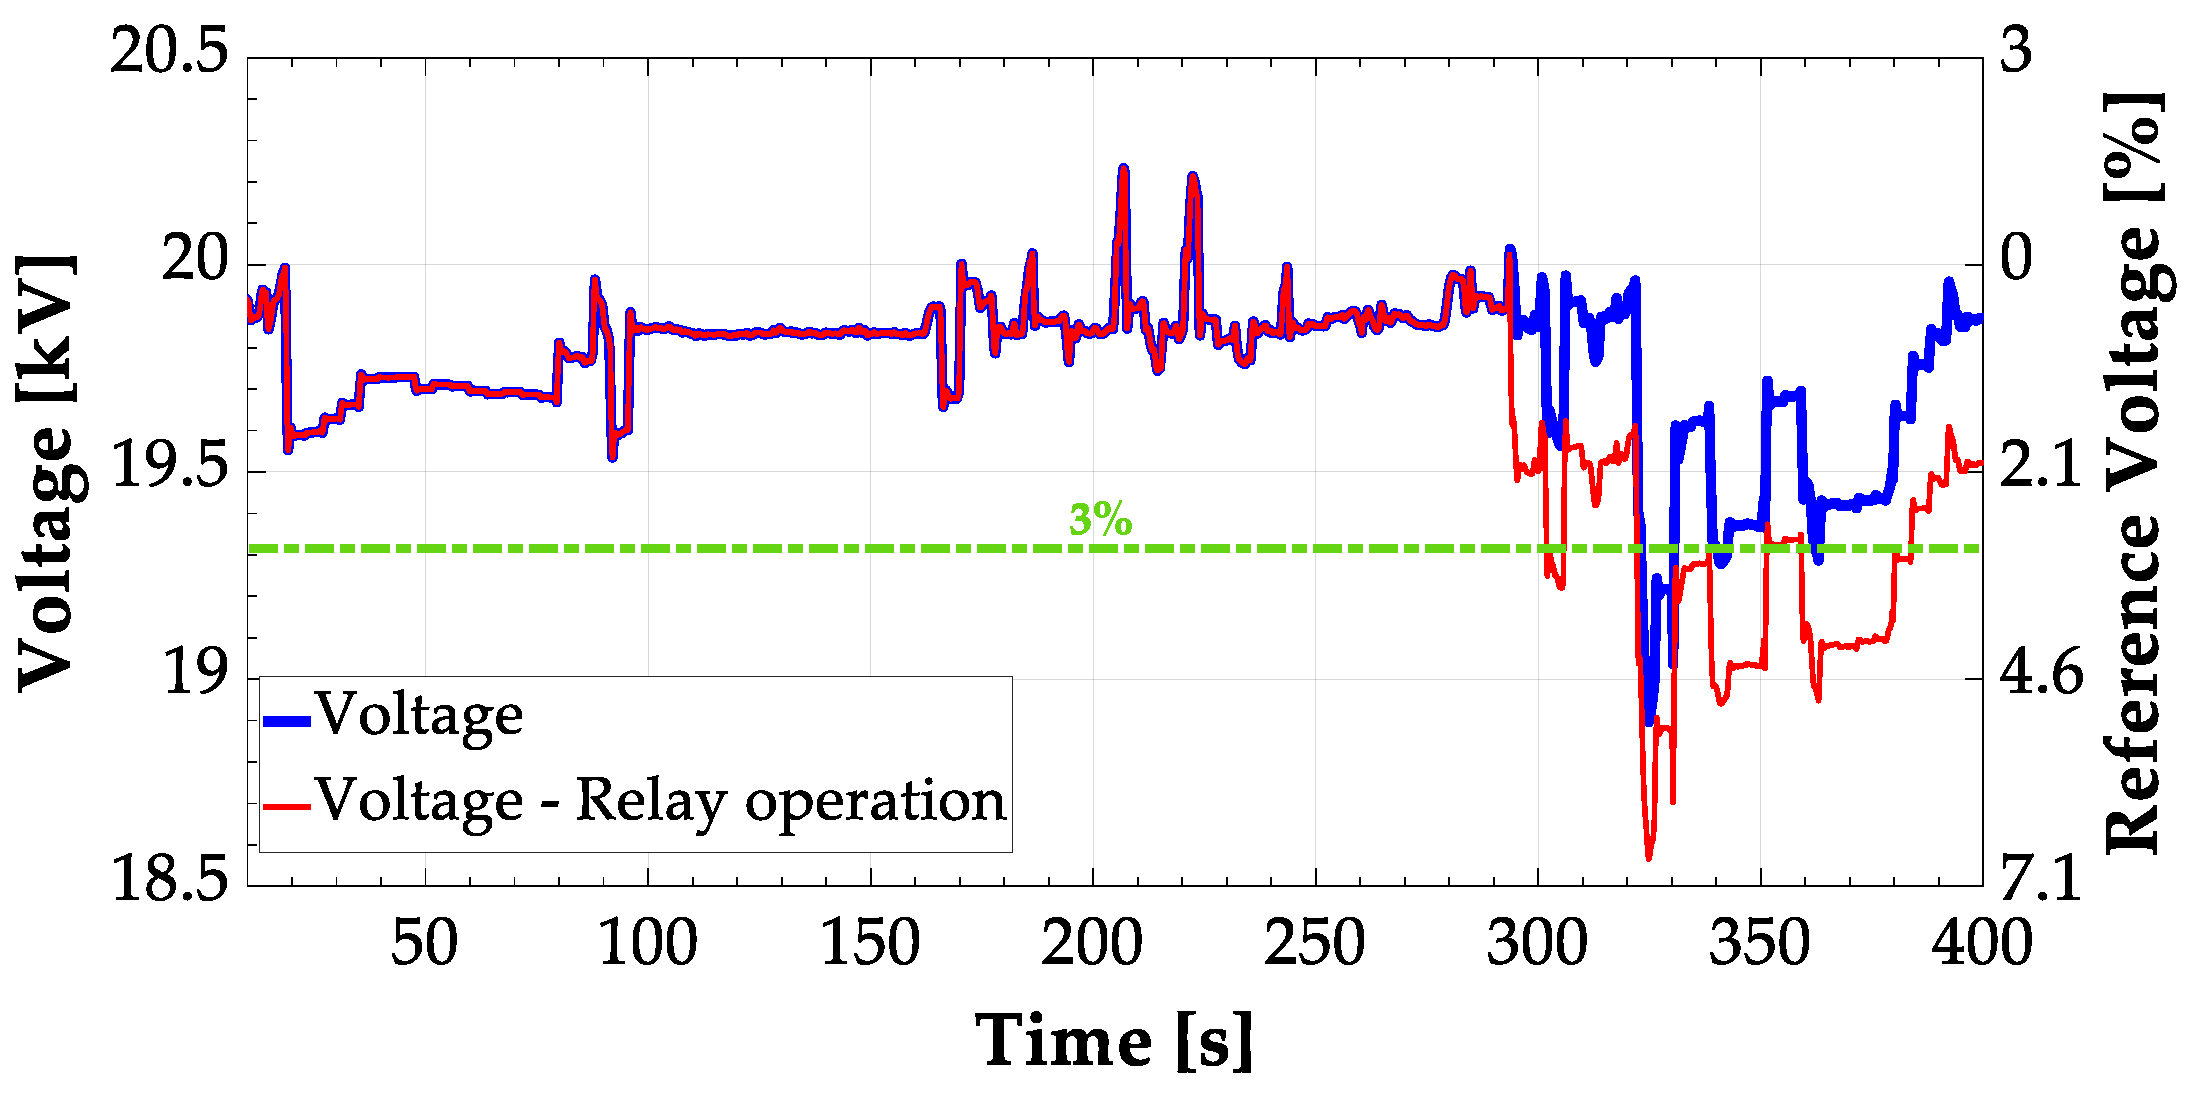
3.1.2. Harmonic Overcurrent Protection

High harmonic currents can cause thermal overload in the filter components. The overcurrent protection is carried out by 50/51 relays. The 50 relay is an instantaneous overcurrent device that operates with adjustable delay. The 51 relay works inversely with the value of the current: The larger the current, the shorter the operating time. The harmonic overload protection is carried out by a harmonic detection component and a time lag element. The response of these protection devices is similar to that of a high-pass filter. The goal is to emulate a thermal image protection to guarantee the integrity of the coil. The internal insulation of the coil cannot exceed a certain temperature.
The detectable harmonics depend on the selected type of relay. The C-type filter, the tuned filter and the 360 Hz second-order high-pass filter use a relay that detects harmonics above 120 Hz. The 600 Hz second-order high-pass filter utilizes a relay that detects harmonics above seventh order, i.e., 420 Hz. The current transformers that are used for detecting harmonic currents in each phase have a ratio of 400/5 A. Characteristics of the protections are shown in Table 4 [10].
The harmonic overcurrent protection of filter 3 is considered as a case study. Only relay 51 is taken into account because it gives rise to the most problematic scenarios. The trip curves of the relay for the selected parameters are shown in Figure 7. The typical time characteristic and normal inverse curves (CO-8) according to IEC overcurrent relays and American National Standards Institute (ANSI) standards are also represented in Figure 7 [18,19].
Figure 8 shows the implementation of the relay in the plant model.
As can be seen in Figure 7b and Figure 9, the curves selected for the plant correspond to manufacturer’s recommendations. The I2·t curve is used when the pre-established current conditions occur to send the order to the corresponding circuit breaker.
In summary, only the current downstream from the PCC of the filters is required to launch the complete single-phase plant model. The current of the case study corresponds to that in Figure 6.

3.2. FEM Simulation

The study of the reactor temperature is undertaken by using FEMM 4.2 software [9]. Simulations are implemented by means of LUA programming language [20]. Two thermal simulations are carried out: In the first one, only room temperature is considered; conversely, in the second one, the influence of solar irradiance is added to account for the hottest days.
Focusing on the computer aided design (CAD) (AutoCAD 2020, Autodesk, Mill Valley, CA, USA) design of the reactor, the coil is a 3D element with axial symmetry, making it easy to simulate by recreating only an axisymmetric 2D model. In FEMM, one models a slice of the axisymmetric problem. By convention, the r = 0 axis is understood to run vertically, and the problem domain is restricted to the region where r ≥ 0. In this convention, positive-valued currents flow in the into-the-page direction. On the other hand, as seen in Table 5 each conductor consists of 38 aluminium wires. After several complex simulations and given the limited variation in the results, equivalent conductor cross sections are modeled. The geometry selected allows to recreate the skin and the proximity effects.
The steps conducted in order to emulate the coil in the simulation program can be summarized as follows [21]:
  • Geometric model: For the sake of simplicity, an axisymmetric 2D simulation and an equivalent conductor cross section are considered.
  • Materials: Thermal and magnetic properties are provided to define the coil materials.
  • Boundary conditions: The most appropriate condition for solving the magnetic problem is that the vector potential, A, must be equal to zero at an infinite distance (r = ∞) [22]. Regarding the heat flow problem, only one single contour condition per element is set due to software constraints.
  • Mesh [23]: The number of nodes for the magnetic and thermal simulations are 350,723 and 1,090,869, respectively.

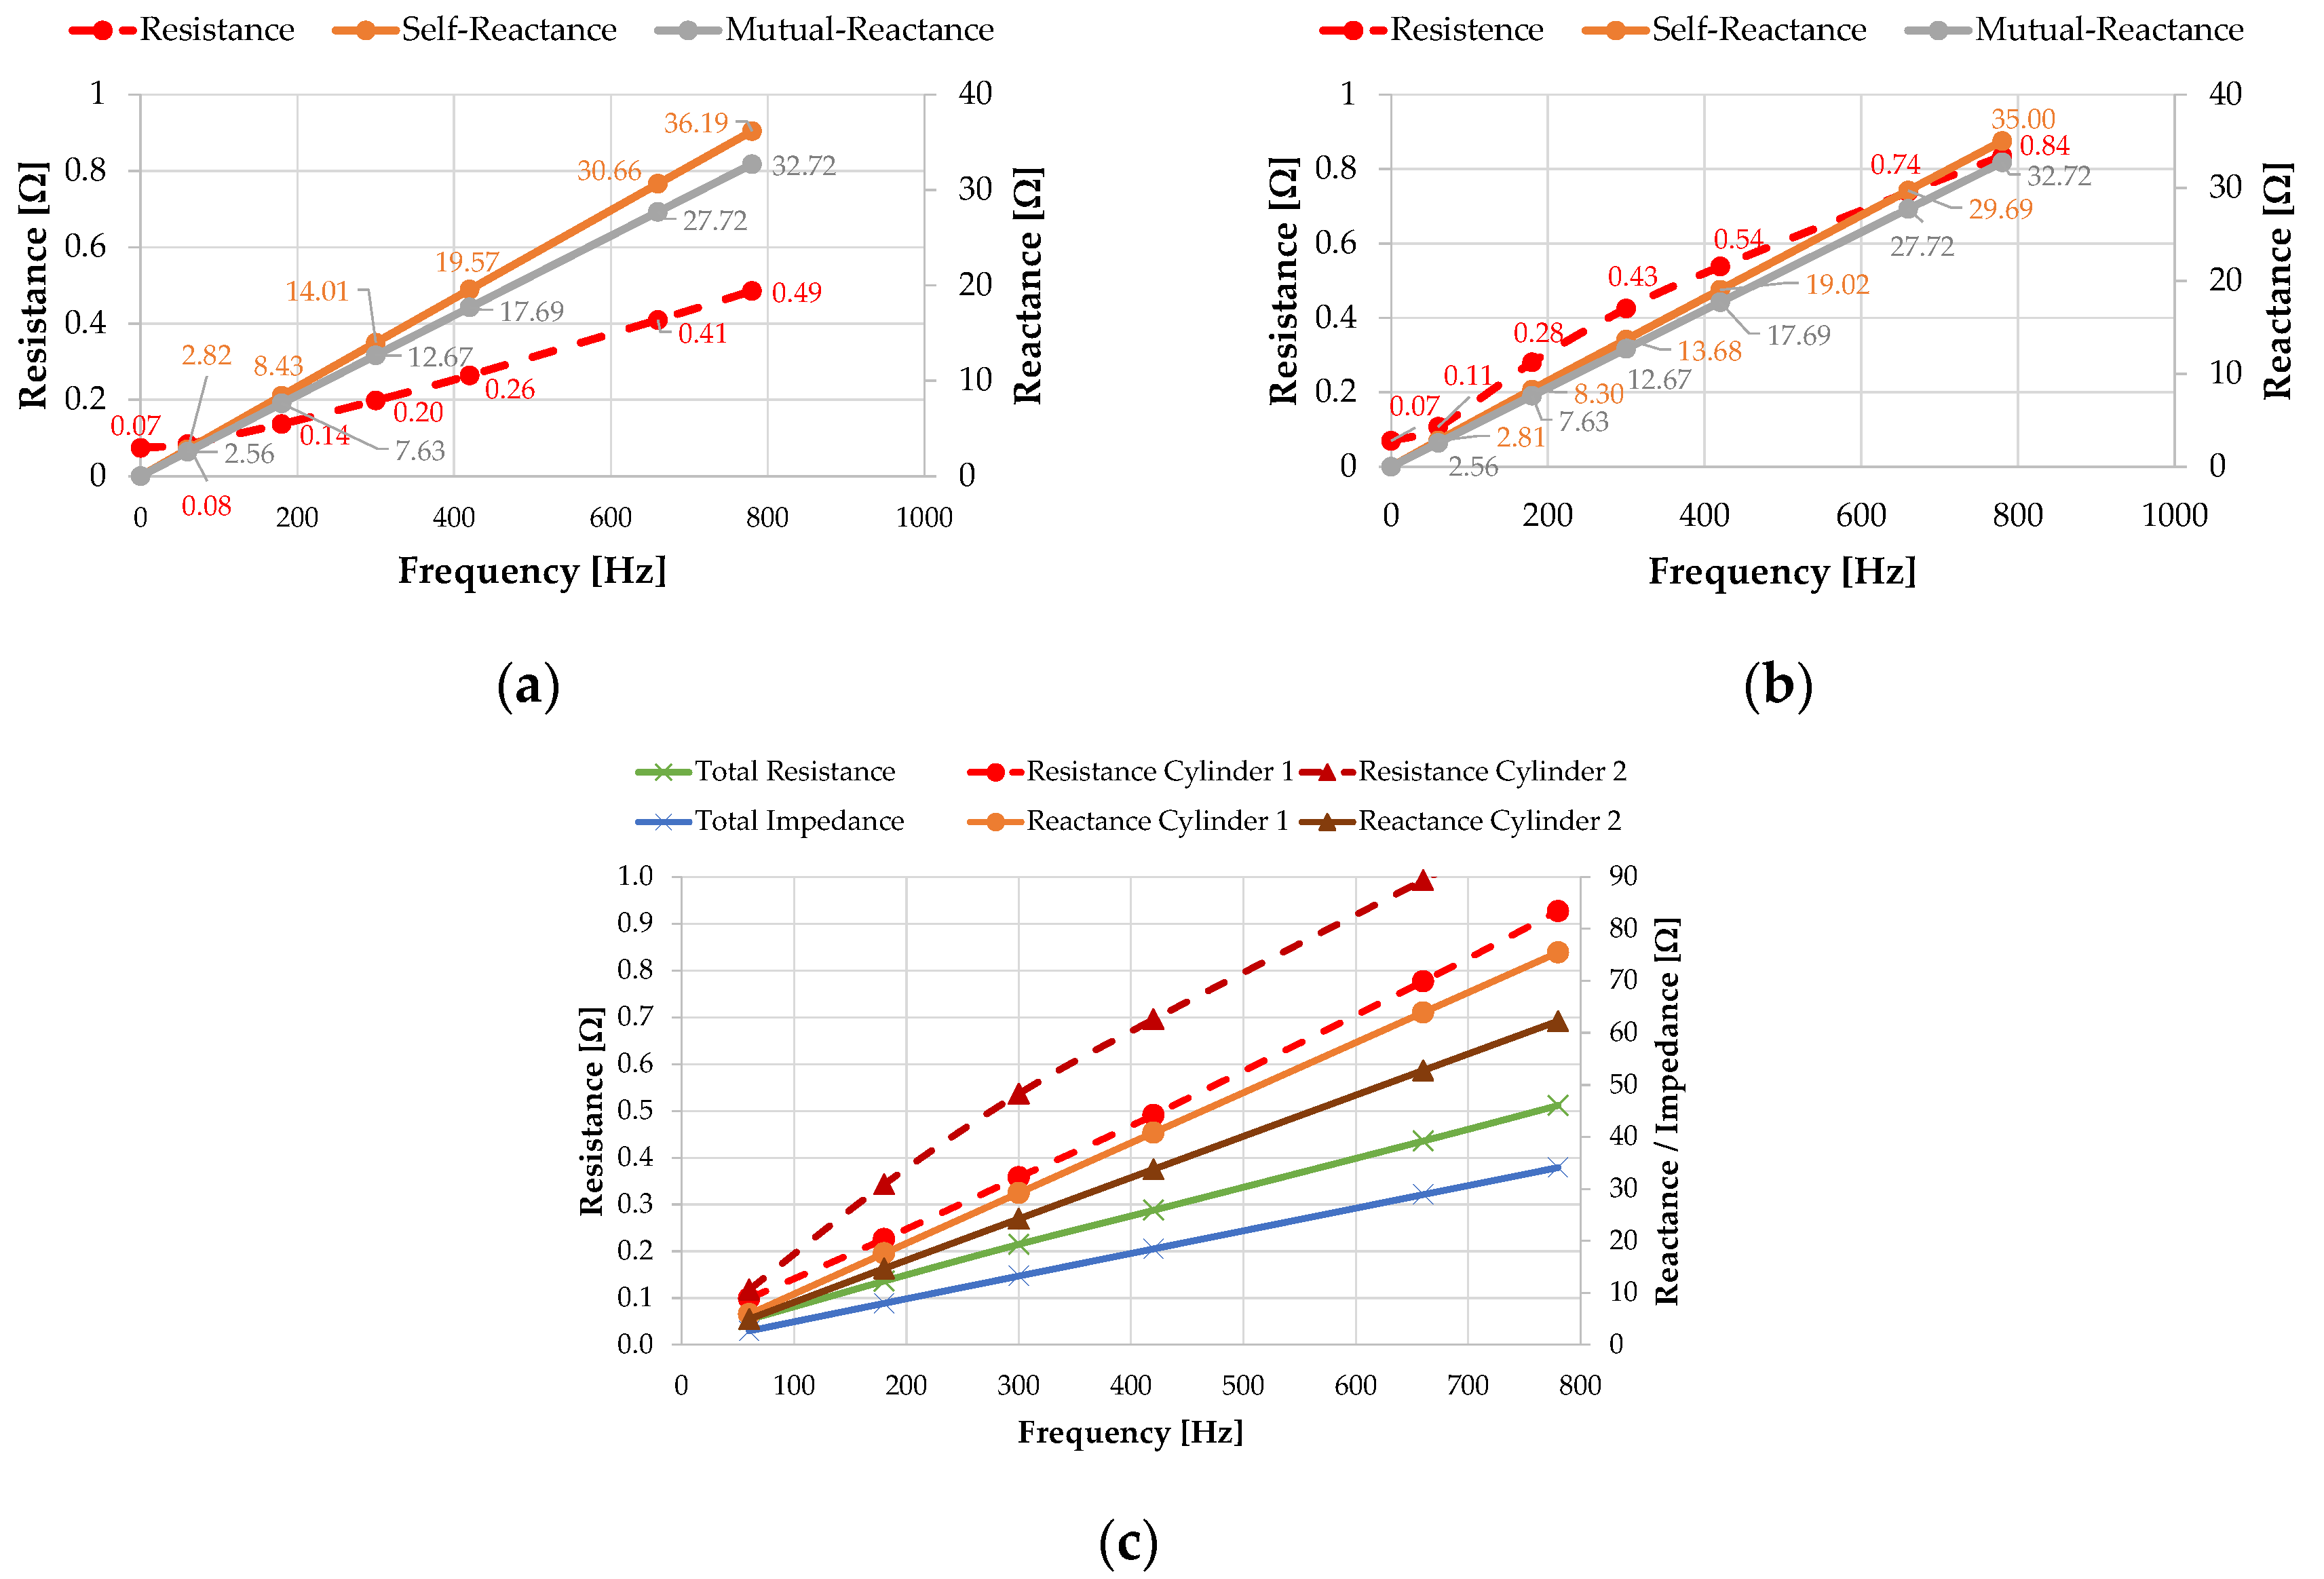
3.2.1. Dry-Type Air-Core Reactor Characterization

The reactor of high-pass filter 3 (see Table 2) was selected to serve as a case study. The physical and electrical characteristics of this reactor are shown in Table 5. The total weight of the coil is around 245 kg, of which the insulation accounts for 20–25% [24]. A detail from the CAD design of the coil is shown in Figure 10.
Several assumptions must be made; thus, the self and mutual inductances of the reactor are assumed to be independent of both the coil temperatures and the proximity effect. In fact, this is not a gross approximation as conductors must be larger for the said effect to have a substantial influence on inductance values [25].
A simulation of the magnetic problem was performed to obtain the electrical parameters of the model. Firstly, cylinder 1 is fed with a 1 A current ranging from 60 Hz to 780 Hz, while cylinder 2 is set to 0 A to easily obtain the resistance and self-inductance of the former. The mutual inductance is obtained directly from the resulting flux linkage in cylinder 2. Then, the process is repeated by swapping the role of each cylinder.
The characteristics of the materials which make up the reactor are summarized in Table 6.
Simulation values are compared with mathematical estimations which can be derived from the design parameters and physical dimensions of the coil. Moreover, the mathematical calculation, as well as its contrast to the values of the FEM model, is required to discern the current that flows through each coil layer, which must be considered as a circuit in a detailed model of the problem. In this regard, each circuit is fed by a current source because of software constraints. Figure 11 shows the equivalent electric input circuit for the FEM model of the dry-type air-core reactor.
Two methods based on the Nagaoka equations [7] are used to compute the self and mutual inductances. The difference between these methods lies in the selection of one calculation factor, k. The so-called Grower and Nagaoka parameter, which is obtained through the length/diameter relation, is utilized in the first method [26]. The second or simplified method uses the relation diameter/(2·length). This analysis is crucial to determine the current distribution in the cylinders of the reactor.
The self-inductance can be calculated from the Nagaoka equation:
L s e l f = μ 0 · N 2 · π · D 2 · k / H ,
where µ is the permeability of vacuum in Vs/Am, N is the number of turns in the winding, D is the diameter of the cylinder in m, and H is the height of the cylinder in m.
For the sake of simplicity, factor k can be evaluated as:
k = [ ( 1 + ( D 2 · H ) 2 ) ( D 2 · H ) ] .
Other methods, e.g., the Hank and Dwight strategies, use the winding thickness. In the latter case, the main advantage arises from the avoidance of the interpolation of k, as, in this case, the calculations can be performed via series definitions [7].
The mutual inductances for concentric cylinders can be calculated as:
M m n = 2 π 2 · r 2 · N m · N n · K ( R 2 + H e 2 ) ,
where r is the radius of the inner cylinder in m, R is the radius of the outer cylinder in m, He is the height of the outer cylinder in m, K = f(r, R, He, Hep) is a factor calculated using series of elliptic integrals [27], Hep is the height of the inner cylinder and N is the number of turns in the windings of cylinders m and n.
The resistance of the coil depends on the geometry, the number of turns, frequency and temperature. Thus,
R t o t a l =   c · R d c R d c =   4 · ρ a l · D · N d 2
where c is 1.09 to account for skin and proximity effects at 60 Hz, ρ a l stands for the resistivity of aluminium, i.e., 3.0542 × 10⁻⁸ Ω·m at 40 °C, D is the cylinder diameter in m, N is the number of turns in the winding and d is the cable diameter (equivalent to that of a rectangular cable) in m.
Therefore, the impedances of the coil can be calculated as:
Z n n _ =   R t o t a l + j ω L s e l f Z m n _ =   j ω M m n = Z n m _ Z c y l i n d e r _ =   Z n n _ + Z m n _ Z r e a c t o r _ = 1 1 Z c y l i n d e r   1 _ + 1 Z c y l i n d e r   2 _ + + 1 Z c y l i n d e r   n _ .
To calculate the distribution of currents in the cylinders, the following equations can be applied:
[ Z ] = [ Z 11 Z 12 Z 21 Z 21 Z n 1 Z n 2 ] [ Z ] · [ J ] T = [ U ] · [ V ] T
where [Z] is the impedance matrix, [J] is the cylinder current matrix, [U] = [1…1], and [V] is the cylinder voltage matrix.
The uniform matrix can be used instead of the voltage vector because the voltage is common to both parallel-connected cylinders and the currents are linearly distributed throughout the impedances [28],
[ U ] · [ J ] = [ I ] , [ J ] = [ Z ] 1 · [ U ] T ( [ U ] · [ Z ] 1 · [ U ] T ) 1 [ I ] .
The methodology described above, together with the actual measured parameters, enables the design of the FEM model to be proved and that the obtained results are consistent and precise.

3.2.2. Multiphysics FEM Simulation

The coil temperature is dependent on thermal losses, which may be different for each cylinder regarding the specific distribution of currents. Moreover, the frequency-dependent eddy currents, caused by the magnetic and electric fields, can affect the thermal losses in the cylinders unevenly. Skin and proximity effects increase the resistance of the conductor. While the increase in temperature leads to higher conduction losses [29].
The thermal conductivity, σ, of aluminium as a function of temperature is determined by
σ = ( 0.0004 · T e m p 2 0.1498 · T e m p + 38.544 ) · 10 6   [ m ] ,
where Temp is the temperature of the conductor in °C [7].
According to the IEEE standard [30], load losses can be classified into two types: Thermal and stray. The latter are due to the electromagnetic stray flux in the windings and the core. Therefore, losses can be divided, in turn, into winding losses, Pwinding, and losses in other components. Winding stray losses include skin and proximity effects considered to be caused by eddy currents, Pec. Therefore, the total load losses, Pt, can be defined as:
P t = P w i n d i n g + P e c + P o t h e r   s t r a y .
Stray losses caused by other components, Pother stray, are low for this type of reactor, and thus, can be neglected. The winding losses, Pwinding, are caused only by the current flowing through the reactor [7],
P w i n d i n g = I 2 · R a c , I = [ ( I h ) 2 ] 1 2     P w i n d i n g = ( I h ) 2 · R a c   h ,
where I is the value of the current, h is the harmonic order, and Rac h is the AC resistance for harmonic order h.
The resistance of the inductor, which varies with frequency due to the skin effect, is determined by means of the experimental test described above. Moreover, the losses caused by the proximity effect are obtained when the model is fed with the distribution of current in the cylinders.
Because the FEMM software package [9] only enables the resolution of magnetic problems at specific frequencies a harmonic distortion factor (HDF) is used in order to accurately compute the rated cable capacity [31]. Thus, an equivalent current at the grid frequency (60 Hz) exerting the same thermal effect as that of the actual distorted current is considered to be obtained.
The HDF, as seen in Equations (11)–(14) [23].
L o s s e s =   n = 1 N I f n 2 ·   R f n = I e q 2   · R e q ,
H D F = I f I e q = 1 ( 1 + n = 2 n α 2 n · β n ) ,
α f n = I f n I f ,
β f n = R f n R f ,
where I e q and R e q are, respectively, the equivalent RMS current and resistance at 60 Hz, I f , the rated RMS current of the conductor at 60 Hz, I f n , the RMS current at the nth-order harmonic frequency, R f , the ac resistance of the conductor at 60 Hz (which includes the aforementioned skin and proximity effects), R f n , the resistance of the conductor at the nth-order harmonic frequency, α f n , the harmonic distribution factor, β f n , the normalized harmonic ac conductor resistance factor [32]. Therefore, the 60 Hz equivalent current can be straightforwardly calculated as:
I e q = I f H D F .
The power losses in each cylinder are determined by solving a magnetic problem in FEMM 4.2. These power losses are subsequently used as an input to the heat source to be utilized in the heat flow problem, which eventually enables the calculation of the respective temperatures of the cylinders.
The heat flow problem requires the definition of the utilized material properties, as shown in Table 7.
Convection is the only heat transfer mechanism taken into account in this simulation. Since the power losses are calculated separately, each cylinder is considered to be a different heat source. Therefore, heat conduction is neglected. Furthermore, the low emissivity coefficients of aluminium (0.05–0.2), together with the fact that heat radiation only occurs at the top and bottom sides of the reactor, as well as at the outer surface of the outermost cylinder, enables the disregard for radiation effects [33].
Two boundary conditions (BCs), see Figure 12, are defined: Convection (BC1) and external limit temperature (BC2). The former is assigned to the outer borders of the cylinders. Since the air coefficient is typically within the range 6–30 W/m2·°C in natural convection [23], a value of 15 W/m2·°C is used. A steady-state simulation is performed at rated conditions in order to determine the value of the surface temperature, T. The temperature of the air in the interface increases from a starting value of 40 °C to a final steady-state value of 83.43 °C, which is considered, in turn, as the starting temperature of the subsequent simulation. On the other hand, the second boundary condition is a fixed temperature at an infinitely distant point, i.e., the room temperature, which is set at 40 °C.
The sol-air temperature, T s o l a i r   , i.e., the temperature under no direct solar radiation and no air motion that would cause the same heat transfer as that provoked by the interplay of the actual existing atmospheric conditions, is determined in order to take into account the hottest days in a second steady-state simulation,
T s o l a i r =   T A +   α s G i / h c
where TA stands for the room temperature, αs is the solar absorptivity, (around 0.4 for aluminium-mylar), Gi is the total radiation (estimated at 1000 W/m2), and hc stands for the heat transfer convective coefficient (15 W/m2·°C) [34].
A new value of BC1, 66.67 °C, can be obtained by applying (16). The second steady-state simulation yields a temperature between layers of 109.8 °C under these unfavourable assumptions.
The temperature of a cylinder in an air-core reactor is a function of the power losses and the cooling rate. A multiphysics simulation is proposed to compute this temperature due to the complexity of the process. By using LUA [20], a high-level multiparadigm programming language, magnetic and thermal simulations are performed in steps of 4 s steps. As shown in Figure 13, both dependent and input variables, e.g., aluminium conductivity and temperature of the surrounding air, are updated at each step.
The time constant and the power losses are used to validate the model. The thermal time constant, τ, is the time needed for an object to change 63% of the total difference between its initial and final body temperature when subjected to a temperature step change. In 4τ s, the object temperature overcomes about 98% of the total variation. This constant, which can be calculated by using (17), together with the power losses, which can be estimated by means of (18), are used to verify the model in a steady-state simulation performed under rated operating conditions [35].
τ =   C c o i l P h   c o i l ·   θ c o i l , C =   m · c   ,                       m = γ · n · ( π 2 ) 2 · d 2 · D .
P h =   i s 2 · ρ · n · ( π 2 ) 2 · d 2 · D .
In (17), C c o i l stands for the thermal capacity of the coil in Ws/°C, Ph represents the electrical losses of the coil in W, and θ is the coil temperature variation in °C. Moreover, m stands for the weight of the material in kg, c for the specific heat of the different materials (920 Ws/kg°C for aluminium, 840 Ws/kg°C for fibre glass and around 1170 Ws/kg°C for mylar), γ for the density in kg/mm2, n for the number of turns, d for the diameter of the cable in mm, and D for the mean diameter of the cylinder in mm. In (18), is is the mean current density in A/mm2, and ρ stands for the specific electrical resistance (around 30,000 Ω·mm at 70 °C) [7].

4. Results and Discussion

The methodology proposed in the previous section enables the thermal analysis of dry-type air-core coils, which in turn facilitates the setting of their overload protection relays. Thus, installations can be safely pushed to their operational limits while avoiding nuisance tripping and its high associated costs. Unintended stops of a hot rolling mill plant do indeed lead to product and labour-related expenses, as well as ancillary costs such as those concerning damaged equipment, lost opportunity costs or penalties. In this regard, several steel plants have reported losses of about one million USD per year due to unplanned halts caused by electrical faults [36].
The correct performance of overload protections is essential to safeguard the passive elements in the filter banks. The temperature rise caused by an overload can certainly deteriorate the insulation of the coil and lead to its failure.
According to IEEE standards [37,38], several factors condition the useful life of insulation materials, maximum temperatures are thus defined for a safe operation of reactor. In this regard, the dry-type air-core reactors under study are labelled as class B, which implies a rated insulation temperature of 130 °C and an average temperature rise of 80 °C due to the winding resistance. The maximum coil hot-spot temperature can be calculated by adding the room temperature, typically selected at 40 °C, the temperature rises and a tolerance of 10 °C.

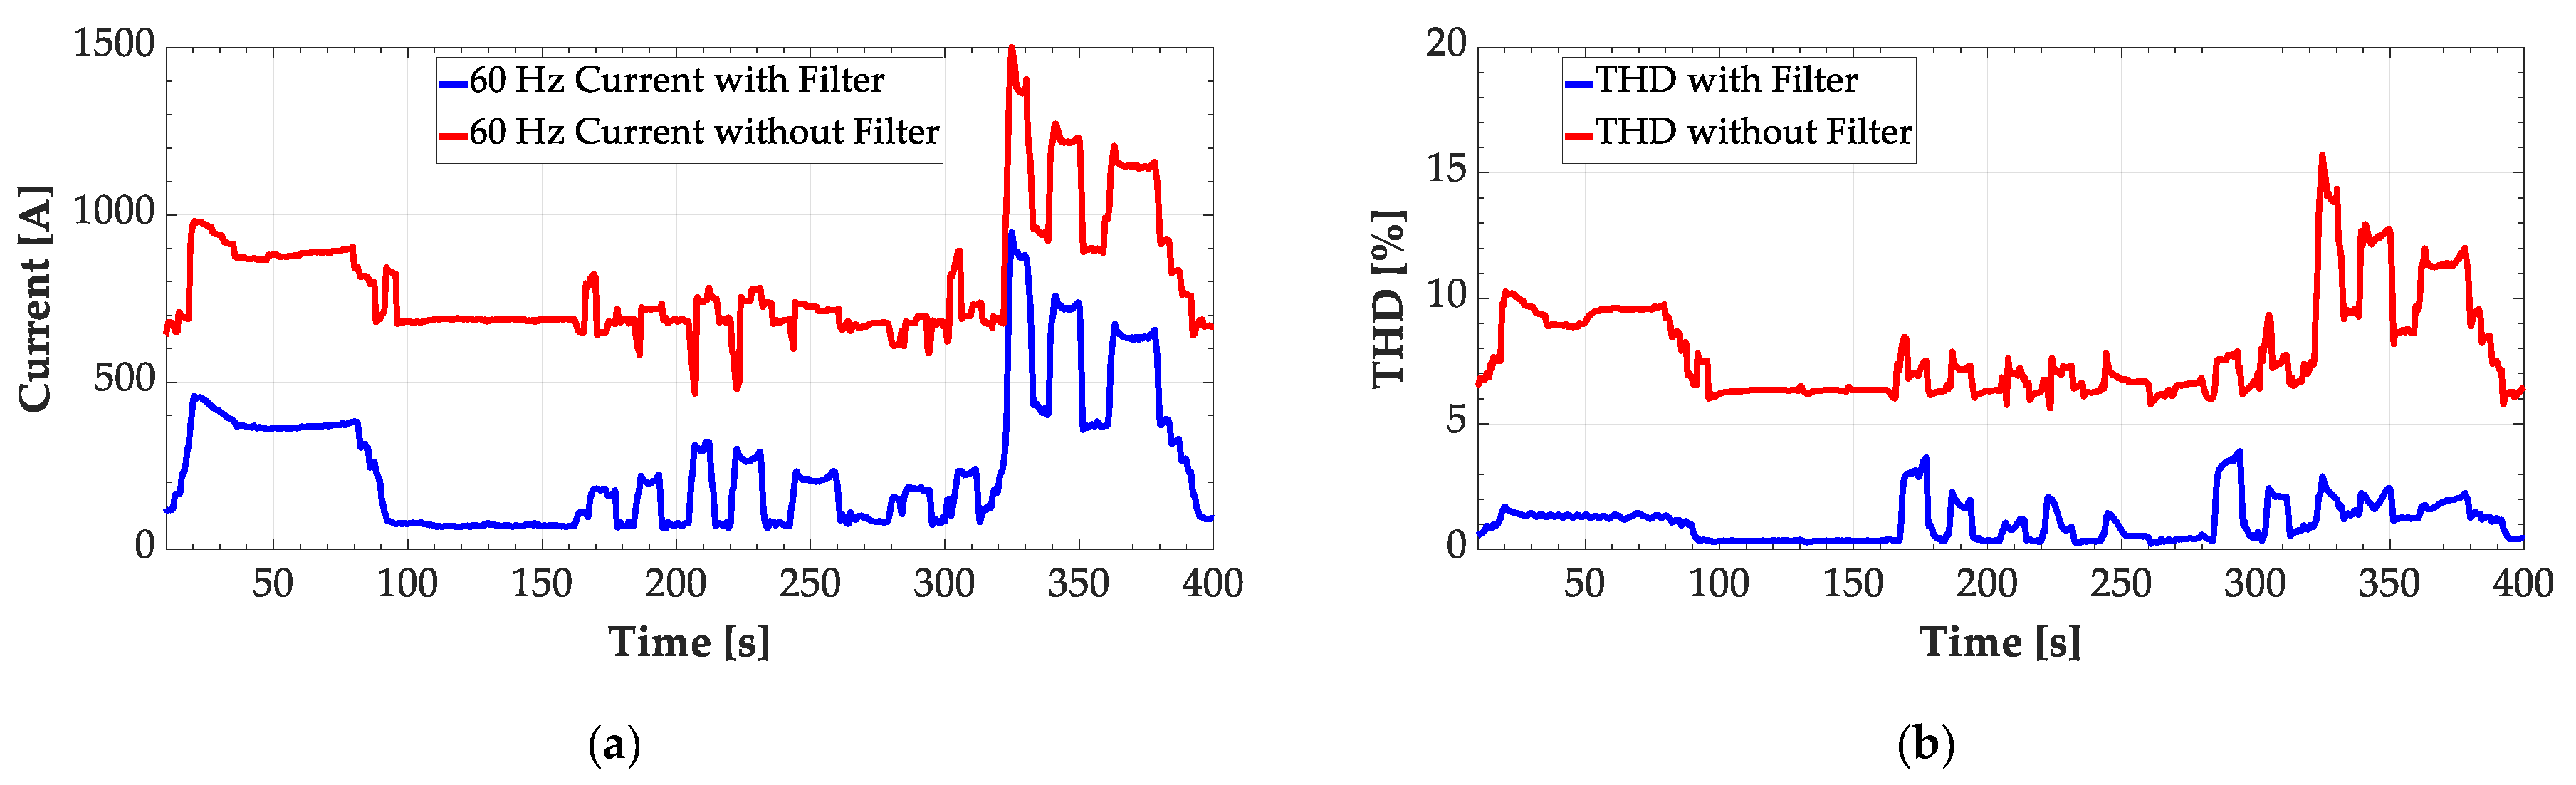
4.1. Electric Model of the Plant

The electric model of the plant is used to simulate the electrical power system. The peak value of the current upstream the PCC, shown in Figure 6, is obtained by utilizing the simplified single-phase model. The obtained results are used as inputs to a finite element analysis.
Figure 14 shows the behavior of the relay in filter 3 under real operating conditions. An abnormal event corresponding to the first pass of the roughing mill can be observed at 293.5 s.
Since the relay of filter 3 detects harmonics over 120 Hz, the evolution of the RMS value of the main currents pertaining to this frequency range is plotted in blue in Figure 14. The relay is set at 1.3 A, which is scaled up to 104 A for the installation. The intervals in which the distorted current exceeds this threshold are highlighted in red in the figure. According to the time-current curve of the protective device, shown in Figure 8, the relay trips at 293.5 s, thus causing the latch of the circuit breaker. The digital output signal of the relay is plotted in green in Figure 14.
In the following sections, a finite element analysis of the thermal behavior of the coil in filter 3 when exposed to the currents shown in Figure 15 is performed. These currents are obtained through simulation for the real behavior of the protection system not to interfere.

4.2. Finite Element Analysis

Finite element analysis (FEA) is used to provide an a priori estimation of the magnetic power losses in the coil, which are subsequently included in the heat flow problem as a heat source. However, the model must be validated before applying the FEA.

4.2.1. Dry-Type Air-Core Reactor Characterization

The coil is characterized according to the procedure described in Section 3.2.1. Accordingly, Figure 16 shows the values of the involved parameters at the frequencies of interest to the present work.
An alternative calculation based on the mutual inductance can be done to validate the model. The coupling coefficient, k, for a concentric coil is determined by the ratio between the radiuses of the different cylinders according to the trajectories of the magnetic flux. Thus, the application:
k =   M L 1 · L 2 ,
where L stands for the self-inductance of the coils, and enables the calculation of the mutual inductance, M.
In light of the results shown in Table 8, the model of the coil is considered appropriate.

4.2.2. Multiphysics FEA

Magnetic and heat flow multiphysics simulations are performed using the results of the electric model of the plant as an input to determine the temperature reached by the coil.
Figure 17 shows the time evolution of the peak value of the 60 Hz equivalent current obtained from (15). As stated in Section 3.2.2, the HDF must be used in this calculation.
The current distribution in the coils is calculated according to (7) and is also plotted in Figure 17. These values are used as input to the FEA.
The current distribution resulting from the FEA is shown in Figure 18. Disturbances caused by the magnetic field can be observed.

4.2.3. Model Validation

The thermal time constant is used to validate the model according to (19). Table 9 shows the results obtained from this validation, which consists in calculating the time needed to pass from room temperature, 40 °C, to the actual operating temperature, about 80–85 °C, in accordance with the properties of the materials in question (aluminium and mylar). If the proposed model is correct, a 4τ s simulation would reach 98% of the set temperature increase, which is previously obtained by a steady-state FEA.
As can be seen, the model is mathematically valid. Not only does it provide a good match between the simulated and the measured temperatures, but also fast dynamics, as can be deduced from the accurate estimate of the thermal time constant.

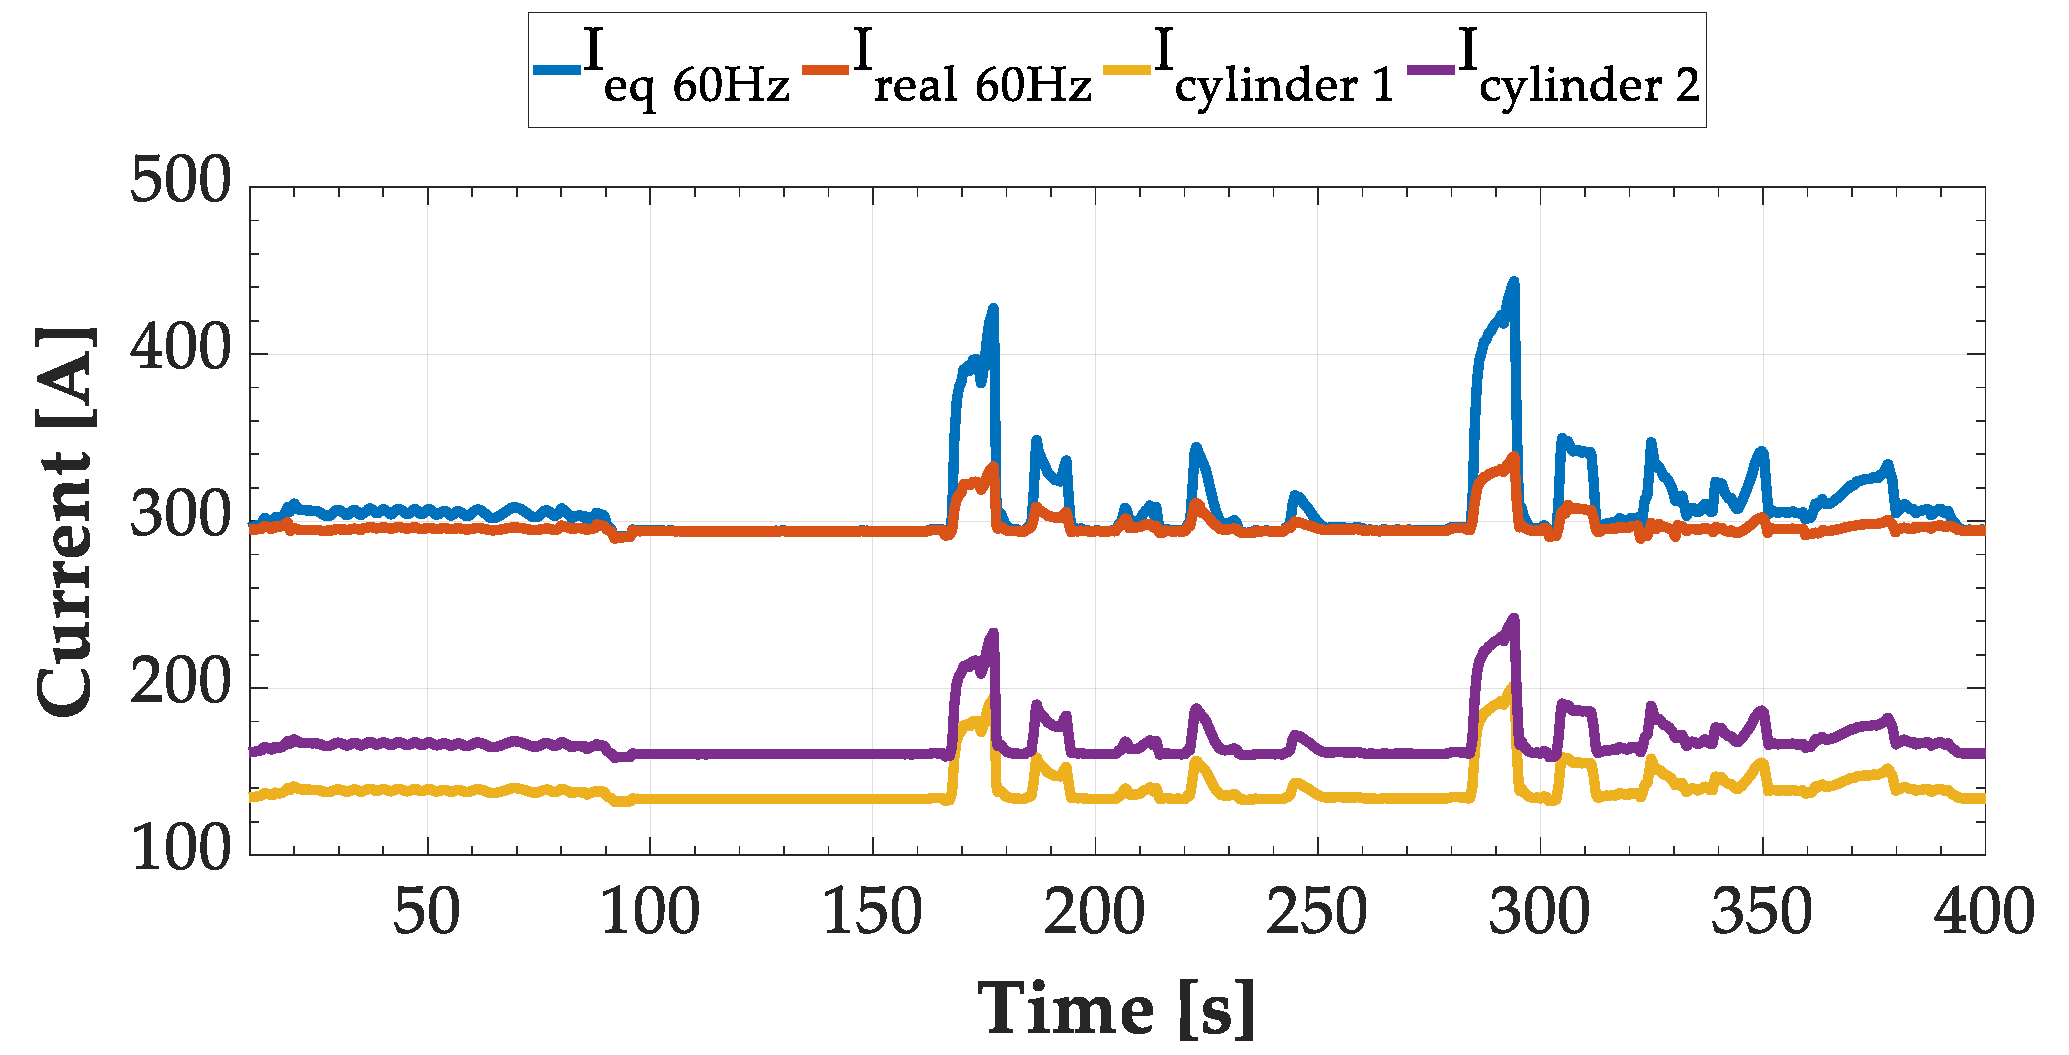
4.2.4. Simulation Results

The power losses in the inductor are obtained through magnetic simulations. As stated in Section 3, such losses are subsequently used as an input to the thermal model. The simulation of the thermal model utilizes a time step of 4 s to track the behavior of the different variables. The results from a steady-state simulation at rated operating conditions are taken as the start of this new study. The flowchart of the simulation process is the same as the one previously shown in Figure 13.
Figure 19 shows the evolution of the inductor temperature over time when performing the multiphysics simulation. The behavior of the temperature when the protection system in filter 3 trips is plotted with a green dotted line. Conversely, the evolution of the temperature when disregarding this protection is represented by solid lines. The slow decrease in the inductor temperature after the operation of the circuit breaker can be clearly observed.
As seen in Figure 19a, the temperatures of windings 1 and 2 are, respectively, 88 °C and 83 °C when the relay trips (293.5 s). These values are far from both the limit set by the manufacturer, 120 °C, and that established by IEEE standards, 130 °C [38]. Therefore, the relay trips even when not necessary. The existing overload is indeed within a safety range, far from the possibility of causing any damage to the insulating material [39]. The highest equivalent current peak values obtained during the simulation, i.e., those obtained from the application of the HDF, are 189 A for cylinder 1 and 227 A for cylinder 2. The maximum time that the windings can be exposed to the extreme conditions succeeding the trip event can be easily estimated by using the thermal time constant: Cylinders 1 and 2 could remain in healthy conditions, i.e., under the maximum temperature provided by the manufacturer (120 °C), for 21 and 35 additional minutes, respectively. Such a safety margin is unreasonably wide regarding the fast roughing mill dynamics.
On the other hand, the temperatures reached by windings 1 and 2 at the instant of interest (293.5 s) are 114.4 °C and 109.3 °C, respectively, when considering the case study in Figure 18, which includes the effect of solar irradiance. Therefore, the first layer is close to the maximum recommended value (120 °C) in this case. An exposure to the worst conditions after the trip event would mean 3.8 min for cylinder 1 and 8.7 min for cylinder 2 to drive those temperatures to the acceptable threshold. Although the safety margin is highly reduced with the previous case, it continues to be excessively wide regarding the roughing mill dynamics.
Figure 20 shows the results of the thermal analysis of the two situations included in this case study. Room temperature rises from 40 °C to 66.67 °C when solar irradiance is taken under consideration. In the same way, a clear difference is found in the final temperature between the layers, which rises from 70 °C to around 110 °C.

4.3. Recommended Practices and Requirements for Harmonic Control

Voltage distortion in power systems between 1 kV and 69 kV is limited by IEEE standards to 3% for individual harmonics and 5% for the THD [40]. More specifically, the daily 99th percentile of the distribution of samples taken in a 3 s time window should be under 1.5 times the aforementioned limits. Additionally, the weekly 95th percentile of the distribution of samples taken in a 10 min time window should remain under those limits [10]. Figure 21 shows the impact of the disconnection of filter 3 on the THD of the voltage at the PCC. Both the very short time samples (3 s) and the short time samples (10 min) comply with the standard requirements.
Additionally, the IEEE standard 1453-1-2015 [41] establishes that the value of rapid voltage changes should be limited to 3% under normal operating conditions. Filter 3 is one of the branches with the highest rated power (12.5 Mvar). In fact, a sudden disconnection of filter 3 causes a voltage variation that exceeds the aforementioned recommendations [10], as shown in Figure 22.
The filter improves the performance of the installation, reduces the harmonic distortion and contributes to voltage stability. For all these reasons, it is extremely important to avoid the nuisance tripping of filter 3 due to a deficient setup of the protective devices. Monitoring the behavior of the filter banks and gathering an extensive knowledge of the facilities is essential to prevent unintended disconnections that may lead to huge economic losses.

5. Conclusions

A correct determination of eddy currents, as well as skin and proximity effects, which are frequency dependent phenomena caused by the interaction of electric and magnetic fields, is necessary to obtain a reliable coil model. Thermal image relays are used to protect dry-type air-core reactors from overloads, which are frequently provoked by current harmonics. Prolonged exposures to such high currents can damage the insulation of the coils when no protective devices are used. According to standards the maximum temperature rise in a winding should be limited to 80 °C. Moreover, relays should be set to latch under 130 °C, although manufacturers recommend that they be set at 120 °C.
In this context, the present work formulates the following proposals:
  • A simple method to determine the temperature of the windings of the cylinders in a reactor is developed. This method is assessed under rated conditions, both by using a theoretical approach and by analysing real measurements obtained with a pyrometer.
  • A methodology to compute the impedance of dry-type air-core reactors regardless of the number of concentric cylinders is proposed. This methodology enables the calculation of the current distribution in the coil, which highly affects the temperature profile.
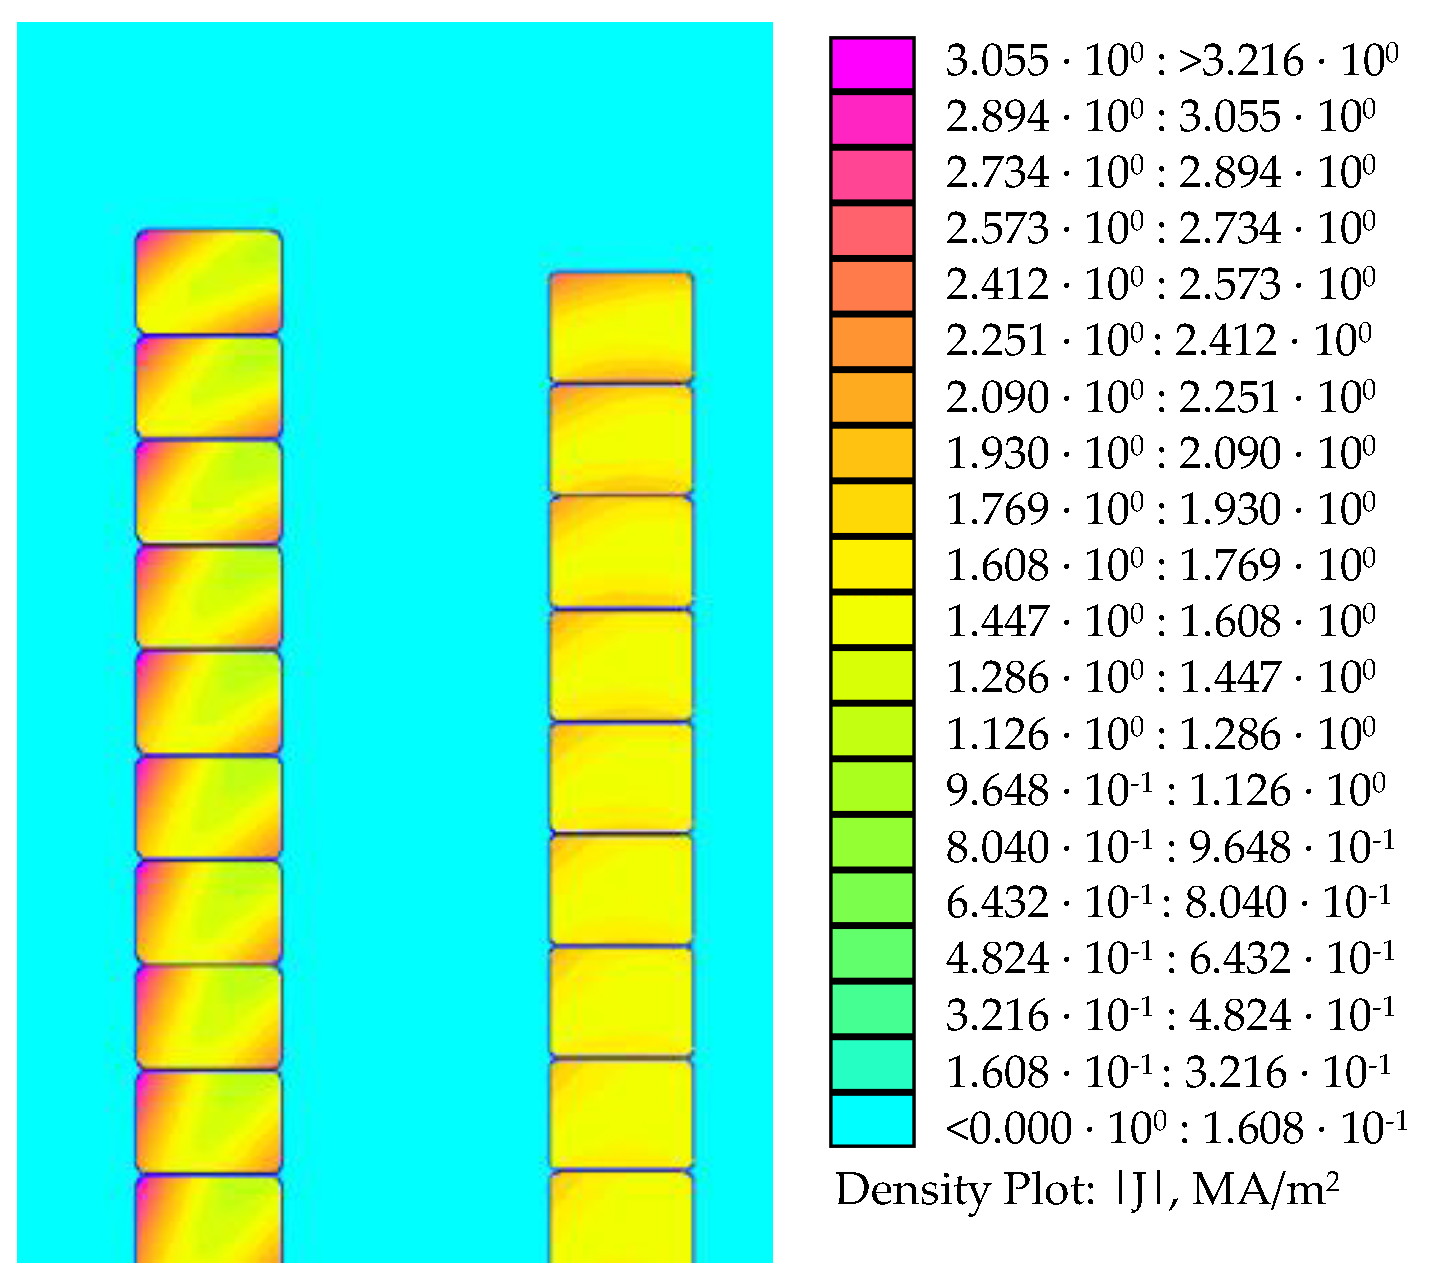
  • A FEM model is created with the aim of estimating the power losses caused by the stray currents in the reactor. The model calculates the magnetic flux density in the device in order to accurately characterize these power losses.
  • A multiphysics simulation whereby the magnetic and thermal problems are solved concurrently is proposed to obtain the profile of temperatures of the coil.
The conducted investigation is intended to provide the operators of any industrial facility with indispensable information to readjust, if necessary, the trip curves of the overload protection relays. These readjustments can reduce the number of unscheduled stoppages of the installation, leading to a reduction in production costs. This is a crucial contribution of this work, as economic losses caused by unintended shutdowns are reported to reach one million dollars annually in the steel sector [36]. The plant operator can simulate any event by using the developed set of models and decide in which cases it is advisable to prevent the protection system from tripping. This decision can be made without jeopardizing the integrity of the filter bank and assuring that both the THD voltage rates and the rapid voltage variations are under recommended limits to comply with technical restrictions or existing regulations.
The undertaken case studies lead to the conclusion that a typical setup of the protection system performs adequately on the hottest days, with extreme conditions of room temperature and solar irradiance. However, under normal operating conditions, the safety margin of the coil is excessively wide which renders a readjustment of the tripping curves advisable to avoid unnecessary operations of the protective devices.

Author Contributions

Conceptualization, J.R.D. and G.A.O.; methodology, J.R.D. and G.A.O.; software, J.R.D.; validation, J.R.D.; formal analysis, J.R.D. and G.A.O.; investigation, J.R.D. and G.A.O.; resources, J.R.D. and G.A.O.; data curation, J.R.D.; writing—original draft preparation, J.R.D.; writing—review and editing, J.G.N., J.M.C., J.R.D., A.V. and G.A.O.; visualization, J.R.D., G.A.O., J.M.C., J.G.N. and A.V.; supervision, G.A.O.; project administration, G.A.O. and J.M.C.; funding acquisition, G.A.O., J.M.C. and J.G.N. All authors have read and agreed to the published version of the manuscript.

Funding

This research was funded by the National Plan for Scientific and Technical Research and Innovation, grant number DPI2017-89186-R.

Acknowledgments

The authors gratefully acknowledge the Research and Development Center of ArcelorMittal Basque Country, University of Oviedo and the Spanish Ministry of Economy and Competitiveness, within the framework of the National Plan for Scientific and Technical Research and Innovation for their technical and financial support during this study.

Conflicts of Interest

The authors declare no conflict of interest.

Abbreviations

ACAlternating current
ANSIAmerican National Standards Institute
CADComputer aided design
FEAFinite element analysis
FDMFinite difference method
FEMFinite element method
FOCField-oriented control
HDFHarmonic distortion factor
IECInternational Electrotechnical Commission
IEEEInstitute of Electrical and Electronics Engineers
PCCPoint of common coupling
RMSRoot mean square
THDTotal harmonic distortion

References

  1. Chen, C.S.; Lee, Y.D.; Hsu, C.T.; Ting, D.S.; Shen, C.C. Power Quality Assessment of a Hot Strip Mill with Cycloconverter Drive Systems. In Proceedings of the Industry Applications Conference, 42nd IAS Annual Meeting, New Orleans, LA, USA, 23–27 September 2007. [Google Scholar]
  2. Hosoda, H.; Kodama, S.; Tessendorf, R. Large PWM Inverters for Rolling Mills. Iron Steel Technol. 2008, 5, 65–73. [Google Scholar]
  3. Chattopadhyay, A.K. Alternating Current Drives in the Steel Industry, Advancements in the last 30 years. In Industrial Electronics Magazine; IEEE: Piscataway, NJ, USA, 2010; Volume 4, pp. 30–42. [Google Scholar] [CrossRef]
  4. Orcajo, G.A.; Rodriguez, D.J.; Ardura, G.P.; Cano, J.M.; Norniella, J.G.; Llera, T.R.; Cifrian, R.D. Dynamic Estimation of Electrical Demand in Hot Rolling Mills. In IEEE Transactions on Industry Applications; IEEE: Piscataway, NJ, USA, 2016; Volume 52, pp. 2714–2723. [Google Scholar] [CrossRef] [Green Version]
  5. Vicente, A.; Picon, A.; Arteche, J.A.; Linares, M.; Velasco, A.; Sainz, J.A. Magnetic field-based arc stability sensor for electric arc furnaces. Measurement 2020, 151, 107134. [Google Scholar] [CrossRef]
  6. Xie, X.; Zhang, J.; Tao, S.; Xu, M.; Li, F.; Hang, Y.; Zhang, L.; Tang, H.; Miao, H.; Li, Y. Common accidents and precautions of Dry-type Air-core reactors. In Proceedings of the 5th International Conference on Machinery, Materials and Computing Technology (ICMMCT 2017), Beijing, China, 25–26 March 2017. [Google Scholar] [CrossRef]
  7. Nurminen, K. Thermal Modeling and Evaluation of Harmonic Effects on a Dry Type Air Core Reactor. Ph.D. Thesis, Helsinki University of Technology, Espoo, Finland, 2008. [Google Scholar]
  8. Yuan, F.T.; Yuan, Z.; Liu, J.X.; Wang, Y.; Mo, W.X.; He, J.J. Research on temperature field simulation of dry type air core reactor. In Proceedings of the 2017 20th International Conference on Electrical Machines and Systems (ICEMS), Sydney, Australia, 11–14 August 2017. [Google Scholar]
  9. Meeker, D. Finite Element Method Magnetics. Available online: http://www.femm.info/wiki/HomePage (accessed on 1 July 2020).
  10. Orcajo, G.A.; Ardura, G.P.; Rodriguez, D.J.; Cano, J.M.; Norniella, J.G.; Llera, T.R.; Cifrian, R.D. Overcurrent Protection Response of a Hot Rolling Mill Filtering System: Analysis of the Process Conditions. In IEEE Transactions on Industry Applications; IEEE: Piscataway, NJ, USA, 2017; Volume 53, pp. 2596–2607. [Google Scholar] [CrossRef]
  11. Phipps, J.K. A Transfer Function Approach to Harmonic Filter Design. In IEEE Industry Applications Magazine; IEEE: Piscataway, NJ, USA, 1997; Volume 38. [Google Scholar]
  12. Rodríguez, J.R.; Pontt, J.; Newman, P.; Musalem, R.; Miranda, H.; Morán, L.; Alzamora, G. Technical Evaluation and Practical Experience of High-Power Grinding Mill Drives in Mining Applications. In IEEE Transactions on Industry Application; IEEE: Piscataway, NJ, USA, 2005; Volume 41. [Google Scholar] [CrossRef]
  13. Wolfgang, T. Cycloconverter Drives for Rolling Mills. In IEEE Transactions on Industry Applications; IEEE: Piscataway, NJ, USA, 1982; Volume 8, pp. 400–404. [Google Scholar]
  14. Brandi, E.; Abboud, R.; Calero, F. Protecting Harmonic Filters in a 600 kV HVDC Installation. In Proceedings of the 42nd Annual Western Protective Relay Conference, Spokane, Washington, DC, USA, 20–22 October 2015. [Google Scholar]
  15. Lacerda, D.O.; Campos, R.C.; Alves, M.F.; Zaninelli, H.R. Mechanically Switched Capacitor with Damping Network (MSCDN)—Engineering Aspects of Application, Design and Protection. In Proceedings of the IEEE/PES Transmission and Distribution Conference and Exposition, Sao Paulo, Brazil, 8–10 November 2010. [Google Scholar]
  16. Gajić, Z.; Hillström, B.; Mekić, F. HV Shunt Reactor Secrets for Protection Engineers. In Proceedings of the 30th Western Protective Relaying Conference, Spokane, Washington, DC, USA, 20–22 October 2003. [Google Scholar]
  17. MathWorks. MATLAB and Simulink for Technical Computing [Online]. 2019. Available online: https://www.mathworks.com/ (accessed on 31 August 2020).
  18. Goh, Y.L.; Ramasamy, A.K.; Nagi, F.H.; Abidin, A.A.Z. Numerical relay for overcurrent protection using TMS320F2812. In Proceedings of the 9th WSEAS International Conference on Circuits, Systems, Electronics, Control & Signal Processing, CSECS′10, Stevens Point, WI, USA, 29–31 December 2010; pp. 44–50. [Google Scholar]
  19. Alzuhairi, M.T.L. Part V: Overcurrent Portective Relays. 1997. Available online: https://www.philadelphia.edu.jo/academics/mlazim/uploads/Power%20System%20protection%20-%20Part%2005.pdf (accessed on 31 August 2020).
  20. Lerusalimschy, R.; Figueiredo, L.H.d.; Celes, W. Lua. Available online: http://www.lua.org/home.html (accessed on 14 July 2020).
  21. Henrotte, F.; Hedia, H.S.; Bamps, N.; Genon, A.; Nicolet, A.; Willy, L. A new method for axisymetric liner and nonlinear problems. In Proceedings of the Digest of the Fifth Biennial IEEE Conference on Electromagnetic Field Computation, Claremont, CA, USA, 3–5 August 1992; IEEE: Piscataway, NJ, USA, 1992; pp. 1352–1355. [Google Scholar]
  22. Meeker, D. Finite Element Method Magnetics (FEMM)–Version 4.2–User’s Manual. 2018. Available online: http://www.femm.info/Archives/doc/manual.pdf (accessed on 14 July 2020).
  23. Irasari, P.; Alam, H.S.; Kasim, M. Thermal Analysis on Radial Flux Permanent Magnet Generator (PMG) using Finite Element Method. IPTEK J. Technol. Sci. 2011, 22, 102–109. [Google Scholar] [CrossRef] [Green Version]
  24. Yuan, F.T.; Yuan, Z.; Chen, L.; Wang, Y.; Liu, J.; He, J. Thermal and Electromagnetic Combined Optimization Design of Dry Type Air Core Reactor. Energies 2017, 10, 1989. [Google Scholar] [CrossRef] [Green Version]
  25. Hak, J. Eisenlose Drosselspulen; K.F.Koeler Verlag: Leipzig, Germany, 1938. [Google Scholar]
  26. Rosa, E.B.; Grover, F.W. Formulas and Tables for the Calculation of Mutual and Self-Inductances. Bull. Bur. Stand. 1912, 8, 119–121. [Google Scholar] [CrossRef]
  27. Dwight, H.; Grover, F. Some Series Formulas for Mutual Inductance of Solenoids. In Electrical Engineering; IEEE: Piscataway, NJ, USA, 1937; Volume 56, pp. 347–353. [Google Scholar] [CrossRef]
  28. Yu, Q. Calculation of Three Dimensional Magnetic Field Distribution of Large Air- Core Reactor Coils. Ph.D. Thesis, The Ohio State University, Columbus, OH, USA, 1996. Available online: https://etd.ohiolink.edu/!etd.send_file?accession=osu1487935573770259&disposition=inline (accessed on 31 August 2020).
  29. Schneider Electric. Cathier Technique No. 83. Extra Losses Caused in High Current Conductors by Skin and Proximity Effects. 1983. Available online: http://studiecd.dk/cahiers_techniques/Extra_losses_caused_in_high_current_conductors.pdf (accessed on 31 August 2020).
  30. IEEE Std. C57.110-2018-IEEE Recommended Practice for Establishing Liquid-Immersed and Dry-Type Power and Distribution Transformer Capability When Supplying Nonsinusoidal Load Currents; The Institute of Electrical and Electronics Engineers: Piscataway, NJ, USA, 2018. [Google Scholar] [CrossRef]
  31. Field, R.F.; Radio, C.G.; Cambridge, M. Reduction of Losses in Air-Cored Coils. 1950. Available online: https://www.ietlabs.com/pdf/GR_Appnote/A51%20Field,%20Reduction%20of%20Losses%20in%20Air-cored%20Coils.pdf (accessed on 31 August 2020).
  32. Yong, J.; Xu, W. A Method to Estimate the Impact of Harmonic and Unbalanced Currents on the Ampacity of Concentric Neutral Cables. In IEEE Transactions on Power Delivery; IEEE: Piscataway, NJ, USA, 2016; Volume 7, pp. 1971–1979. [Google Scholar] [CrossRef]
  33. Yuan, Z.; He, J.-J.; Pan, Y.; Yin, X.-G.; Ding, C.; Ning, S.-F.; Li, H.-L. Thermal Analysis of Air-Core Power Reactors. ISRN Mech. Eng. 2013, 2013, 6. [Google Scholar] [CrossRef]
  34. Huang, D.; Wu, S.; Zhao, H. Simulation of the Effect of Solar Radiation on Hardening and Hardened Concrete Wall. 2011, 163–167, 1489–1494. Adv. Mater. Res. 2011, 163–167, 1489–1494. [Google Scholar] [CrossRef]
  35. Richter, R. Elektrishe Maschinen; Springer: Berlin/Heidelberg, Germany, 1924. [Google Scholar]
  36. Shwehdi, M.; Mantawy, A.H. Investigation of Electrical Load Disturbances Influences on Steel Factory Production Lines. Int. J. Educ. Res. 2019, 7, 41–54. [Google Scholar]
  37. IEEE Std. C57.16–2011 IEEE Standard for Requirements, Terminology, and Test Code for Dry-Type Air-Core Series-Connected; IEEE: Piscataway, NJ, USA, 2012. [Google Scholar] [CrossRef]
  38. IEEE. C57.21–2008 IEEE Standard Requirements, Terminology, and Test Code for Shunt Reactors Rated Over 500 kVA; IEEE: Piscataway, NJ, USA, 2008. [Google Scholar] [CrossRef]
  39. Wang, Y.; Chen, X.; Pan, Z.; Lu, H.; Wen, X.; Jiang, Z.; Chen, B.; Chen, T. Theoretical and Experimental Evaluation of the Temperature Distribution in a Dry Type Air Core Smoothing Reactor of HVDC Station. Energies 2017, 10, 623. [Google Scholar] [CrossRef] [Green Version]
  40. IEEE Std. 519–2014 IEEE Recommended Practices and Requirements for Harmonic Control in Electrical Power Systems; IEEE: Piscataway, NJ, USA, 2014. [Google Scholar] [CrossRef]
  41. IEEE Std. 1453–2015 IEEE Recommended Practice for the Analysis of Fluctuating Installations on Power Systems; IEEE: Piscataway, NJ, USA, 2015. [Google Scholar] [CrossRef]
Figure 1. Schematic of the hot rolling mill.
Energies 13 04540 g001
Figure 2. Diagram of the distribution network and filtering system.
Energies 13 04540 g002
Figure 3. Simplified flowchart of the proposed study.
Energies 13 04540 g003
Figure 4. Electric model of the plant: (a) Simplified circuit model; (b) equivalent circuit model.
Energies 13 04540 g004aEnergies 13 04540 g004b
Figure 5. Frequency response of the filtering system.
Energies 13 04540 g005
Figure 6. Electrical parameters from the point common coupling (PCC) with and without filter bank: (a) RMS value of the current upstream; (b) Total harmonic distortion (THD) of the voltage.
Energies 13 04540 g006
Figure 7. Trip curve of the relay used in filter 3: (a) Frequency response; (b) time-current curve.
Energies 13 04540 g007
Figure 8. Proposed overcurrent relay 50/51 model.
Energies 13 04540 g008
Figure 9. Trip curve used in the model.
Energies 13 04540 g009
Figure 10. CAD design of the reactor: (a) 3D design of the dry-type air-core reactor; (b) axisymmetric 2D model of the dry-type air-core reactor.
Energies 13 04540 g010
Figure 11. Equivalent electric circuit for the FEM model.
Energies 13 04540 g011
Figure 12. Definition of boundary conditions.
Energies 13 04540 g012
Figure 13. Simulation of the physical process.
Energies 13 04540 g013
Figure 14. Filter 3 relay current: (a) Real operating condition; (b) detailed view of an abnormal event.
Energies 13 04540 g014
Figure 15. Peak value of the main harmonic currents tracked by the relay.
Energies 13 04540 g015
Figure 16. Resistance and reactance values of the air-core reactor: (a) Cylinder 1; (b) cylinder 2; (c) values considering skin and proximity effects.
Energies 13 04540 g016
Figure 17. Peak of the equivalent current at 60 Hz (HDF factor) and internal distribution.
Energies 13 04540 g017
Figure 18. Current density of inductor in filter 3 (cylinder 1: 189 A; cylinder 2: 227 A; t = 293.5 s).
Energies 13 04540 g018
Figure 19. Temperature in the winding of the dry-type air-core reactor in filter 3. (a) Without including the effect of solar irradiance; (b) including the effect of solar irradiance.
Energies 13 04540 g019
Figure 20. Results from the thermal analysis. (a) Without including the effect of solar irradiance; (b) including the effect of solar irradiance; (i) initial state; (ii) state at 293.5 s
Energies 13 04540 g020
Figure 21. THD of the voltage at the PCC 34.5 kV.
Energies 13 04540 g021
Figure 22. RMS phase voltage value and voltage drop at PCC.
Energies 13 04540 g022
Table 1. Main characteristics of the stands.
StandsMotor Power (MW)PolesCycloconverter TopologyTransformer Power (MVA)
F1, F2, F386Circulating-current-free14.4
F4, F5, F686Circulating-current15.7
R1 (top), R1 (bottom)7.512Circulating-current-free14.4
Table 2. Characteristics of filter branches.
Filter 1
C-Type
Filter 2
Tuned
Filter 3
High Pass
Filter 4
High Pass
Order of tuned frequency2.64.08610
Inductance [mH]54.918.77.232.6
Capacitance [µF]C11 = 127.6 C12 = 22.32272722.5
Resistance [Ω]2690.3681.628.9
Rated power [Mvar]1010.812.512.3
Table 3. Main current harmonics.
OrderMag (% of Fundamental)
Time 100 sTime 288 s
30.380.97
50.366.48
70.243.23
111.452.72
130.391.28
Time 100 s, Fundamental (60 Hz) = 962.7 A, 12 cycles window. Time 288 s, Fundamental (60 Hz) = 956.7 A, 12 cycles window.
Table 4. Characteristics of protection relays.
Order of tuned frequency2.64.08610
Time delay setting range1–10 s
Current setting range0.2–0.6 A1–3 A1.5–4 A
Selected tap0.31 A1.2 A1.3 A3.4 A
Selected time delay10 s10 s10 s10 s
Table 5. Characteristics of dry-type air-core reactor in filter 3.
General CharacteristicsPhysical Characteristics
Cylinder
System Voltage34.5 kV1Gap2
Frequency60 HzHeight1255 mmCooling air gap 15 mm1245 mm
Temperature rise (winding)80 °CDiameter915 mm995 mm
Air temperature40 °CNumber of winding turns (1 layer)124115
LocationOutdoorWinding turn details14 × 10 mm (38 parallel wires) Aluminium14 × 11 mm (38 parallel wires) Aluminium
Fundamental current230 A
Inductance7.23 mH
Table 6. Magnetic simulation: Material properties.
Material (Linear B-H in All Cases)Linear Properties 1Electrical Conductivity σ [MS/m] 40 °CSpecial Attributes: Lamination and Wire Type
Relative µrRelative µz
Aluminium (windings)1133.2Not laminated o stranded
Air110Not laminated o stranded
1 Properties not listed are equal to 0.
Table 7. Thermal simulation: Material properties.
MaterialThermal Conductivity [W/m·K]Volumetric Heat Capacity [MJ/m3·K]Volumetric Heat Generation [W/m3]
Aluminium (windings)Depends on temperature30
Mylar (insulation)kr = kz = 230
AirDepends on temperature30
Table 8. Characterization of the results obtained through FEA.
Real Impedance [Ω]Mathematical Impedance [Ω]FEM Model Impedance [Ω]Mathematical Coupling Impedance [Ω]FEM Coupling Impedance [Ω]
SimpleGrower and Nagaoka
2.732.632.7252.70.91960.91 *
* The coupling impedance value obtained with FEMM varies between 0.9100 Ω at 60 Hz and 0.9194 Ω at 780 Hz.
Table 9. Multiphysics model validation.
4τ FEM Simulation [°C]
τ = 4380 s
Deviation [%]
98% Steady State FEM Simulation—4τ FEM Simulation
Real Temperature ** [°C]Steady State FEM Simulation [°C]
Cylinder 178 (84.4%) *1.780–8585
Cylinder 273.5 (83.75%) *1.680
Reactor75.75 (83.13%) *1.883
* The values in parentheses are obtained by dividing the temperature variation from the 4τ simulation by the difference between the steady-state simulation and room temperature. ** The real temperature is provided by pyrometers measurement at rated conditions.

