Abstract
Coal combustion flue gas contains CO2, a greenhouse gas and driver of climate change. Therefore, CO2 separation and removal is necessary. Fortunately, 5A zeolites are highly porous and can be used as a CO2 adsorbent. In addition, they act as nuclei for hydrate formation. In this work, a composite technology, based on the physical adsorption of CO2 by 5A zeolite and hydrate-based gas separation, was used to separate CO2/N2 gas mixtures. The influence of water content, temperature, pressure, and particle size on gas adsorption and CO2 separation was studied, revealing that the CO2 separation ability of zeolite particles sized 150–180 μm was better than that of those sized 380–830 μm at 271.2 K and 273.2 K. When the zeolite particles were 150–180 μm (type-B zeolite) with a water content of 35.3%, the gas consumption per mole of water (
) reached the maximum, 0.048, and the CO2 separation ratio reached 14.30%. The CO2 molar concentration in the remaining gas phase () was lowest at 271.2 K in the type-B zeolite system with a water content of 47.62%. Raman analysis revealed that CO2 preferentially occupied the small hydrate cages and there was a competitive relationship between N2 and CO2.
1. Introduction
Various greenhouse gases, emitted by human activities, cause global warming, which continues to worsen. CO2 is the largest contributor to the greenhouse effect [1,2,3]. Currently, the CO2 emissions of coal-fired power plants account for 40% of total greenhouse gas emissions. Therefore, decreasing the CO2 emissions in the flue gas of power plants is critical to achieving CO2 emission reduction goals. Depending on the type of power plant, there are three main technologies for decreasing CO2 emissions: pre-combustion capture, oxy-fuel combustion, and post-combustion capture [4,5,6]. However, based on the advantages and disadvantages of these three technologies, the most widely used, at present, is post-combustion capture. Post-combustion capture refers to the capture and separation of CO2 after coal has been burned. The main components of the flue gas are CO2 and N2. As the concentration of N2 in the air is relatively high, the partial pressure of CO2 in the flue gas is relatively low.
The methods of CO2 separation, include membrane separation, low temperature distillation, chemisorption, and physical adsorption separation [7,8]. Among them, adsorption by porous media and gas separation have become hot topics of research in recent years [9,10,11,12]. Common adsorbents include metal-organic frameworks (MOFs) [13], zeolites [14], and silica gel [15]. The physical adsorption method is generally suitable for CO2 separation at high pressures, in which the CO2 and CH4 separation coefficients of MOFs are better. In addition, the separation coefficient of medium-pore zeolite molecular sieve (SBA-15) is low, whereas the microporous zeolites (such as 5A zeolite and 13X zeolite) have high separation factors [16].
Zeolites are essentially crystalline silicates or aluminosilicates, composed of silicon–oxygen tetrahedrons or silicon–aluminum tetrahedrons, connected by oxygen bridge bonds. Zeolites have a uniform pore size and show a sieving effect on molecules less than, or equal to, the pore size. Two of the commonly used zeolites for gas separation are 5A and 13X zeolites [17,18]. As the pore size of 5A zeolite is similar to the size of CO2, it is often used for CO2 separation from mixed gases. Saha et al. [13] studied the adsorption capacity of three porous materials, MOF-5, MOF-177, and 5A zeolite, for CO2, CH4, N2O, and N2, and found that 5A zeolite shows better CO2 separation from air and CH4/CO2 gas mixtures than MOF-5 and MOF-177. Meanwhile, they also found that 5A zeolite can be used for CO2/N2 and CO2/CH4 separation but not for CH4/N2 separation [16,17]. However, physical adsorption requires a large amount of adsorbent, as well as frequent adsorption and desorption. Therefore, the CO2 separation capacity of physical adsorption methods alone is limited.
In recent years, hydrate-based gas separation (HBGS) technology has gained increasing attention as a new adsorption technology [19,20,21]. Hydrates are special ice-like non-crystalline cage compounds that form under high pressures and low temperatures [22]. Hydrates have different phase equilibrium conditions for different guest molecules. Therefore, gases can be separated by controlling the hydrate formation conditions [23]. However, the formation of hydrates requires high pressures and low temperatures, and the formation rate is relatively slow without an accelerator. Therefore, additives are often used to accelerate the hydrate formation rate [24,25,26]. The pore structure of 5A zeolite can provide nucleation points for hydrate crystals, thereby, promoting the hydrate formation [27]. At the same time, 5A zeolite is also a suitable physical adsorbent for CO2 separation.
Therefore, in this study, considering the pore characteristics of the 5A zeolite and the high gas storage capacity of hydrates, both 5A zeolite and hydrates were used for CO2 separation from synthesized flue gas (CO2/N2). The 5A zeolite has a dual role, acting as both gas adsorbent and kinetic additive for hydrate formation. In addition, the hydrate formation kinetics and CO2 separation in different particle size 5A zeolite systems with different water contents under constant pressure and temperatures were studied. Furthermore, the hydrates were sampled and tested by Raman spectroscopy to reveal the interactions between CO2 and N2 in the hydrate cages. The experimental results provide new ideas, and basic theoretical data for CO2 separation from flue gas, using HBGS technology.
2. Experimental
2.1. Experimental Apparatus and Materials
A schematic of the experimental device for the hydrate reaction is shown in Figure 1. The apparatus comprises a reaction vessel, a buffer tank, an evacuation system, a thermostatic bath, a temperature and pressure monitoring system, a gas chromatography (GC) detection system, and a data acquisition system. The main piece of equipment is the high-pressure reactor vessel with an internal volume of 98 mL and a buffer tank with an internal volume of 306 mL. The temperature and pressure in reactor vessel and buffer tank were monitored, using a temperature sensor and pressure sensor. The range of the sensor was 223.15–373.15 K with an accuracy of ±0.1 K. The range of the pressure sensor was 0–20 MPa with an accuracy of ±0.01 MPa. Both, the high-pressure reaction vessel and the buffer tank were placed in a thermostatic water bath. The thermostatic control system was a THD-2030 water bath, and the bath was filled with aqueous ethylene glycol solution. Ethylene glycol was provided by Guangzhou Chemical Reagent Factory and had a purity of >95%. In the experiment, the pressure (P) and temperature (T) data were collected every 10 s by an Agilent 34970A acquisition system provided by Agilent Technologies Co., Ltd., Santa Clara, CA, USA.
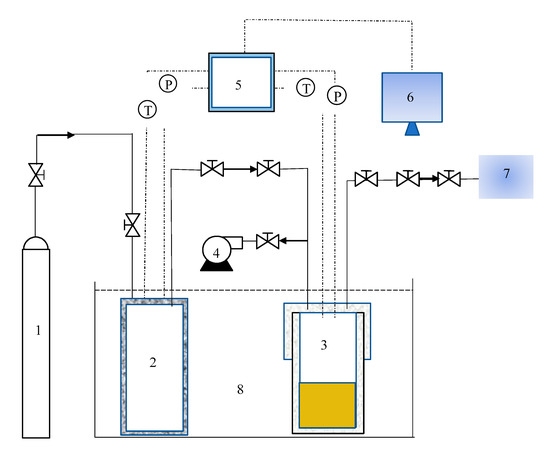
Figure 1.
Schematic diagram of hydrate formation experimental reaction device. 1. Gas cylinder, 2. buffer tank, 3. high-pressure reactor vessel, 4. vacuum pump, 5. data acquisition system, 6. computer, 7. gas chromatograph, and 8. thermostatic bath.
The gas mixture (CO2/N2 = 20/80) was purchased from the Guangzhou Puyuan gas plant in China. The CO2 and N2 used were ultrapure gases having concentrations of 99.9%. The 5A zeolite used in the experiment was sieved and classified as type A, having a diameter distribution of 380–830 μm, and type B, having a diameter distribution of 150–180 μm. The 5A zeolite was purchased from Macklin Co., Ltd., Shanghai, China. Deionized water was purchased from Guangzhou Chemical Reagent Factory. The specifications and sources of the experimental devices are shown in Table 1.

Table 1.
Experimental devices and specifications.
2.2. Experimental Procedures
First, 35 mL of zeolite and an appropriate amount of deionized water were added to the clean reaction vessel. The reaction vessel was sealed and placed in the water bath. Then, gas was charged into the buffer tank slowly after the entire experimental system had been evacuated by a vacuum pump. When the pressure reached 8.50 ± 0.1 MPa, the gas cylinder outlet valve and the buffer tank inlet valve were shut off. Then, the water bath was turned on and the temperature was set to a constant value. Next, the reactor feed was set to the determined pressure, and the gas outlet valve of the buffer tank and the inlet valve of the reactor were closed. After the hydrate reaction had started, the temperature and pressure in the reactor vessel were recorded and monitored by the data acquisition system every 10 s. The hydrate formation reaction was considered complete when the pressure drop of the reactor vessel in 2 h was less than 0.01 MPa. During the experiment, the gas was sampled several times for GC analysis, and the gas composition was analyzed in triplicate.
2.3. Microscopic Analysis of Hydrate Samples
Low-temperature Raman spectroscopy was used for the microscopic analysis of the hydrate samples. Before the tests, the hydrate samples were ground and crushed into fine powder in liquid nitrogen, and then sealed and stored in liquid nitrogen. The Raman analysis was carried out with a confocal Raman spectrometer (Horiba, LabRAM HR, Kyoto, Japan) equipped with a multichannel air-cooled charge-coupled device (CCD) detector and an Ar+ laser operating at 532 nm with a maximum power of 50 mW. Details have been reported previously [28]. The Raman analysis of the hydrate samples was carried out at 180 K. The in situ Raman measurement of hydrate dissociation was carried at 200 K.
3. Results and Discussion
The experiments were carried on with two different particle size distributions (type A: 380–830 and type B: 150–180 μm) and four water contents (35.3 wt.%, 42.11 wt.%, 47.62 wt.%, and 52.17 wt.%, reported as simple percentages, hereafter) to study the hydrate formation kinetics and evaluate the CO2 separation effect under different temperature and pressure conditions. The experimental conditions and results are summarized in Table 2. The initial gas pressure was 8.5 MPa.
Table 2.
Experimental conditions and results of hydrate based gas separation of CO2/N2 with 5A zeolite.
The gas consumption during hydrate formation at time t during the experiment is given by Equation (1):
Here, is the gas amount in the reaction vessel at the initial time (mol), is the gas amount in the reaction vessel at time t (mol), and Z is the compression factor calculated using Pitzer’s correlation [29].
The gas consumption per unit mole of water at time t () can be calculated using Equation (2):
The CO2 separation ratio () for binary gas mixture mixtures is defined by Equation (3):
Here, is the amount of CO2 in the hydrate (mol), and is the amount of CO2 in the initial feed gas (mol).
is the molar concentration of CO2 in the remaining gas phase, which can be calculated using Equation (4):
Here, and are the amount of CO2 and N2 in the remaining gas phase, respectively (mol).
The pressure curves during hydrate formation under different experimental conditions are shown in Figure 2. As shown in Figure 2a, in the first 300 min, the pressure drop and gas consumption increased as the water content increased from 35.3% to 52.17% for the type-A zeolite at 273.2 K. In addition, the pressure drop in the initial 50 min accounts for more than 80% of the total pressure drop. As shown in Figure 2b, when the temperature was reduced to 271.2 K, a large pressure drop occurred because of the “secondary formation” of hydrates, but the other conditions remained unchanged. The pressure drop was largest with the type-A zeolite at 271.2 K having a water content of 35.30%, but it increased as the water contents increased from 42.11% to 47.62% and 52.17%. For type-B zeolite (i.e., smaller particles), the gas pressure drop was the largest at water contents of 42.11% and 52.17% at 273.2 K, and 271.2 K, respectively, as shown in Figure 2c,d. The pressure drop increased with the increase in water content in the initial 300 min for the type-B zeolite at 271.2 K (Figure 2d). In general, in the type-B zeolite system, the magnitude of the gas pressure drop and its trend with water contents at 271.2 K changed little, compared with those of the other systems. In addition, the trends in the pressure drop with different water contents were also different when the other experimental conditions were fixed, as shown in Figure 2b,c. It was found that, under certain experimental conditions, the hydrate reaction proceeded in two stages. As shown in Figure 2b,c, when the water contents were 35.30% and 42.11%, the gas phase pressure dropped rapidly in the initial stage of the reaction. Then, there was a plateau stage where the pressure drop was very slight, that means hydrate formation rate was low at this stage, and then, it dropped sharply again until the end of the reaction. At the same time, under these conditions, the total decrease in gas pressure was the greatest.
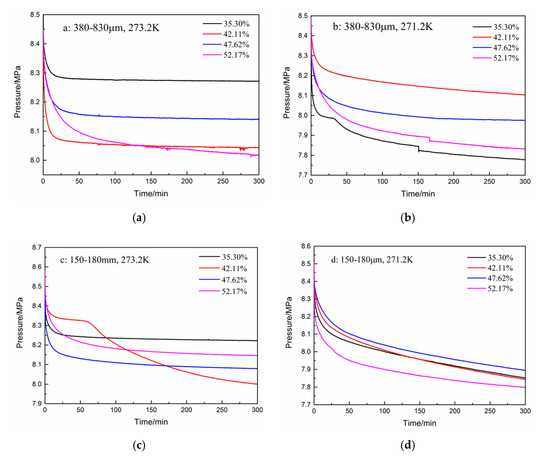
Figure 2.
Pressure drops for zeolites having different water contents at various temperatures. (a): 380–830 μm, 273.2 K; (b): 380–830 μm, 271.2 K; (c): 150–180 μm, 273.2 K; and (d): 150–180 μm, 271.2 K.
To characterize the hydrate formation kinetics clearly, the gas consumption per unit mole of water () under different conditions was calculated, and the results are listed in Table 2 and shown in Figure 3. The results obtained in this work are the average of three sets of repeated experiments. To ensure the reliability of the results, error bars are given in Figure 3. The error bas are the standard deviation that determined from the three repeated experimental data. Combined with the pressure variation in Figure 2, we determined that the values for four gas compositions for the type-B zeolite at 271.2 K were larger than those under other experimental conditions. In particular, the maximum was 0.048 at a water content of 35.3%. Overall, for the type-B zeolite was greater than that of the type-A zeolite under these experimental conditions. Therefore, smaller zeolite particles are more conducive to the formation of hydrates, thereby, increasing the total gas consumption.
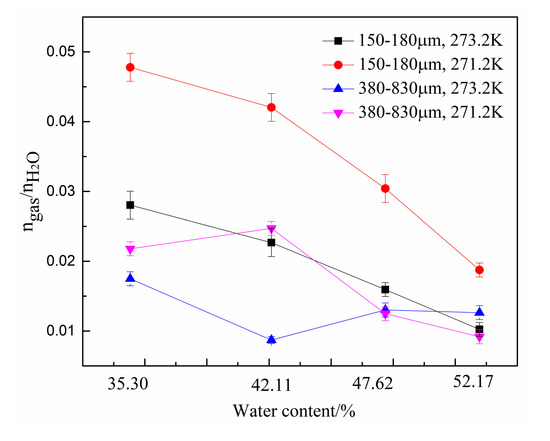
Figure 3.
Gas consumption per unit mole of water () under different experimental conditions.
Meanwhile, for the type-B zeolite system, decreased with increase in water content because, for mixed zeolite and water systems, the total gas consumption consists of two parts: The gas adsorbed by the pores of the zeolite and the gas stored in the hydrate cage structure. The effective aperture of 5A zeolites was about 0.5 nm. The molecule diameters of CO2 and N2 are 0.51 nm, and 0.41 nm, respectively. As the water content increased, the water occupied more zeolite pores, thereby, reducing the adsorption capacity of the zeolite itself and resulting in a decrease of the total gas consumption. Furthermore, because the gas storage capacity of the hydrate and the adsorption capacity of the zeolite are not equal, according to the definition of , it decreases as the water content increases.
However, for type-A zeolite system, the relationship between and water content was not linear. Therefore, in combination with the pressure change curve shown in Figure 2, we determined that there is an optimal water content for each zeolite system at which the formation of hydrates is most favorable.
In addition to the total gas consumption and unit consumption, the CO2 separation effect is a focus of this work. The changes in the CO2 and N2 molar ratio during hydrate formation are shown in Figure 4 and Figure 5. A total of five samples were taken from the gas phase in the experiment. As shown in Figure 4, the CO2 molar ratio decreased sharply in the first 500 min. The N2 molar ratio increased correspondingly. Subsequently, the CO2 molar ratio continued to decrease slowly until the end of the reaction. However, when the water content was 35.30% in the type-B zeolite system, the CO2 gas molar ratio rose slightly before the end of the reaction, but, despite this, the CO2 gas molar ratio was still minimized at the end of the reaction. Correspondingly, the N2 molar ratio shows a similar trend.
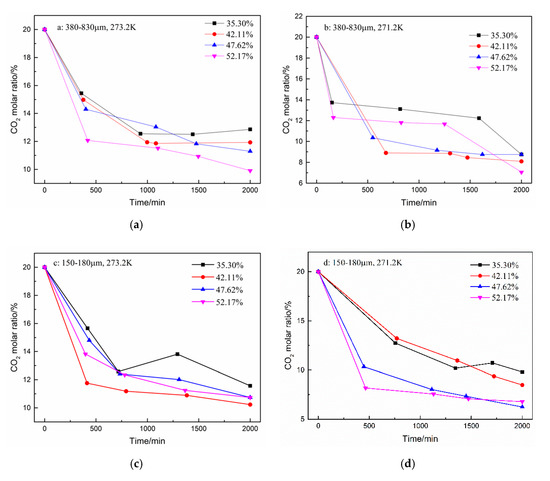
Figure 4.
CO2 molar ratio in the gas phase after hydrate formation under different conditions. (a): 380–830 μm, 273.2 K; (b): 380–830 μm, 271.2 K; (c): 150–180 μm, 273.2 K; and (d): 150–180 μm, 271.2 K.
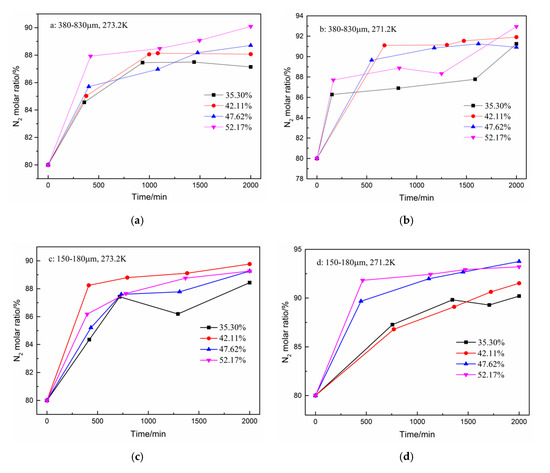
Figure 5.
N2 molar ratio in gas phase after hydrate formation under different conditions. (a): 380–830 μm, 273.2 K; (b): 380–830 μm, 271.2 K; (c): 150–180 μm, 273.2 K; and (d): 150–180 μm, 271.2 K.
To characterize the CO2 separation effect, the CO2 molar concentration in the remaining gas phase () in zeolites with different water content are compared in Figure 6. As shown in the figure, for the same zeolite particle size, was lower at 271.2 K than that at 273.2 K, indicating that lower temperatures enhance the CO2 gas separation effect. Under same experimental conditions, decreased when the water content was increased from 35.3% to 42.11%. However, when the water content was greater than 42.11%, was not only affected by the water content but also affected by the temperature and zeolite particle size. When the water content increased from 47.62% to 52.17%, decreased in the system with type-A zeolite and increased in system with type B zeolite. Overall, was lowest at 271.2 K in the system with type-B zeolite having a water content of 47.62%.
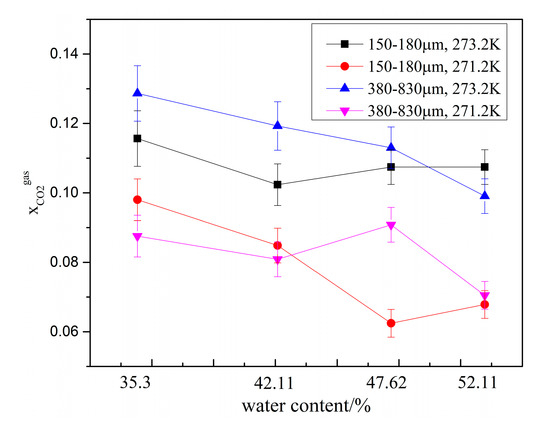
Figure 6.
CO2 molar concentration in the remaining gas phase () in the presence of different amounts of water.
The CO2 separation ratio also reflects the capacity of hydrates to capture CO2. To compare the gas separation abilities of various systems, the CO2 separation ratios are compared in Figure 7. The error bars are given in Figure 6 and Figure 7 too. As for the data in Figure 6, the CO2 separation ratio was largest at 271.2 K in the type-B zeolite system having a water content of 47.62%. Moreover, the relationship between the CO2 separation ratio and various experimental conditions was consistent with the trend in . Therefore, all factors, including zeolite particle size, water contents, and thermodynamic conditions, affect the gas separation ability in the HBGS method and should be evaluated comprehensively. In addition, there are optimal experimental conditions in HBGS where the best CO2 separation effect was observed.
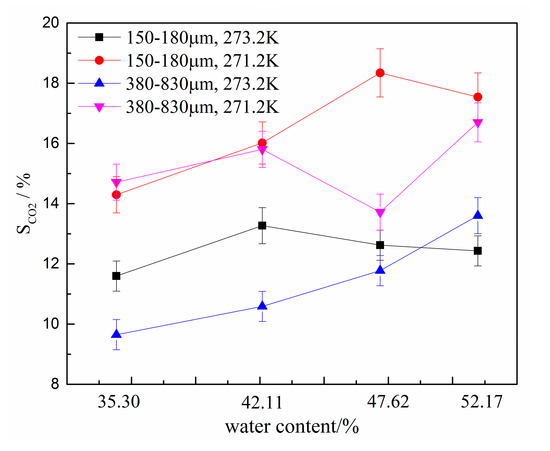
Figure 7.
CO2 separation ratios for different water contents.
The molecular sizes of CO2 and N2 are different, so CO2 form typical structure I (sI) hydrates, and N2 form typical structure II (sII) hydrates. The Raman shifts of pure CO2 hydrates occur at about 1276.6 and 1381.1 cm−1, whereas the Raman shift of N2 is about 2324.5 cm−1 [30]. For hydrates with multicomponent guest molecules, a different hydrate structure can form, and the Raman displacement will be correspondingly affected. Hydrates formed of binary gas mixture of CO2/N2 (CO2 gas molar ratio < 1%) can be structure II (sII) hydrate. However, the sI hydrate forms if the CO2 molar ratio is increased to 20% [22]. Meanwhile, the diameter of 5A zeolite is similar to that of the hydrate cage structure. Hydrate samples formed under different conditions were analyzed by Raman spectroscopy, in order to investigate whether the 5A zeolite affects the structure of the hydrates and the distribution of CO2 and N2 contained within. The Raman spectra of hydrate samples in type-A and B zeolite systems with different water contents at 271.2 K are shown in Figure 8.
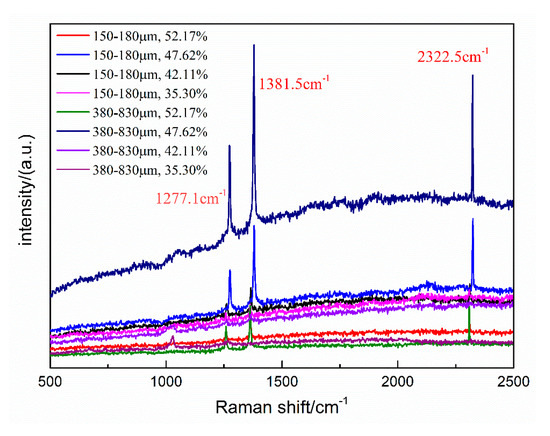
Figure 8.
Raman spectra of hydrates formed in zeolite systems with different water contents at 271.2 K.
The Raman spectra in Figure 8 contain two bands 1278 cm−1 and 1375 cm−1. These are the double peaks of the C-O Fermi resonance, indicating that CO2 preferentially occupied the large cages of the sI hydrate, and the CO2 molecules competed with N2 to fill the small cages of the sI hydrate. In addition, the band near 2321 cm−1 is the N-N vibration of N2. Therefore, the hydrates formed under all experimental conditions were sI type, and the zeolite neither participates in the hydrate formation reaction nor influences the hydrate structure.
Finally, to study the decomposition of the hydrate and the escape of CO2 and N2 from the hydrate cage structure, one hydrate sample formed in the type-B zeolite system with 42.11% water content at 271.2 K was examined by in situ Raman spectroscopy. The dissociation temperature was determined to be 200 K. As shown in Figure 9, as time progressed, the intensities of the CO2 and N2 bands decreased simultaneously, indicating that the two gases escape from the hydrate cage structure at the same time. Moreover, the decomposition of the hydrate was complete within 60 min.
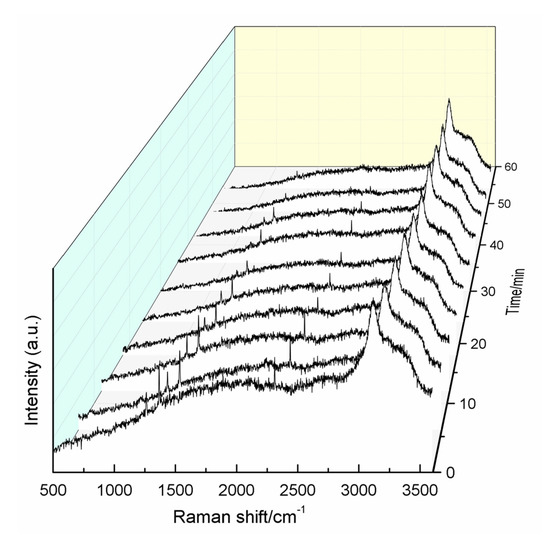
Figure 9.
In situ Raman spectra during hydrate decomposition.
4. Conclusions
Hydrate formation in 5A zeolites with different particle size distributions (380–830 and 150–180 μm) was investigated at 273.2 K and 271.2 K at 8.5 MPa. Four water contents were investigated in the experiments. It was found that, for the same zeolite particle distribution, the CO2 molar concentration in the remaining gas phase () was lower at 271.2 K than that at 273.2 K and lower temperature can improve the separation effect of CO2. On the basis of the results obtained under all experimental conditions, was lowest at 271.2 K in the type-B zeolite (150–180 μm) with water content of 47.62%. However, the gas consumption per mole of water () was maximum in the type-B zeolite (150–180 μm) with a water content of 35.3%. Therefore, the zeolite particle distribution, water content, and thermodynamic conditions affect gas separation in the HBGS method and should be evaluated comprehensively, and there are optimal HBGS experimental conditions. In addition, the 5A zeolite does not participate in the hydrate formation reaction and does not influence the structure of the hydrate. When the hydrate decomposed, CO2 and N2 molecules escape from the hydrate structure almost simultaneously.
The results in this work indicated that 5A zeolite + water system based on HBGS technology can act as a preferable absorbent for CO2 separation from binary CO2/N2 gas mixtures. Crucially, the operating conditions should be chosen properly to ensure the best CO2 separation effect and capability. For gases with different components, experimental conditions should be considered and investigated comprehensively to achieve the best separation, which is our goal for future work. Meanwhile, 5A zeolite is not suitable for hydrate based gas separation under atmospheric pressure. Further work need to do and find appropriate additives that can reduce the formation conditions of hydrate, promote the formation rate and enhance the gas absorption and separation capabilities.
Author Contributions
Conceptualization, D.L. and X.Z. (Xiaoya Zang); methodology, X.Z. (Xuebing Zhou); investigation, N.Z. and L.W.; writing-review and editing, X.Z. (Xiaoya Zang). All authors have read and agreed to the published version of the manuscript.
Funding
This research was funded by National key research and development plan of China (grant number: 2017YFC0307305), National Natural Science Foundation of China (grant numbers: 51676197), Guangzhou Science and Technology Project (grant number: 201804010411) and Youth Innovation Promotion Association CAS.
Conflicts of Interest
The authors declare no conflict of interest. The funders had no role in the design of the study; in the collection, analyses, or interpretation of data; in the writing of the manuscript, or in the decision to publish the results.
References
- Ahmed, M. Introduction to Modern Climate Change. Sci. Total. Environ. 2020, 734, 139397. [Google Scholar] [CrossRef]
- Bachmann, T.M. Considering environmental costs of greenhouse gas emissions for setting a CO2 tax: A review. Sci. Total. Environ. 2020, 720, 137524. [Google Scholar] [CrossRef] [PubMed]
- Zhao, S.; Pudasainee, D.; Duan, Y.; Gupta, R.; Liu, M.; Lu, J. A review on mercury in coal combustion process: Content and occurrence forms in coal, transformation, sampling methods, emission and control technologies. Prog. Energy Combust. Sci. 2019, 73, 26–64. [Google Scholar] [CrossRef]
- Gholami, F.; Tomas, M.; Gholami, Z.; Vakili, M. Technologies for the nitrogen oxides reduction from flue gas: A review. Sci. Total. Environ. 2020, 714, 136712. [Google Scholar] [CrossRef] [PubMed]
- Patron, G.D.; Ricardez-Sandoval, L. A robust nonlinear model predictive controller for a post-combustion CO2 capture absorber unit. Fuel 2020, 265, 116932. [Google Scholar] [CrossRef]
- Anantharaman, R.; Peters, T.; Xing, W.; Fontaine, M.-L.; Bredesen, R. Dual phase high-temperature membranes for CO2 separation—Performance assessment in post- and pre-combustion processes. Faraday Discuss. 2016, 192, 251–269. [Google Scholar] [CrossRef]
- Songolzadeh, M.; Soleimani, M.; Ravanchi, M.T.; Songolzadeh, R. Carbon Dioxide Separation from Flue Gases: A Technological Review Emphasizing Reduction in Greenhouse Gas Emissions. Sci. World J. 2014, 2014, 1–34. [Google Scholar] [CrossRef]
- Sumida, K.; Rogow, D.L.; Mason, J.A.; McDonald, T.M.; Bloch, E.D.; Herm, Z.R.; Bae, T.-H.; Long, J.R. Carbon Dioxide Capture in Metal–Organic Frameworks. Chem. Rev. 2012, 112, 724–781. [Google Scholar] [CrossRef]
- Yuan, B.; Wu, X.; Chen, Y.; Huang, J.; Luo, H.; Deng, S. Adsorption of CO2, CH4, and N2 on Ordered Mesoporous Carbon: Approach for Greenhouse Gases Capture and Biogas Upgrading. Environ. Sci. Technol. 2013, 47, 5474–5480. [Google Scholar] [CrossRef]
- Ding, S.; Liu, Y. Adsorption of CO2 from flue gas by novel seaweed-based KOH-activated porous biochars. Fuel 2020, 260, 116382. [Google Scholar] [CrossRef]
- Younas, M.; Rezakazemi, M.; Daud, M.; Wazir, M.B.; Ahmad, S.; Ullah, N.; Inamuddin; Ramakrishna, S. Recent progress and remaining challenges in post-combustion CO2 capture using metal-organic frameworks (MOFs). Prog. Energy Combust. Sci. 2020, 80, 100849. [Google Scholar] [CrossRef]
- Mukherjee, A.; Okolie, J.A.; Abdelrasoul, A.; Niu, C.H.; Dalai, A.K. Review of post-combustion carbon dioxide capture technologies using activated carbon. J. Environ. Sci. 2019, 83, 46–63. [Google Scholar] [CrossRef] [PubMed]
- Saha, D.; Bao, Z.; Jia, F.; Deng, S. Adsorption of CO2, CH4, N2O, and N2 on MOF-5, MOF-177, and Zeolite 5A. Environ. Sci. Technol. 2010, 44, 1820–1826. [Google Scholar] [CrossRef] [PubMed]
- Pour, A.A.; Sharifnia, S.; NeishaboriSalehi, R.; Ghodrati, M. Performance evaluation of clinoptilolite and 13X zeolites in CO2 separation from CO2/CH4 mixture. J. Nat. Gas Sci. Eng. 2015, 26, 1246–1253. [Google Scholar] [CrossRef]
- Liu, J.; Ding, J.X.; Liang, D.Q. Experimental study on hydrate-based gas separation of mixed CH4/CO2 using unstable ice in a silica gel bed. Energy 2018, 157, 54–64. [Google Scholar] [CrossRef]
- Mofarahi, M.; Gholipour, F. Gas adsorption separation of CO2/CH4 system using zeolite 5A. Microporous Mesoporous Mater. 2014, 200, 1–10. [Google Scholar] [CrossRef]
- Mendes, P.A.P.; Ribeiro, A.M.; Gleichmann, K.; Ferreira, A.F.P.; Rodrigues, A.E. Separation of CO2/N2 on binderless 5A zeolite. J. CO2 Util. 2017, 20, 224–233. [Google Scholar] [CrossRef]
- Bakhtyari, A.; Mofarahi, M. Pure and Binary Adsorption Equilibria of Methane and Nitrogen on Zeolite 5A. J. Chem. Eng. Data 2014, 59, 626–639. [Google Scholar] [CrossRef]
- Li, S.; Fan, S.; Wang, J.; Lang, X.; Wang, Y. Clathrate Hydrate Capture of CO2 from Simulated Flue Gas with Cyclopentane/Water Emulsion. Chin. J. Chem. Eng. 2010, 18, 202–206. [Google Scholar] [CrossRef]
- Li, L.; Fan, S.; Chen, Q.; Yang, G.; Zhao, J.; Wei, N.; Wen, Y. Simulation of post-combustion CO2 capture process by non-equilibrium stage hydrate-based gas separation technology. Int. J. Greenh. Gas Control. 2018, 79, 25–33. [Google Scholar] [CrossRef]
- Kim, S.; Choi, S.-D.; Seo, Y. CO2 capture from flue gas using clathrate formation in the presence of thermodynamic promoters. Energy 2017, 118, 950–956. [Google Scholar] [CrossRef]
- Sloan, E.D.; Koh, C. Clathrate Hydrates of Natural Gases; CRC Press: Boca Raton, FL, USA, 2007. [Google Scholar]
- Wang, X.; Zhang, F.; Lipiński, W. Research progress and challenges in hydrate-based carbon dioxide capture applications. Appl. Energy 2020, 269, 114928. [Google Scholar] [CrossRef]
- Pandey, J.S.; Daas, Y.J.; Von Solms, N. Screening of Amino Acids and Surfactant as Hydrate Promoter for CO2 Capture from Flue Gas. Processes 2020, 8, 124. [Google Scholar] [CrossRef]
- Abu Hassan, M.H.; Sher, F.; Zarren, G.; Suleiman, N.; Tahir, A.A.; Snape, C.E. Kinetic and thermodynamic evaluation of effective combined promoters for CO2 hydrate formation. J. Nat. Gas Sci. Eng. 2020, 78, 103313. [Google Scholar] [CrossRef]
- Nasir, Q.; Suleman, H.; Elsheikh, Y.A. A review on the role and impact of various additives as promoters/inhibitors for gas hydrate formation. J. Nat. Gas Sci. Eng. 2020, 76, 103211. [Google Scholar] [CrossRef]
- Khurana, M.; Yin, Z.; Linga, P. A Review of Clathrate Hydrate Nucleation. ACS Sustain. Chem. Eng. 2017, 5, 11176–11203. [Google Scholar] [CrossRef]
- Zhou, X.; Long, Z.; Liang, S.; He, Y.; Yi, L.; Li, D.-L.; Liang, D. In SituRaman Analysis on the Dissociation Behavior of Mixed CH4–CO2Hydrates. Energy Fuels 2016, 30, 1279–1286. [Google Scholar] [CrossRef]
- Zhong, D.-L.; Li, Z.; Lu, Y.-Y.; Wang, J.-L.; Yan, J.; Qing, S.-L. Investigation of CO2 Capture from a CO2 + CH4 Gas Mixture by Gas Hydrate Formation in the Fixed Bed of a Molecular Sieve. Ind. Eng. Chem. Res. 2016, 55, 7973–7980. [Google Scholar] [CrossRef]
- Chazallon, B.; Pirim, C. Selectivity and CO2 capture efficiency in CO2-N2 clathrate hydrates investigated by in-situ Raman spectroscopy. Chem. Eng. J. 2018, 342, 171–183. [Google Scholar] [CrossRef]


© 2020 by the authors. Licensee MDPI, Basel, Switzerland. This article is an open access article distributed under the terms and conditions of the Creative Commons Attribution (CC BY) license (http://creativecommons.org/licenses/by/4.0/).