1. Introduction
Due to the interest in renewable energy, photovoltaic (PV) power plants have been penetrating power systems. However, a considerable number of photovoltaic power plants have problems such as low power generation, unrecognized fault states and difficulty in analyzing decreased output power. Therefore, most maintenance engineers want to develop economic, efficient and reliable methodologies and tools to monitor and quickly identify the fault state, produce more energy and minimize maintenance planning. The Performance Ratio (PR) index (IEC61724-1 standard) is a health index for photovoltaic power plants that analyzes the solar power plant fault state and decreased output power and evaluates the solar power plant’s performance and aging [
1,
2,
3,
4,
5,
6]. If a fault occurs in a PV power plant, the operator recognizes the anomaly in output power by calculating the PR index, which will show a lower value than that in the normal state. An Operation and Maintenance (O&M) engineer can identify the fault state of a PV power plant and undertake maintenance work for normal generation.
However, a solar power plant operator does not recognize the fault state because the annual PR index does not have a constant value. Operators have a fault recognition problem in PV plants because of the output power’s variable characteristics resulting from changes in ambient temperature. In order to improve the problem of PV plant temperature variability, the National Renewable Energy Laboratory (NREL) proposes the use of the Weather-Corrected Performance Ratio (WCPR) index as the temperature-corrected performance index for PV power plants [
7]. WCPR is a temperature-corrected health index for PV power plants that compensates for temperature fluctuations through output power correction based on the average temperature of the solar cell.
Furthermore, PV power plants have large fluctuations due to environmental resource variability. When the irradiation value is small, such as on a rainy or snowy day, plant monitoring, supervisory control and data acquisition systems have a low recognition rate of the fault state in a PV power plant. Some of the recent research on PV fault detection algorithms is based on the irradiance-power linear regression method. This method improves the low recognition rate problem for small irradiation values [
8,
9]. Additionally, a temperature correction output formula can compensate for the fluctuation value of the output power and will improve variability problems when calculating the output power value.
Some of the PV fault detection methods reported in the literature use electrical circuit simulations of the PV system [
10,
11,
12]. These simulations detect the signal and location of the PV panel and the system fault by using signal analysis methods, such as Time Domain Reflectometry (TDM) and ECM (earth capacitance measurements) [
13,
14]. The research in [
15] proposes a detecting algorithm for a particular fault by utilizing the Voltage Ratio and Power Ratio indices. This method calculates the high and low limit values of the PR and VR indices and classifies the fault of Grid-Connected Photovoltaic (GCPV) systems. Different methods for detecting a PV power plant fault analyze the power loss of PV systems. These methods detect an anomaly in the PV power plant by calculating the efficiency of the overall performance of the plant [
16,
17]. The author of [
18] classifies several types of faults (normal operation, string fault, partial shading) by comparing between the simulated and measured values of the threshold levels. Other methods to detect the low output power performance of the plant use predictive methods that are based on the output power [
19,
20].
To classify the fault state of PV power plants, recent research has focused on artificial intelligence (AI) techniques. Some researchers have used neural networks, fuzzy logic and expert systems [
21,
22,
23]. These researchers classified the output power patterns by extracting the characteristics of each condition. The author of [
24] presents the four major artificial intelligence (AI) techniques: Artificial Neural Networks (ANN), Fuzzy Logic (FL), Genetic Algorithms (GA), and Hybrid Systems (HS). AI-based modeling and techniques, as alternatives to conventional physical modeling, are explained. Other methods are used to detect outlier data from the original data set to define the normal operation level [
8,
24]. These methods classify the abnormal data of the PV power plant by calculating the outlier levels of a given data set.
Recent research on the anomaly and fault detection of PV power plants has proposed Outlier Mining Techniques to detect the decreased output power value [
25,
26]. An anomaly detection algorithm is reported in the literature that applies the auto threshold level to classify the decreased output power of PV plants. Additionally, a smoothing technique for the PV power plant output power variable is proposed to recognize the long-term power loss due to faults [
25]. This technique does not preserve the raw data because it uses a transforming (or smoothing) technique on the original data. The author of [
27] proposed the BNN (Bayesian Neural Network) AI method to detect the anomaly pattern (soiling effect). This AI method classifies the soiling effect by learning the dirty and clean modules of generation data sets on sunny and cloudy days. This paper presents a One-Class Support Vector Machine (OCSVM) to classify the anomaly and fault state of a PV power plant. The fault state and decreased output power are classified using the maximum margin hyperplane method of the Support Vector Machine (SVM) technique, and raw data are transformed into the feature space by using the kernel technique. The recognition rate of the fault state is improved by utilizing the kernel technique of a variable index that separates the fault state from the fluctuations in data of normal generation.
4. Case Study
A case study was performed to classify the decreased output power and fault state of a PV power plant by utilizing weather data in South Korea. The PV cell temperature can be calculated by setting the NOCT (Normal Operating Cell Temperature) to 45 degrees. Two power plants located in the mountainous areas of northeast South Korea (latitude 37°45′ N, longitude 128°76′ E) were compared to secure the reliability of the simulation results data. Plant A (altitude: 100 m) generates power through 5136 TS-M390-NA2 modules connected to 318 strings and 16 combiner boxes. Site B (altitude: 500 m) generates power through 5894 TS-M390-NA2 modules connected to 369 strings and 19 combiner boxes.
Table 1 shows the parameters of both power plants’ solar modules, and
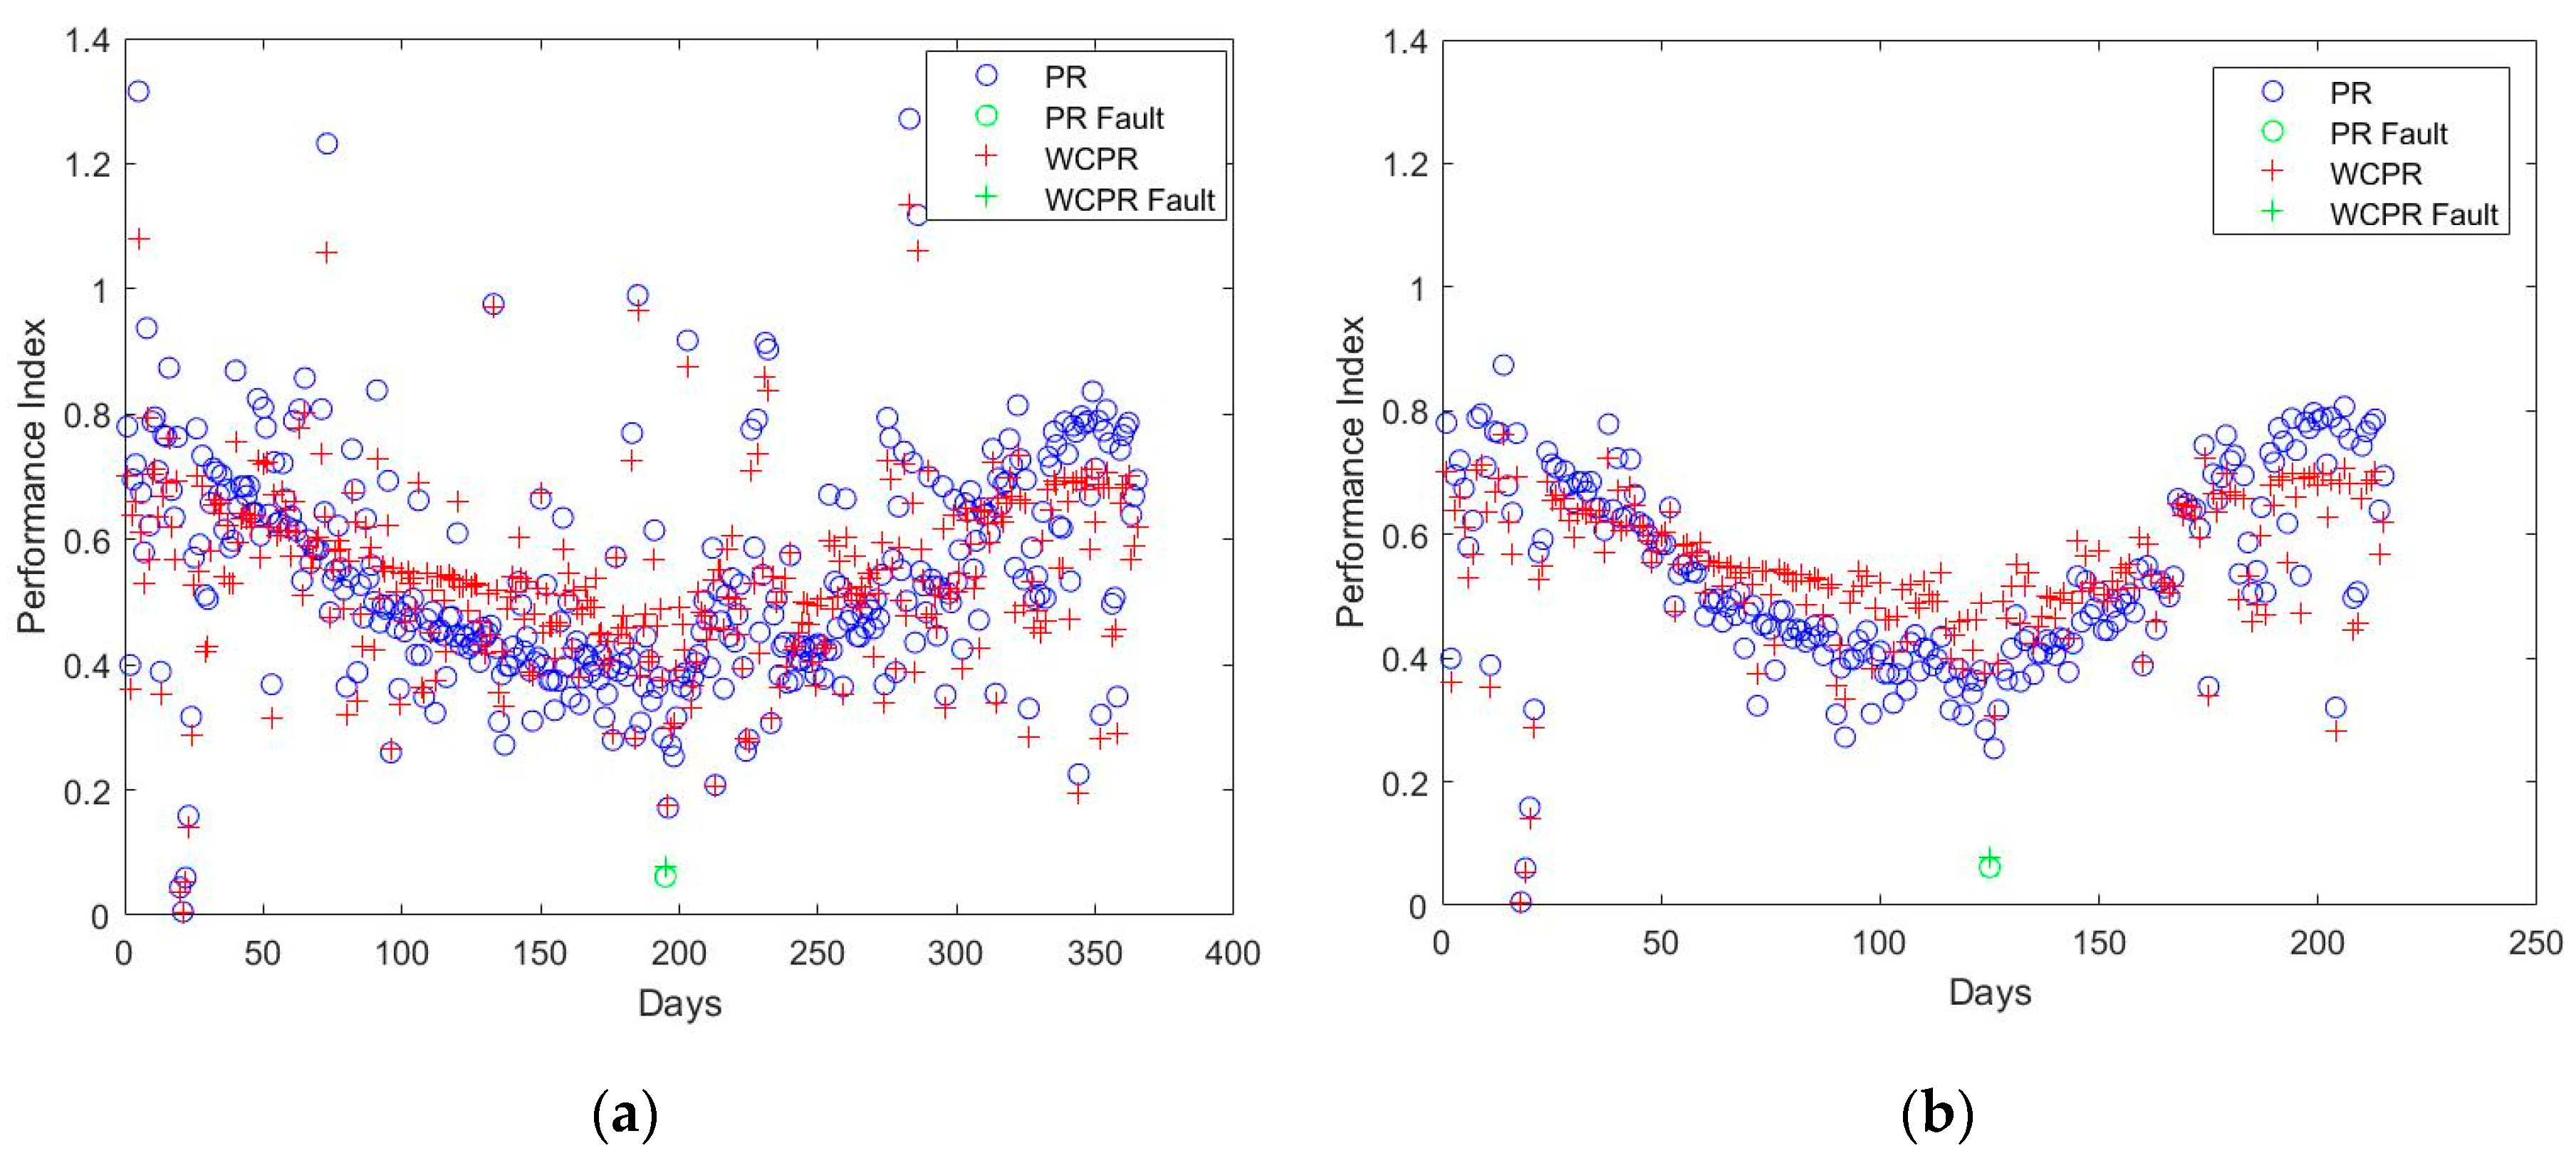
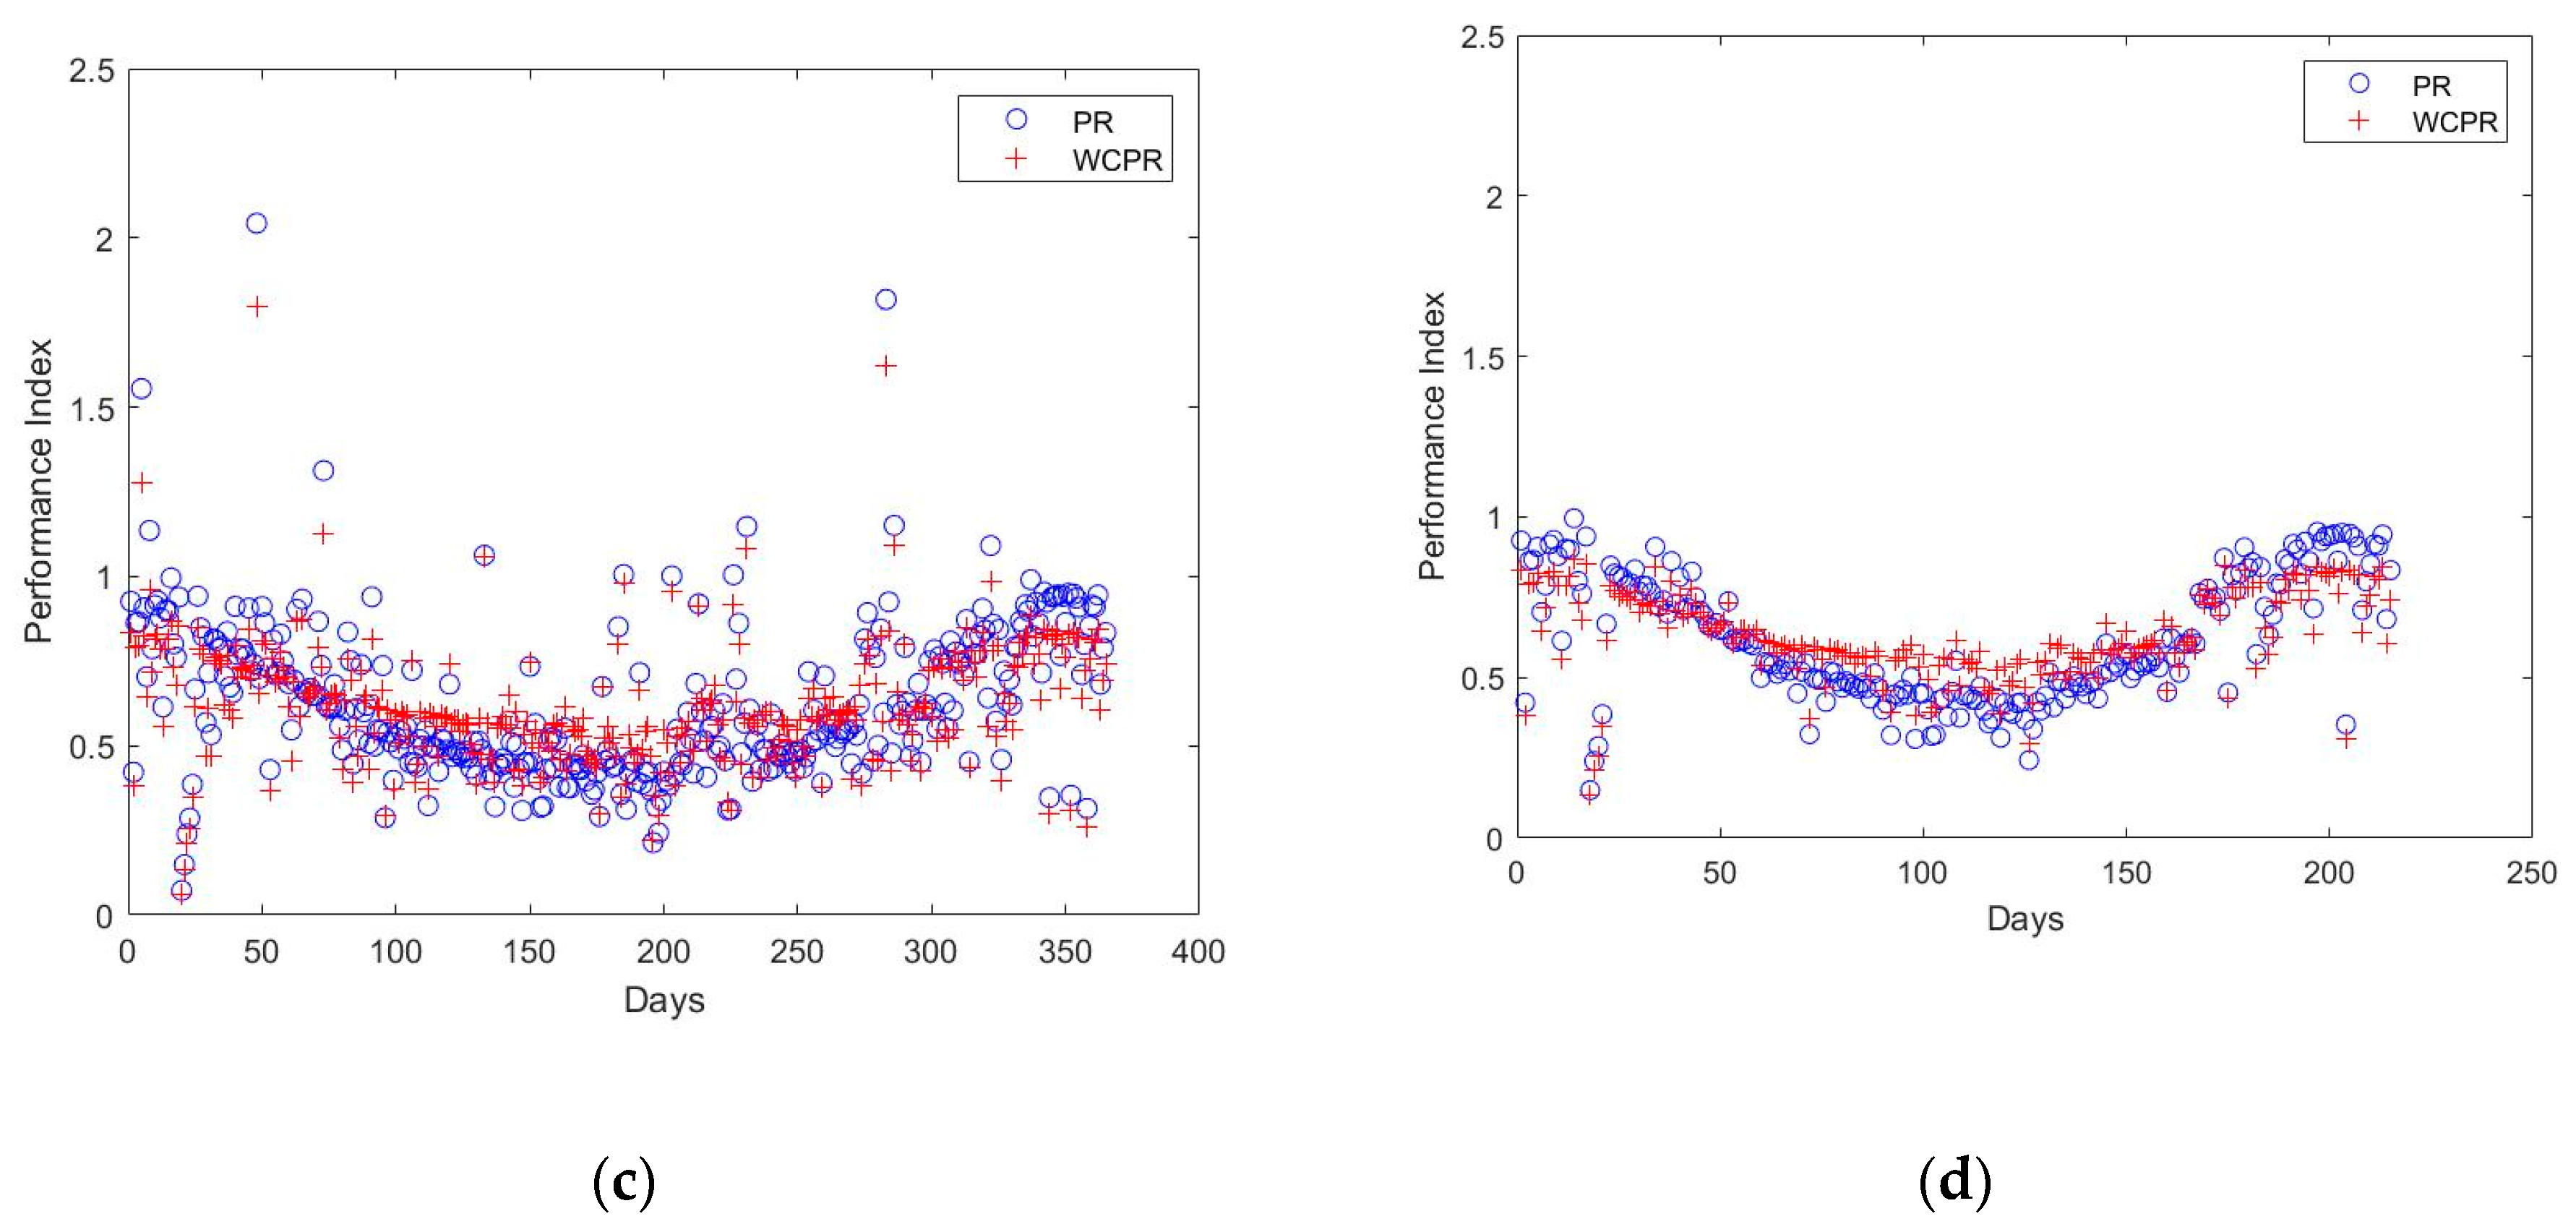
Figure 1 shows the daily PR and WCPR data of Power Plants A and B for one year.
The PR index has a lot of deviations due to the fluctuation of temperature. Output power variability is compensated for by applying the WCPR, that is, the temperature-corrected health index of a PV power plant.
Table 2 shows the value of the health indices of each plant and its conditions. WCPR has a smaller standard deviation, and a comparison of the efficiency values shows that Plant B is the better PV plant.
Figure 1b,d show the annual PR and WCPR data of both plants when the clearness index is above 0.5, and
Table 2 and
Table 3 show the mean and standard deviation of PR and WCPR in the conditions when the clearness index is above 0.5.
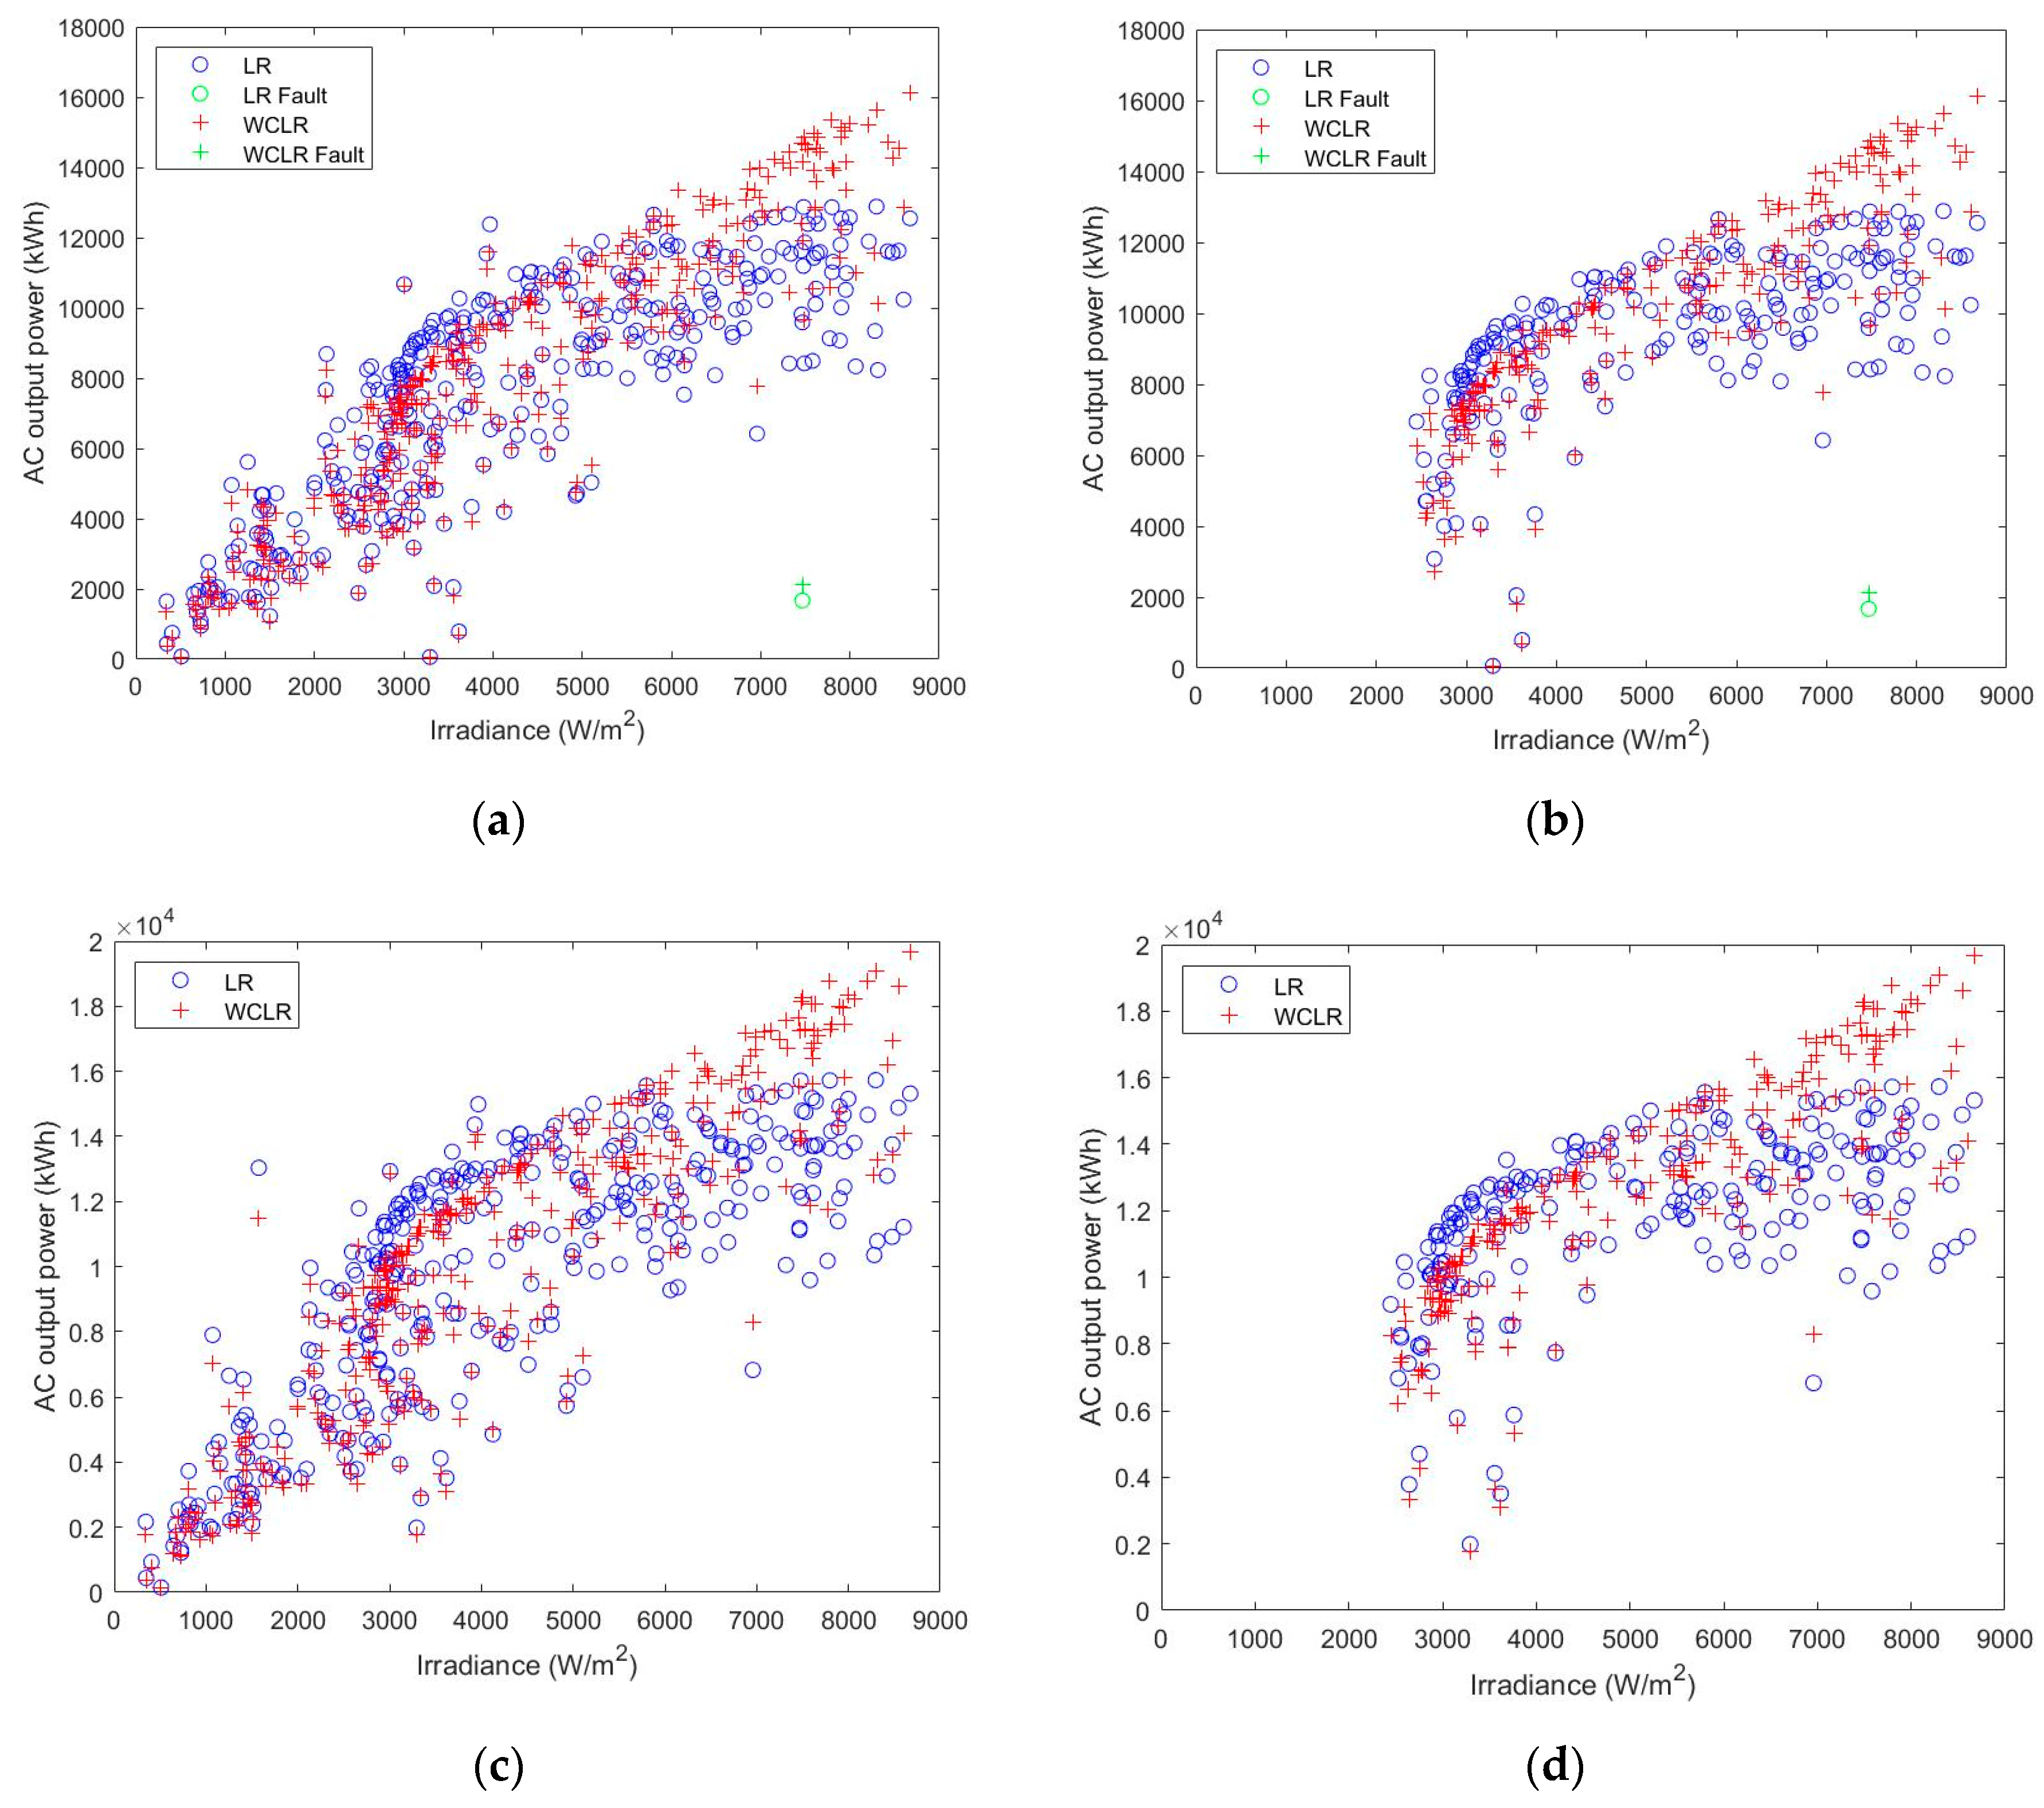
An improved method for PV power plant diagnoses is linear regression analysis. The data in
Figure 2 show less fluctuation than the results of PR and WCPR (
Figure 1) due to the representation of all irradiation values.
Table 4 and
Table 5 show the correlation coefficient value of each method, the conditions and the plants. The WCLR compensates for the fluctuation of temperature and shows a higher correlation coefficient value compared to the results of LR (without temperature correction).
Figure 3 and
Table 6 show the results of each method.
Figure 3b shows how the normal generation data are grouped in contrast to
Figure 3a (without the proposed variable index of the linear kernel function). By mapping the reduction in output power due to the variability in the feature space through the kernel function of the PVI index, the unchanged characteristics of the fault state and the variability characteristics of the normal power generation of PV power plants can be better identified. When the EEM technique is applied with the kernel function,
Figure 3c and
Table 6 show a higher classification margin and identification rate.
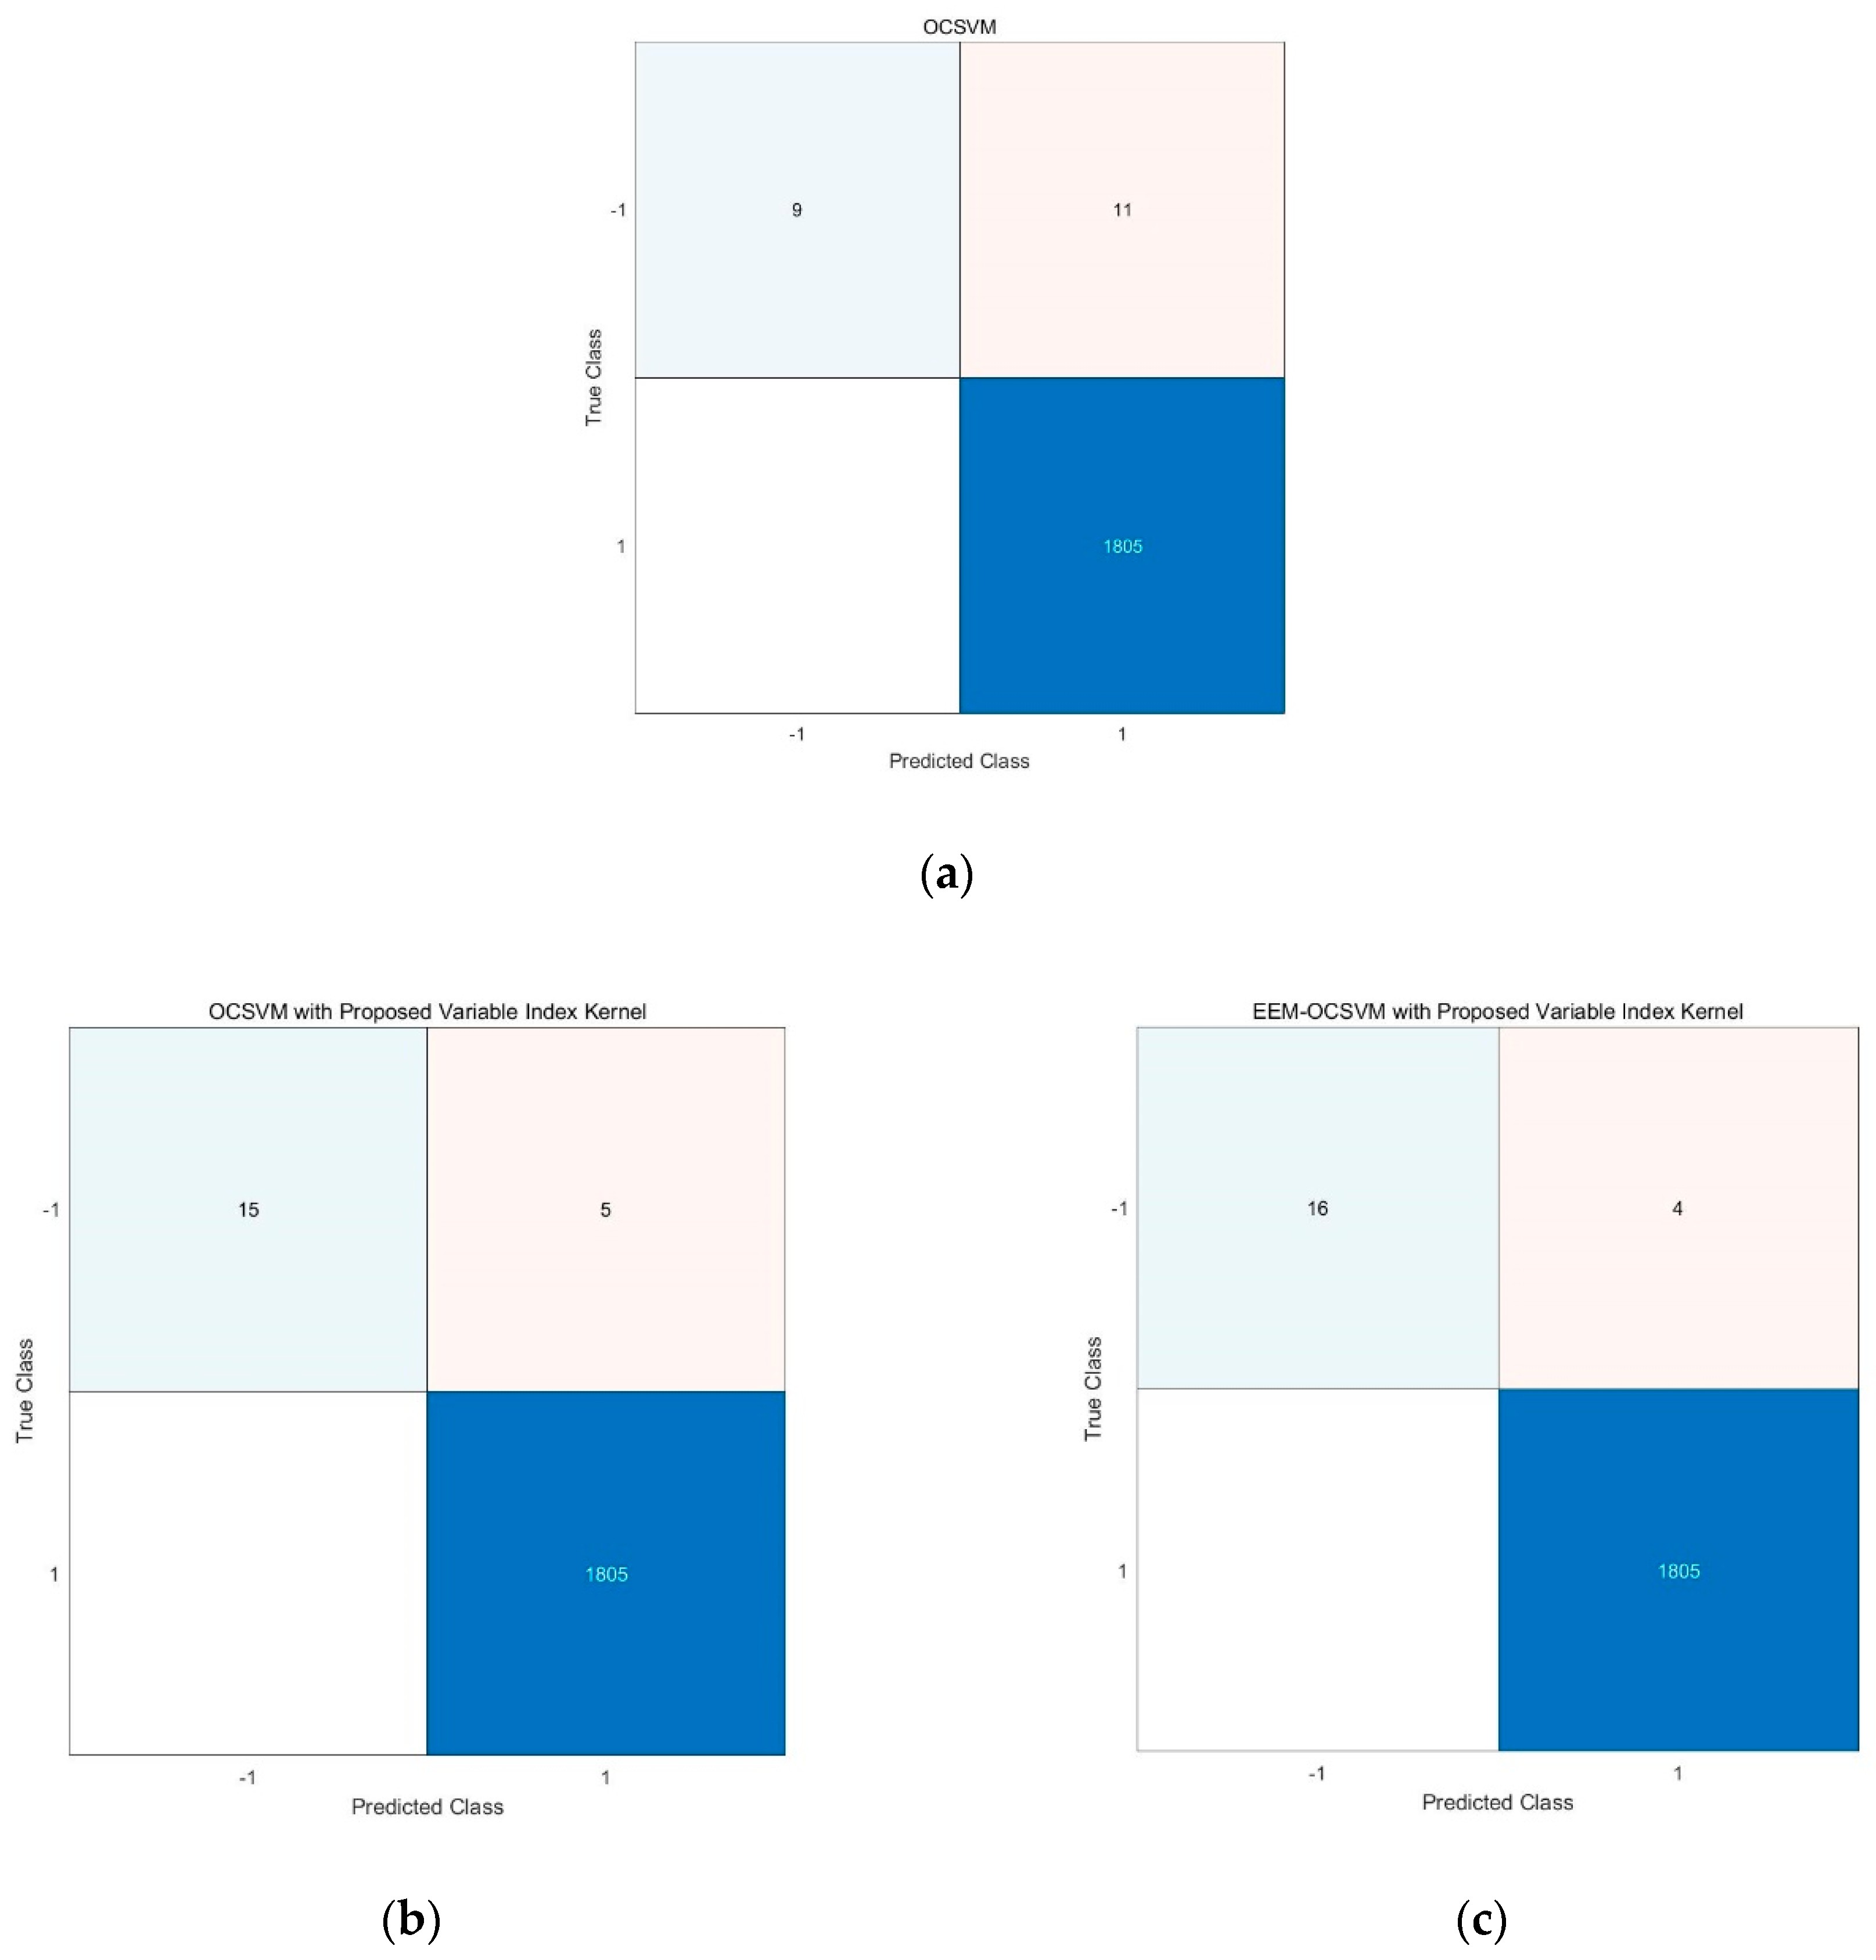
Figure 4 shows the confusion matrix of each method and also checks the classification accuracy ((a) OCSVM, (b) OCSVM with the proposed variable index of the linear kernel function, (c) EEM-OCSVM with the proposed variable index of the linear kernel function). In this matrix, 1 is the normal state and −1 is the fault state of the photovoltaic plant; the true and predicted class accuracy values are also checked.
5. Conclusions
This paper presents a method to recognize and classify abnormal output power and the fault state of a solar power plant through an artificial intelligence method. The fluctuation of the PR index due to the ambient temperature of a solar power plant was improved by applying the CI index, as well as by checking the standard deviation value of each of the conditions and plants. Through the application of linear regression, the generation data obtained on a low-irradiation day were improved due to the representation of all values. As a result of applying the temperature correction equation and WCPR index, the output power was stabilized to compensate for the temperature loss of the PV module, and this was numerically demonstrated through the value of the mean, the standard deviation and the correlation coefficient. By evaluating the level of the variability output pattern of the solar power plant and mapping the input variable into the feature space through the kernel function, it was possible to more accurately classify anomalies in output power and the fault state. The recognition rate of the fault state and anomalies in output power was improved, and the classification rate of the fault state was checked by calculating and applying linear algebra such as the EEM and the kernel technique of the proposed variable index. Improved recognition rates of 0.3% and 0.4% were obtained by applying the proposed variable index kernel technique and the proposed EEM variable index kernel technique. This paper proposes a method for identifying major faults in large solar power plants, while the current detection of minor faults, such as cell cracks and leakages, should be managed through on-site diagnosis. Additionally, the classification accuracy can be further improved through maintenance techniques such as thermal imaging and I-V checker inspections.


