Exploratory Research to Improve Energy-Efficiency of a Ground-Coupled Heat Pump Utilizing an Automatic Control Device of Circulation Pump Speed


Abstract
:1. Introduction
2. Testing Laboratory Description
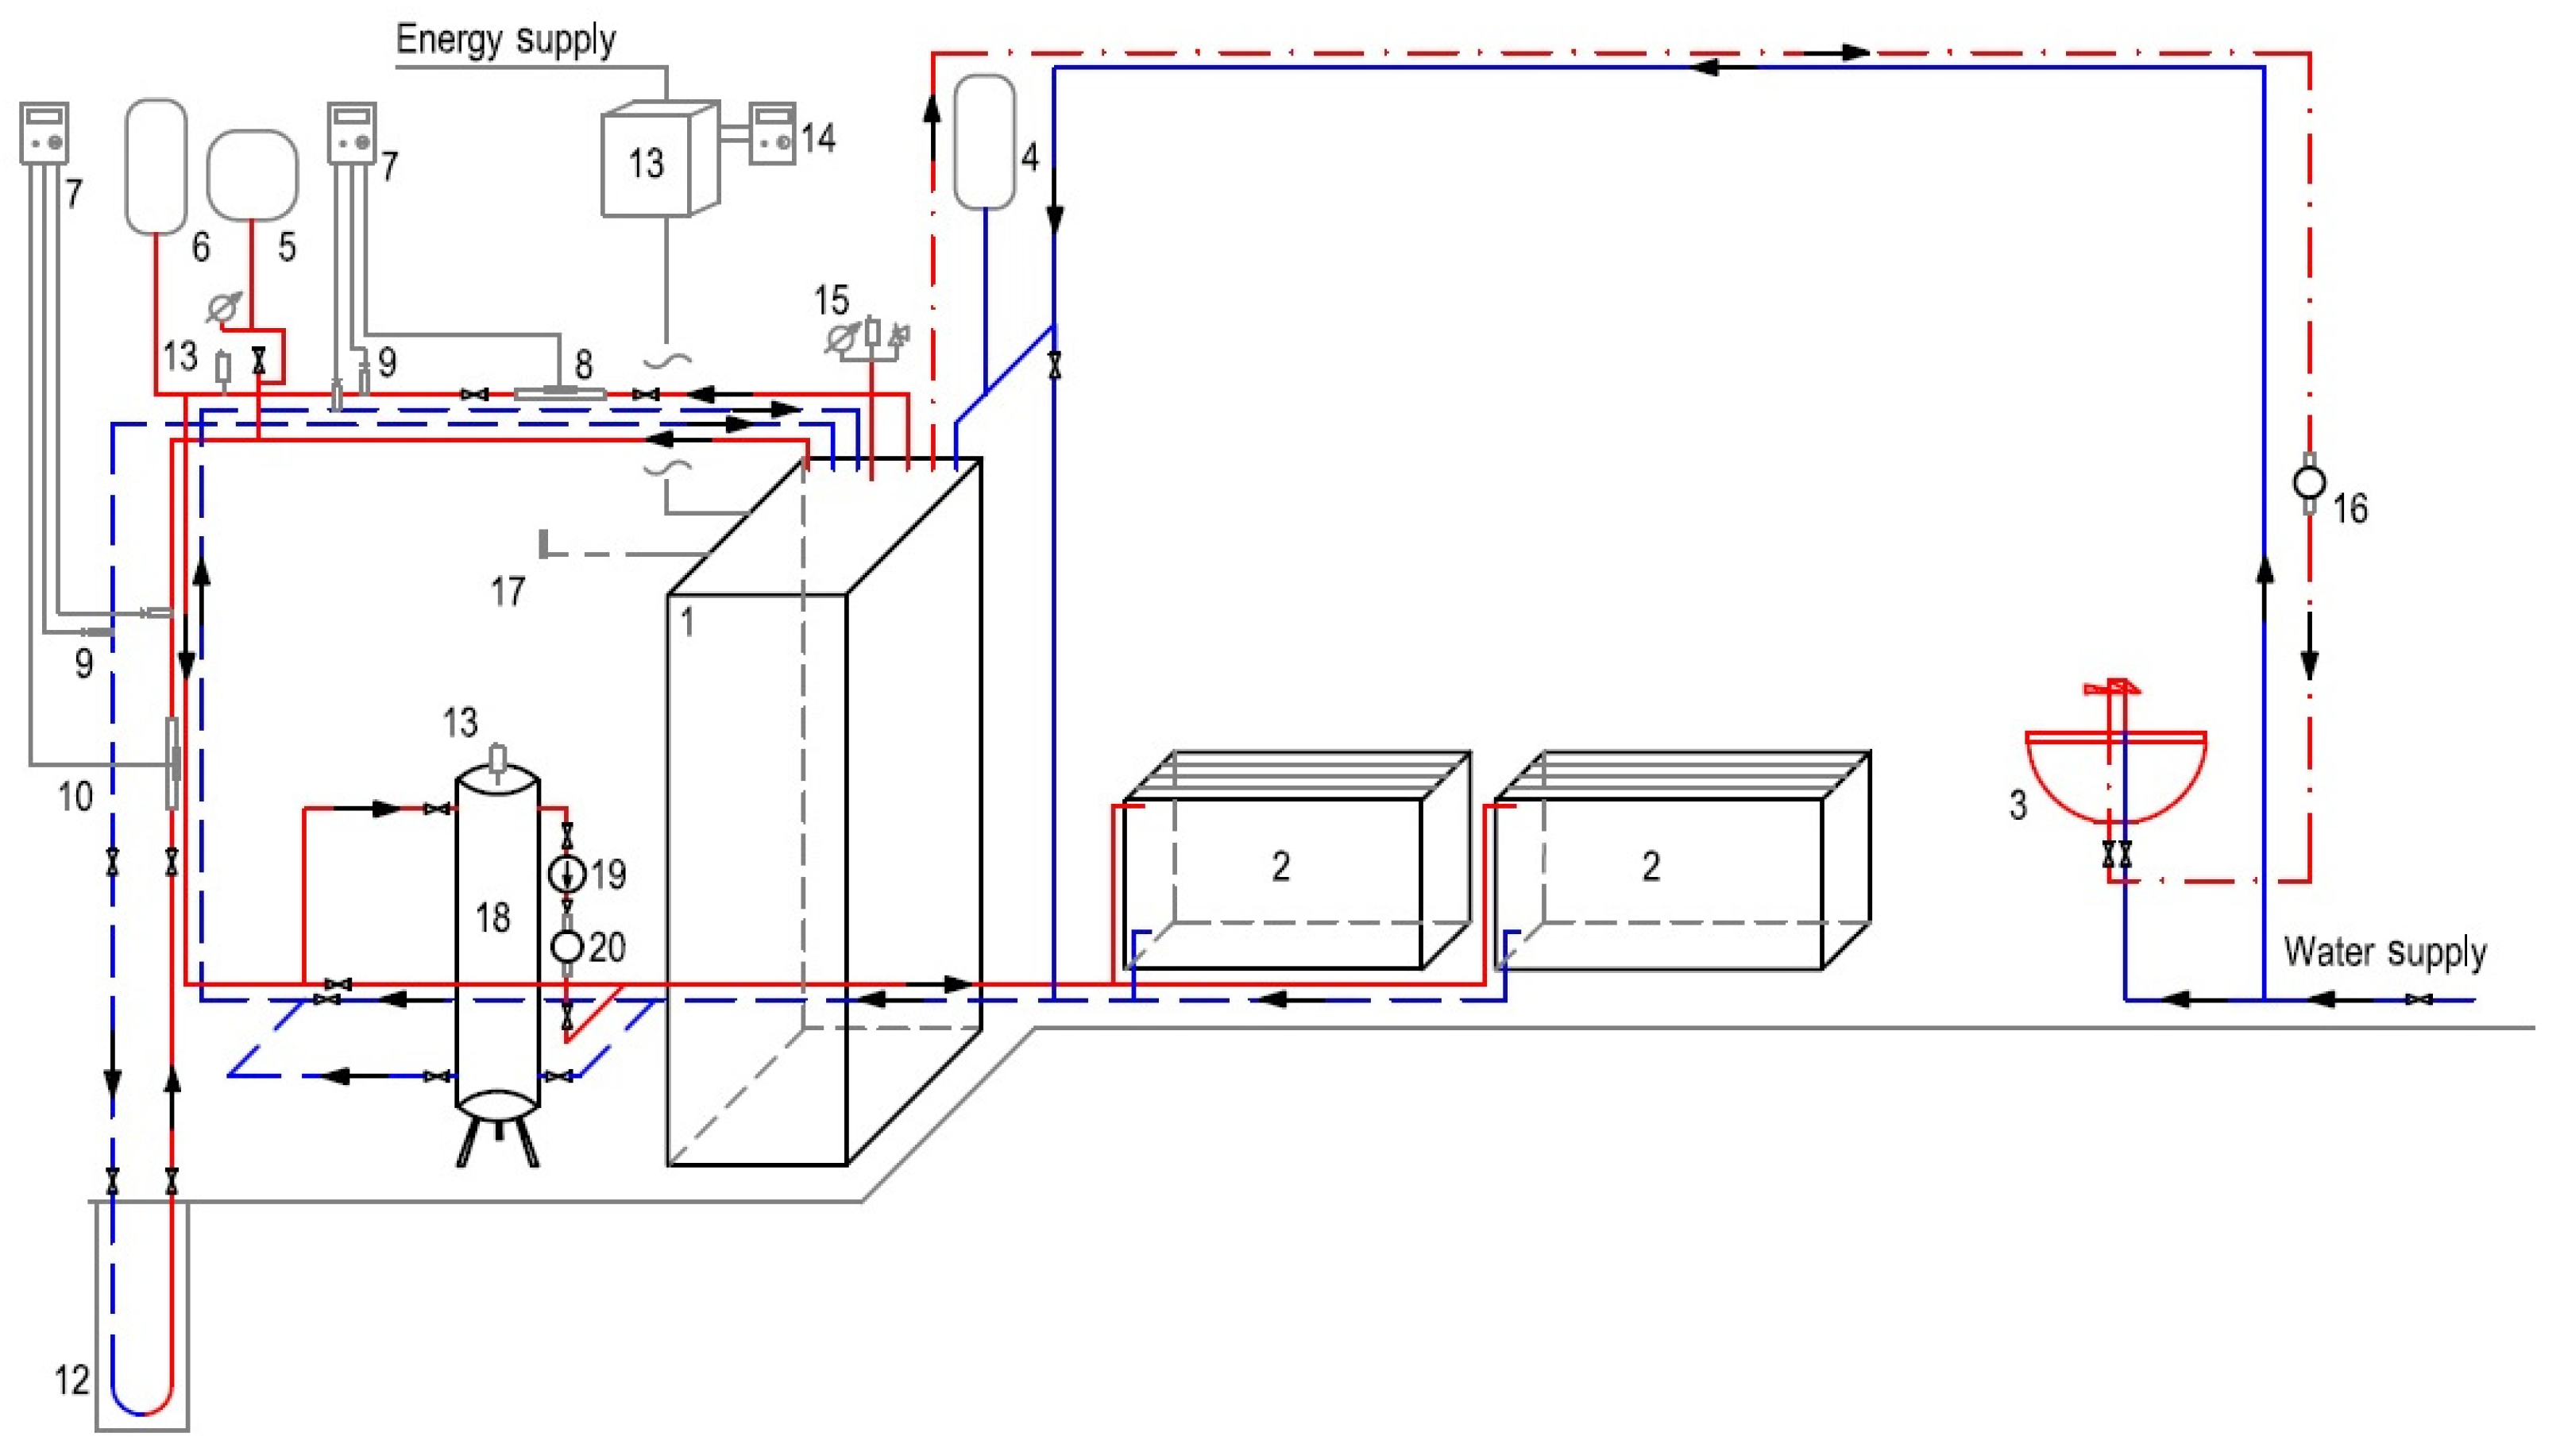
3. Description of Experimental Set-Up
- By a distribution pump connected within the HP unit of the GCHP (standard case);
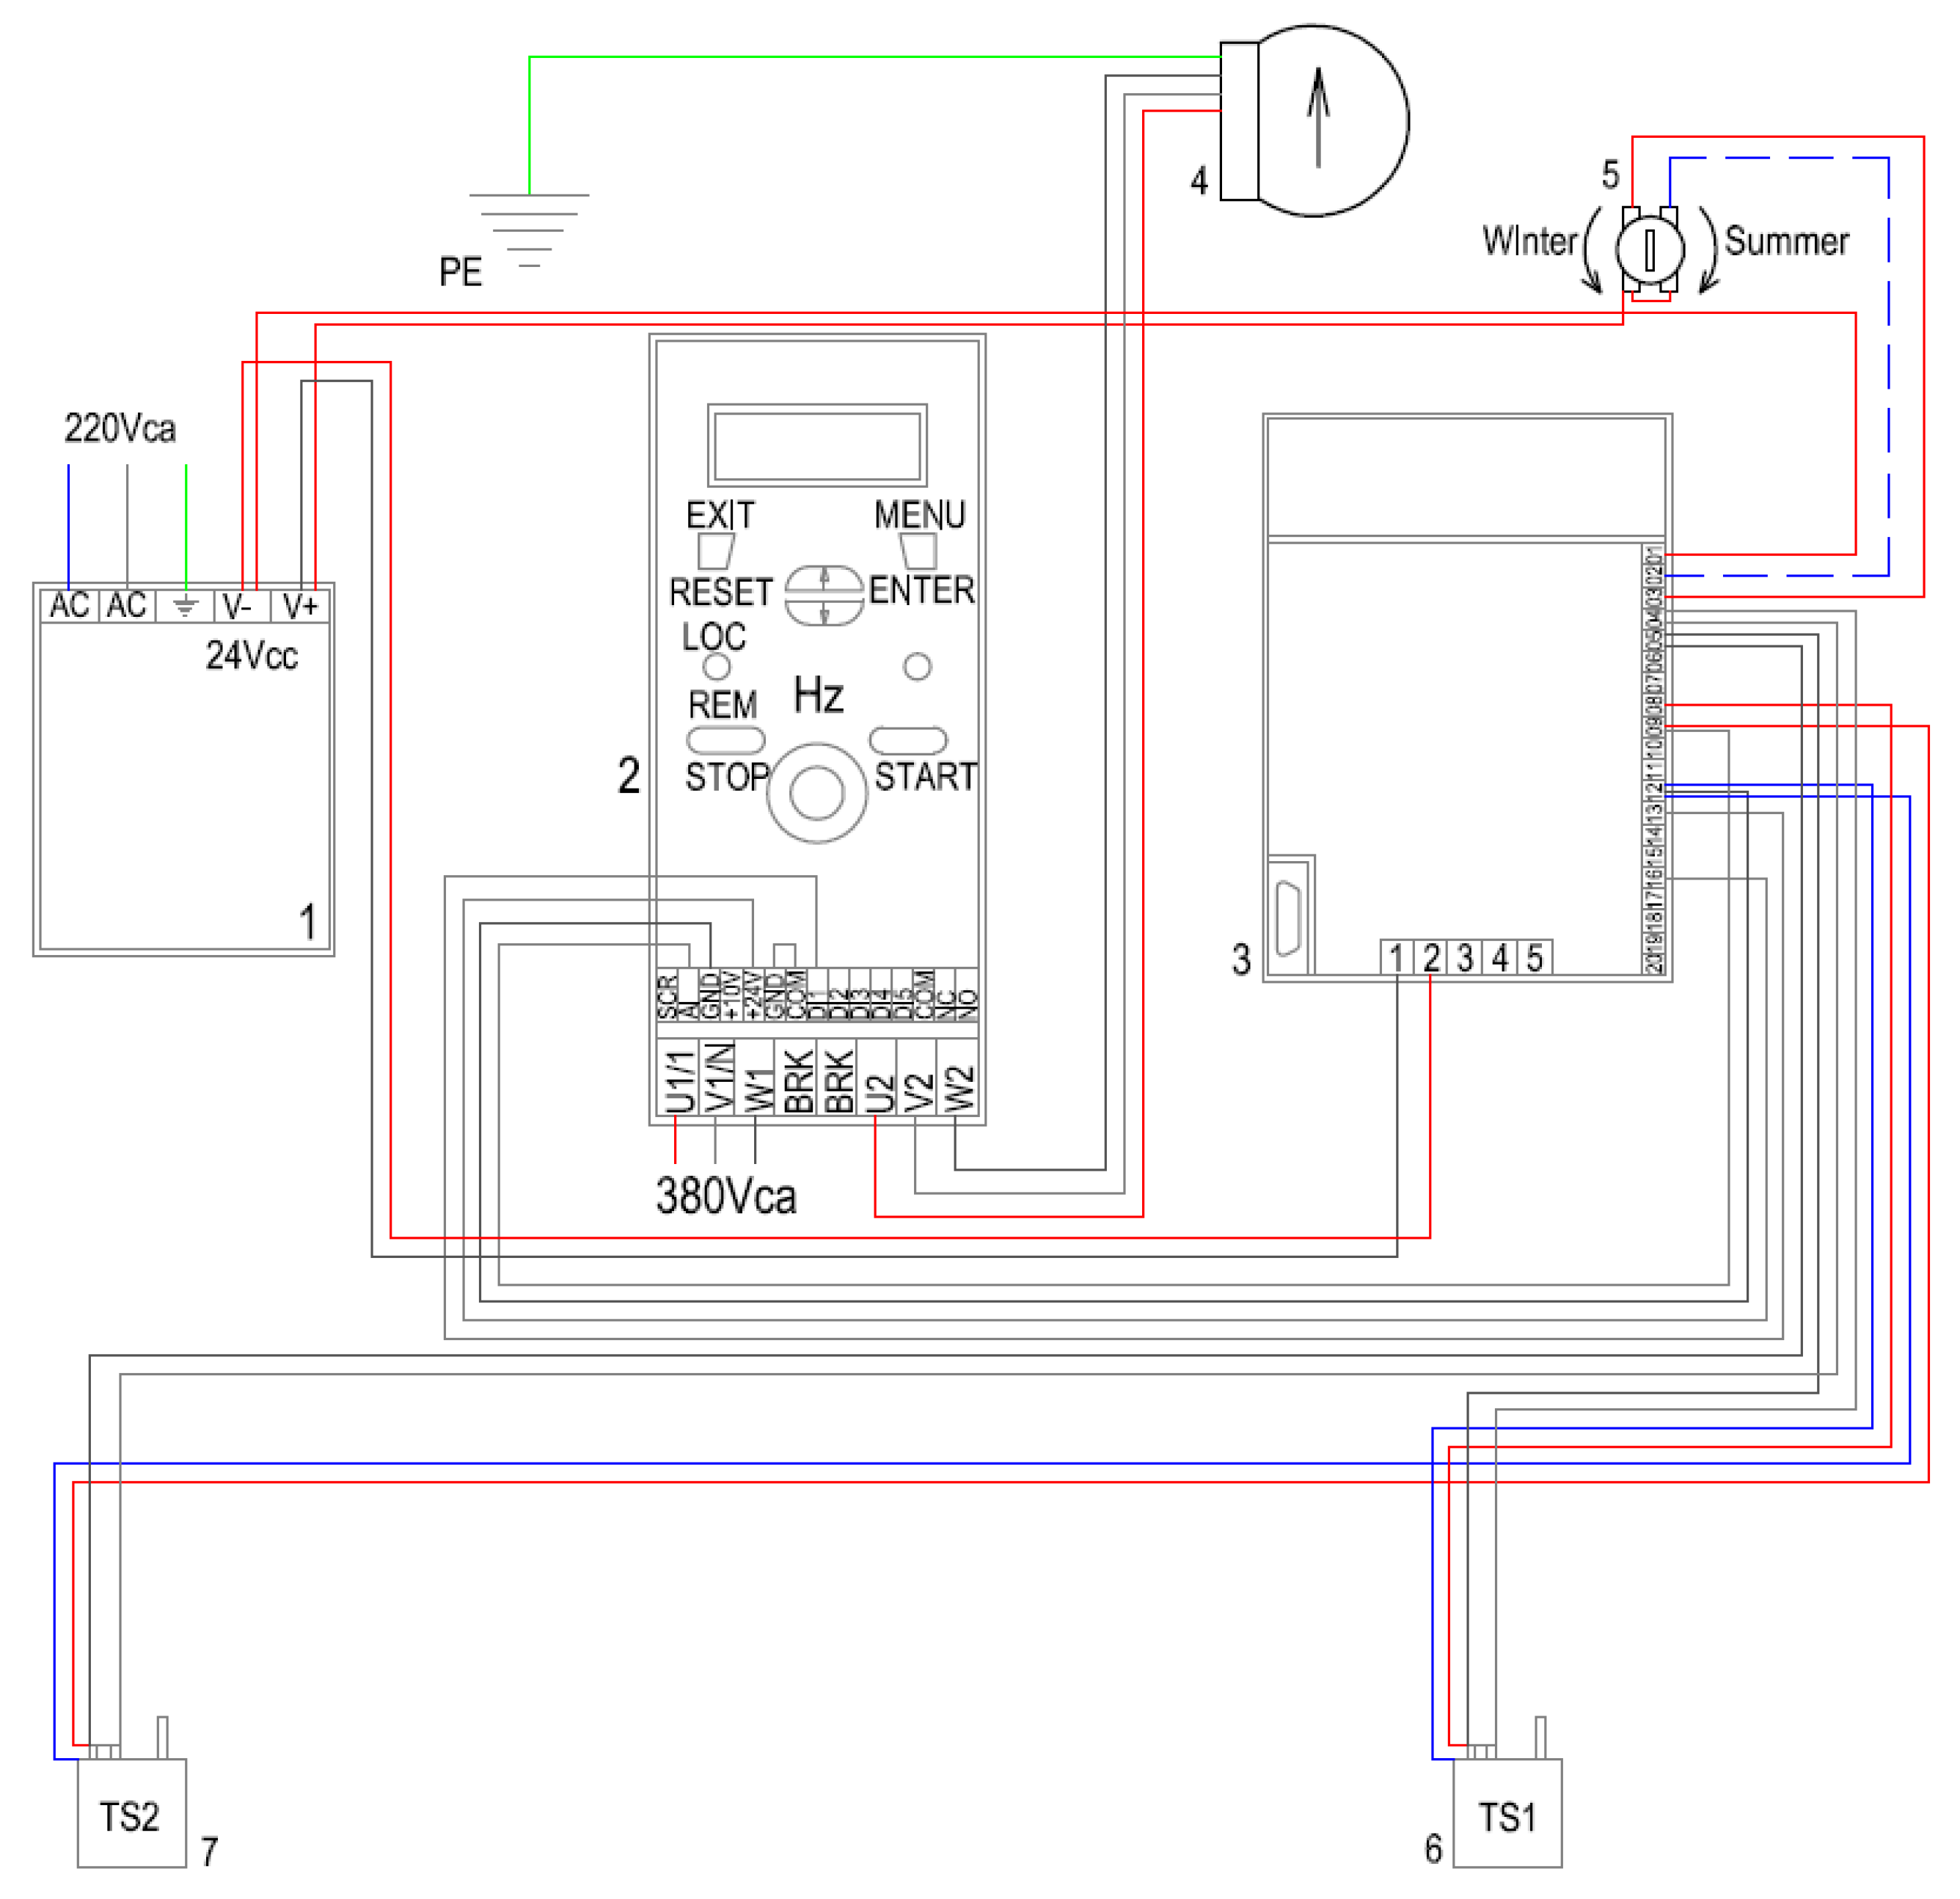
- By a constant-speed flow pump connected with a BT. The GCHP computerization can adjust the circulation pump connected to the BT by ON/OFF exchanging. This equipment improves the functioning of whole framework. The BT permits diminishing the GCHP ON/OFF exchanging due to its thermal inertia, and in this way, the energy performance increments. The solution for heat carrier fluid discharge regulation was advanced, utilizing a programmed control equipment of water pump speed [43]. The principal elements of the programmed equipment for pump speed adjustment are presented in Figure 4 [44].
- For heating, a range of outdoor air temperature was considered between −20 °C and 22 °C, taking into account that the indoor air temperature is constant (ti = 22 °C), and the outdoor air temperature varies depending on the day–night and seasonal alternation;
- For cooling, the range of the outdoor air temperature was considered to be between 26 °C and 42 °C, taking into account that the indoor air temperature is steady (ti = 26 °C), and the outdoor air temperature fluctuates, relying upon the day–night and seasonal alternation.
- For heating:
- For cooling:
3.1. Borehole Heat Exchanger
3.2. Heat Pump Unit Equipment
- For heating operating mode:in which Et is the useful heat and Eel is the electricity consumption of HP.
- For cooling operating mode:in which the energy efficiency ratio EERhp, in Btu/(Wh), describes the cooling performance, and the value 3.412 is the transformation factor from Watt to Btu/h (British Thermal Units per hour).
3.3. Water Circulation Pumps
3.4. Fan Coil Units
3.5. Information Acquisition System
3.6. Measurement Instrumentations
4. Methodology
5. Experiment Results and Discussion
5.1. GCHP Efficiency in Various Operating Modes
5.1.1. Heating Operation
5.1.2. Cooling Operation
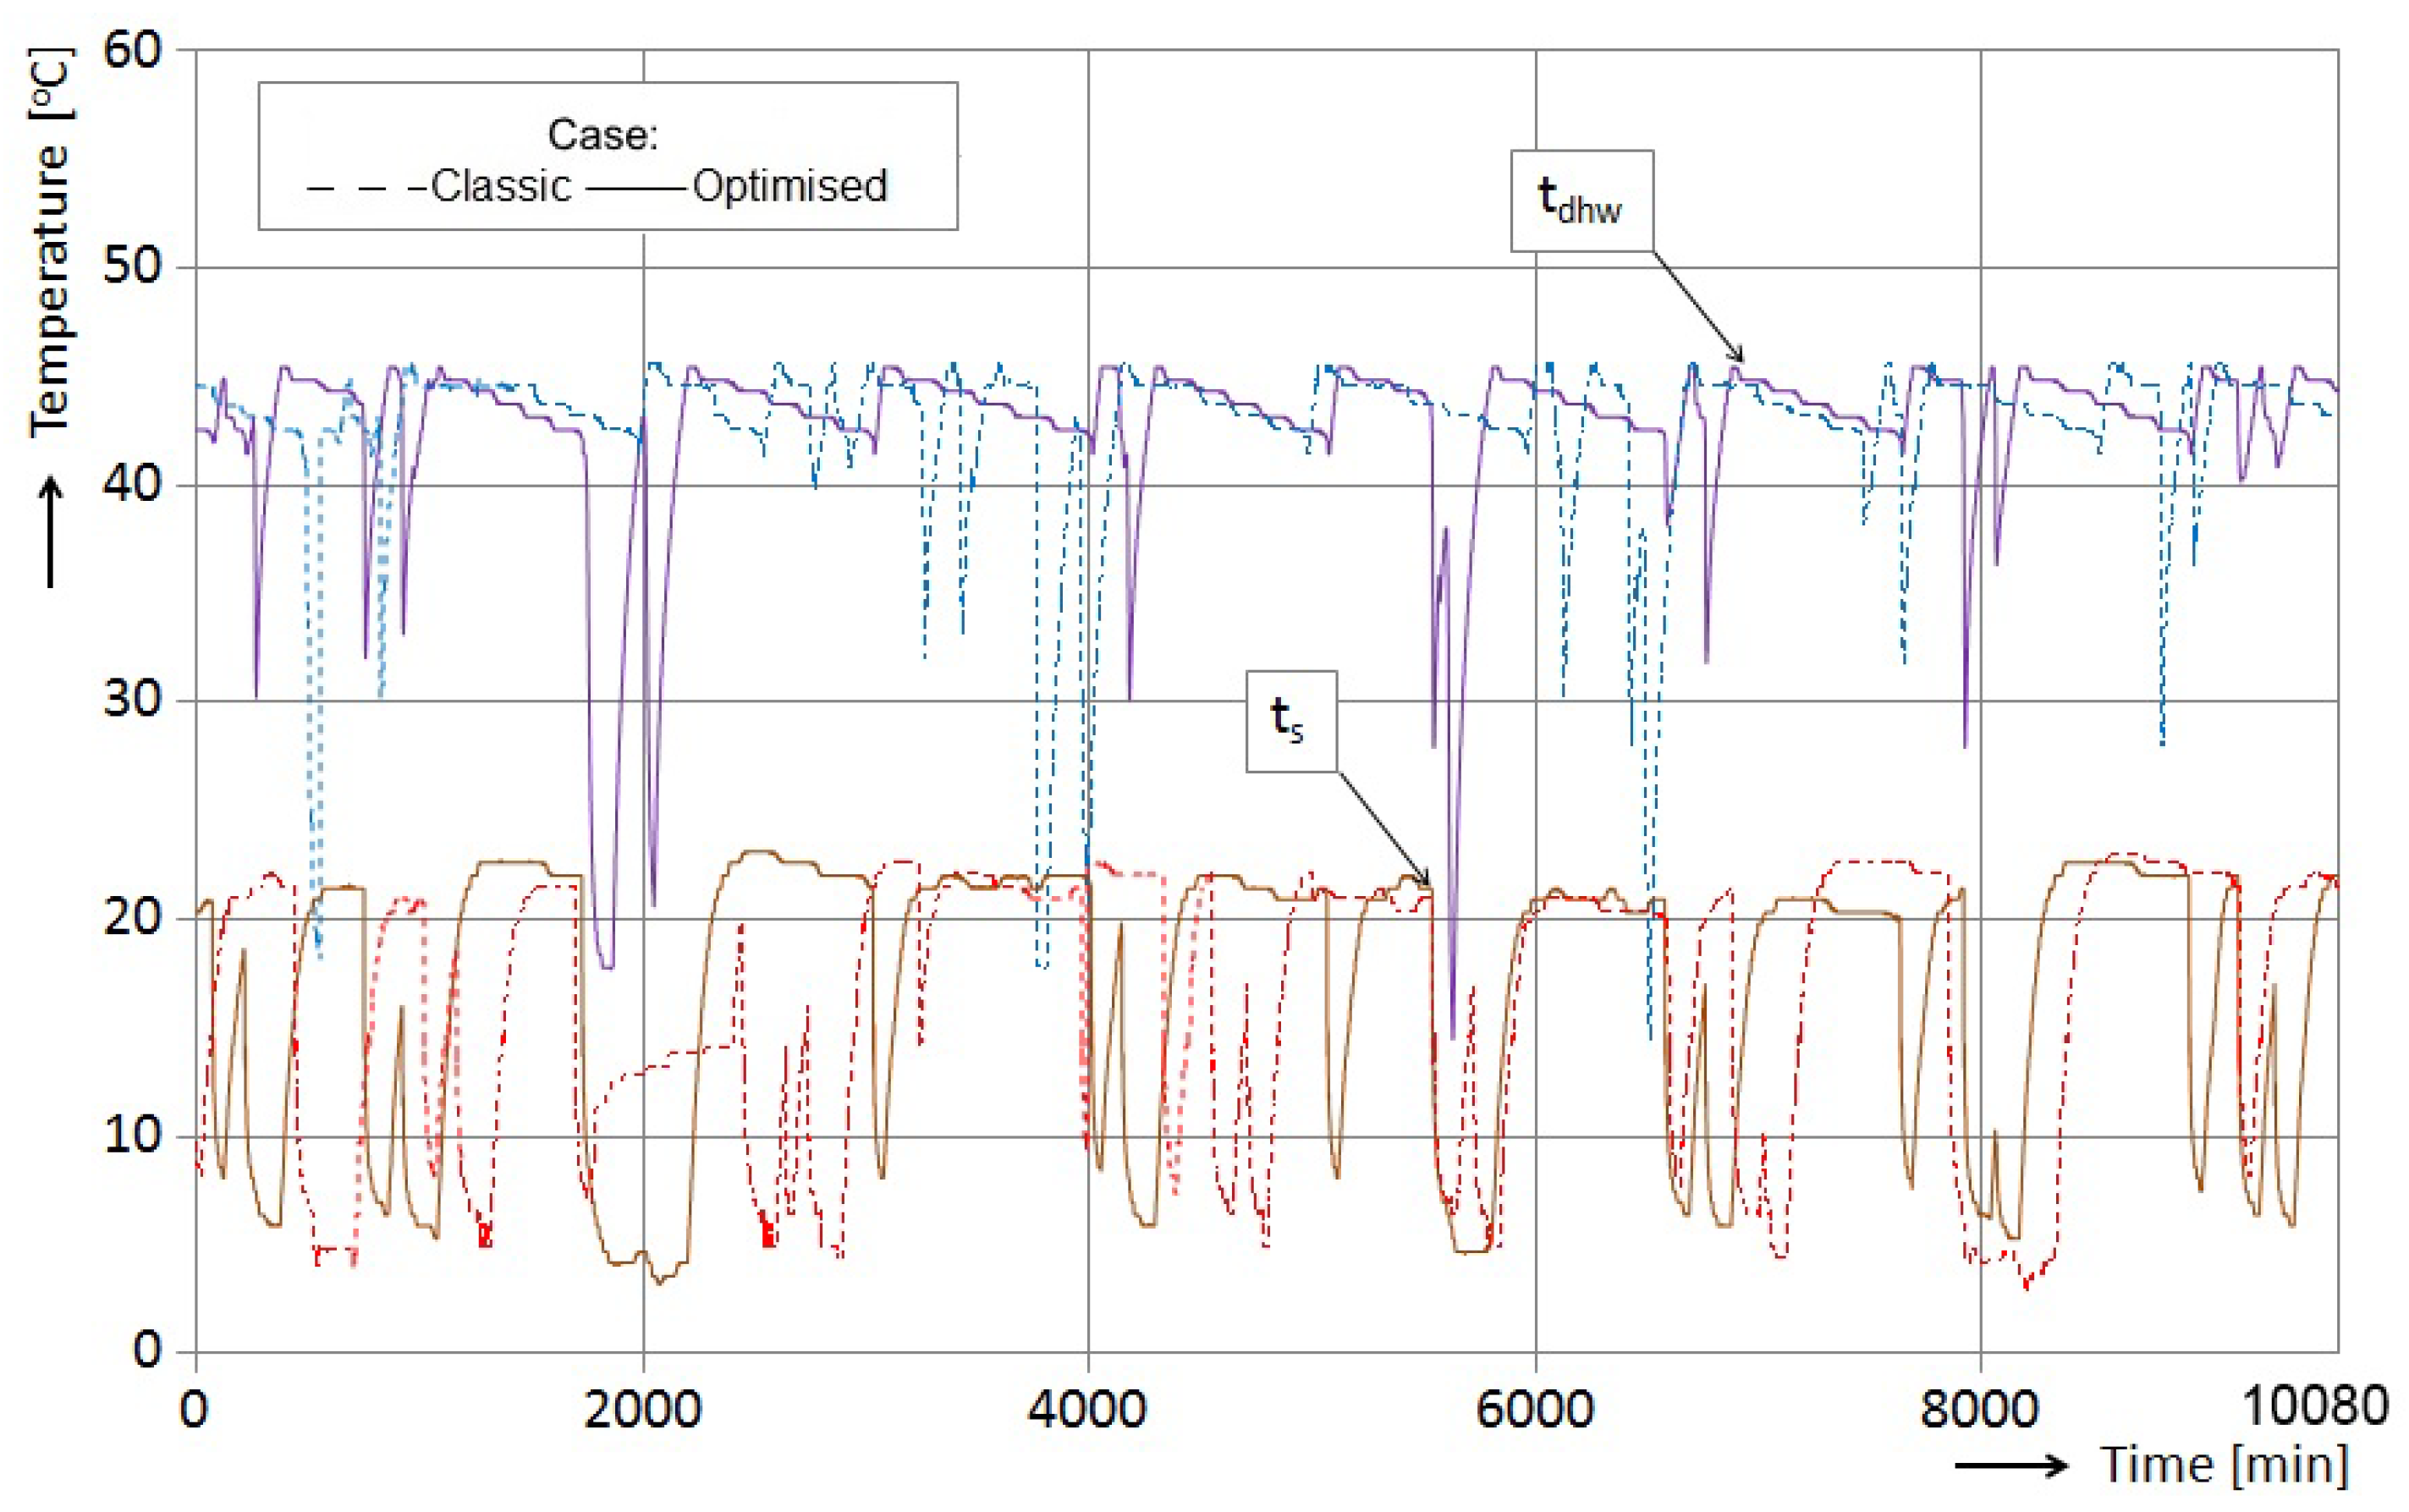
5.1.3. Heating and DHW Provision
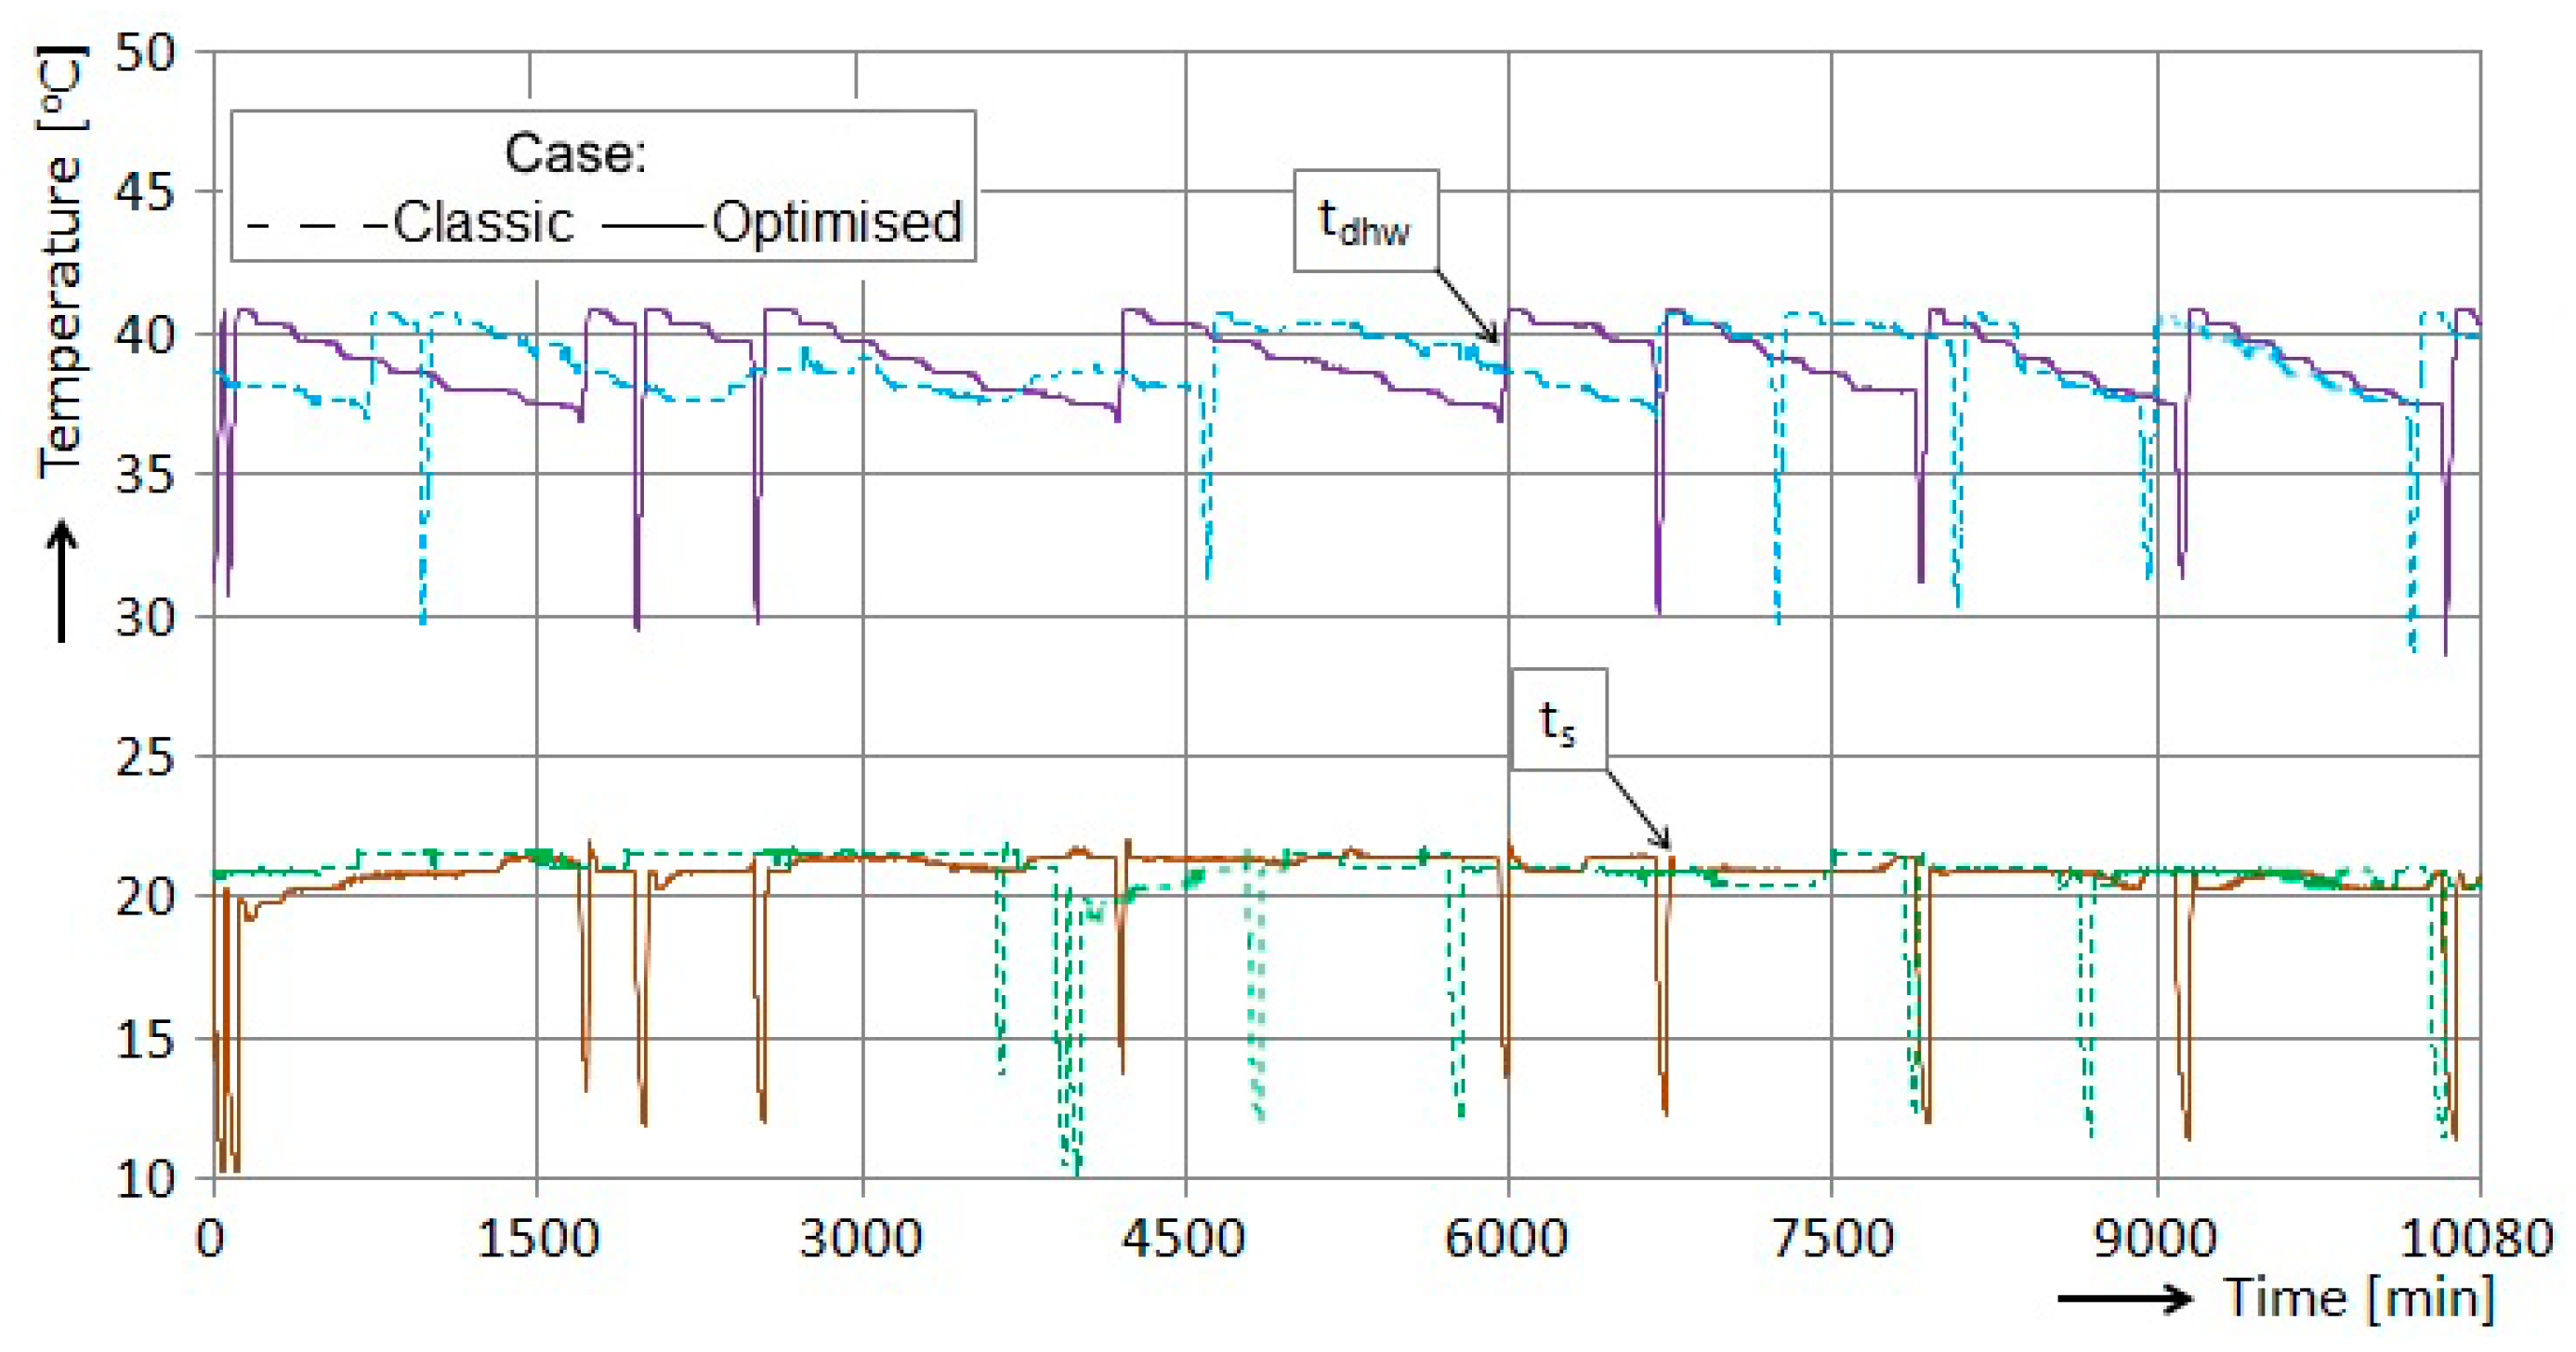
5.1.4. Cooling and DHW Provision
5.2. Uncertainty Analysis
6. Numerical Simulation of Useful Thermal Energy Using TRNSYS Software
6.1. Definition of the Operational Plan
6.2. Comparison of Simulated Results with Exploratory Information
7. Conclusions
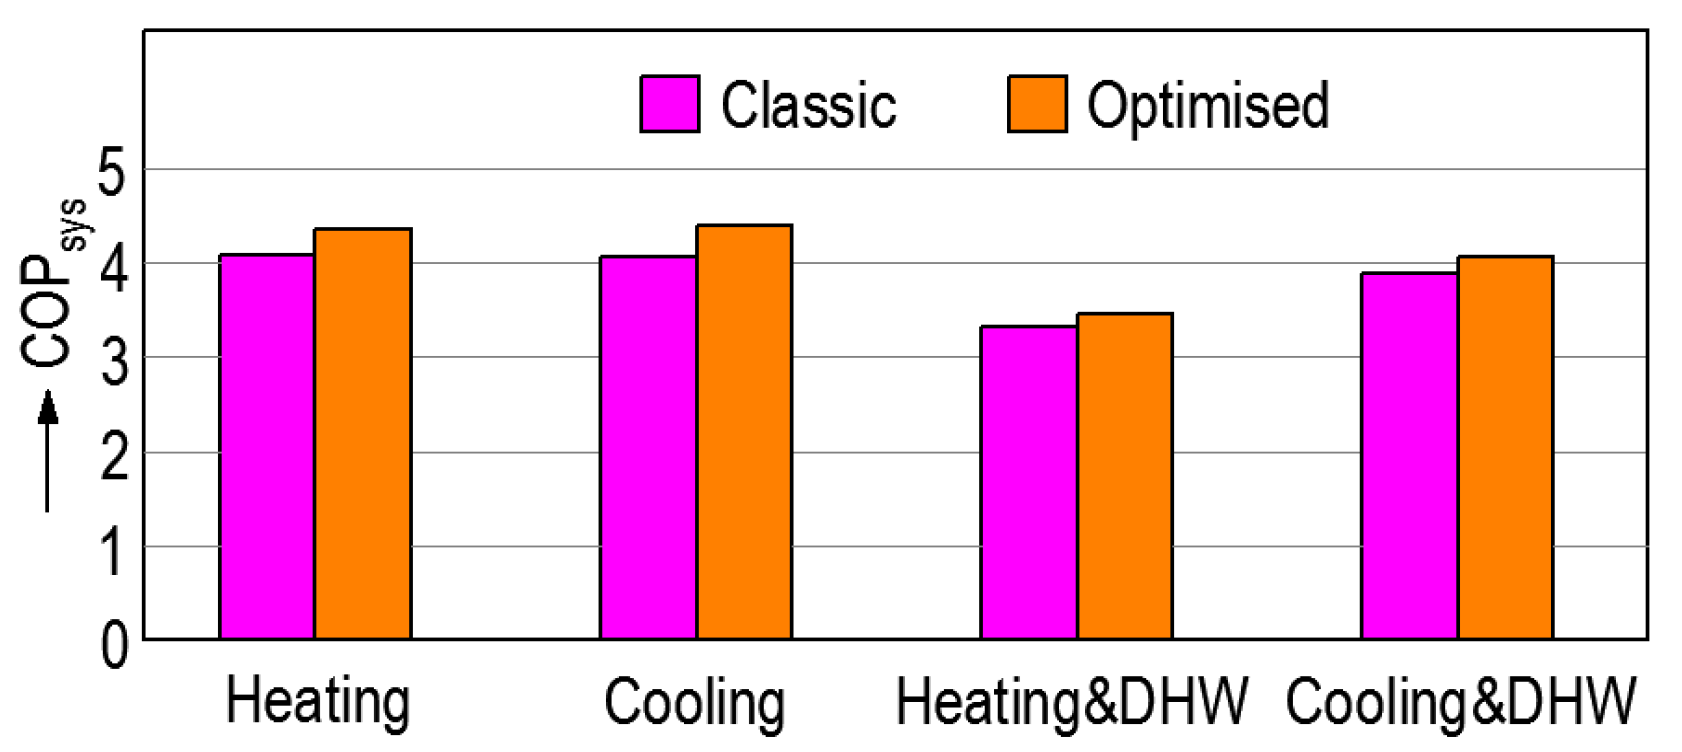
- The accomplished trial investigations showed higher efficiency of the GCHP for the flow rate regulation solution utilizing a BT and programmed control device for circulation pump speed, comparative with an old-style regulation solutions (COPsys with 7–8% increase, and CO2 emissions with 7.5–8% decrease).
- The overall COP of the GCHP in the two solutions was COPsys > 4 for the heating or air-conditioning period, and 3 < COPsys < 4 for heating or air-conditioning and DHW provision.
- In the standard and optimized flow regulation solutions, the experimental evaluations of the COP for HP unit (COPhp) during the heating and DHW period were 3.80 and 3.96, respectively, and during the heating period they were 4.81 and 5.07, respectively.
- The GCHP system utilized for cooling and DHW provision has higher performance (COPsys = 3.90 for the classic case and 4.05 for optimized case) than that for heating and DHW production (COPsys = 3.22 for the classic case and 3.36 for optimized case) because the heat extracted from the soil for heating and DHW production is higher than the heat injected into the soil for air-conditioning and DHW heating.
- When utilizing the variable-speed water pump, electrical energy saving and a decrease in the CO2 emissions of 3% for air heating in the laboratory and 5% for air cooling in the space were obtained simultaneously with DHW generation.
- The proposed numerical simulation model can be utilized as an instrument to establish the GCHP performance in various operating modes in order to optimize the energy efficiency of the system and guarantee the occupant’s comfort consistently.
- A limitation of this study is that the optimized solution for regulating the flow rate of heat-carrying fluid using a buffer tank and an automatic control device of the circulation pump speed is applicable only to residential buildings.
- In order to possibly improve the energy efficiency of the GCHP system, in-depth research is needed in the future, aimed at integrating solar photovoltaic collectors into the system, which will produce electricity to drive the circulation pump in the water pumping process.
Author Contributions
Funding
Conflicts of Interest
References
- European Parliament. European Parliament Resolution of 14 March 2019 on Climate Change—A EUROPEAN Strategic Long-Term Vision for a Prosperous, Modern, Competitive and Climate Neutral Economy in Accordance with the Paris Agreement (2019/2582(RSP)). Available online: https://www.europarl.europa.eu/doceo/document/TA-8-2019-0217_EN.html (accessed on 1 September 2020).
- European Parliament. European Parliament Resolution of 15 January 2020 on the European Green Deal (2019/2956(RSP)). Available online: https://www.europarl.europa.eu/doceo/document/TA-9-2020-0005_EN.html (accessed on 1 September 2020).
- IEA. Global Status Report for Buildings and Construction; International Energy Agency: Paris, France, 2019.
- Aresti, L.; Christodoulides, P.; Florides, G. A review of the design aspects of ground heat exchangers. Renew. Sustain. Energy Rev. 2018, 92, 757–773. [Google Scholar] [CrossRef]
- Atam, E.; Helsen, L. Ground-coupled heat pumps: Part 1—Literature review and research challenges in modeling and optimal control. Renew. Sustain. Energy Rev. 2016, 54, 1653–1667. [Google Scholar] [CrossRef]
- Sarbu, I.; Sebarchievici, C. General review of ground-source heat pump systems for heating and cooling of buildings. Energy Build. 2014, 70, 441–454. [Google Scholar] [CrossRef]
- Inalli, M.; Esen, H. Experimental thermal performance evaluation of a horizontal ground-source heat pump system. Appl. Therm. Eng. 2004, 24, 2219–2232. [Google Scholar] [CrossRef]
- Esen, H.; Inalli, M.; Esen, M. Numerical and experimental analysis of a horizontal ground-coupled heat pump system. Build. Environ. 2007, 42, 1126–1134. [Google Scholar] [CrossRef]
- Esen, H.; Inalli, M.; Sengur, A.; Esen, M. Modelling a ground-coupled heat pump system using adaptive neuro-fuzzy inference systems. Int. J. Refrig. 2008, 31, 65–74. [Google Scholar] [CrossRef]
- Montagud, C.; Corberan, J.M.; Montero, A. In situ optimization methodology for the water circulation pumps frequency of ground source heat pump systems. Energy Build. 2014, 68, 42–53. [Google Scholar] [CrossRef]
- Yang, W.B.; Shi, M.H.; Liu, G.Y. A two-region simulation model of vertical U-tube ground heat exchanger and its experimental verification. Appl. Energy 2009, 86, 2005–2012. [Google Scholar] [CrossRef]
- Lee, J.U.; Kim, T.; Leigh, S.B. Thermal performance analysis of a ground-coupled heat pump integrated with building foundation in summer. Energy Build. 2013, 59, 37–43. [Google Scholar] [CrossRef]
- Pasquier, P.; Zarrella, A.; Marcotte, D. A multi-objective optimization strategy to reduce correlation and uncertainty for thermal response test analysis. Geothermics 2019, 79, 176–187. [Google Scholar] [CrossRef]
- D’Agostino, D.; Mele, L.; Minichiello, F.; Renno, C. The use of ground source heat pump to achieve a net zero energy building. Energies 2020, 13, 3450. [Google Scholar] [CrossRef]
- Soni, S.K.; Pandey, M.; Bartaria, V.N. Ground coupled heat exchangers: A review and applications. Renew. Sustain. Energy Rev. 2015, 47, 83–92. [Google Scholar] [CrossRef]
- Sarbu, I.; Sebarchievici, C. Ground-Source Heat Pumps: Fundamentals, Experiments and Applications; Elsevier: Oxford, UK, 2016. [Google Scholar]
- Cui, Y.; Zhu, J.; Twaha, S.; Chu, J.; Bai, H.; Huang, K.; Chen, X.; Zoras, S.; Soleimani, Z. Techno-economic assessment of the horizontal geothermal heat pump systems: A comprehensive review. Energy Convers. Manag. 2019, 191, 208–236. [Google Scholar] [CrossRef]
- Spilker, E.H. Ground-coupled heat pump loop design using thermal conductivity testing and the effect of different backfill materials on vertical bore length. ASHRAE Trans. 1998, 104, 775. [Google Scholar]
- Kavanaugh, S.P.; Rafferty, K. Ground-source heat pumps—Design of geothermal system for commercial and institutional buildings. In ASHRAE Handbook: Applications; American Society of Heating, Refrigerating and Air Conditioning Engineers: Atlanta, GA, USA, 1997. [Google Scholar]
- Spitler, J.D. GLHEPRO a design tool for commercial building ground loop heat exchangers. In Proceedings of the Fourth International Heat Pumps in Cold Climates Conference, Aylmer, QC, Canada, 17–18 August 2000. [Google Scholar]
- Montagud, C.; Corberan, J.M.; Montero, A.; Urchueguia, J.F. Analysis of the energy performance of a ground source heat pump system after five years ofoperation. Energy Build. 2011, 43, 3618–3626. [Google Scholar] [CrossRef]
- Abu-Rumman, M.; Hamdan, M.; Ayadi, O. Performance enhancement of a photovoltaic thermal (PVT) and ground-source heat pump system. Geothermics 2020, 85, 101809. [Google Scholar] [CrossRef]
- Petit, P.J.; Meyer, J.P. A techno-economic analytical comparison of the performance of air-source and horizontal ground-source air-conditioners in South Africa. Int. J. Energy Res. 1997, 21, 1011–1021. [Google Scholar] [CrossRef]
- Petit, P.J.; Meyer, J.P. Economic potential of vertical ground-source heat pumps compared to air-source air conditioners in South Africa. Energy 1998, 23, 137–143. [Google Scholar] [CrossRef]
- Kavian, S.; Aghanajafi, C.; Jafari Mosleh, H.; Nazari, A.; Nazari, A. Exergy, economic and environmental evaluation of an optimized hybrid photovoltaic-geothermal heat pump system. Appl. Energy 2020, 276, 115469. [Google Scholar] [CrossRef]
- Yavuzturk, C. Modelling of Vertical Ground Loop Heat Exchangers for Ground Source Heat Pump Systems. Ph.D. Thesis, Oklahoma State University, Stillwater, OK, USA, 1999. [Google Scholar]
- Wagner, V.; Bayer, P.; Kuebert, M.; Blum, P. Numerical sensitivity study of thermal response tests. Renew. Energy 2012, 41, 245–253. [Google Scholar] [CrossRef]
- Retkowski, W.; Thoming, J. Thermoeconomic optimization of vertical ground-source heat pump systems through nonlinear integer programming. Appl. Energy 2014, 114, 492–503. [Google Scholar] [CrossRef]
- Zhang, L.; Huang, G.; Zhang, Q.; Wang, J. An hourly simulation method for the energy performance of an office building served by a ground-coupled heat pump system. Renew. Energy 2018, 126, 495–508. [Google Scholar] [CrossRef]
- Zeng, H.Y.; Diao, N.R.; Fang, Z.H. Heat transfer analysis of boreholes in vertical ground heat exchangers. Int. J. Heat Mass Transf. 2003, 46, 4467–4481. [Google Scholar] [CrossRef]
- Michopoulos, A.; Bozis, D.; Kikidis, P.; Papakostas, K.; Kyriakis, N.A. Three-year operation experience of a ground source heat pump system in Northern Greece. Energy Build. 2007, 39, 328–334. [Google Scholar] [CrossRef]
- Hwang, Y.J.; Lee, J.K.; Jeong, Y.M.; Koo, K.M.; Lee, D.H.; Kim, L.K.; Jin, S.W.; Kim, S.H. Cooling performance of a vertical ground-coupled heat pump system installed in a school building. Renew. Energy 2009, 34, 578–582. [Google Scholar] [CrossRef]
- Mostafa, H.; Sharqawy, S.A.; Said, E.M. First in situ determination of the ground thermal conductivity for borehole heat exchanger applications in Saudi Arabia. Renew. Energy 2009, 34, 2218–2223. [Google Scholar]
- Carli, M.D.; Tonon, M.; Zarrella, A.; Zecchin, R. A computational capacity resistance model for vertical ground-coupled heat exchanger. Renew. Energy 2010, 35, 1537–1550. [Google Scholar] [CrossRef]
- Pulat, E.; Coskun, S.; Unlu, K. Experimental study of horizontal ground source heat pump performance for mild climate in Turkey. Energy 2009, 34, 1284–1295. [Google Scholar] [CrossRef]
- Esen, H.; Inalli, M.; Esen, M. A techno-economic comparison of ground-coupled and air-coupled heat pump system for space cooling. Build. Environ. 2007, 42, 1955–1965. [Google Scholar] [CrossRef]
- Lu, Q.; Narsilio, G.A.; Aditya, G.R.; Johnston, I.W. Economic analysis of vertical ground source heat pump systems in Melbourne. Energy 2017, 125, 107–117. [Google Scholar] [CrossRef]
- Man, Y.; Yang, H.; Wang, J.; Fang, Z. In situ operation performance test of ground couplet heat pump system for cooling and heating provision in temperate zone. Appl. Energy 2012, 97, 913–920. [Google Scholar] [CrossRef]
- Esen, H.; Inalli, M. In-situ thermal response test for ground source heat pump system in Elazig, Turkey. Energy Build. 2009, 41, 395–401. [Google Scholar] [CrossRef]
- Del Col, D.; Azzolin, M.; Benassi, G.; Mantovan, M. Experimental analysis of optimal operation mode of a ground source heat pump system. Energy Procedia 2014, 45, 1354–1363. [Google Scholar] [CrossRef]
- Zeng, Z.; Zhao, Y.; Lu, H.; Wei, C. Experimental performance study of ground-coupled heat pump system for cooling and heating provision in karst region. Energy Build. 2018, 158, 971–986. [Google Scholar] [CrossRef]
- Sebarchievici, C.; Sarbu, I. Performance of an experimental ground-coupled heat pump system for heating, cooling and domestic hot-water operation. Renew. Energy 2015, 76, 148–159. [Google Scholar] [CrossRef]
- Sebarchievici, C.; Sarbu, I.; Iacob, M. Automatic Control Device for Heating Systems. Patent No. RO201300054, 29 July 2016. [Google Scholar]
- Thornton, J.W.; McDowell, T.P.; Shonder, J.A.; Hughes, P.J.; Pahud, D.; Hellstrom, G. Residential vertical geothermal heat pump system models: Calibration to data. ASHRAE Trans. 1997, 103, 660–674. [Google Scholar]
- Demidovitch, B.; Maron, I. Elements of Numerical Computation; Mir: Moscow, Russia, 1979. [Google Scholar]
- Banat Water Resources Management Agency. Records for Soil Properties Data of Timisoara, Romania; Banat Water Resources Management Agency: Timisoara, Romania, 2011.
- IEE, Intelligent Energy Europe. Available online: http://ec.europa.eu/energy/environment (accessed on 23 November 2015).
- Esen, H.; Inalli, M.; Esen, M. Technoeconomic appraisal of a ground source heat pump system for a heating season in eastern Turkey. Energy Convers. Manag. 2006, 47, 1281–1297. [Google Scholar] [CrossRef]
- Holman, J.P. Experimental Method for Engineers; McGraw Hill: Singapore, 2001. [Google Scholar]
- Hepbasli, A.; Akdemir, O. Energy and exergy analysis of a ground source (geothermal) heat pump system. Energy Convers. Manag. 2004, 45, 737–753. [Google Scholar] [CrossRef]
- TRNSYS 17, A Transient System Simulation Program User Manual; Solar Energy Laboratory, University of Wisconsin-Madison: Madison, WI, USA, 2012.
- METEONORM. Available online: https://meteonorm.com/en/product/meteonorm-software (accessed on 23 November 2015).
- Bechthler, H.; Browne, M.W.; Bansal, P.K.; Kecman, V. New approach to dynamic modelling of vapour-compression liquid chillers: Artificial neural networks. Appl. Therm. Eng. 2001, 21, 941–953. [Google Scholar] [CrossRef]
- Dawson, C.W.; Abrahart, R.J.; See, L.M. HydroTest: A web-based toolbox of evaluation metrics for the standardised assessment of hydrological forecasts. Environ. Model. Softw. 2007, 22, 1034–1052. [Google Scholar] [CrossRef] [Green Version]


| Flow Regulation | ti (°C) | te (°C) | ts (°C) | Eel (kWh) | Et (kWh) | COPsys (–) | COPhp (–) | (kg) |
|---|---|---|---|---|---|---|---|---|
| (1) Standard | 22.64 | 3.24 | 16.23 | 125.17 | 510.61 | 4.06 | 4.81 | 50.46 |
| (2) Optimized | 21.84 | 3.76 | 17.08 | 116.47 | 512.54 | 4.40 | 5.07 | 46.94 |
| Flow Regulation | ti (°C) | te (°C) | ts (°C) | Eel (kWh) | Et (kWh) | EERsys (Btu/Wh) | COPsys (–) | (kg) |
|---|---|---|---|---|---|---|---|---|
| (1) Standard | 26.21 | 24.53 | 20.49 | 71.00 | 287.22 | 13.78 | 4.03 | 28.61 |
| (2) Optimized | 25.72 | 24.89 | 20.66 | 65.15 | 288.44 | 15.10 | 4.43 | 26.24 |
| Flow Regulation | ti (°C) | te (°C) | ts (°C) | tdhw (°C) | Vdhw (m3) | Eel (kWh) | Et (kWh) | COPsys (–) | COPhp (–) | (kg) |
|---|---|---|---|---|---|---|---|---|---|---|
| (1) Standard | 21.27 | 1.03 | 16.79 | 42.63 | 1.21 | 82.66 | 266.99 | 3.22 | 3.80 | 33.31 |
| (2) Optimized | 21.61 | 0.93 | 16.27 | 42.64 | 80.12 | 269.13 | 3.36 | 3.96 | 32.28 |
| Flow Regulation | ti (°C) | te (°C) | ts (°C) | tdhw (°C) | Vdhw (m3) | Eel (kWh) | Et (kWh) | COPsys (–) | (kg) |
|---|---|---|---|---|---|---|---|---|---|
| (1) Classic | 25.40 | 24.96 | 20.62 | 38.92 | 1.36 | 50.80 | 198.62 | 3.90 | 20.47 |
| (2) Optimized | 25.45 | 25.28 | 20.60 | 39.12 | 48.22 | 195.06 | 4.05 | 19.43 |
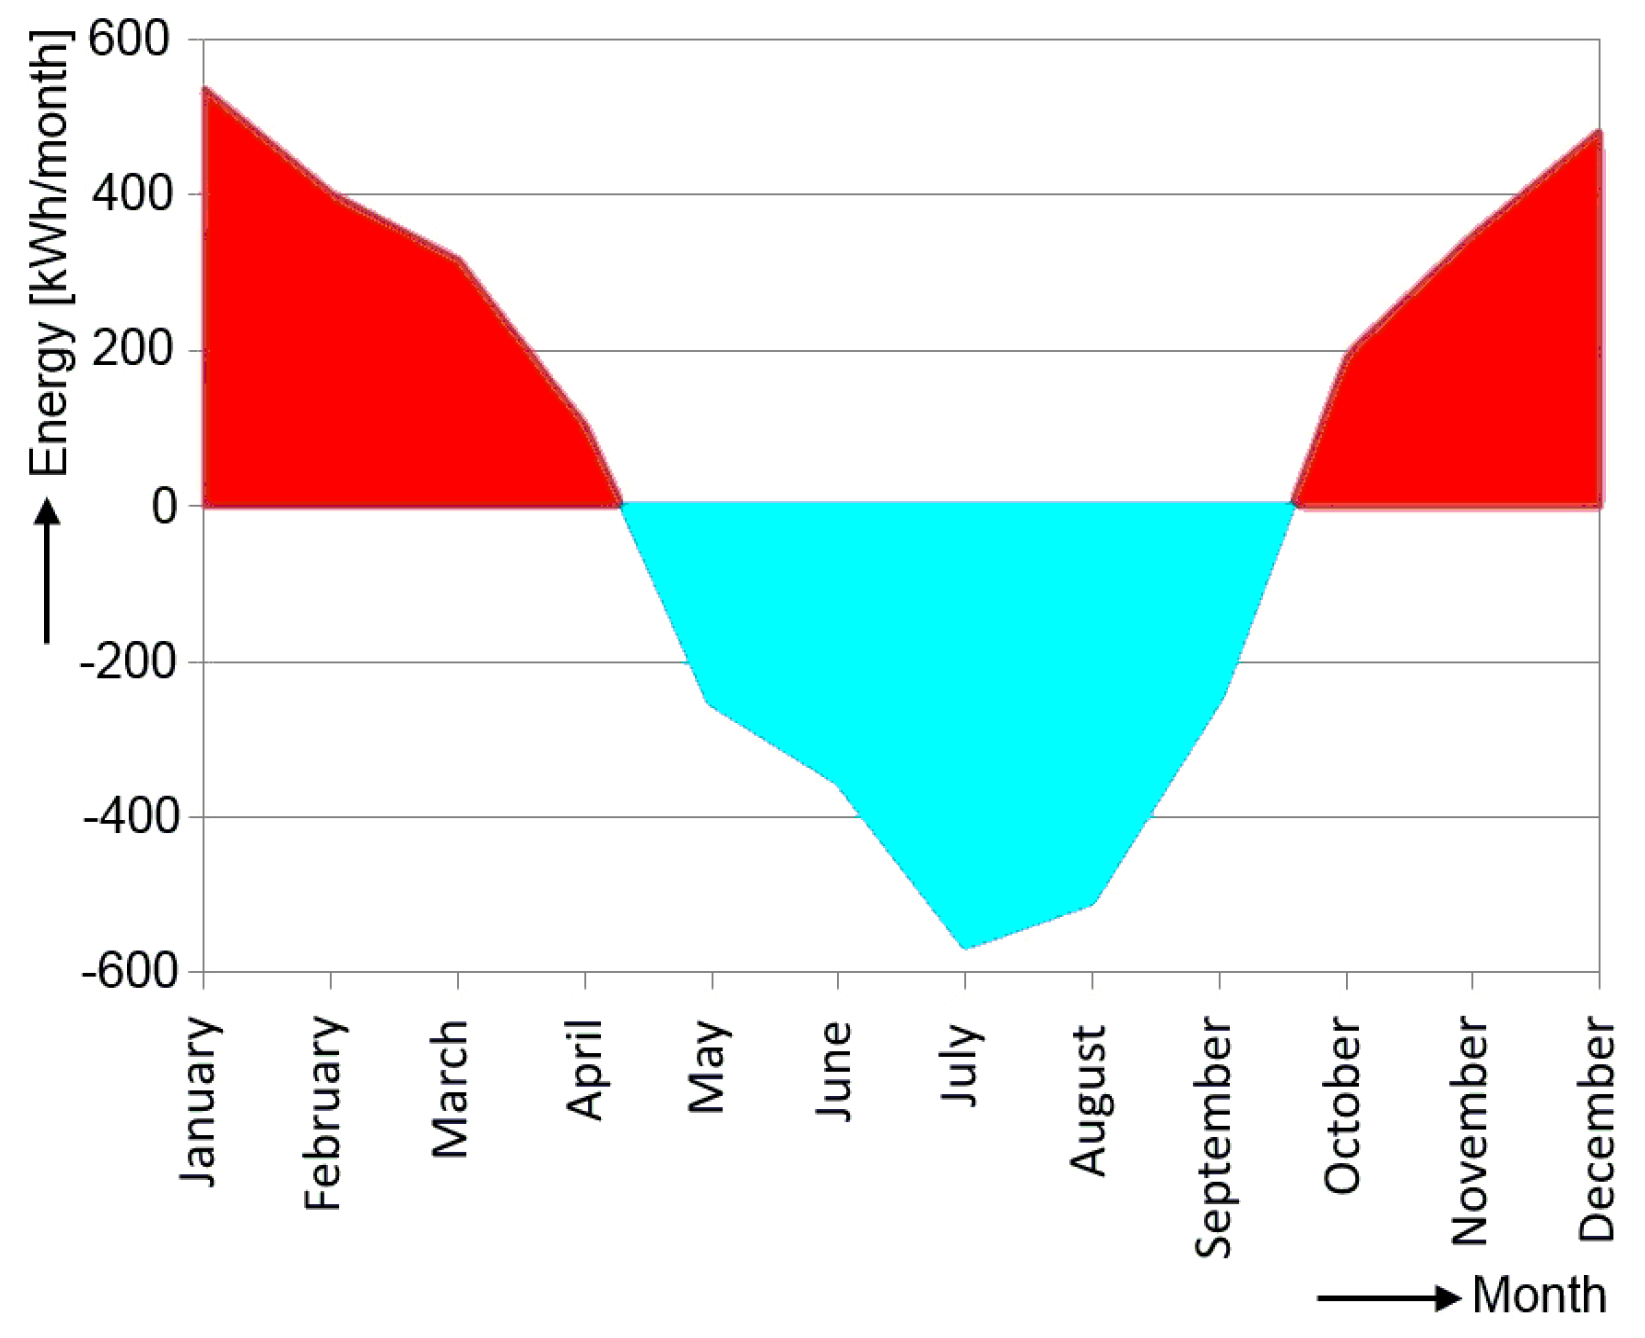
| Month | Heating Energy (kWh) | Relative Error er (%) | Cooling Energy (kWh) | Relative Error er (%) | ||
| Predicted | Measured | Predicted | Measured | |||
| Jan. | 505.00 | 512.48 | −1.45 | 0.00 | 0.00 | 0.00 |
| Feb. | 391.40 | 390.12 | +0.32 | 0.00 | 0.00 | 0.00 |
| Mar. | 303.21 | 300.87 | +0.77 | 0.00 | 0.00 | 0.00 |
| Apr. | 99.45 | 97.89 | +1.59 | 0.00 | 0.00 | 0.00 |
| May | 0.00 | 0.00 | 0.00 | 208.00 | 211.23 | −1.52 |
| Jun. | 0.00 | 0.00 | 0.00 | 242.00 | 242.82 | −0.33 |
| Jul. | 0.00 | 0.00 | 0.00 | 337.90 | 333.12 | +1.43 |
| Month | Heating Energy (kWh) | Relative Error er (%) | Cooling Energy (kWh) | Relative Error er (%) | ||
| Predicted | Measured | Predicted | Measured | |||
| Aug. | 0.00 | 0.00 | 0.00 | 437.80 | 445.14 | −1.64 |
| Sep. | 0.00 | 0.00 | 0.00 | 324.30 | 319.20 | +1.59 |
| Oct. | 189.70 | 191.31 | −0.84 | 0.00 | 0.00 | 0.00 |
| Nov. | 348.90 | 345.23 | +1.06 | 0.00 | 0.00 | 0.00 |
| Dec. | 477.50 | 480.21 | −0.56 | 0.00 | 0.00 | 0.00 |
| Operating Mode | RMSE | cv | R2 |
|---|---|---|---|
| Heating | 2.72187 | 0.01409 | 0.99990075 |
| Air-conditioning | 3.08003 | 0.02382 | 0.99977802 |
© 2020 by the authors. Licensee MDPI, Basel, Switzerland. This article is an open access article distributed under the terms and conditions of the Creative Commons Attribution (CC BY) license (http://creativecommons.org/licenses/by/4.0/).
Share and Cite
Sarbu, I.; Sebarchievici, C. Exploratory Research to Improve Energy-Efficiency of a Ground-Coupled Heat Pump Utilizing an Automatic Control Device of Circulation Pump Speed. Energies 2020, 13, 5016. https://doi.org/10.3390/en13195016
Sarbu I, Sebarchievici C. Exploratory Research to Improve Energy-Efficiency of a Ground-Coupled Heat Pump Utilizing an Automatic Control Device of Circulation Pump Speed. Energies. 2020; 13(19):5016. https://doi.org/10.3390/en13195016
Chicago/Turabian StyleSarbu, Ioan, and Calin Sebarchievici. 2020. "Exploratory Research to Improve Energy-Efficiency of a Ground-Coupled Heat Pump Utilizing an Automatic Control Device of Circulation Pump Speed" Energies 13, no. 19: 5016. https://doi.org/10.3390/en13195016