Article

Model Predictive Virtual Synchronous Control of Permanent Magnet Synchronous Generator-Based Wind Power System

School of Electrical and Information Engineering, Zhengzhou University of Light Industry, Zhengzhou 450002, China
*
Author to whom correspondence should be addressed.
Energies 2020, 13(19), 5022; https://doi.org/10.3390/en13195022
Submission received: 31 July 2020 / Revised: 5 September 2020 / Accepted: 23 September 2020 / Published: 24 September 2020
(This article belongs to the Section F: Electrical Engineering)

Abstract

:
As much wind power is integrated into the power grid through power electronic equipment, the use of wind power is increased rapidly. Wind power system makes the power grid lack inertia and damping, thereby reducing power grid stability; in severe cases, it may even be disconnected. virtual synchronous generator (VSG) has been put forward to enhance the anti-disturbance performance of power grid. However, conventional VSG adopts an outer power loop and inner-current loop control. The inner-current loop control needs a pulse width modulation (PWM) module and proportion integration (PI) parameter settings. In order to reduce the parameter settings and simplify control structures, in this study, model predictive control (MPC) is used instead of inner-current loop control. At the same time—for the overall stability and control flexibility of the back-to-back system—we further propose to use outer-voltage loop control (OVLC) and MPC to stabilize direct current (DC) voltage on the machine-side and to employ model predictive virtual synchronous controls to provide inertia and damping for the power grid. The proposed control method was simulated in Matlab/Simulink (MathWorks, Massachusetts, MA, 2016) and verified by experimental results.

1. Introduction

Since the 21st century, renewable energy sources (RES) has emerged globally as a new energy reform [1,2,3]. Distributed generation (DG) is dominated by solar energy and wind power [4,5,6]. Wind energy has received extensive attention in terms of economy and system stability [7,8]. However, wind energy is fed to the grid through a power electronics system, which usually cannot provide the necessary inertia and damping for the grid [9,10,11,12]. When the power grid is disturbed, it cannot recover by itself, which is extremely unfavorable for building a strong smart grid.
In order to make power electronic equipment show the mechanical characteristics of motors, the first concept virtual synchronous machine (VSM) was proposed in 2007 by Dr. Beck [13]. By simulating the mathematical model of traditional generators, inertia and damping are provided to the power grid, making the grid-connected inverter work as a controlled current source. In 2009, Q. Zhong proposed the VSG, which works as a controlled voltage source by simulating the synchronous generator voltage model [14,15]. The VSG can simulate the characteristics of the synchronous generator, such as electromagnetic characteristics, rotor inertia, frequency modulation and voltage regulation. Therefore, the VSG shows the same characteristics as the traditional synchronous generator, which can support the grid connection of wind power and achieve a large-scale grid connection of wind power.
VSG research primarily focuses on power-fluctuation reduction, parameter adaptive, power distribution and power grid imbalance management [16,17,18,19]. Concerning VSG research into power-fluctuation reduction, hybrid energy storage systems (HESS) were introduced in [16], composed of a battery and a supercapacitor. The supercapacitor stabilizes high-frequency power fluctuation by simulating the inertia of VS; a battery compensates for the long-term and slow power fluctuations by simulating the sag control of VSG. A parameter adaptive control strategy was suggested in [17]. The influence of inertia and damping on power and frequency are determined by deducing small-signal model, and an optimal damping ratio is maintained throughout the operation to suppress power and frequency oscillations. In [18], a new low voltage ride through (LVRT) control strategy based on a smooth switching algorithm was raised, the control strategy converts a voltage source into a current source and provides reactive power support through proportional resonance limited current control. An improved VSG control was proposed under the condition of an unbalanced grid voltage in [19]. The added positive sequence current regulator in traditional VSG control allows the reference current to track the positive sequence current. At the same time, it suppresses the negative sequence current component. Besides in [20], a generalized optimal wind energy conversion system with a VSG strategy was suggested, which could improve the frequency support capability. However, the VSG strategy mentioned connects to the power grid through a PWM control, which requires PWM modulation and PI control. Although the PWM control could improve the efficiency of power conversion, the control structure is complicated, and the parameter adjustment is difficult.
MPC has the advantages of good adaptability, strong robustness and multiple constraint variables and without using PI control and PWM modulation [21,22]. MPC has been extensively studied to improve power and frequency stability [23,24,25]. According to the Lyapunov criterion, the MPC method based on constraint dichotomy was proposed in [23] to improve the stability of the cascade system. In [24], a disturbance observer-based offset-free MPC was introduced for the controlled converter, which selects the weighted matrix of the correct value function to accelerate the error attenuation. Under this control strategy, power tracking performance was improved. The system stability problems caused by RES has also been studied using MPC. In [25], an active frequency response (AFR) method based on MPC was proposed. The MPC–AFR control strategy could effectively improve the frequency stability of the system under large disturbances.
Based on the above analysis, the traditional VSG adopts the outer power loop and inner-current loop control, the inner-current loop control needs a PWM module and PI parameter settings, for which the control structure is complex and the dynamic response is slow. The method MPC does not need PI control and PWM modulation, which simplifies the control structure and has a faster dynamic response. Thus, in this paper, MPC is used instead of the inner-current loop control. At the same time—for the overall stability and control flexibility of the back-to-back system—it is further suggested to employ OVLC and MPC to stabilize DC voltage on the side of the machine and to use model predictive virtual synchronous control to provide inertia and damping for the power grid. First, the reference voltage and DC-link voltage generate the reference current by PI control and MPC samples the stator current of Permanent Magnet Synchronous Generator (PMSG) to generate the prediction current. The cost function is defined as the error absolute value of the reference current and the predicted current. Moreover, a group of switching states with the minimum error is selected and applied to the next sampling period. Second, VSG is used to simulate the mathematical model of the traditional synchronous generator on the grid-side, which provides inertia and damping for the power grid and improving its reliability and disturbance resistance.

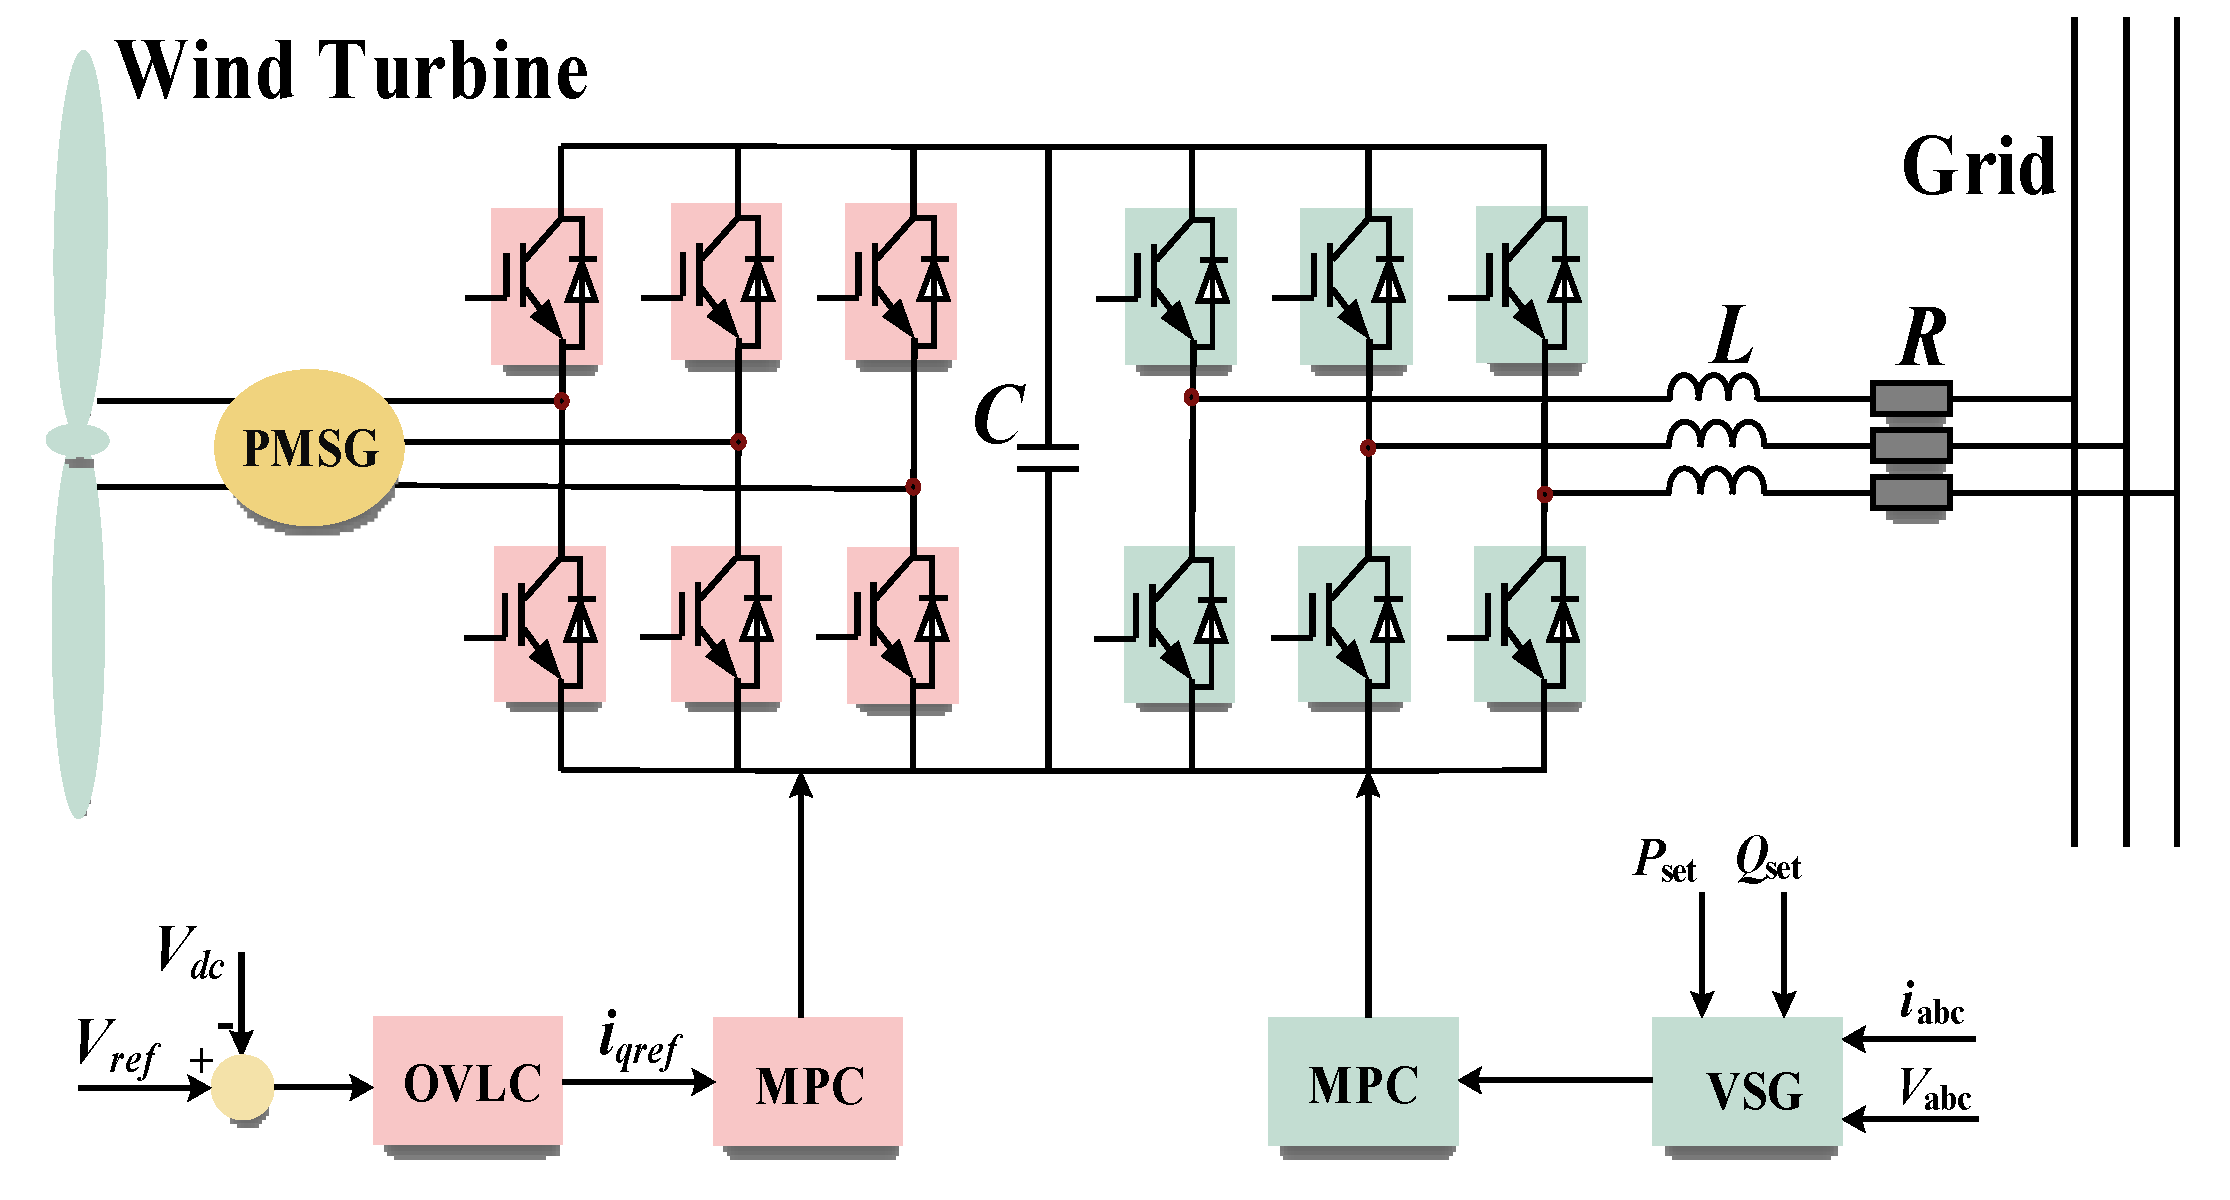
2. Outer-Voltage Loop Control and Model Predictive Control in Generator-Side

2.1. Wind Power System

The structure of the PMSG system applied to wind power generation is shown in Figure 1. The PMSG is connected to the power grid by a back-to-back power electronic converter. It composes a rectifier alternating current to direct current (AC–DC), DC-link capacitors and a DC–AC inverter.
The wind energy captured by a wind turbine is expressed as Pwind and the formula as follows:
P wind = 1 2 m v 2 = 1 2 ρ V v 2 = 1 2 ρ S v 3
where Pwind is the wind power, v is the wind speed, m is the air mass flow, S is the swept area, ρ is the air density, V is airflow volume.
The wind turbine output power depends on the power coefficient Cp, thus the wind turbine output power can be expressed as:
P t u r = C p P w i n d = 1 2 ρ S v 3 C p = 1 2 ρ π R 2 v 3 C p ( λ , β )
where β is pitch angle, λ is the tip-speed ratio, R is the turbine rotor radius.
The power coefficient Cp is usually tracked by maximum power point tracking (MPPT), in [26] the maximum value of Cp is 0.593, which means that the output power of wind power generation is always less than 59.3%. From the above formula, when the effect of Cp on the wind generator is ignored, the wind speed and the output power are directly proportional. When the wind speed changes, the output power of the generator changes, and the power of the DC-link voltage capacitor also changes.
The DC-link voltage acts as an energy store and which can decouple the active and reactive power. When the DC-link voltage is constant, the active power can be transferred from the PMSG to the grid side, but the reactive power cannot pass through the intermediate DC-link voltage. Therefore, when the wind turbine generates active power to the grid through the PMSG, the stability of the DC-link voltage is crucial. In this section, OVLC is used to stabilize the DC-link voltage and MPC is used to control the current in the inner ring.

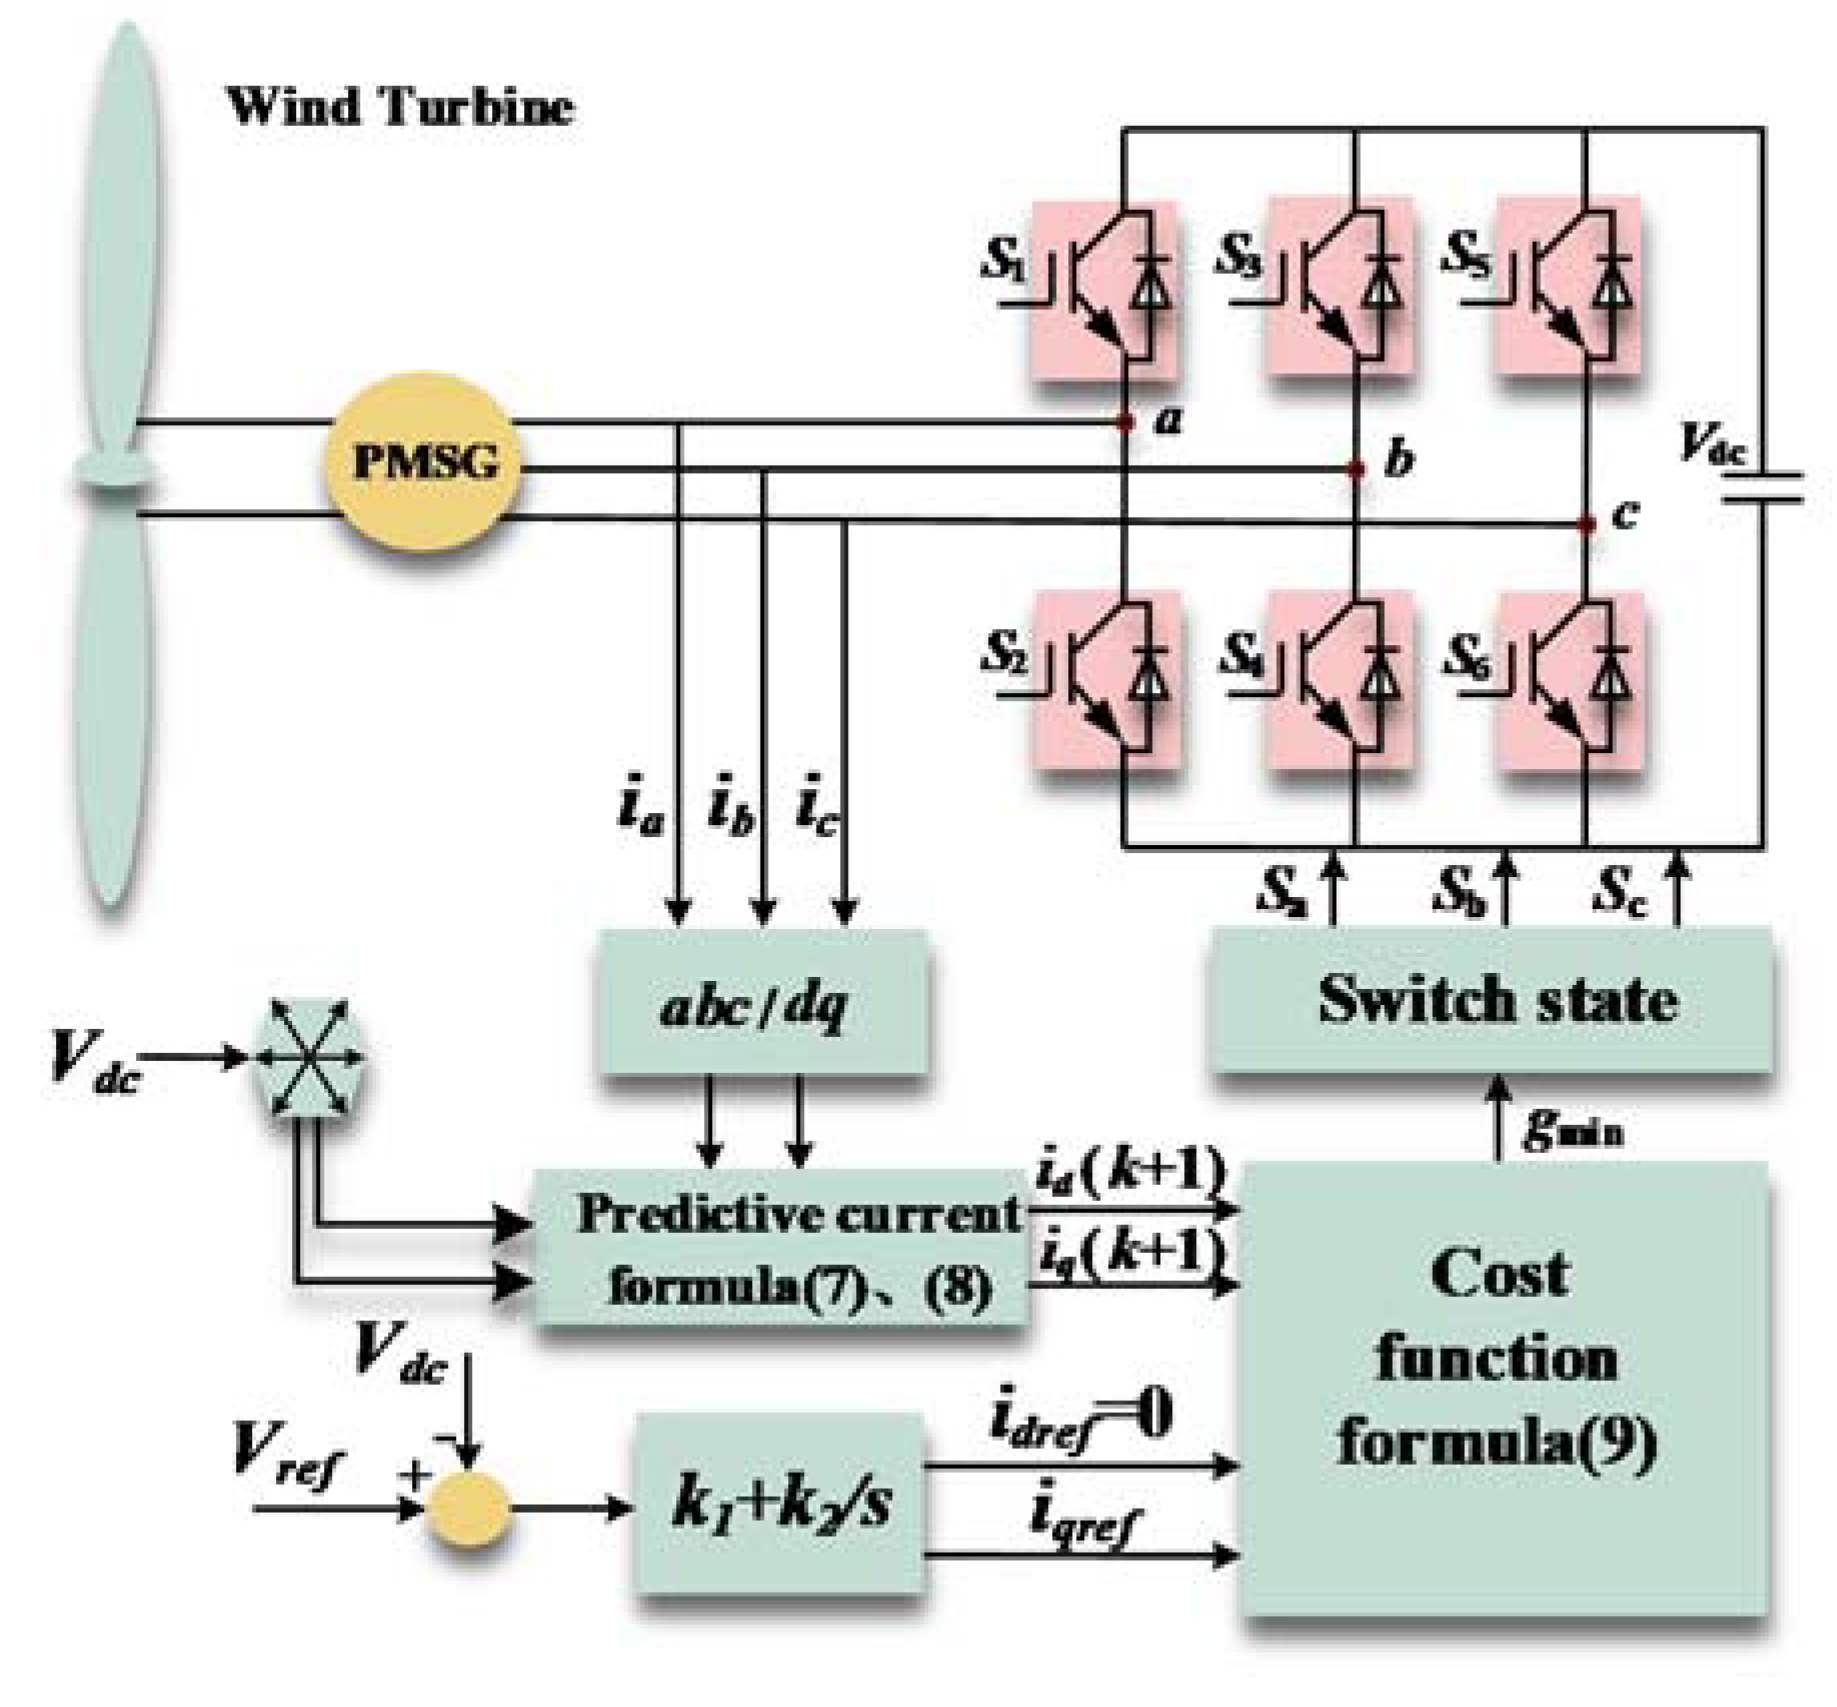
2.2. Establish Permanent Magnet Synchronous Generator Current Model

The stator voltage equation of PMSG can be expressed as:
U d = L d d i d d t ω e L q i q + R s i d
U q = L q d i q d t + ω e L q i q + ω e φ f + R s i q
where Ud is the stator voltage direct axis component, Uq is the stator voltage quadrature axis component, id is the stator current direct axis component, iq is the stator current direct axis component, Ld is the stator inductance direct axis component, Lq is the stator inductance quadrature axis component, Rs is stator resistance, ωe is rotor speed and φf is the synthetic rotor flux.
Therefore, the stator current equation of PMSG can be obtained as follows:
d i d d t = 1 L s ( u d R s i d + ω e L s i q )
d i q d t = 1 L s ( u q R s i q ω e L s i d ω e φ f )
In order to calculate the predicted current at tk+1 instant, ignore the interaction of stator, Euler’s formula can be used to approximate the discrete current prediction formulas of dq axes as follows:
i d ( k + 1 ) = i d ( k ) + T s L s ( u d ( k ) R s i d ( k ) )
i q ( k + 1 ) = i q ( k ) + T s L s ( u q ( k ) R s i q ( k ) )
where id(k), iq(k), ud(k) and uq(k) are the dq components of output current and voltage at tk instant, id(k + 1) and iq(k + 1) are the dq components of the predictive current value at tk+1 instant.
Predicted current id(k + 1), iq(k + 1) is calculated by using Equations (7) and (8). The reference voltage Vref and DC-link voltage Vdc generate the reference current signal by PI control. When the rectifier operates at unity power factor, the reactive current component idref = 0, and the output reference current is the active current component iqref. The error absolute value of the reference current and the prediction current is defined as the cost function g in Equation (9).
g = | i d r e f i d ( k + 1 ) | + | i q r e f i q ( k + 1 ) |
Among the eight switch vectors generated by the three-phase, six-switch inverter, g is chosen to be the minimum, and the corresponding switching state is applied to the inverter. Then a voltage outer loop control and MPC inner loop control are formed. Compared with the traditional voltage and current double closed-loop control, the proposed control strategy not only stabilizes the DC-link voltage, but also reduces the PI controller and the modulation method is simple. The control block diagram is shown in Figure 2.

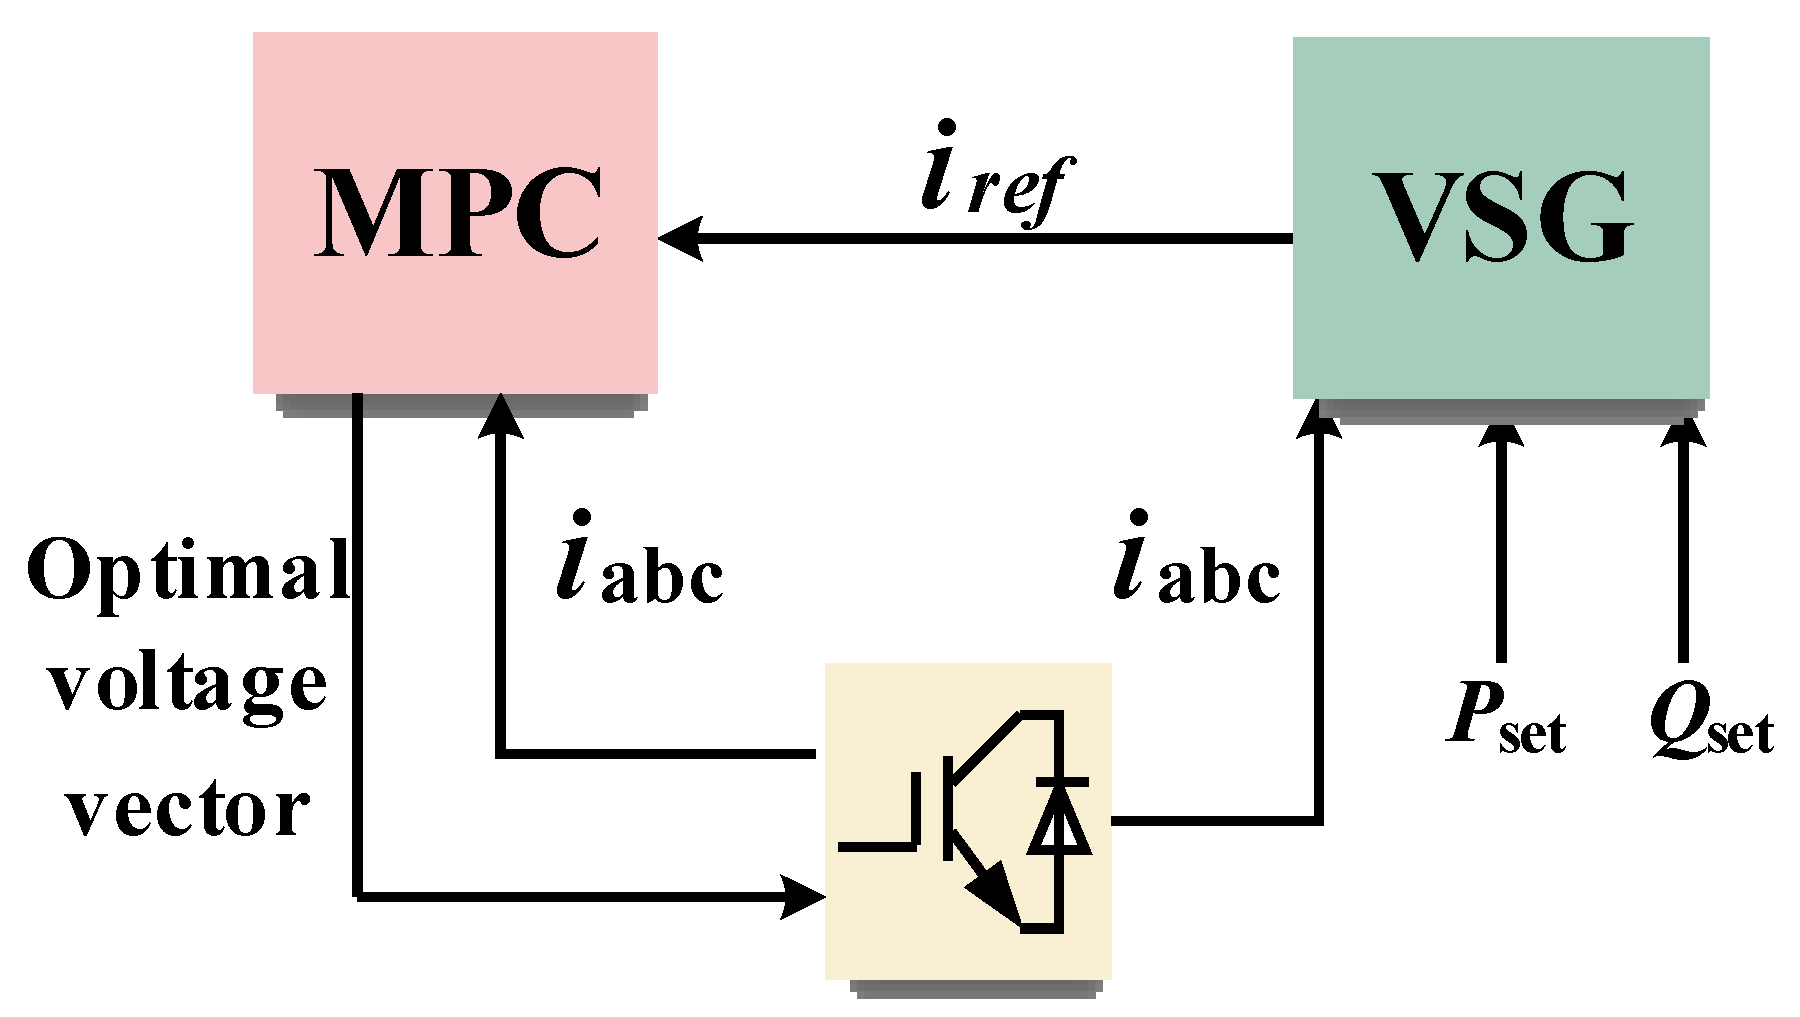
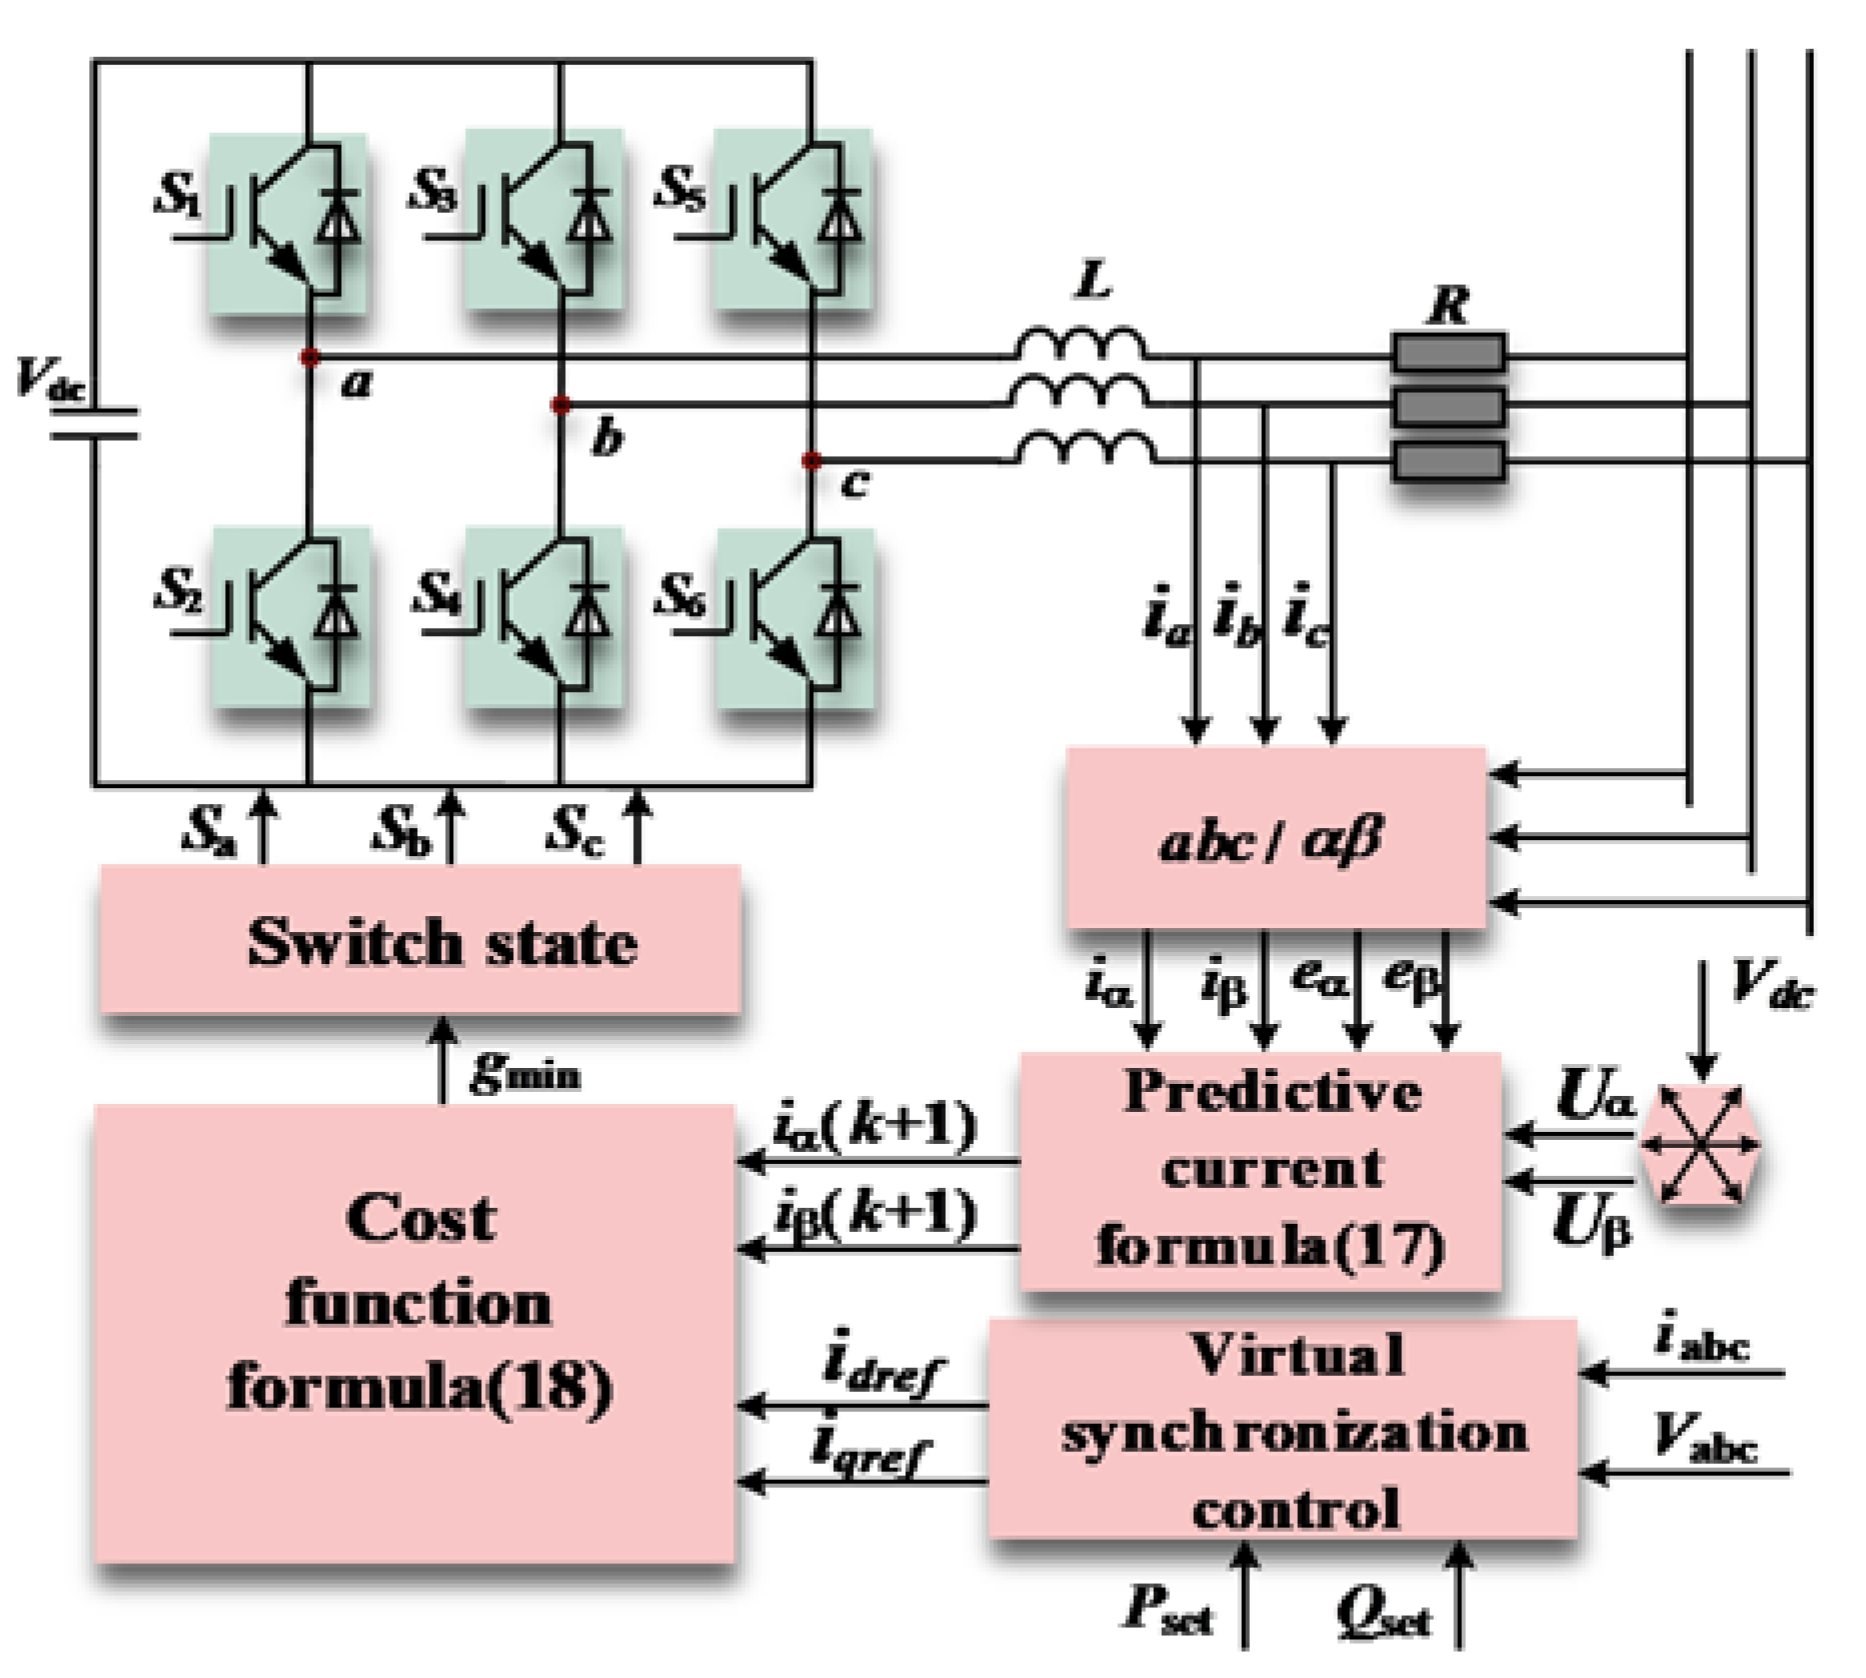
3. Virtual Synchronous Inverter in Grid-Side

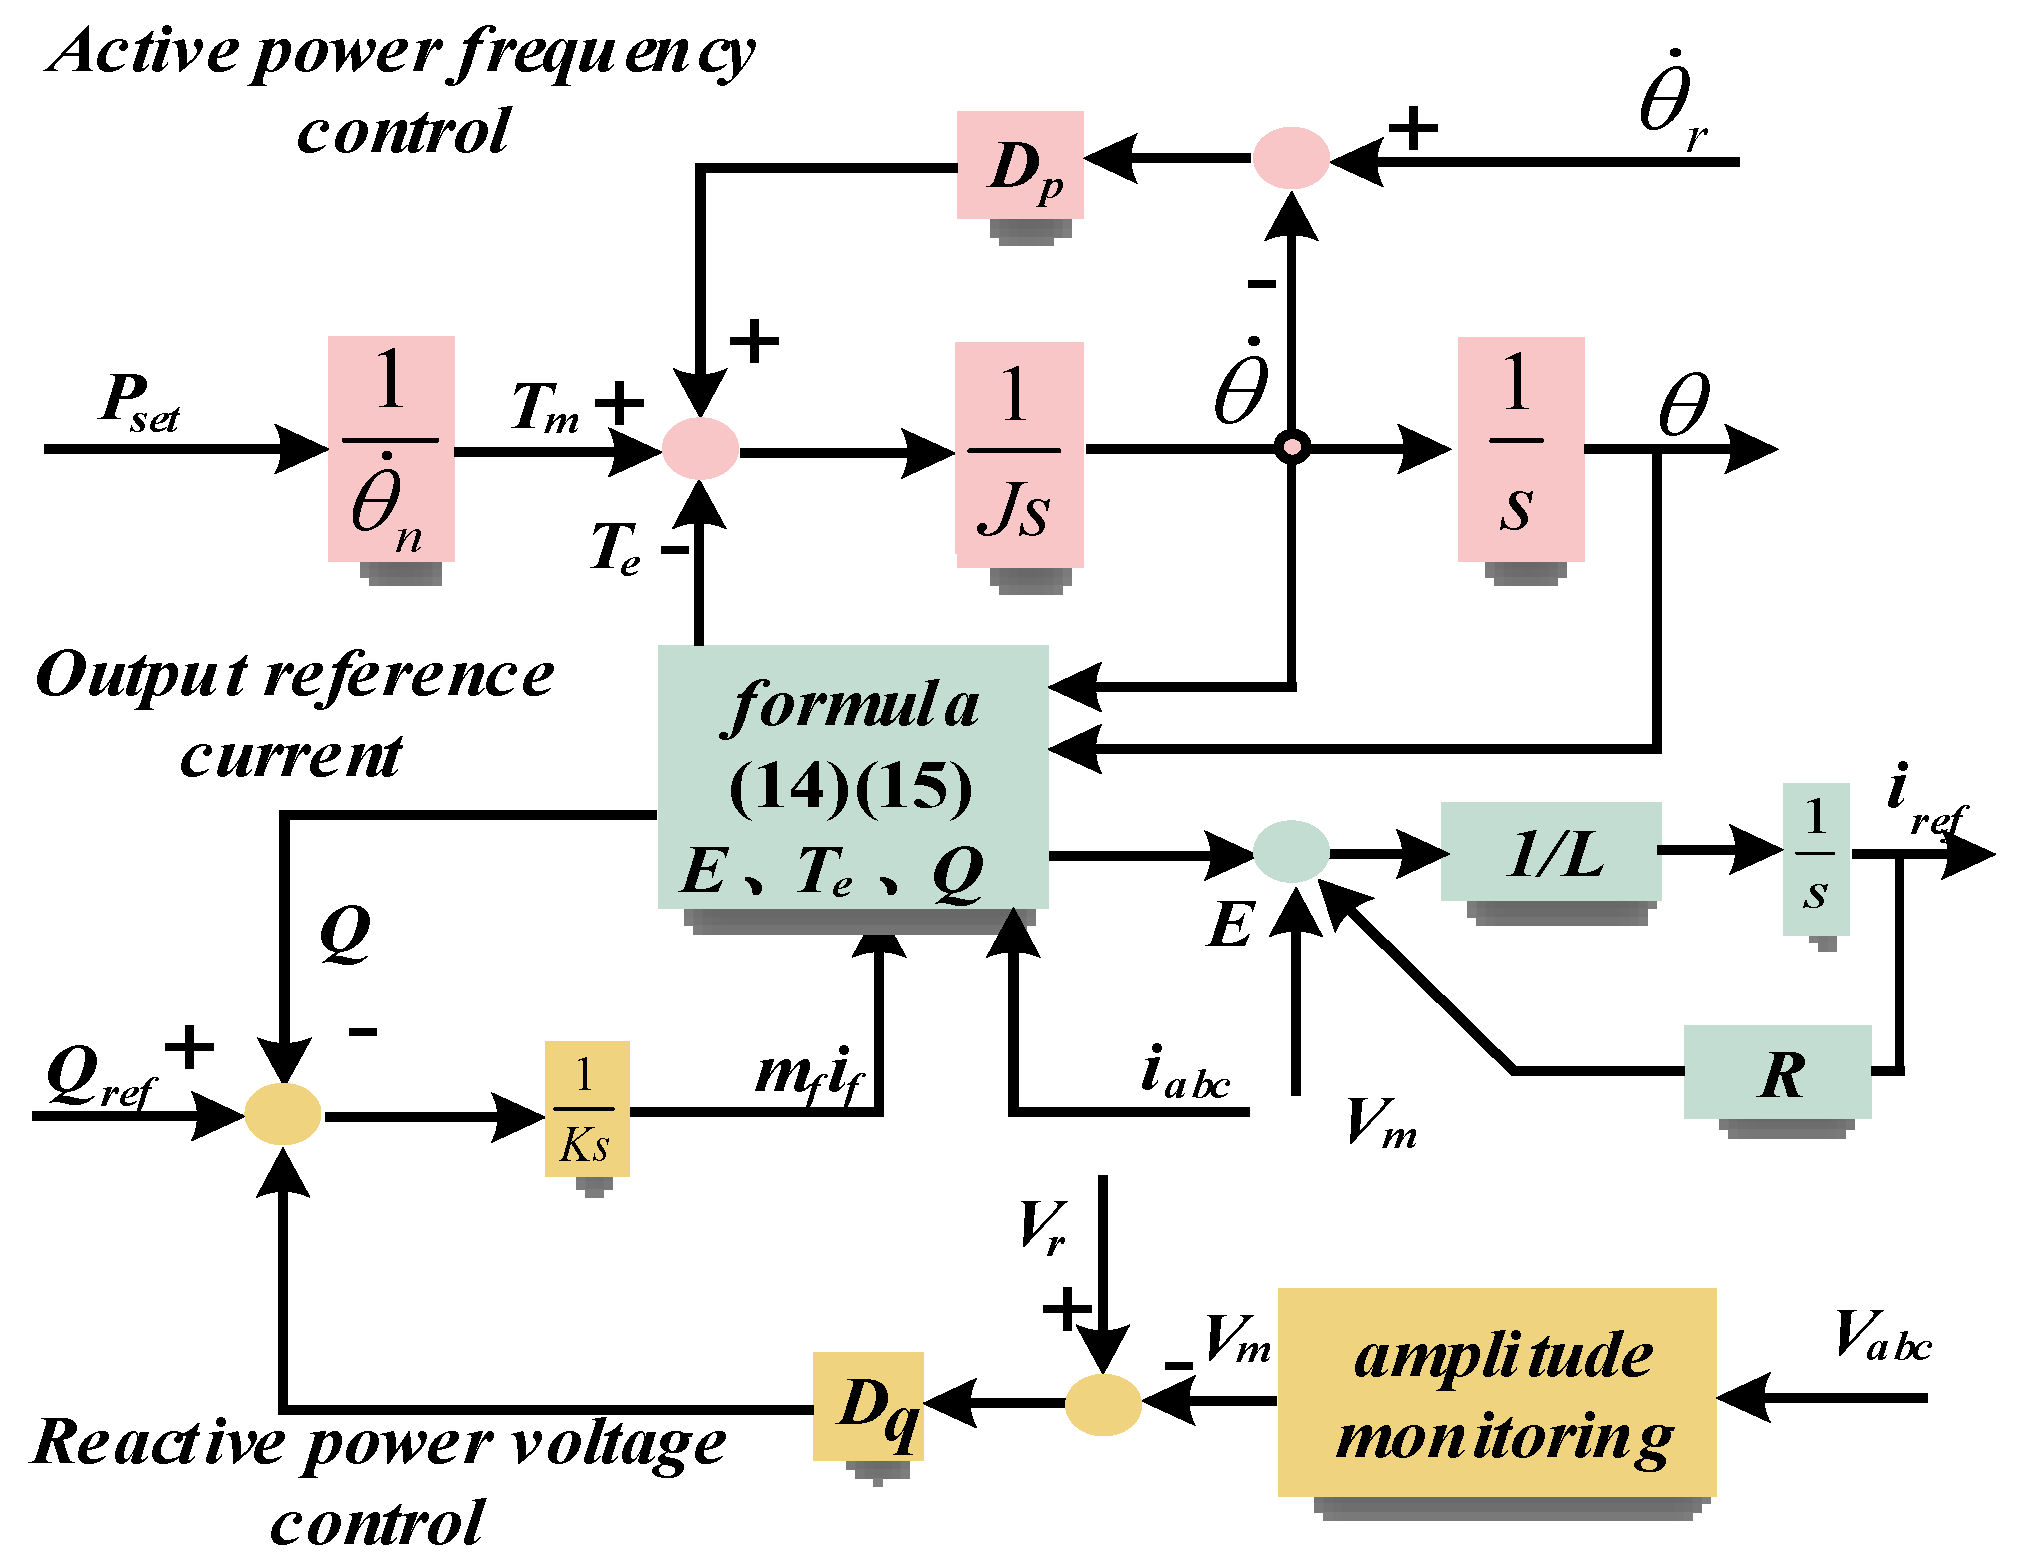
3.1. Virtual Synchronous Generator Mathematical Model in Grid-Side

Causing the traditional inverter cannot provide damping and inertia to the power grid, the stability and anti-interference ability of the power grid are reduced. Proposed by Q. Zhong and other scholars, the VSG controls the inverter by simulating the mechanical and electromagnetic equations of the synchronous generator, which makes the inverter has the same performance as the synchronous generator, so that the inverter can provide damping and inertia for the power grid. The VSG can also modulate the active power frequency modulation and reactive power voltage. The control block diagram of the VSG is shown in Figure 3.
The VSG simulates the mechanical of the synchronous generator. The core formula is the swing Equation (10).
J θ ¨ = T m T e D p θ ˙
J provides inertia for the power grid and D provides damping. These two variables make up for the low rotational inertia and low overload capacity of power electronic devices when they are connected to the grid. Adding J and D is a great significance to improve the microgrid performance.
Tm is regulating the mechanical power of the VSG, while Te is adjusting the electromagnetic power. The formula is as follows:
P r e f θ ˙ n = T m
T e = M f i f ( i , s i n θ )
In the part of reactive power–voltage control, set the reference value of reactive power is Qref, the grid actual reactive power Q is calculated based on the excitation current and mutual inductance (13).
Q = θ ˙ M f i f ( i , c o s θ )
The error between the terminal voltage Vm and the rated voltage Vr is adjusted by the voltage droop coefficient Dq, and the error value is fed back to the reference reactive power Qref. Therefore, the grid voltage is regulated by voltage droop control, which is composed of the reference reactive power Qref, grid reactive power Q and voltage deviation.
There is an error voltage between the virtual potential E of VSG and the terminal voltage Vm, generating a reference current, so VSG is represented as a controlled current source. According to the control block diagram in Figure 2 and the relationship between voltage and current, Equation (14) is obtained:
I = E V m R + j ω L
where R is the grid resistance and L is the filter inductance.

3.2. Establish Virtual Synchronous Generator Prediction Control Model

From the structure of the three-phase, six-switch inverter and Kirchhoff’s voltage law, the voltage expression is shown as follows:
L d i w d t + R i w = V w n e w ,   w = a ,   b ,   c
where L is filtering inductance, R is equivalent resistance, iw, Vwn and ew are, respectively w phase current, phase voltage and grid voltage.
The state equation of the αβ two-phase stationary coordinates is obtained, after a coordinate transformation of (15) as
L d i j d t = V j e j R i j ,   j = α ,   β
Simplify (16), the predictive current at tk+1 instant is given as follows:
i j ( k + 1 ) = T s L [ V j ( k ) e j ( k ) ] + ( 1 R T s L ) i j ( k ) ,   ( j = α ,   β )
where Ts represents the sampling period, ij(k), Vj(k) and ej(k) are the output current value, voltage vector and grid voltage of the sampling inverter side, respectively.
Eight voltage vectors are obtained from different switching states of the inverter, every voltage vector outputs a current value. In order to have the least error between the output current at tk instant and tk+1 instant, it is necessary to predict the current value in different switching states from Equation (17) and select the optimal switching vector by the cost function.
The relationship between VSG and MPC is shown in Figure 4. Three-phase current ia, ib, ic are sampled by VSG and MPC and VSG output reference current iref for MPC, the MPC selects the optimal voltage vector control inverter to track the reference current and forms the current closed-loop control.
Model predictive virtual synchronous control is shown in Figure 5. First, the three-phase current ia, ib, ic and the grid voltages ea, eb, ec are sampled. The current values iα, iβ and voltage values eα, eβ are obtained in the αβ stationary coordinate system with Clark transform. The output voltages of inverter uα, uβ are obtained by Vdc. Predictive current values iα(k + 1) and iβ(k + 1) at tk+1 instant are calculated by the predictive current Equation (17). Second, three-phase current ia, ib, ic, voltage ua, ub, uc and reference power Pref, Qref are sampled. Reference current values iα* and iβ* are output by virtual synchronization control. Last, the cost function is defined as the error absolute value of the reference current and the predicted current Equation (18).
g = | i α * i α ( k + 1 ) | + | i β * i β ( k + 1 ) |

4. Simulation Verification

In order to verify the effectiveness of the DC-link voltage stabilization control and model predictive virtual synchronous control, MATLAB/Simulink simulation model is built with system parameters showing in Table 1.

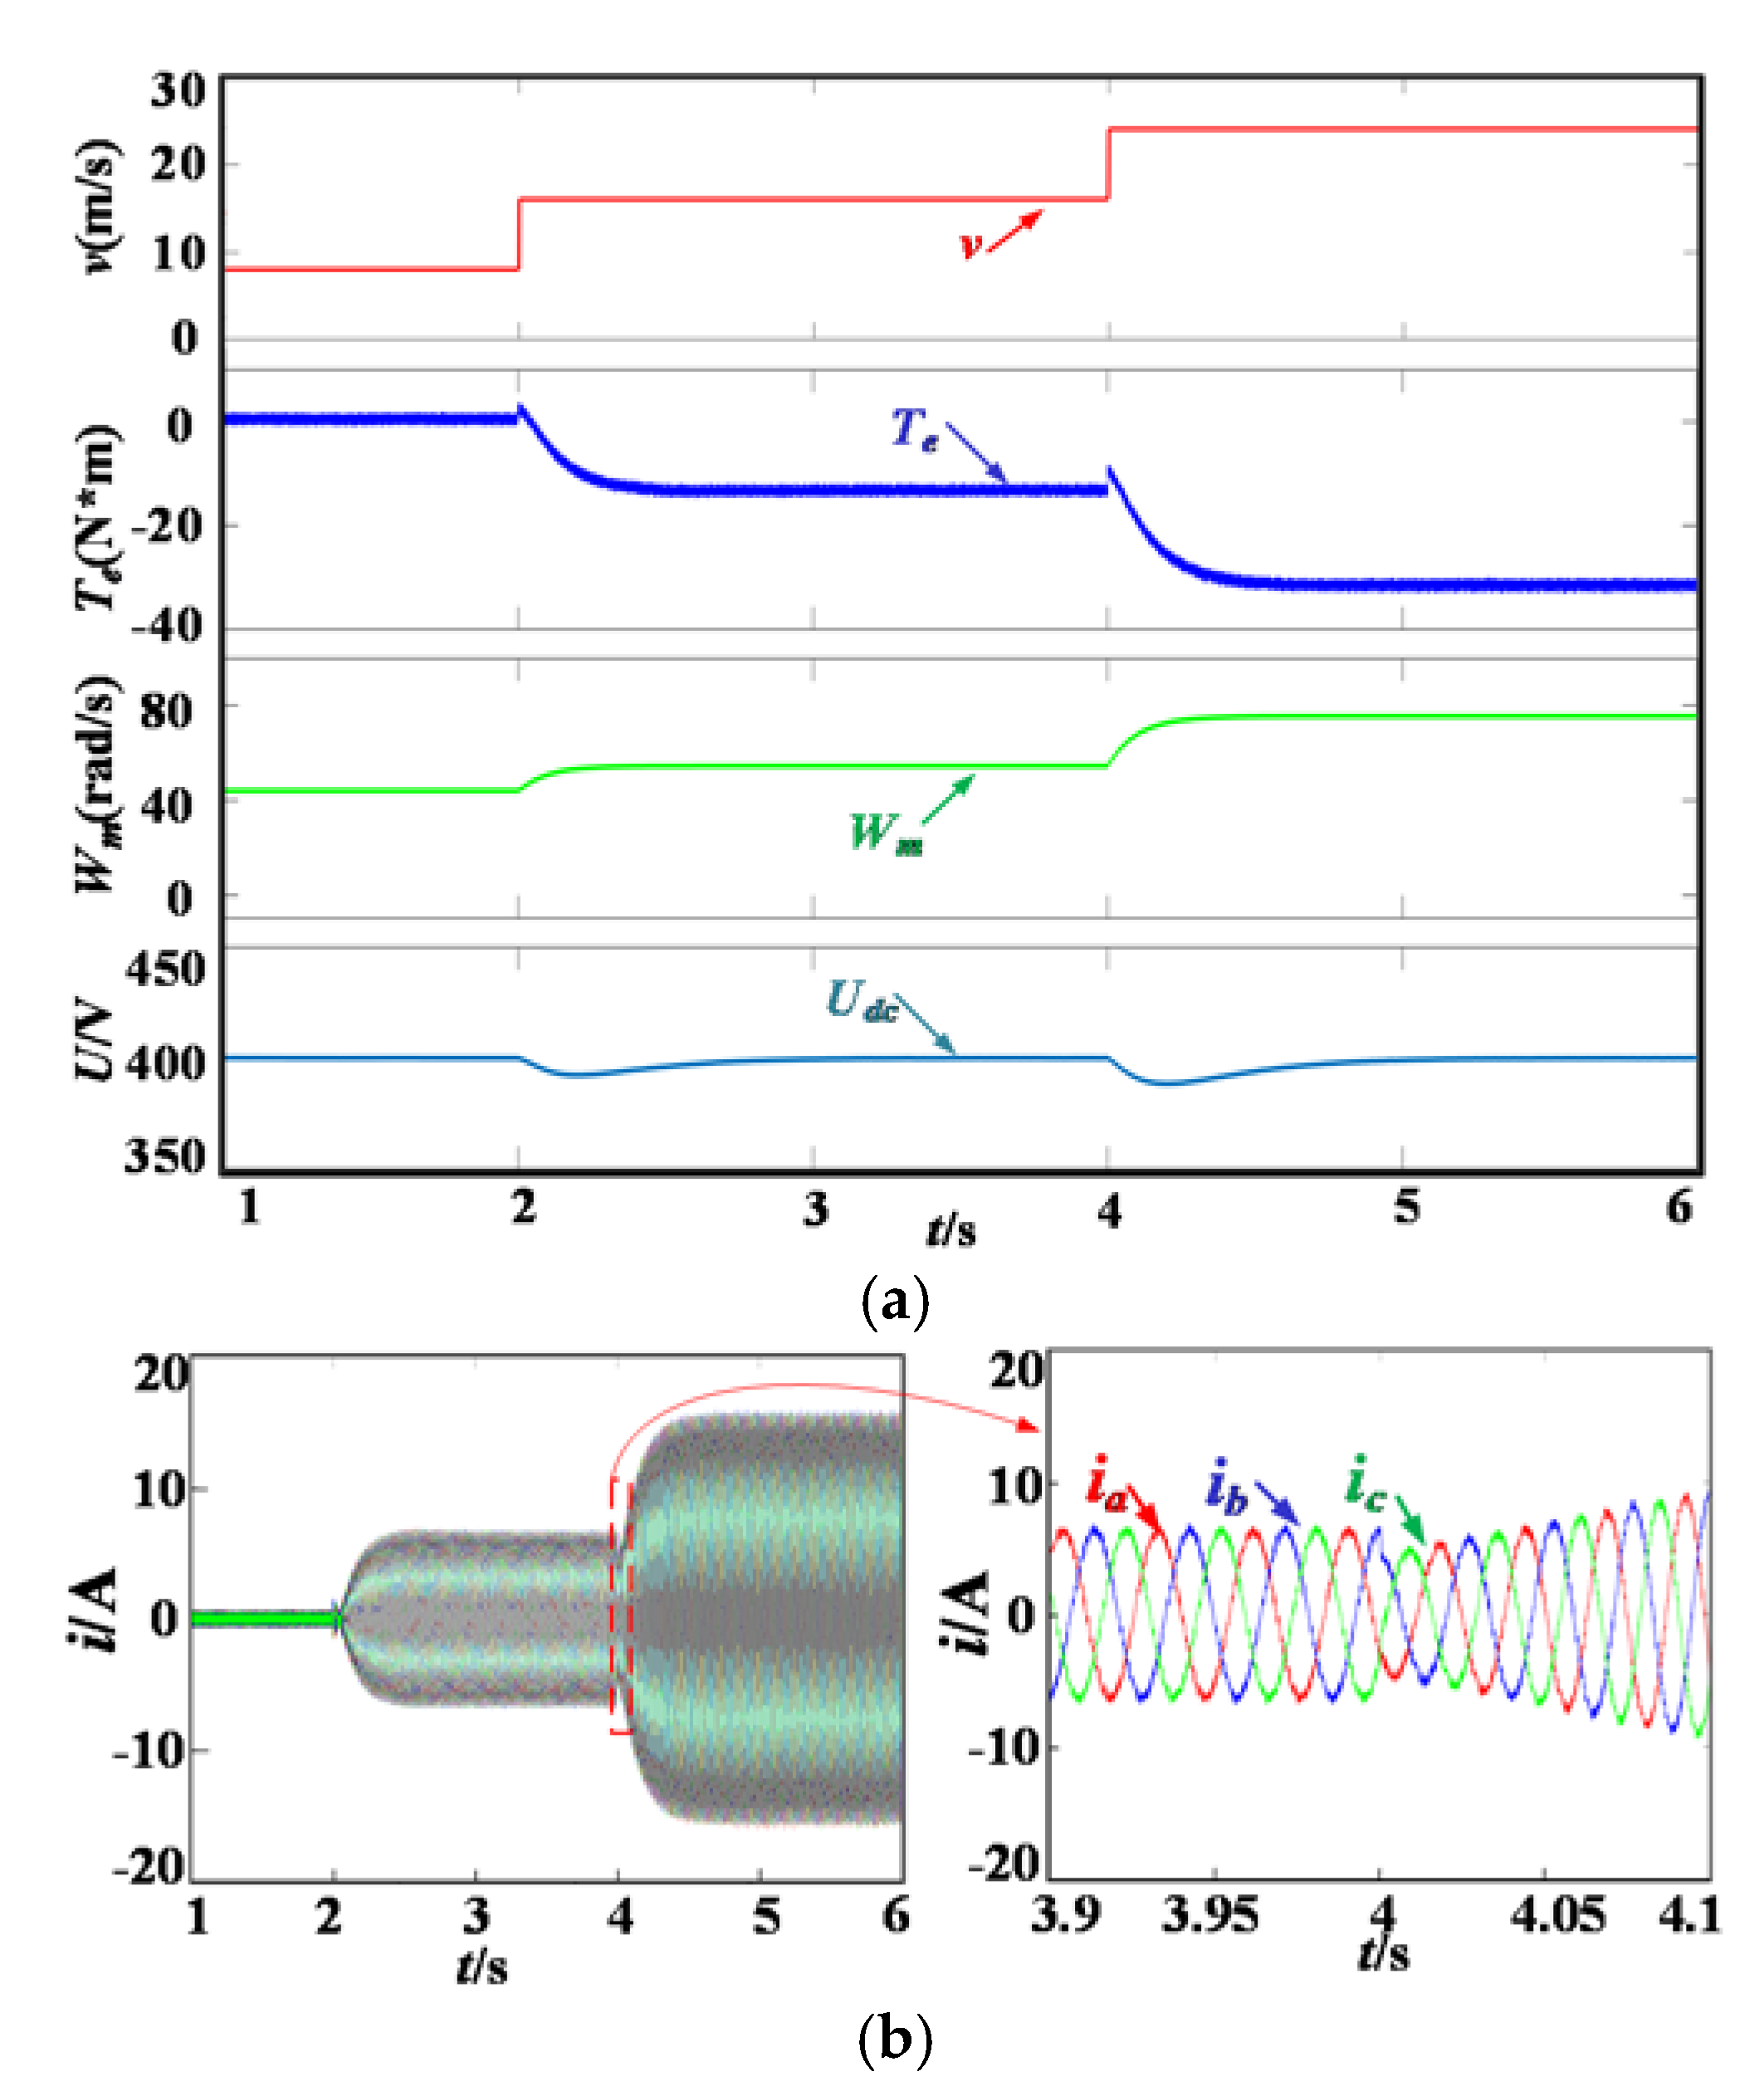
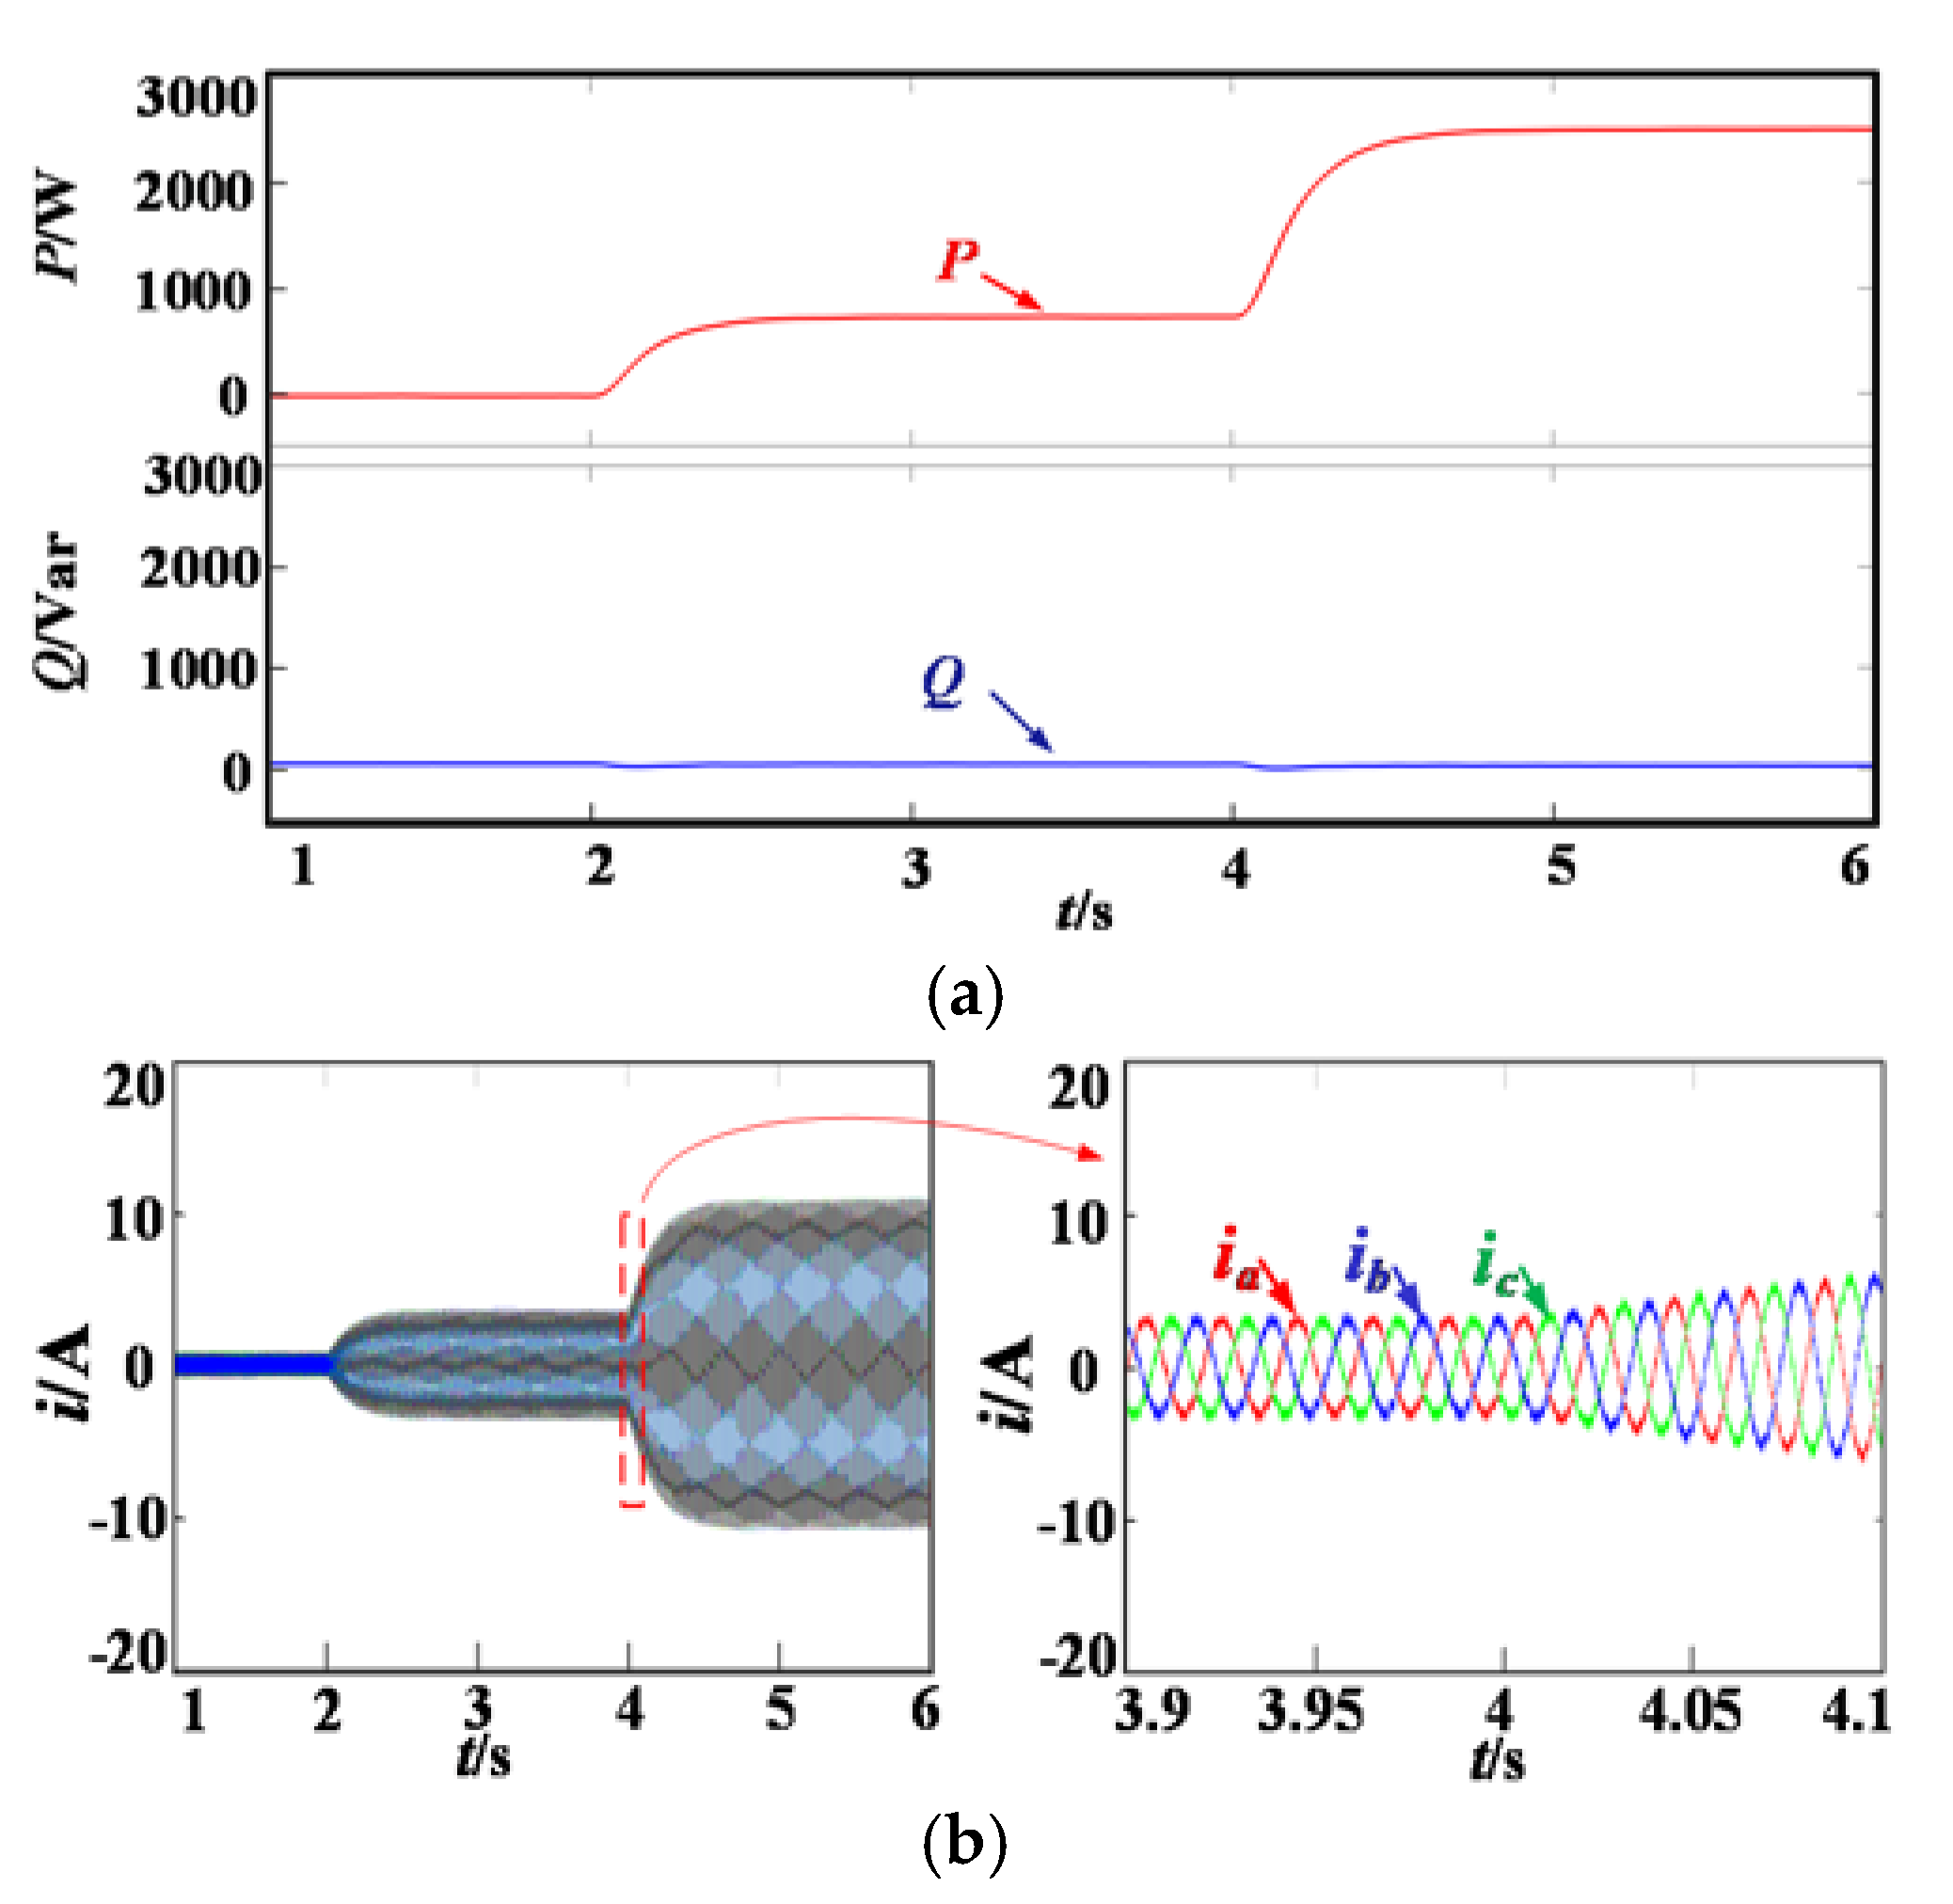
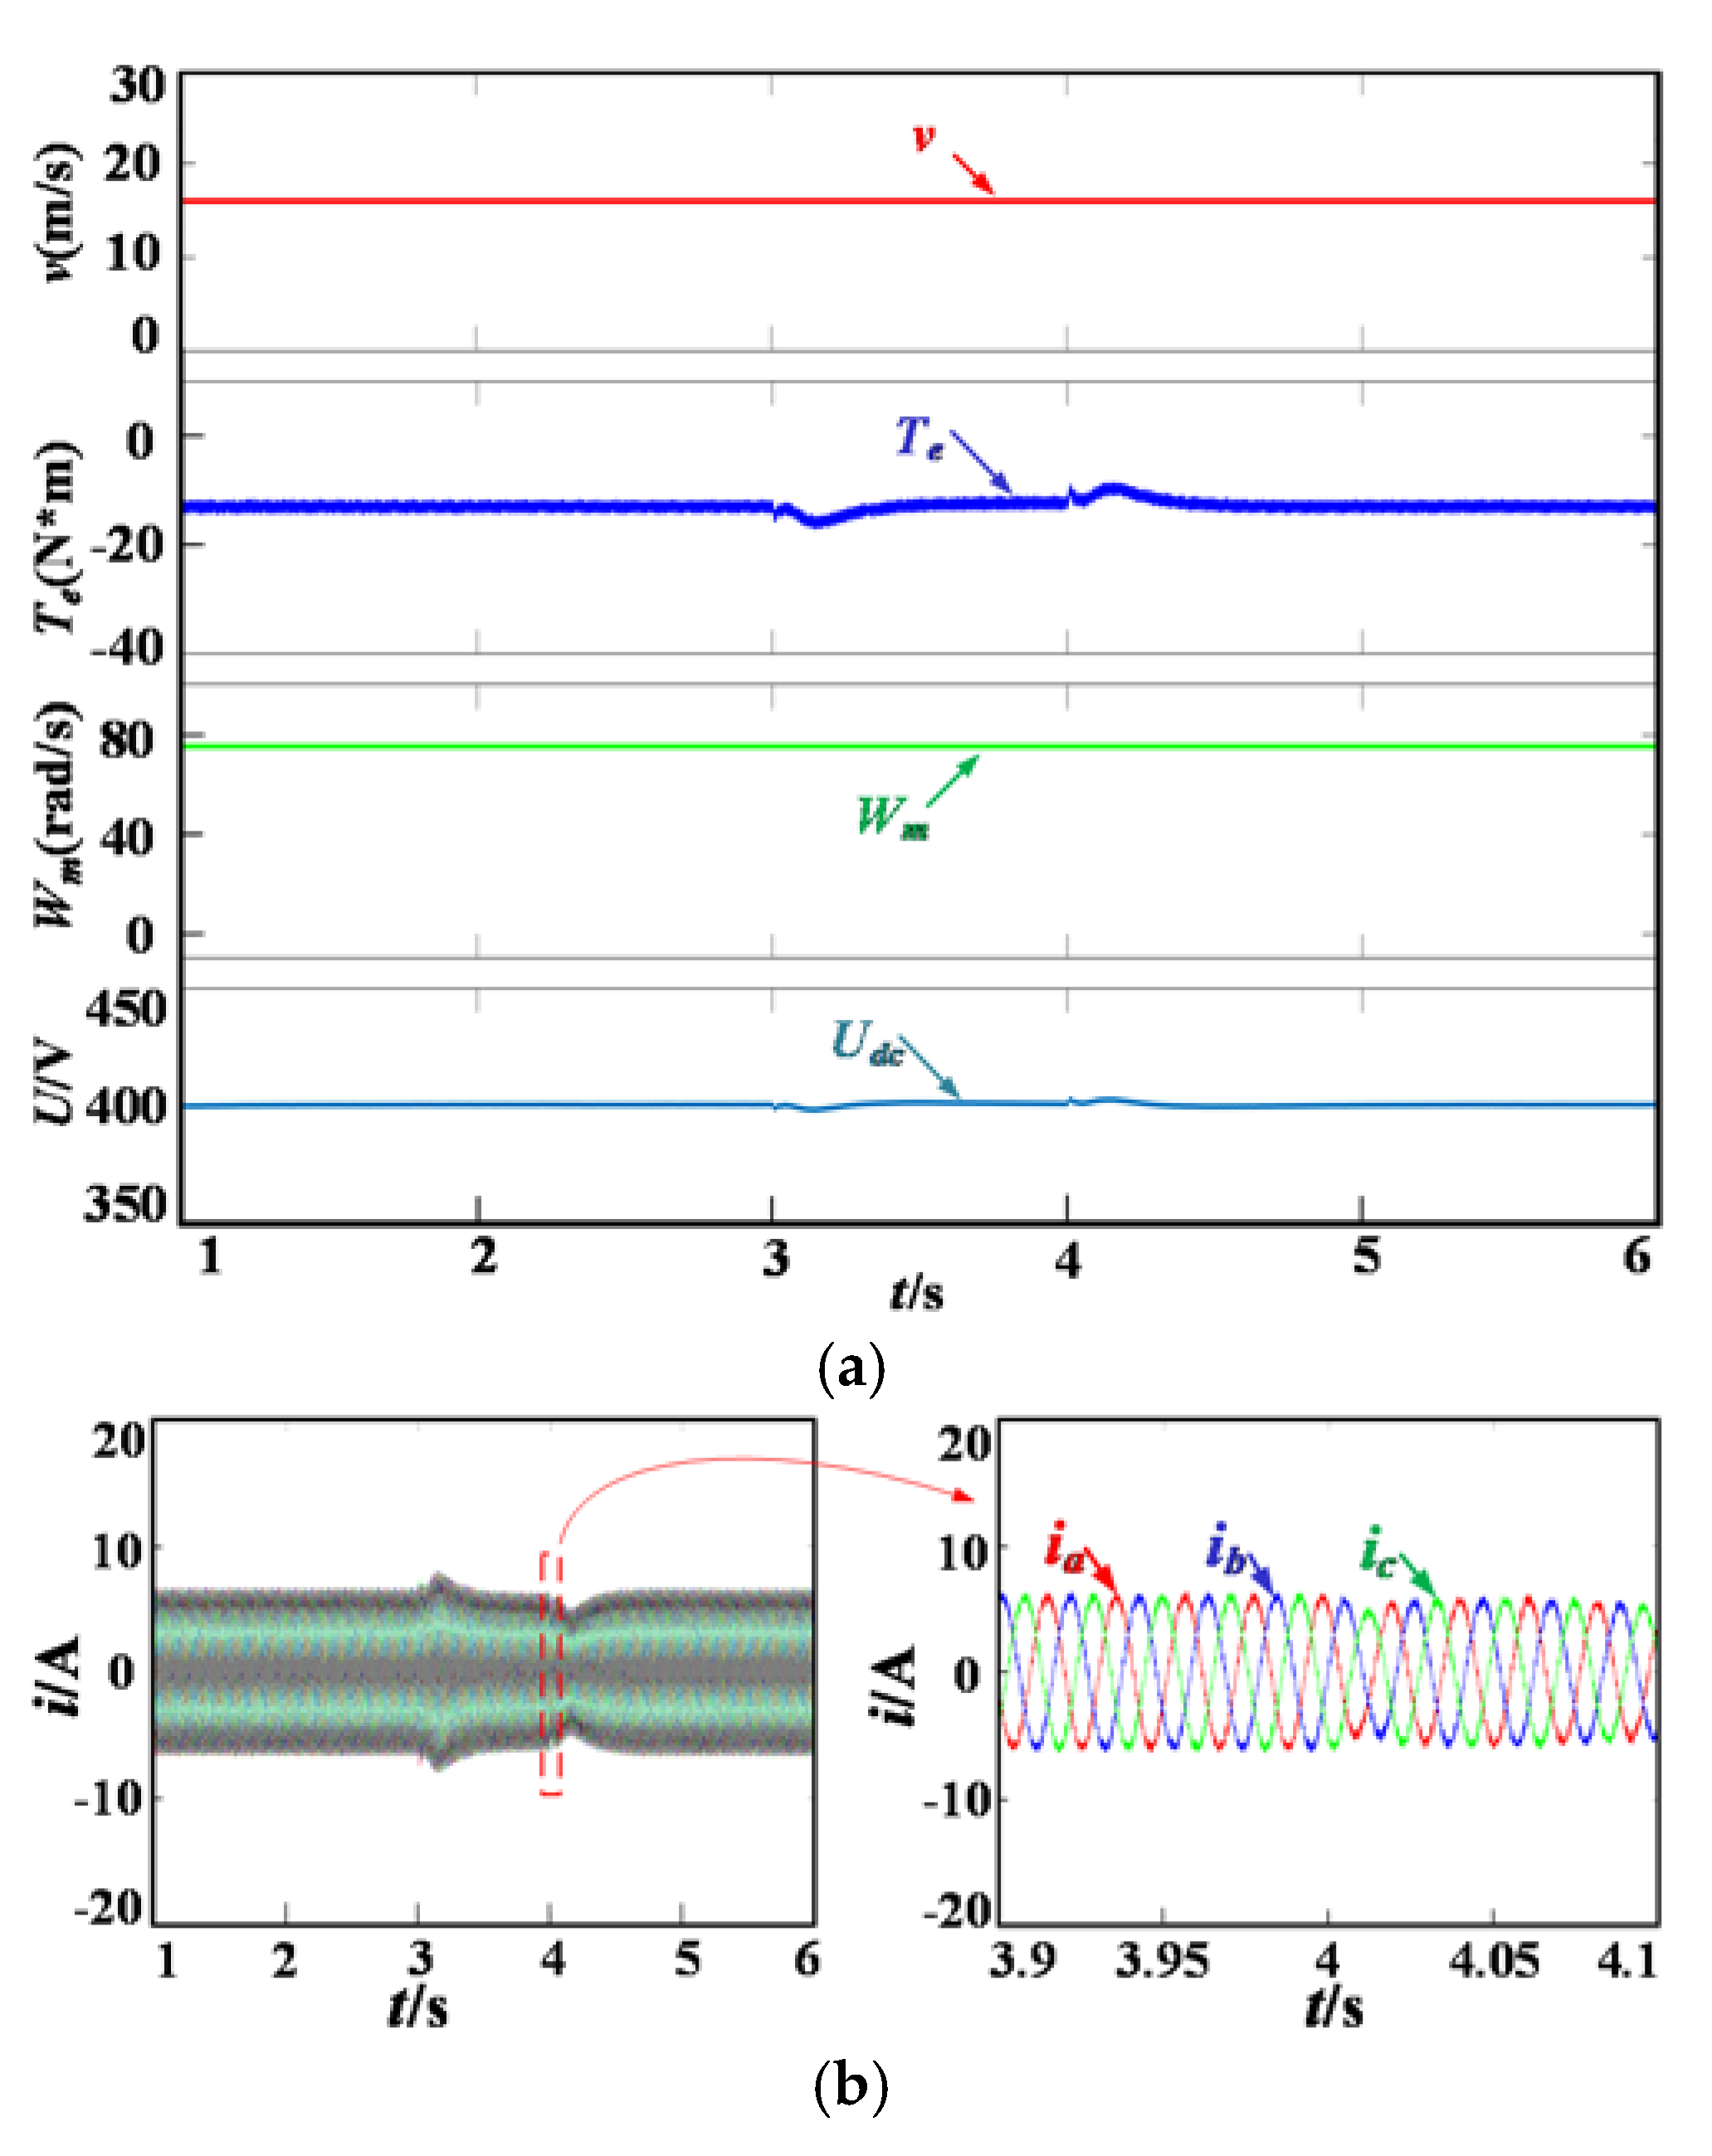
4.1. Simulation Waveform of Wind Speed Variations

Figure 6a shows the wind speed, electromagnetic torque of the generator, angular velocity of the wind turbine and DC-link voltage, respectively. Figure 6b shows output three-phase current and current local amplification in the generator-side. The simulation results are carried out under the condition of wind speed variation. When 1 s < t < 2 s, the wind speed is 8 m/s, the electromagnetic torque Te = 0 N × m, the wind turbine angular velocity Wm = 42 rad/s and the DC-link voltage Udc = 400 V. The generator outputs three-phase current is 1 A. When 2 s < t < 4 s, the wind speed is 16 m/s, Te = −13 N × m, Wm = 54 rad/s, DC-link voltage is 400 V, and the three-phase current increases to 7 A. When 4 s < t < 6 s, the wind speed is 24 m/s, Te = −26 N × m, Wm = 66 rad/s, the DC-link voltage remains unchanged at 400 V, and the three-phase current increases to 14 A.
Figure 7a shows the simulation waveform of active and reactive power on the grid-side. Figure 7b shows the output of the three-phase current and local amplification current of the inverter. The active power and three-phase current increases with changes in wind speed. When a 1–2 s wind speed is 42 m/s, the active power P is 0 W and the three-phase current is 1 A. When a 2–4 s the wind speed is increased to 54 m/s, P is increased to 800 W, and the current is increased to 4 A. When a 4–6 s the wind speed increases to 66 m/s, P increases to 2200 W and the current also rise to 11 A. The reactive power remains constant at 0 var. The simulation result shows that the wind speed changes, the OVLC and MPC control keep the DC-link voltage stable, and the active power can follow with the wind speed changes.

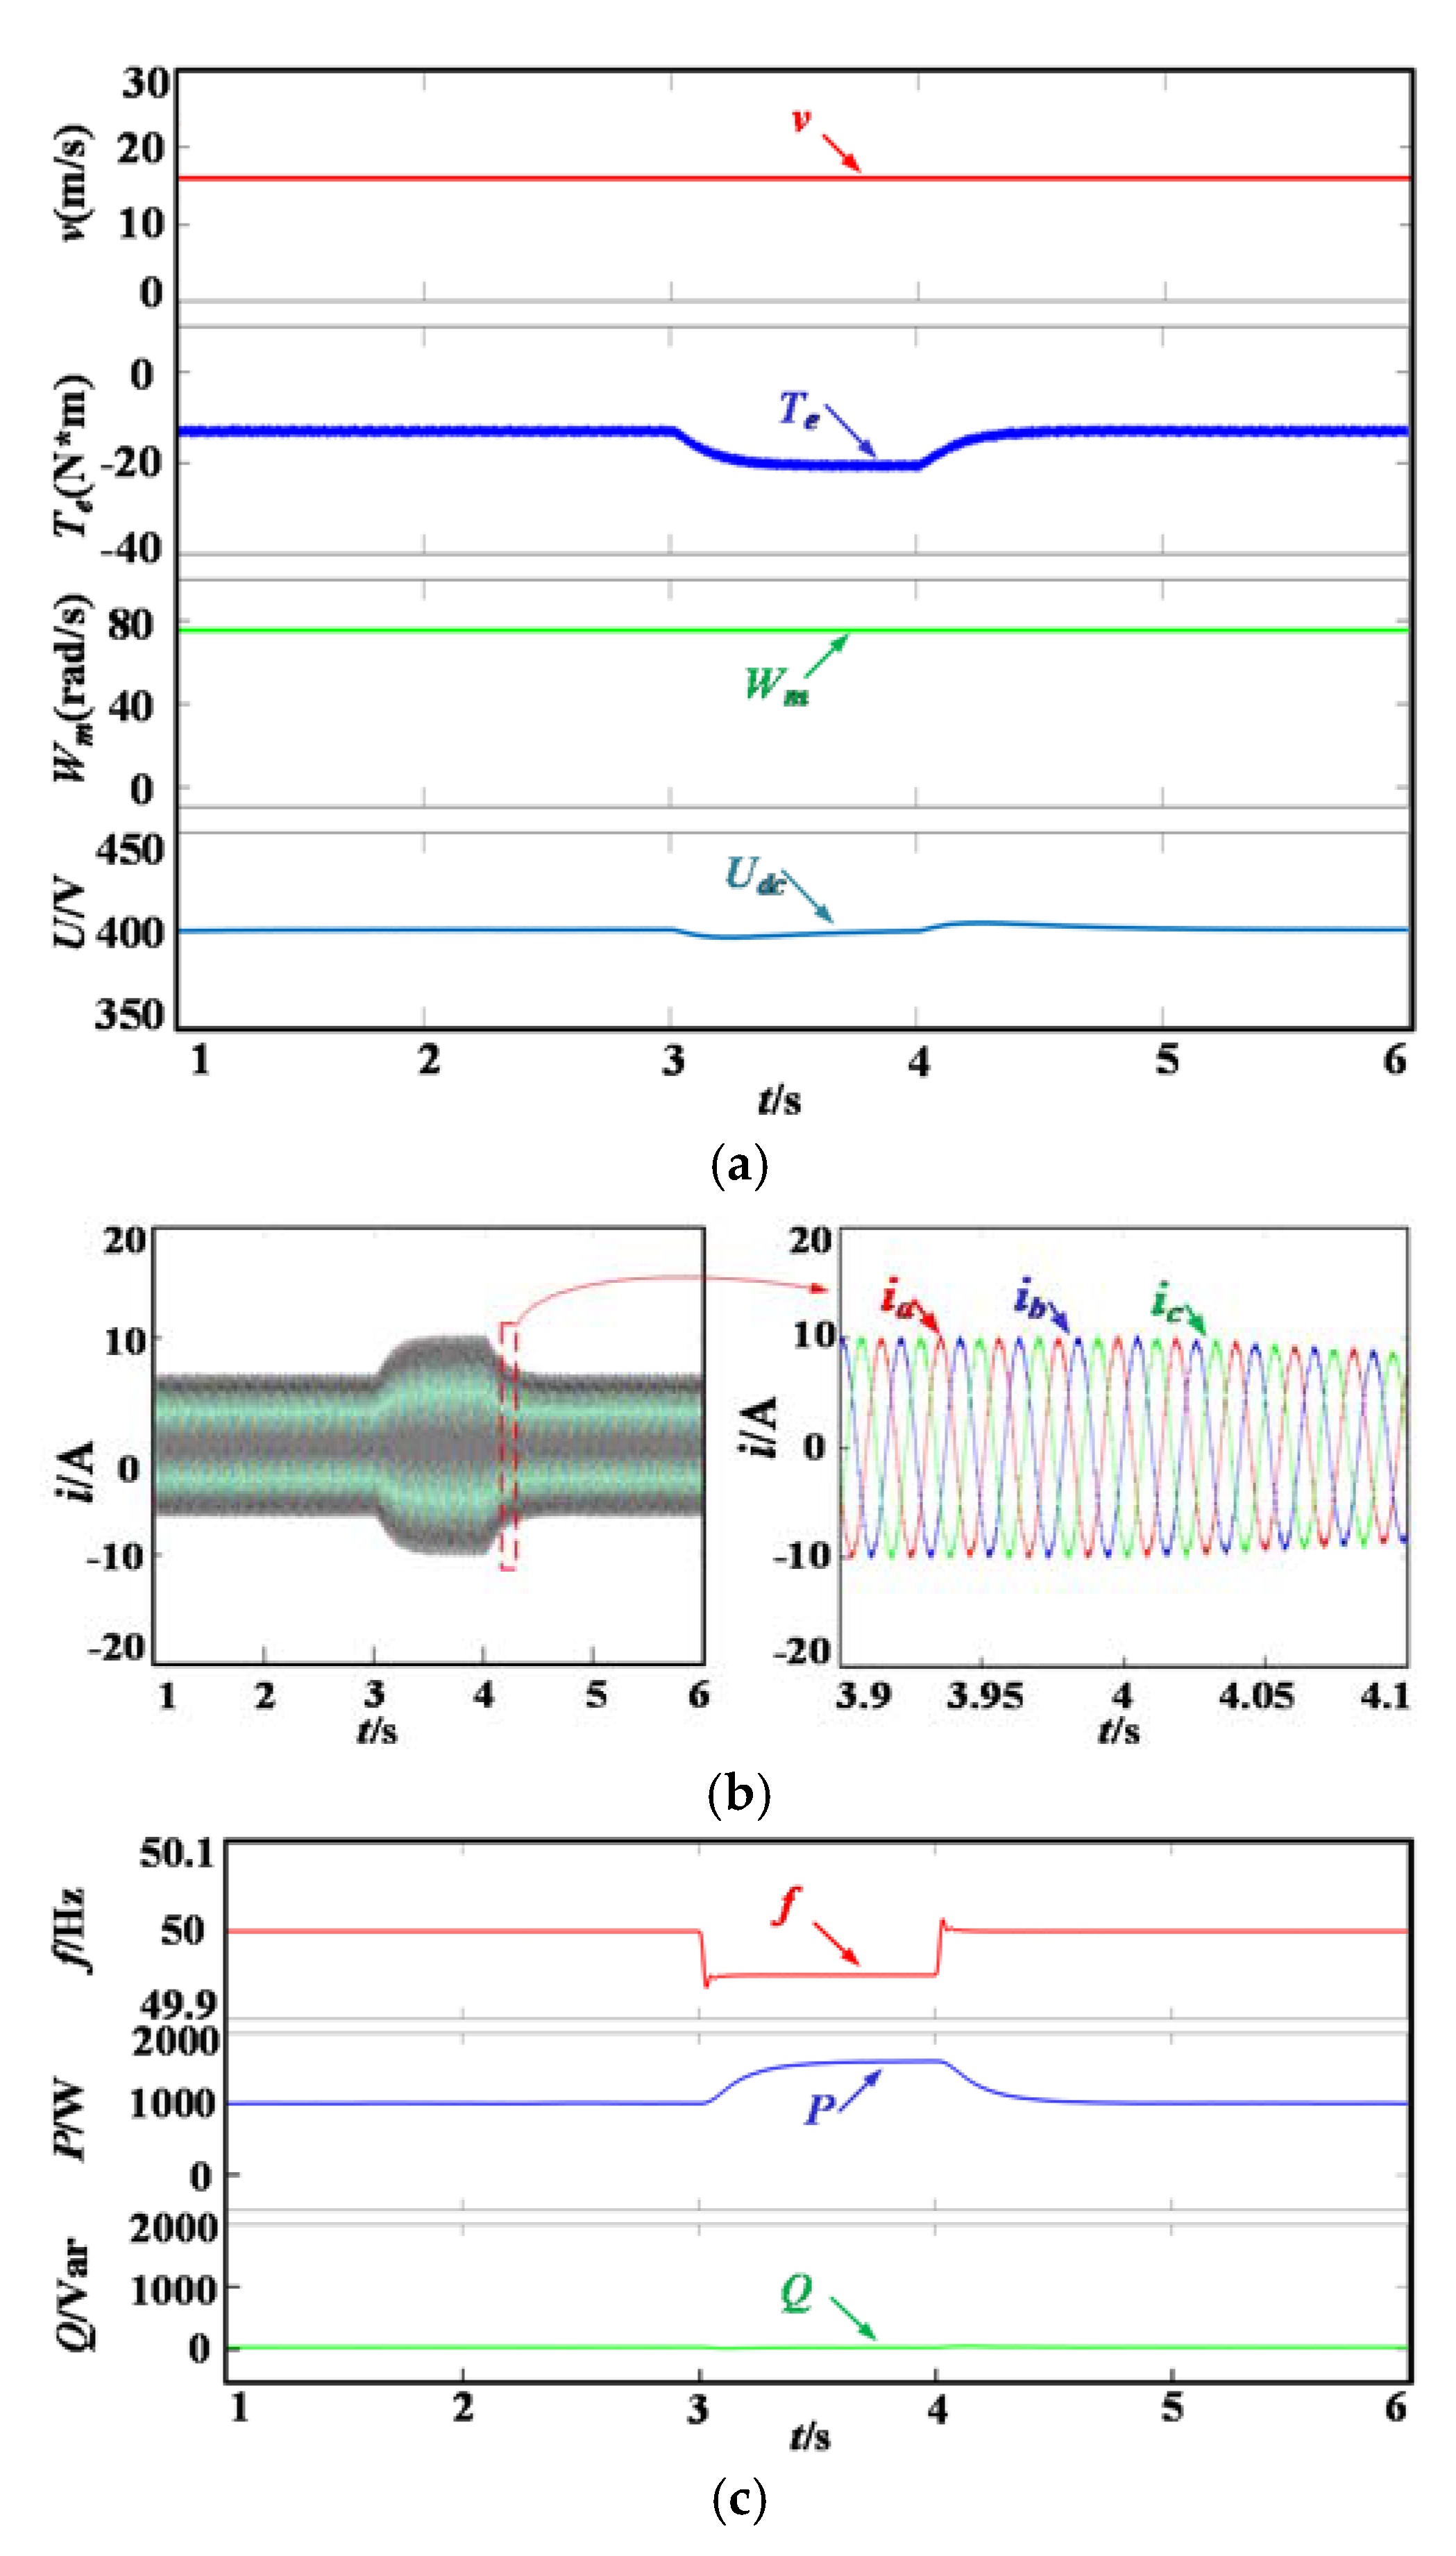
4.2. Simulation Results of Frequency Variation

When the wind speed is constant, the grid-side frequency is changing. Figure 8a shows the generator-side wind speed, electromagnetic torque and angular velocity of the wind turbine and the change of DC-link voltage wave shapes. Figure 8b shows the output three-phase current of generator-side and current local magnification. Figure 8c shows power frequency, active power and reactive power waveform in the grid-side. Figure 8d shows the output three-phase current of grid-side and current local magnification. Given the initial value v = 16 m/s, Te = −13 N × m, Wm = 78 rad/s, Udc = 400 V, f = 50 Hz, P = 1000 W, Q = 0 var. In order to verify the influence of grid-side frequency changes on DC-link voltage and active power, f was set to decrease to 0.05 Hz at t = 3 s and return to normal at t = 4 s. The grid-side frequency fluctuation has no effect on the torque, turbine speed and DC-link voltage in the generator-side. The reactive power is kept at 0 var and active power rises from 1000 W to 1500 W in 3 s and falls from 1500 W to 1000 W in 4 s. The grid-side current rises from 5 A to 7 A in 3 s and drops from 7 A to 5 A in 4 s. Simulation results show that model predictive virtual synchronous control adjusts active power–frequency variations automatically, then the power grid self-recover when it suffers disturbance and keep DC-link voltage stable.

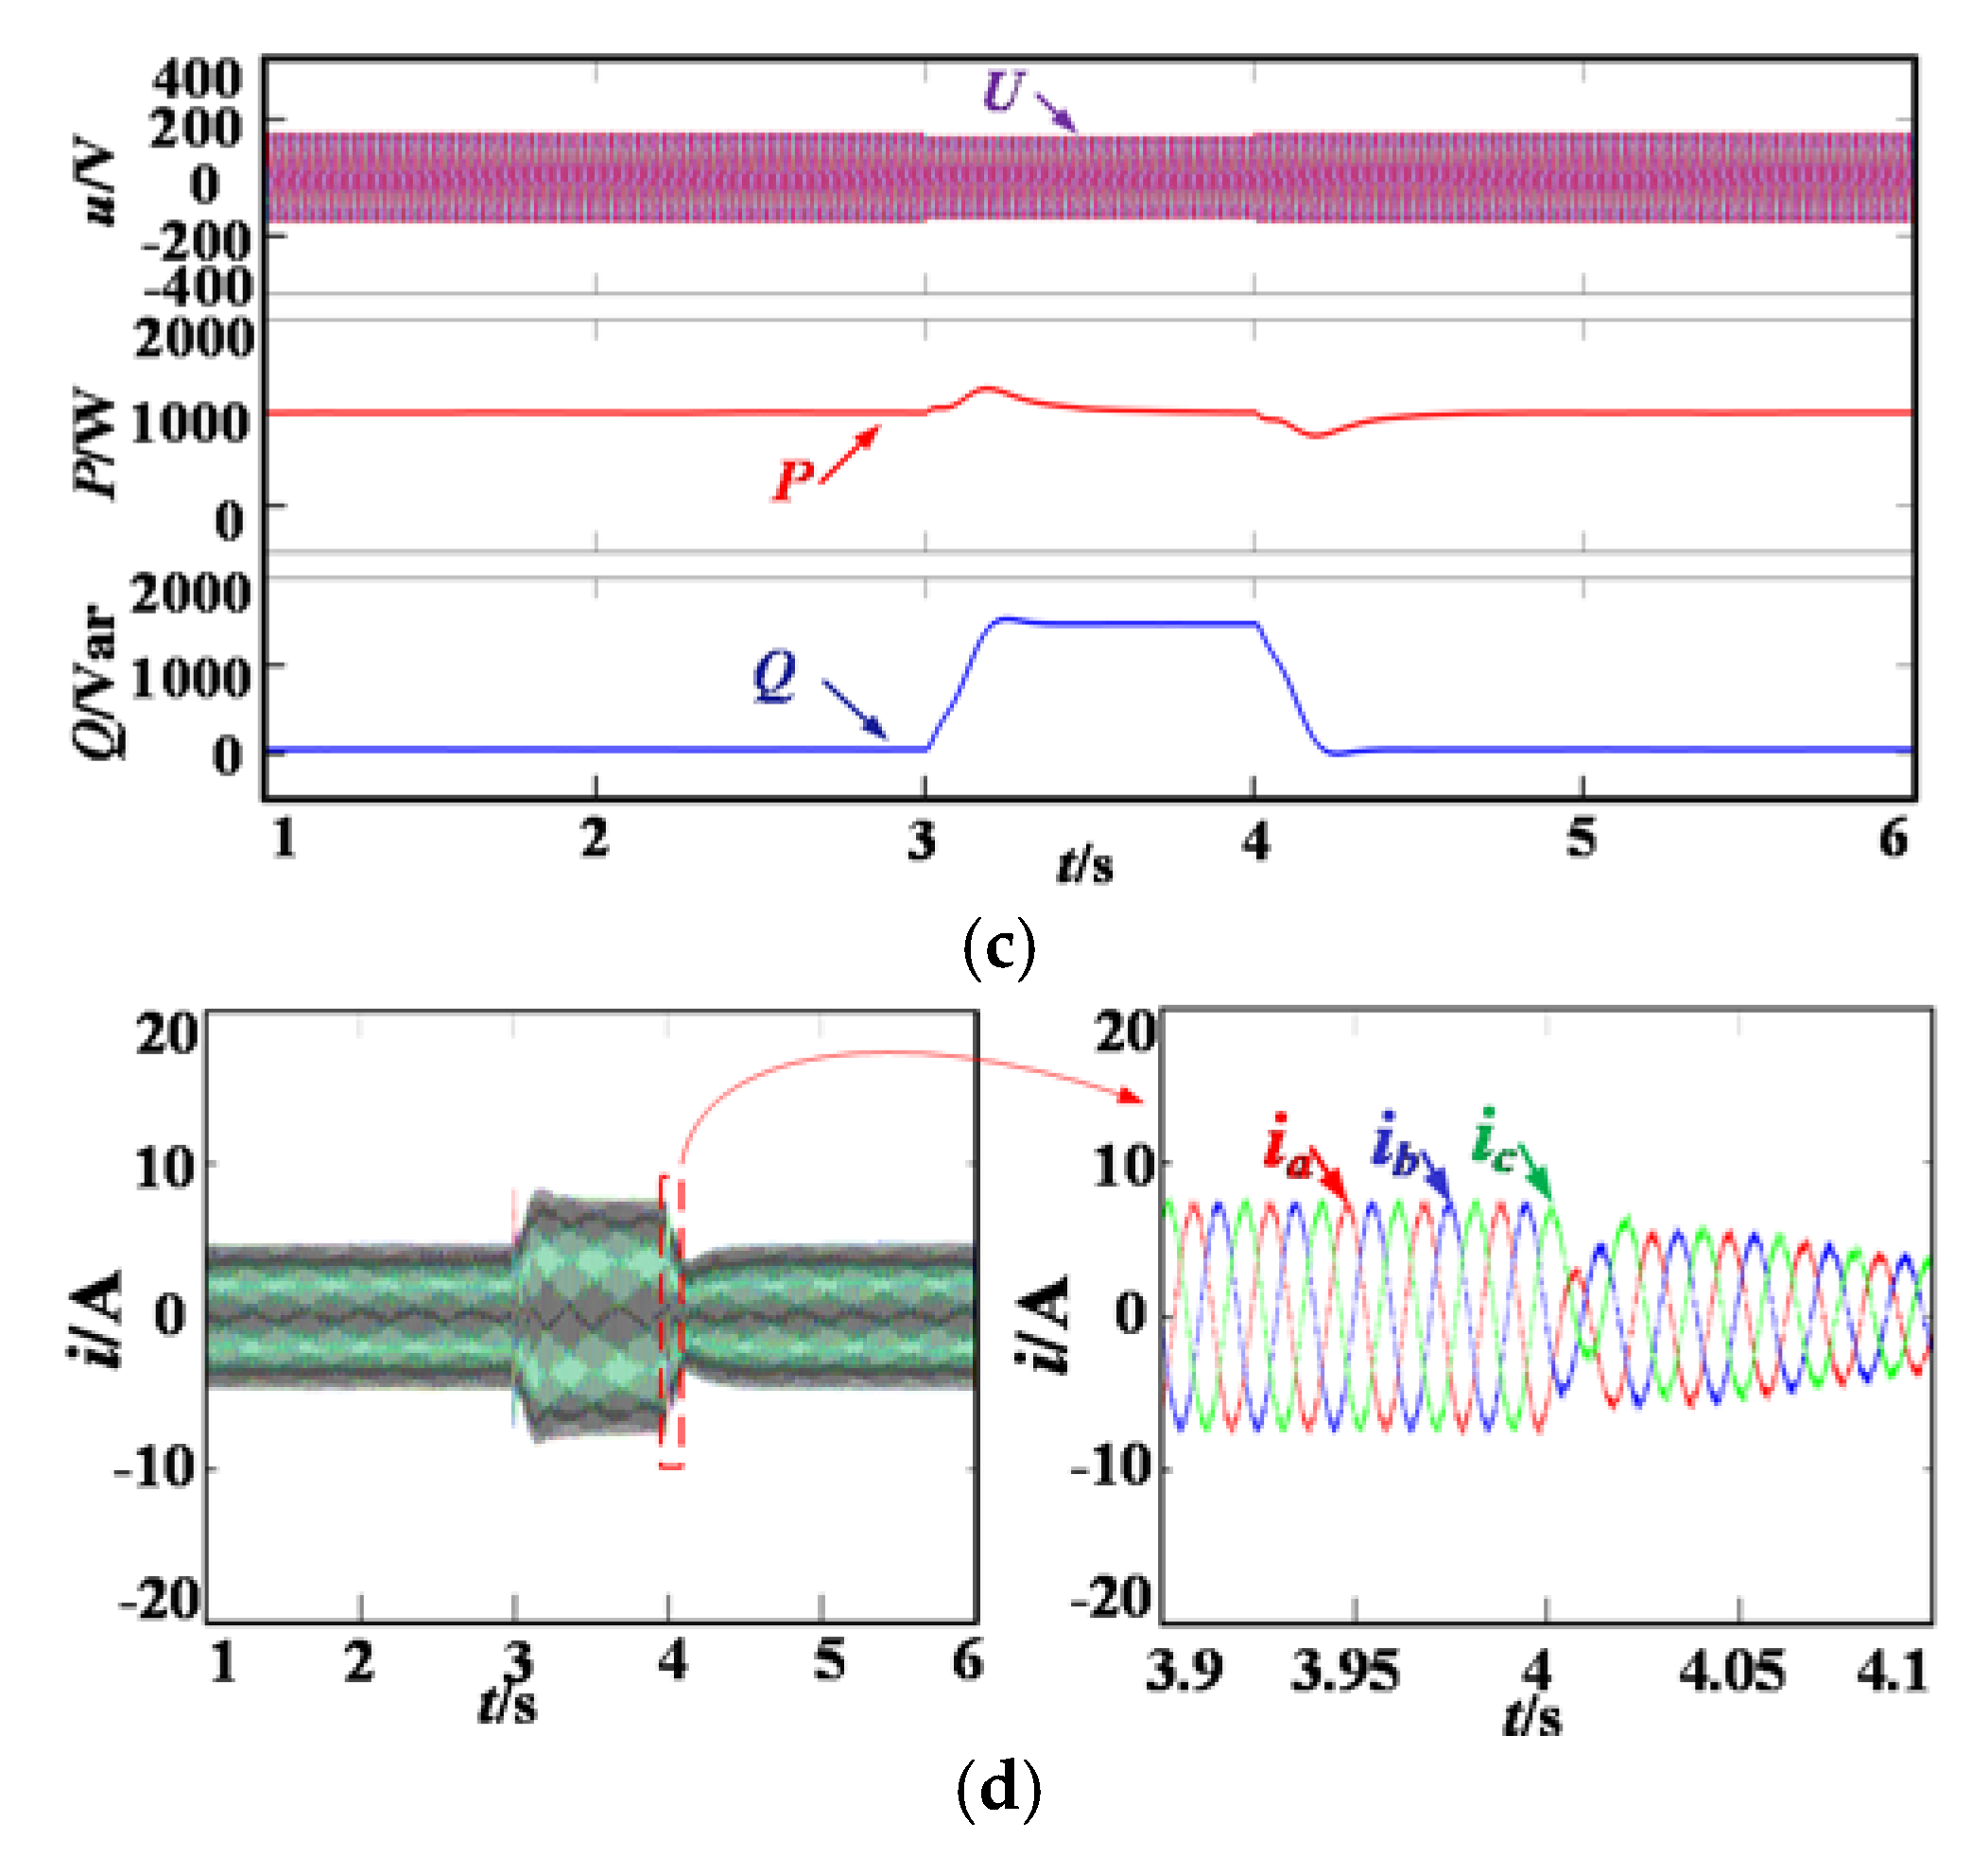
4.3. Simulation Waveform of Voltage Variation

When the wind speed is constant, the grid-side voltage is changing. Figure 9a shows wind speed, torque, turbine speed and DC-link voltage simulation waveform. Figure 9b is the output three-phase current in the generator-side and current local magnification simulation waveform. Figure 9c is the grid-side voltage, active and reactive power simulation waveform. Figure 9d shows the output three-phase current in the grid-side and current local magnification simulation waveform. Given the initial value v = 16 m/s, Te = −13 N × m, Wm = 78 rad/s, Udc = 400 V, U = 190 V, P = 1000 W, Q = 0 var. In order to verify the influence of grid-side voltage changes on DC-link voltage and reactive power. Set U reduces 15 V at t = 3 s and return to normal at t = 4 s. The grid-side voltage fluctuation has no effect on the torque, turbine speed and DC-link voltage in the generator-side. The active power is kept at 1000 W and reactive power rises from 0 var to 1500 var in 3 s and falls from 1500 var to 0 var in 4 s. The grid-side current rises from 5 A to 7 A in 3 s and drops from 7 A to 5 A in 4 s. Simulation results show that model predictive virtual synchronous control adjusts reactive power–voltage variations automatically, then the power grid self-recovers when it suffers disturbance and keeps the DC-link voltage stable.

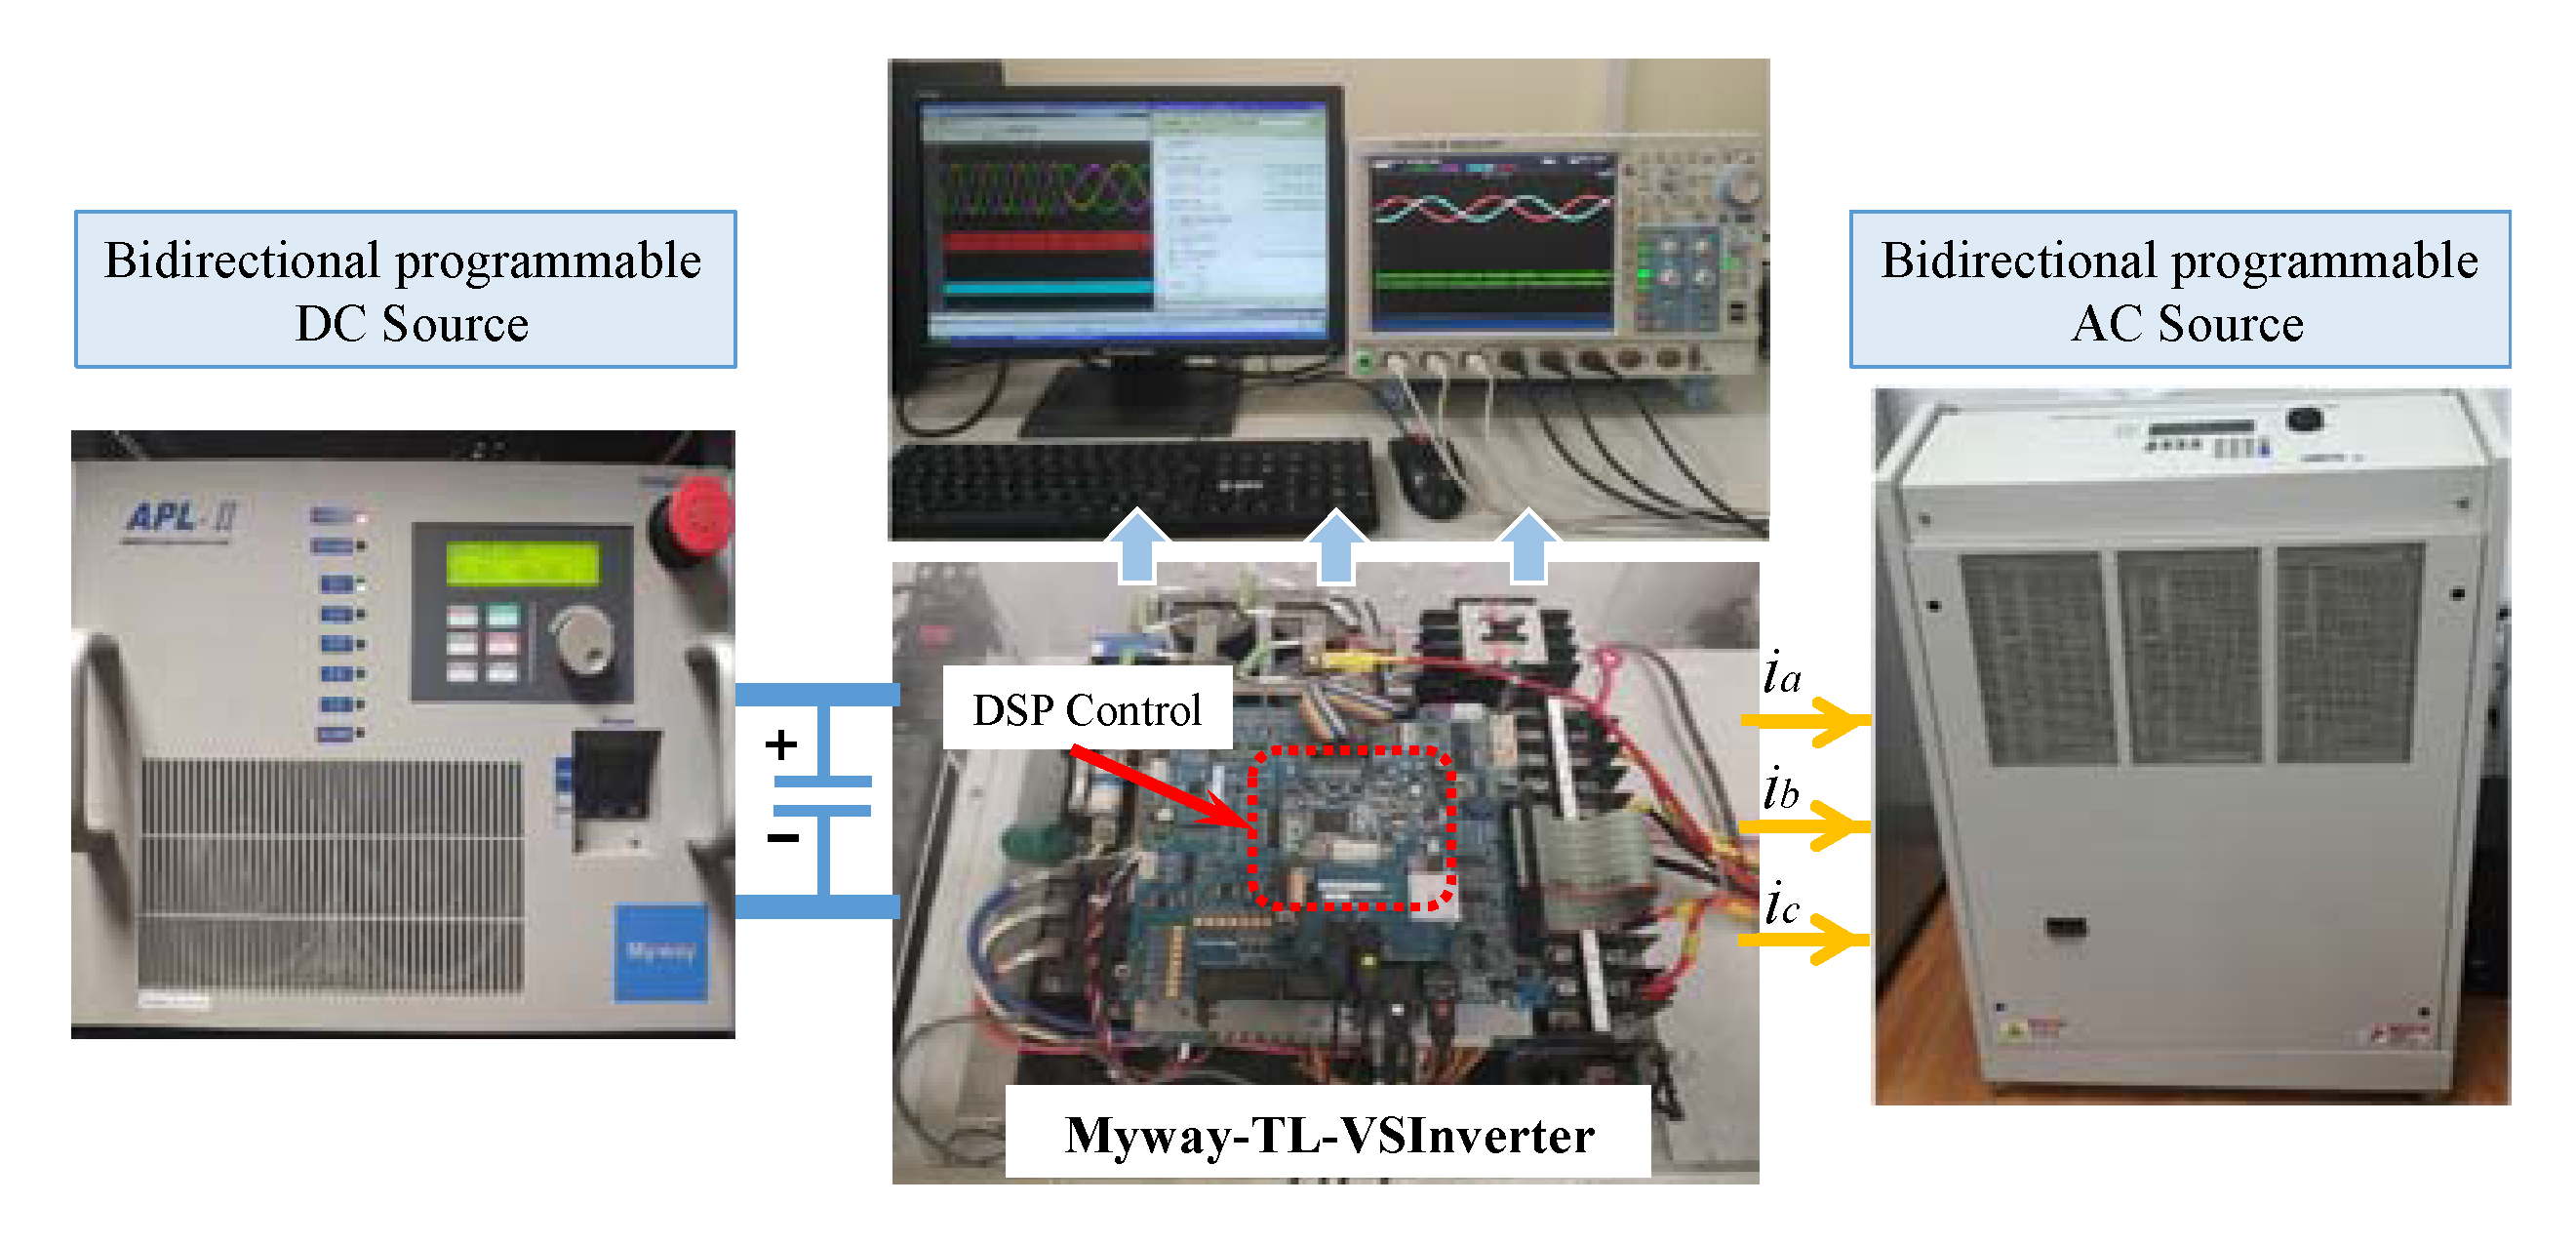
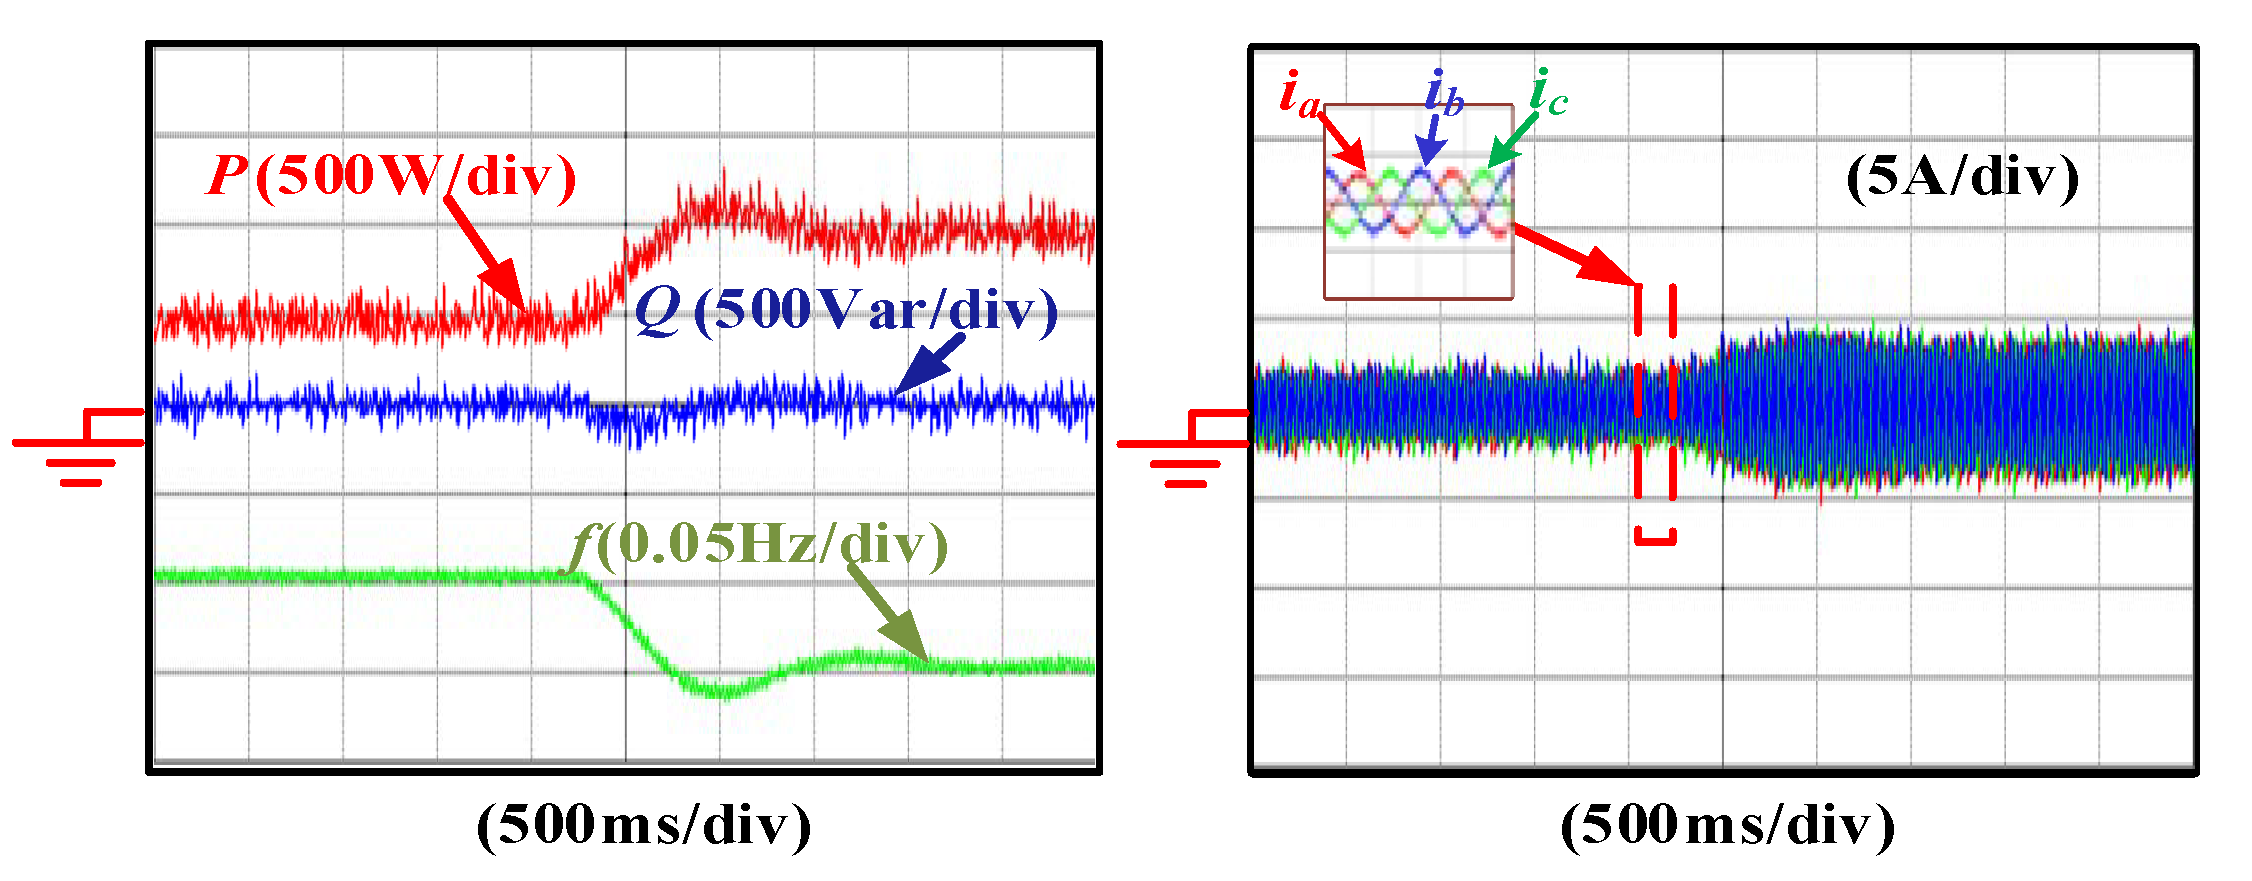
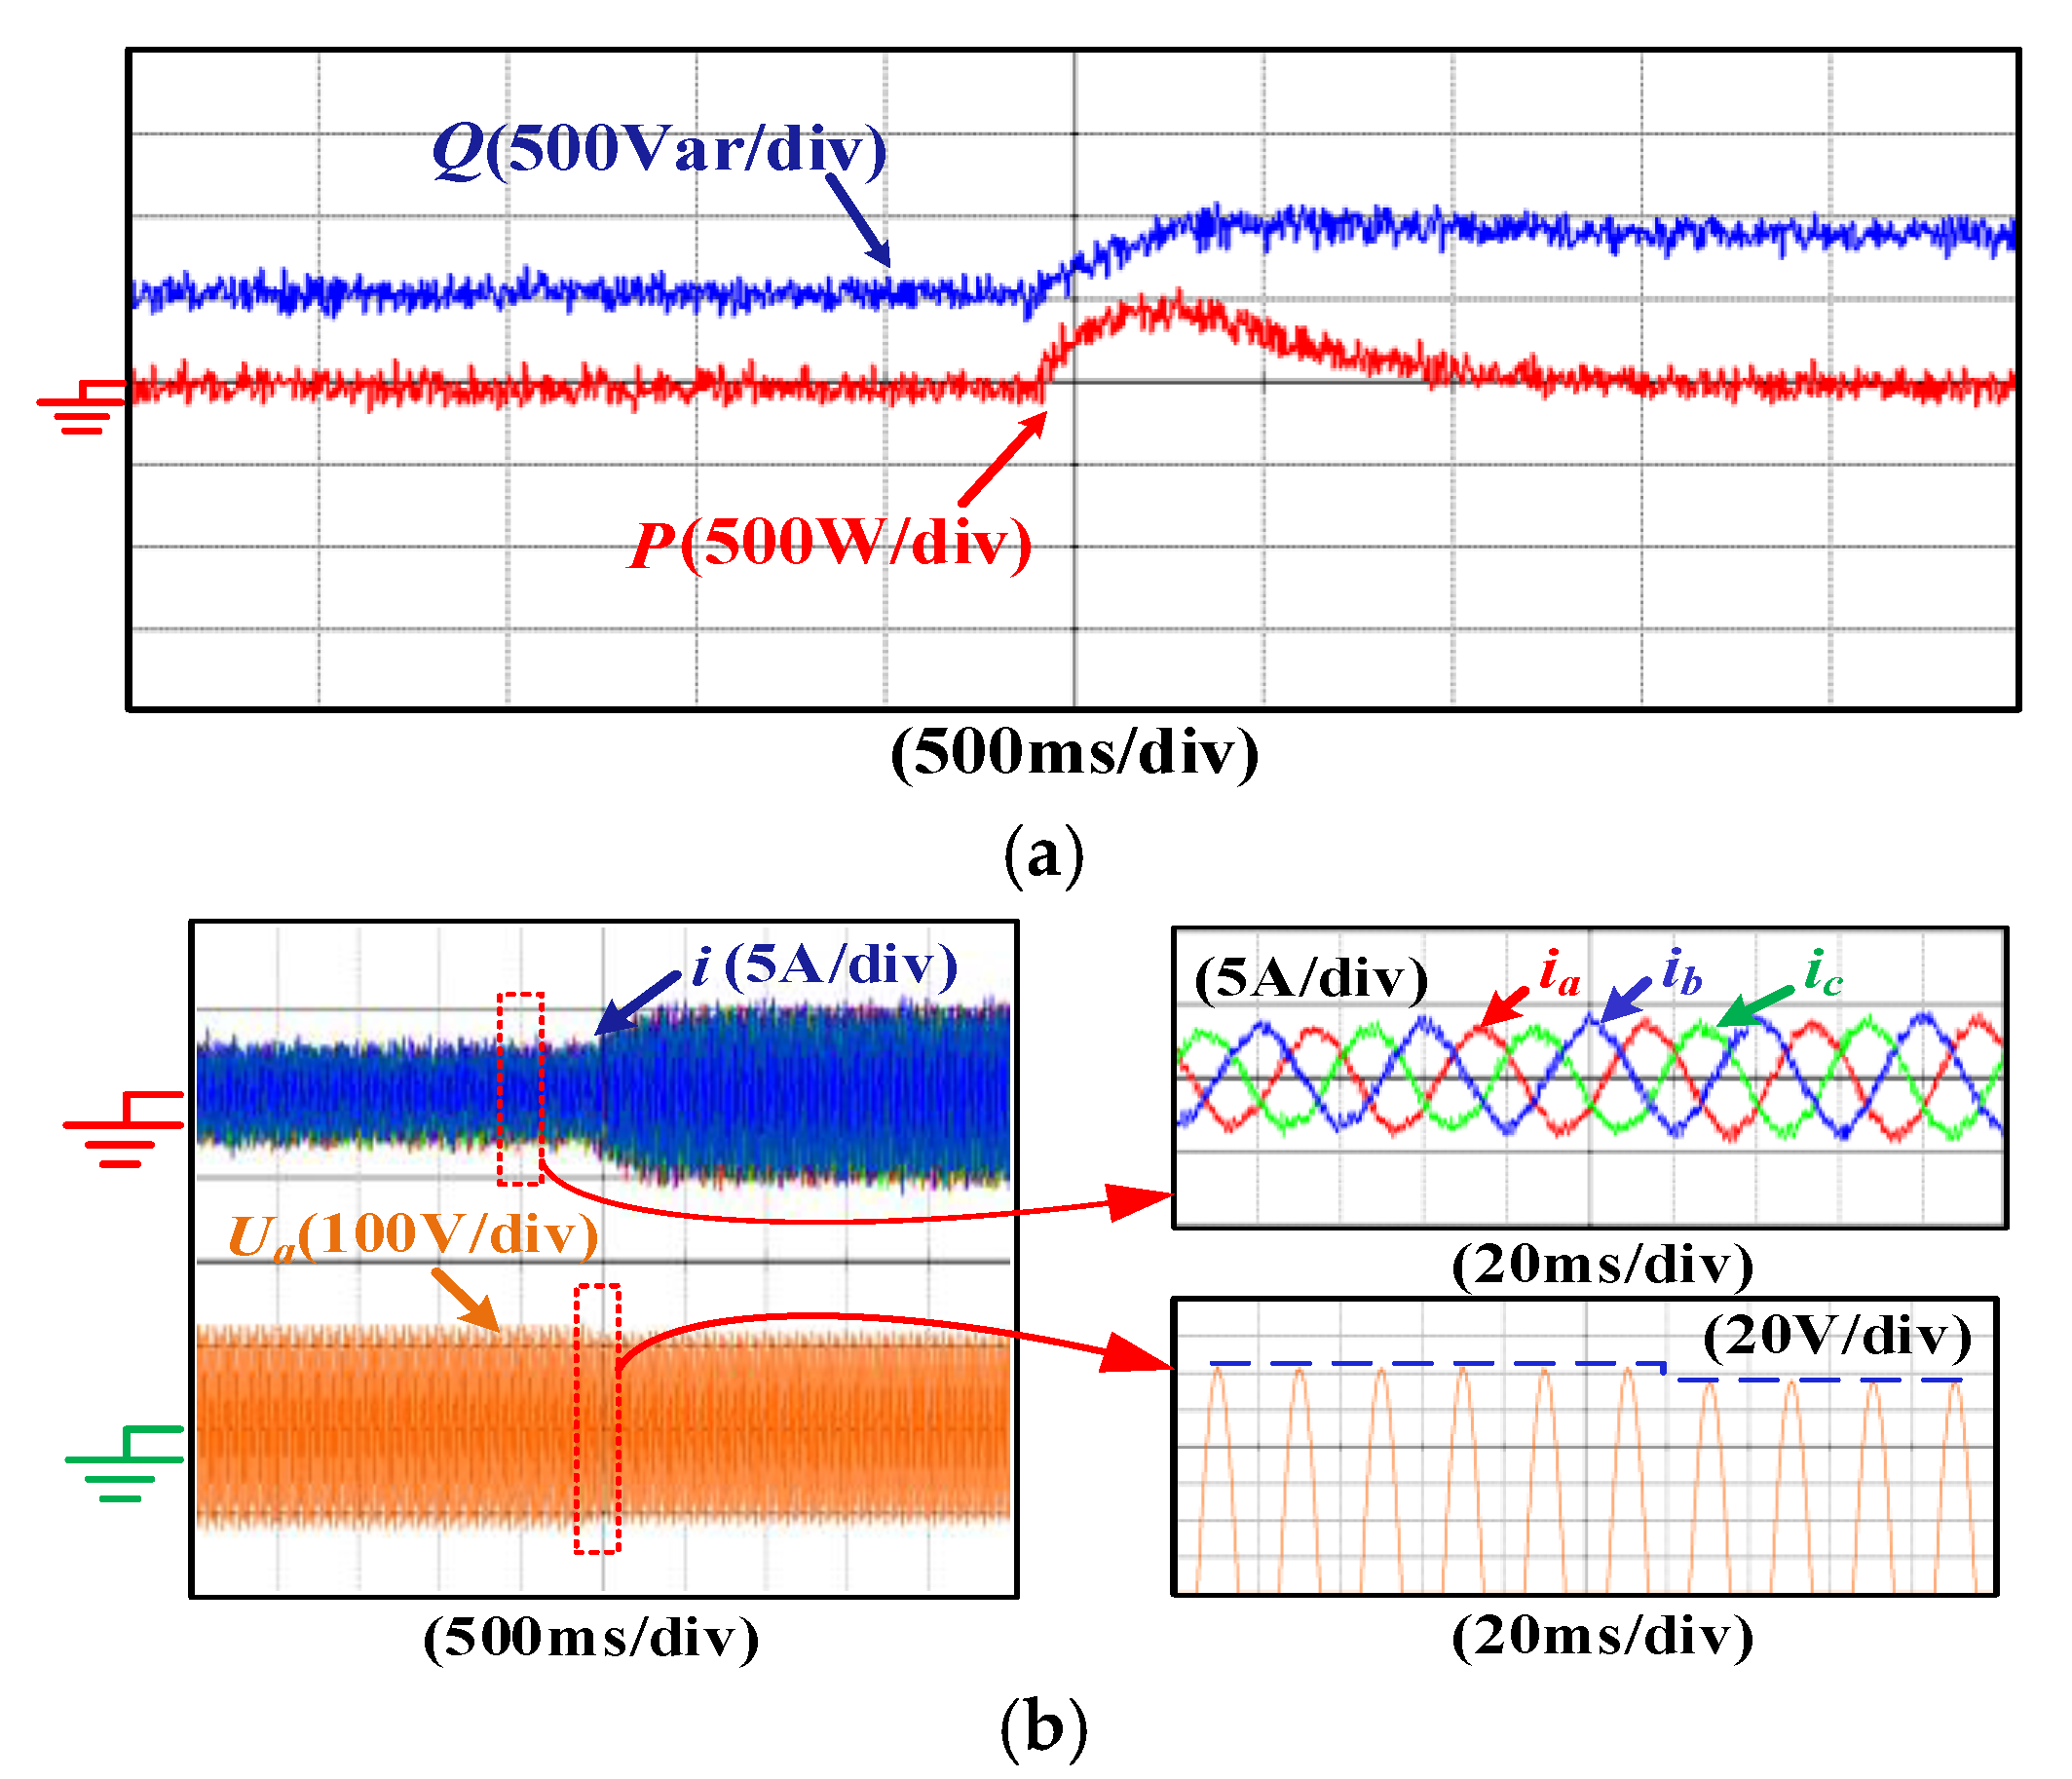
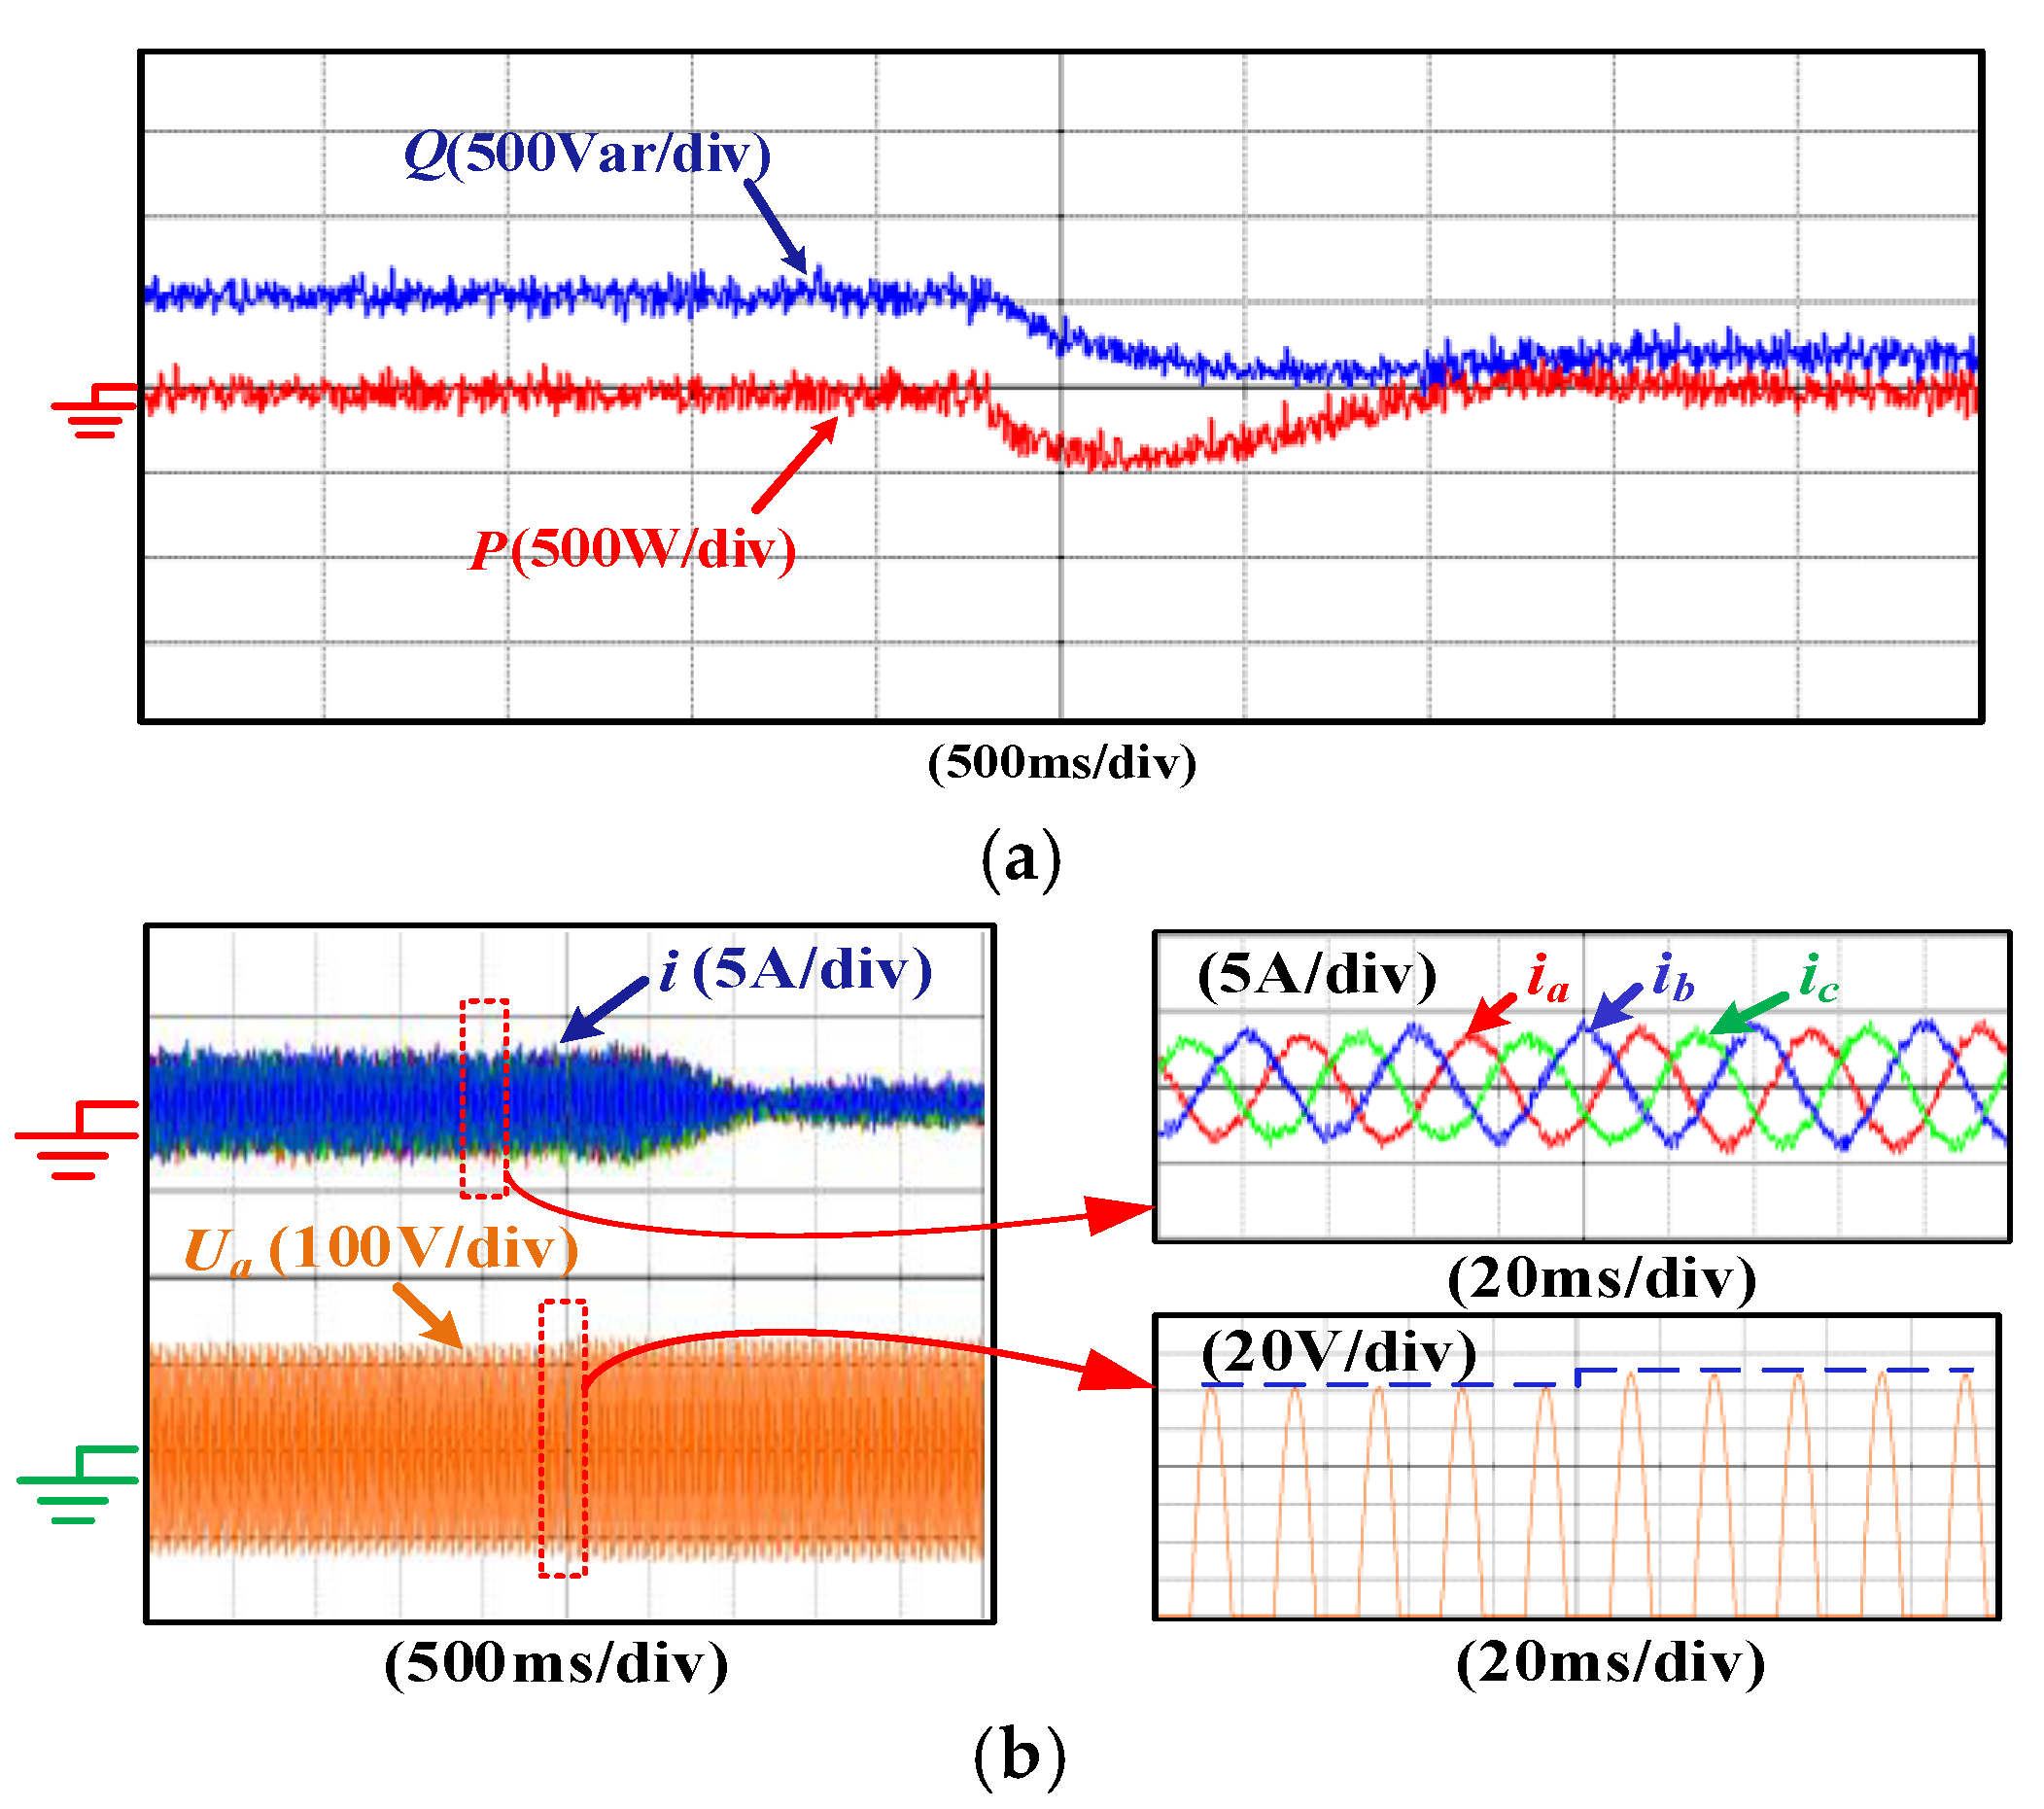
5. Grid Side Experimental Verification

In order to further verify the grid side effectiveness of the proposed strategy, an experimental setup based on PE-PRO was built as shown in Figure 10. The control system was implemented by TI TMS320F28335 and IGBT 7MBP50RJ120. The test instrument was composed of YOKOGAWA DLM4000 series mixed-signal oscilloscope, FLUKE 435B power quality analyzer and APL-II DC power supply. The experimental parameters are shown in Table 1.
The experimental waveforms in Figure 11 and Figure 12 reflect the influence of frequency changes in the power grid. In Figure 11, the active power is 500 W when the frequency is 50 Hz. When t = 2.5 s, the frequency drops from 50 Hz to 49.95 Hz. With a change of 0.05 Hz, active power rises from 500 W to 1000 W and stabilized rapidly after 1 s. The reactive power keeps at 0 var. Moreover, the three-phase current increases from 3 A to 5 A. Figure 11 shows that the frequency increases from 50 Hz to 50.05 Hz when t = 2.5 s, the active power decreases from 500 W to 0 W in response to the change in frequency. The reactive power still keeps at 0 var and the three-phase current drops from 3 A to 1 A to keep the grid voltage constant. The above parameters are set to verify the active power frequency modulation. From Figure 11 and Figure 12, the model predictive virtual synchronous control can provide active power support to the grid when the frequency changes.
Figure 13 and Figure 14 testify the reactive power–voltage variations. Figure 13 shows the voltage drop of 5 V, the changing trend of power and current. It is clear that reactive power rises from 500 var to 1000 var and stabilized rapidly after 1 s and the active power keeps at 0 W. At the same time, the three-phase current increases from 3 A to 5 A. Figure 14 shows that the voltage increases from 120 V to 125 V when t =2.5 s, the reactive power decreases from 500 var to 0 var in response to the change in voltage. The active power still keeps at 0 W and the three-phase current drops from 3 A to 1 A in order to keep the active power constant. Figure 13 and Figure 14 successfully testify the effectiveness of the model predictive virtual synchronous control for reactive power voltage regulation.

6. Conclusions

To reduce the PMSG parameter settings and simplify the control structure, this paper proposes MPC instead of inner-current loop control. On the machine side, OVLC and MPC are used to stabilize the DC voltage. OVLC uses PI control to stabilize the outer voltage loop, while MPC controls the inner-current loop stability by predicting and correcting the current at the next moment. On the power grid, model predictive virtual synchronous control is used to provide inertia and damping for the grid. VSG simulates the synchronous generator mathematical model to provide inertia and damping for the power grid, MPC stabilizes grid current with VSG output current as the reference target. Simulation and experimental results show that the proposed control strategy not only reduces parameter setting and optimizes control structure, but also plays an important role in stabilizing DC voltage and providing power support for power grid.

Author Contributions

Conceptualization, Y.S.; investigation, L.G.; methodology, Y.S., Y.Z., Z.D. and L.G.; resources, L.G. and Y.L.; supervision, Z.D.; validation, Y.Z.; writing—original draft, Y.S., Y.Z. and Z.D.; writing—review and editing, L.G. and Z.D. All authors have read and agreed to the published version of the manuscript.

Funding

This work was supported in part by the National Natural Science Foundation of China (no. 51707176), in part by the Key Scientific Research Project o Universities in Henan Province (nos. 18A470020, 20A470011), in part by the Youth Talent Promotion Project of Henan Province (no. 2019HYTP021), in part by the Key Research, Development and Promotion Special Projects (Science and Technology) of Henan Province (no. 202102210103).

Conflicts of Interest

The authors declare no conflict of interest.

References

  1. Vita, G.; Šarkić-Glumac, A.; Hemida, H.; Salvadori, S.; Baniotopoulos, C. On the Wind Energy Resource above High-Rise Buildings. Energies 2020, 13, 3641. [Google Scholar] [CrossRef]
  2. Sarkar, M.R.; Julai, S.; Tong, C.W.; Uddin, M.; Romlie, M.; Shafiullah, G. Hybrid Pitch Angle Controller Approaches for Stable Wind Turbine Power under Variable Wind Speed. Energies 2020, 13, 3622. [Google Scholar] [CrossRef]
  3. Andrychowicz, M. Comparison of the Use of Energy Storages and Energy Curtailment as an Addition to the Allocation of Renewable Energy in the Distribution System in Order to Minimize Development Costs. Energies 2020, 13, 3746. [Google Scholar] [CrossRef]
  4. Go, S.-I.; Yun, S.-Y.; Ahn, S.-J.; Choi, J.-H. Voltage and Reactive Power Optimization Using a Simplified Linear Equations at Distribution Networks with DG. Energies 2020, 13, 3334. [Google Scholar] [CrossRef]
  5. Chen, J.; Li, C. Design Optimization and Coupled Dynamics Analysis of an Offshore Wind Turbine with a Single Swivel Connected Tether. Energies 2020, 13, 3526. [Google Scholar] [CrossRef]
  6. Jin, N.; Hu, S.; Gan, C.; Ling, Z. Finite States Model Predictive Control for Fault-Tolerant Operation of a Three-Phase Bidirectional AC/DC Converter Under Unbalanced Grid Voltages. IEEE Trans. Ind. Electron. 2018, 65, 819–829. [Google Scholar] [CrossRef]
  7. Guo, L.; Jin, N.; Li, Y.; Luo, K. A Model Predictive Control Method for Grid-Connected Power Converters without AC Voltage Sensors. IEEE Trans. Ind. Electron. 2020. [Google Scholar] [CrossRef]
  8. Guo, L.; Jin, N.; Gan, C.; Xu, L.; Wang, Q. An Improved Model Predictive Control Strategy to Reduce Common-Mode Voltage for Two-Level Voltage Source Inverters Considering Dead-Time Effects. IEEE Trans. Ind. Electron. 2019, 66, 3561–3572. [Google Scholar] [CrossRef]
  9. Nayanar, V.; Kumaresan, N.; Gounden, N.A. A Single Sensor Based MPPT Controller for Wind-Driven Induction Generators Supplying DC Microgrid. IEEE Trans. Power Electron. 2015, 31, 1161–1172. [Google Scholar] [CrossRef]
  10. Singh, M.; Chandra, A. Power maximization and voltage sag/swell ride-through capability of PMSG based variable speed wind energy conversion system. In Proceedings of the 2008 34th Annual Conference of IEEE Industrial Electronics, Orlando, FL, USA, 10–13 November 2008; pp. 2206–2211. [Google Scholar]
  11. Pena-Alzola, R.; Campos-Gaona, D.; Ksiazek, P.F.; Ordonez, M. DC-Link Control Filtering Options for Torque Ripple Reduction in Low-Power Wind Turbines. IEEE Trans. Power Electron. 2016, 32, 4812–4826. [Google Scholar] [CrossRef] [Green Version]
  12. Kim, J.; Lee, S.H.; Park, J.-W. Inertia-Free Stand-Alone Microgrid—Part II: Inertia Control for Stabilizing DC-Link Capacitor Voltage of PMSG Wind Turbine System. IEEE Trans. Ind. Appl. 2018, 54, 4060–4068. [Google Scholar] [CrossRef]
  13. Beck, H.-P.; Hesse, R.; Beck, I.H.-P.; Hesse, D.I.R. Virtual synchronous machine. In Proceedings of the 2007 9th International Conference on Electrical Power Quality and Utilisation, Barcelona, Spain, 9–11 October 2007; pp. 1–6. [Google Scholar]
  14. Zhong, Q.-C. Virtual Synchronous Machines: A unified interface for grid integration. IEEE Power Electron. Mag. 2016, 3, 18–27. [Google Scholar] [CrossRef]
  15. Zhong, Q.-C.; Nguyen, P.-L.; Ma, Z.; Sheng, W. Self-Synchronized Synchronverters: Inverters without a Dedicated Synchronization Unit. IEEE Trans. Power Electron. 2013, 29, 617–630. [Google Scholar] [CrossRef]
  16. Fang, J.; Tang, Y.; Li, H.; Li, X. A Battery/Ultracapacitor Hybrid Energy Storage System for Implementing the Power Management of Virtual Synchronous Generators. IEEE Trans. Power Electron. 2018, 33, 2820–2824. [Google Scholar] [CrossRef]
  17. Wang, F.; Zhang, L.; Feng, X.; Guo, H. An Adaptive Control Strategy for Virtual Synchronous Generator. IEEE Trans. Ind. Appl. 2018, 54, 5124–5133. [Google Scholar] [CrossRef]
  18. Shi, K.; Song, W.; Xu, P.; Liu, R.; Fang, Z.; Ji, Y. Low-Voltage Ride-Through Control Strategy for a Virtual Synchronous Generator Based on Smooth Switching. IEEE Access 2018, 6, 2703–2711. [Google Scholar] [CrossRef]
  19. Zheng, X.; Wang, C.; Pang, S. Injecting positive-sequence current virtual synchronous generator control under unbalanced grid. IET Renew. Power Gener. 2019, 13, 165–170. [Google Scholar] [CrossRef]
  20. Xi, J.; Geng, H.; Ma, S.; Chi, Y.; Yang, G. Inertial response characteristics analysis and optimisation of PMSG-based VSG-controlled WECS. IET Renew. Power Gener. 2018, 12, 1741–1747. [Google Scholar] [CrossRef]
  21. Elsisi, M.; Soliman, M.; Aboelela, M.A.; Mansour, W. Model predictive control of plug-in hybrid electric vehicles for frequency regulation in a smart grid. IET Gener. Transm. Distrib. 2017, 11, 3974–3983. [Google Scholar] [CrossRef]
  22. Wang, J.; Ding, B.; Wang, Y. Two-step MPC for systems with input non-linearity and norm-bounded disturbance. IET Control. Theory Appl. 2019, 13, 183–190. [Google Scholar] [CrossRef]
  23. Ma, Z.; Zhang, X.; Huang, J.; Zhao, B. Stability-Constraining-Dichotomy-Solution-Based Model Predictive Control to Improve the Stability of Power Conversion System in the MEA. IEEE Trans. Ind. Electron. 2018, 66, 5696–5706. [Google Scholar] [CrossRef]
  24. Kim, S.-K.; Choi, D.-K.; Lee, K.-B.; Lee, Y.I. Offset-Free Model Predictive Control for the Power Control of Three-Phase AC/DC Converters. IEEE Trans. Ind. Electron. 2015, 62, 7114–7126. [Google Scholar] [CrossRef]
  25. Jin, C.; Li, W.; Shen, J.; Li, P.; Liu, L.; Wen, K.; Wei-Dong, L. Active Frequency Response Based on Model Predictive Control for Bulk Power System. IEEE Trans. Power Syst. 2019, 34, 3002–3013. [Google Scholar] [CrossRef]
  26. Rodriguez, J.L.; Burgos, J.C.; Amalte, L. Sistemas Eolicos de Produccion de Energia Electrica; Editorial Rueda S.L.: Madrid, Spain, 2003. [Google Scholar]
Figure 1. Structure diagram of a wind turbine.
Energies 13 05022 g001
Figure 2. Generator-side converter control block diagram.
Energies 13 05022 g002
Figure 3. Virtual synchronous generator control strategy.
Energies 13 05022 g003
Figure 4. Connection between virtual synchronous generator and model predictive control.
Energies 13 05022 g004
Figure 5. Model predictive virtual synchronous control diagram.
Energies 13 05022 g005
Figure 6. Wind-speed influence on generator-side and grid-side parameters. (a) Wind speed, torque, turbine speed and DC-link voltage; (b) Generator-side three-phase current, current local magnification.
Energies 13 05022 g006
Figure 7. Wind-speed influence on generator-side and grid-side parameters. (a) Active and reactive power; (b) grid-side three-phase current, current local magnification.
Energies 13 05022 g007
Figure 8. Frequency-variation influence on parameters when wind speed is constant. (a) Wind speed, torque, turbine speed and DC-link voltage; (b) generator-side three-phase current, current local magnification; (c) frequency, active and reactive power; (d) grid-side three-phase current, current local magnification.
Energies 13 05022 g008aEnergies 13 05022 g008b
Figure 9. Voltage-variation influence on parameters when wind speed is constant. (a) Wind speed, torque, turbine speed and DC-link voltage; (b) generator-side three phase current, current local magnification; (c) voltage, active and reactive power; (d) grid-side three phase current, current local magnification.
Energies 13 05022 g009aEnergies 13 05022 g009b
Figure 10. Experimental setup for the grid-side converter.
Energies 13 05022 g010
Figure 11. Experimental waveform of power and current when frequency decreases.
Energies 13 05022 g011
Figure 12. Experimental waveform of power and current when frequency increases.
Energies 13 05022 g012
Figure 13. Experimental waveform of power and current when the voltage decreases. (a) Power mutation waveform when voltage decreases; (b) current mutation waveform when voltage decreases.
Energies 13 05022 g013
Figure 14. Experimental waveform of power and current when the voltage increases. (a) Power mutation waveform when voltage increases; (b) current mutation waveform when voltage increases.
Energies 13 05022 g014
Table 1. Simulation parameters.
System ParametersSymbolValue
Reference DC voltageVref400 V
Filter inductanceL10 mH
Line resistanceR0.01 Ω
Power line voltageU190 V
Power line frequencyf50 Hz
Sampling frequencyfs10 kHz
Voltage sag coefficientDq5
InertiaJ0.0122
Damping coefficientDp50

