Abstract
The mitigation of climate change poses a major challenge to the legal framework which aims to stimulate the development of renewable energy sources. The European Union’s direction for the use of renewable energy is distributed generation and an increased use of by-products and organic waste, especially in the production of next-generation biofuels. The main aim of this study is to evaluate the production potential of straw in Poland and the possibility of its use for energy purposes, including a forecast for 2030, on the assumption that the management of this resource is in accordance with the provisions of the Polish Code for Good Agriculture Practice. In Poland, in the years 1999–2018, the average annual surplus of straw harvested over agricultural consumption equalled 12.5 million tons (4.2 Mtoe). Its largest surpluses were in the Dolnośląskie, Kujawsko-Pomorskie, Lubelskie, Wielkopolskie, and Zachodniopomorskie voivodeships (NUTS2). Based on the developed panel models, forecasts for straw surpluses in Poland are presented in three perspectives: realistic, pessimistic, and optimistic. The forecasts show regional differentiation until 2030. Each of the three perspectives indicate a slow increase in these surpluses, and depending on the adopted version, it will range from 10.6% to 21.9%.
Keywords:
renewable energy sources; straw; biofuels; agriculture residues; forecasting; modelling; Poland 1. Introduction
The production of biofuels has led to many controversies. It has been undermined for ethical [1,2,3,4], economic [5,6,7], and environmental [8,9] reasons. Its production has become a subject of numerous discussions, polemics, comments, and contradictory judgments which vary from extreme negations and objections [10,11] to equally extreme affirmations and approvals [12,13]. Therefore, frequent changes in the legislations related to this market can be observed [14,15]. In 2019, the European Parliament and the European Council adopted the climate package [16] in which the European Union is obligated to reduce greenhouse gas emission by 20% (in CO2 equivalent) by the year 2020 (if similar commitments are made by other developed countries, this reduction may be as high as 30%). In the same period, the EU is supposed to increase its share of renewable energy in total energy production from 8.5% to 20%, increase the share of biofuels in transport fuels to at least 10%, as well as reduce energy consumption by 20%.
The European Union’s Renewable Energy Directive (EU-RED) [17] is the main document regulating the biofuels sector. Implementing these plans would result in very significant increases in global land use for biofuels and thus greenhouse gas (GHG) emissions due to the effects of both direct and indirect land-use changes. Various studies now conclude that quite a large share of these biofuels is not sustainable and is not likely to meet the sustainability criteria once Indirect Land Use Change (ILUC) is included [18,19,20]. Ongoing discussions and numerous analyses of the biofuels market resulted in modifications of existing solutions and changes in directives of the European Parliament and the European Council (EU) 2015/1513 [21] and (EU) 2018/2001 [22]. Among the key changes within the new directives is the limit for the first-generation biofuels (generated mainly from crops—grains, sugar cane and vegetables oils). The limit applied restricts their level at 7% in 2020. The other 3% (at minimum) are to consist of the second-generation biofuels. These, in turn, are to be produced from cellulose, hemicellulose (e.g., crop residues, leftovers in forestry), lignocellulosic crops, as well as third-generation biofuels derived from aquatic autotrophic organisms (e.g., algae).
The Renewable Energy Directive proposal for the period 2021–2030 presented by the EU Commission in November 2016 included the following 2030 targets concerning the transportation: decrease the limits on food and feed-based biofuels down to 3.8% and introduce a requirement for fuel suppliers requiring to blend 6.8% of advanced fuels [23]. To achieve them, the fuel industry entities are focusing their research and development (R&D) efforts to define and substantiate possible development pathways and improved fuel production technologies [24]. Among the key inputs for the production of new generation fuels is ordinary straw, being a crop by-product (residue) left in the fields after the primary crop (e.g., cereals, rapeseed, sunflowers) is harvested. The straw includes stalks, leaves, and empty ears and corncobs, which are the leftovers separated from the grains. Straw serves several functions as it can be used as lignocellulosic feedstock for the production of biofuels and chemicals while being a nitrogen-fixing element beneficial for the climate change mitigation. Theoretical advances [25,26,27] in regard to production of advanced biofuels based on straw inputs have been confirmed in practice [28,29,30] as well.
High investment costs (ca. €40 million for 50 Gg y-1 yield) [31] predefine the need for a long-term and stable supply of raw materials. Biomass has become one of the most globally studied directions to ensure renewable energy generation based on low-emission sources. There are also varied strategies [31,32,33] in regard to the biomass utilization as the renewable energy source. More in-depth analyses of straw use for bioenergy generation are also being conducted on regional and local levels [29,30,31,32,33,34,35,36,37]. One of them [38] reveals that total UK crop residues equal 20.4 Mt of dry matter (including 8.37 Mt collectable and 4.2 Mt available). Intensifying trend of the past several years is utilization of straw as the basis for second-generation biofuels (produced from agricultural non-food produce). Second-generation bioethanol is a liquid biofuel used for transportation purposes, which is in line with the sustainable development goals, since both the generation of ethanol and its combustion in engines contribute to diminishing the emission of CO2 to the atmosphere [39,40,41,42]. The research conducted in Sweden shows that GHG emissions from biofuels produced from straw were significantly lower than those produced from cereal grains [43].
The issue of straw usage for energy purposes, including ethanol production, and analyses of its potential were also undertaken in Poland [16,32,44,45], but these studies were mainly retrospective and included only short-term forecasts [46,47,48,49,50,51,52,53]. This study fills the gaps in the literature because its main goal is the evaluation of the production potential of straw in Poland and the possibility of its use for energy purposes, including a forecast up to the year 2030, on the assumption that the management of this resource (straw) is in accordance with the provisions of the Polish Code for Good Agriculture Practice [54].
2. Materials and Methods
2.1. Overview
Despite being a by-product, straw has a great economic importance, especially in agricultural production. It is mainly used as bedding, organic fertilizer or fodder. Such use of straw was proved in the early eighties by the research of Institute of Soil Science and Plant Cultivation (IUNG) in Puławy. The research showed that ca. 58% of harvested straw was used for bedding, 36% for fodder and 6% for other uses (covering mounds, isolating mats in horticultural farms, insulating buildings). During periods of lower harvest, like in the years 1977–1980, there was even a deficit of straw. In the second half of the eighties, there was a shift in the structure of agricultural production resulting in a significant decrease of livestock (primarily cattle, sheep and horses) and increase in cereals and rapeseed sowing. Straw harvests began to exceed the demand, inducing theoreticians and practitioners to look for new uses such as production of energy [49,50,52].
2.2. Methodology and Material Sources for Estimation of Straw Surplus
In order to assess its quantity available for alternative use (energy production), the following formula was applied:
where:
- —surplus of straw for alternative use (energy production);
- —production of straw from basic cereals (including mixtures), rapeseed and corn;
- —straw demand for bedding;
- —straw demand for fodder;
- —straw demand for ploughing (organic fertilizer).
This selection of plants was based on the fact that the straw from basic cereals together with mixtures, rapeseed and corn constitute about 99% of total straw production in Poland and is suitable for energy production uses. The analysis is based on data received from the main office of the Statistics Poland (GUS) located in Warsaw. The data allowed the determination of the harvest of straw from cereals (including mixtures) in the years 1999–2019, divided by voivodeships NUTS2 (Nomenclature of Territorial Units for Statistics). The period was chosen due to administration changes introduced in 1 January 1999 which resulted in the creation of new voivodeship borders (NUTS2) [55]. The data mentioned above lacked information about the harvest of rapeseed and corn. The harvest of those plants was calculated based on the harvest of their seeds. The ratio of seeds to straw was assumed to be 1:1. In the data received from Statistics Poland, there was also no information about the distribution of straw. Straw demand for fodder and bedding was estimated on the basis of livestock population and annual norms for individual species and utility groups:
where:
- —straw demand for bedding;
- —straw demand for fodder;
- —population of individual species and utility groups;
- —straw demand norm for bedding by species and utility groups [56];
- —straw demand norm for fodder by species and utility groups [56].
In recent years, the reduction in the area of grass and perennial legumes as well as a significant decrease in the animal population and the associated lower manure production resulted in a loss of organic matter in soil. In order to balance it, a proportion of the straw must also be allocated for the conservation of the soil’s organic matter [50,57].
The increase or loss of organic matter can be measured with the use of coefficients which determine its reproduction or degradation [50,57]. Knowing the sown area of individual plant groups and the amount of manure produced (based on animal population and appropriate norms [oi]), the balance of organic substance was determined based on to the following formula:
where:
- —balance of organic matter ();
- —area of plant groups which increase the content of organic matter (ha);
- —area of plant groups which decrease the content of organic matter (ha);
- —organic matter reproduction coefficient of given plant group (t·ha−1);
- —organic matter degradation coefficient of given plant group (t·ha−1);
- —livestock population by species and age groups (number of heads);
- —manure production norms by species and age groups (t·year−1).
The occurrence of a negative balance of organic matter means that there is a need to plough a certain amount of straw to maintain a sustainable balance of humus. It was assumed that 1 ton of dry solid manure is equivalent to 1.54 tons of straw, hence the need for straw to be ploughed is calculated as follows:
where:
- —straw demand for ploughing (organic fertilizer);
- —balance of organic matter.
2.3. The Applied Statistical Methods
First, for each of the 16 voivodeships and for the whole of Poland, the best straw surplus trend model was searched for among linear (y = a0 + a1t) and non-linear models:
- y = a0 + a1t2;
- y = a0 + a1t3;
- y = a0 + a1t + a2t2;
- y = a0 + a1t + a2t3;
- y = a0 + a1t2 + a2t3;
- y = a0 + a1t + a2t2 + a3t3.
The criterion for choosing the final model was the significance of the parameters as well as the value of the coefficient of determination, which were estimated using the Wolfram Mathematica software in addition, the selected model verified the hypothesis of the occurrence of autocorrelation residues based on the Box–Pierce and Ljung–Box tests [58]. Then, based on the 17 models, point projections for 2025 and 2030 were estimated along with 95% confidence intervals. Next, the selected models were subjected to further verification in order to determine (and confirm) their quality. Next, the selected model was subjected to further verification in order to determine (and confirm) its quality [59].
The amount of straw surplus was also estimated using a cause-effect model. The following variables were used to study the causes of changes in straw surplus:
- Y1—harvest of straw from basic cereals with mixtures (thousands of tons);
- Y2—harvest of straw from rapeseed (thousands of tons);
- Y3—harvest of straw from corn (thousands of tons);
- Y4—Y1 + Y2 Y3;
- Y5—surplus of straw (thousands of tons);
- X11—sown area of basic cereals with mixtures (thousands of ha);
- X21—sown area of rapeseed (thousands of ha);
- X31—sown area of grain corn (thousands of ha);
- X12—straw yield from cereals with mixtures (t·ha−1);
- X22—straw yield from rapeseed (t·ha−1);
- X32—straw yield from corn (t·ha−1);
- X412—straw consumption for fodder and bedding (thousands of tons);
- X43—straw consumption for ploughing (organic fertilizer) (thousands of tons).
The procedure of finding the best set of variables consisted of the stepwise a posteriori elimination of statistically insignificant variables (at 0.05) from the model (which initially contained all potential variables) and the removal of non-coincident variables (which, if maintained, would cause difficulties in interpreting the estimated parameters of the model).
In order to estimate the forecasts based on the selected cause–effect models, it was required to obtain in advance the predicted values of explanatory variables. Such forecasts, broken down by individual voivodeships, were estimated based on the time series models from the ARIMA (p,d,q) (Autoregressive Integrated Moving Average) class models. Such models are relatively “universal” in that they consist of an autoregressive (AR) element and a moving average (MA), i.e., a random component with an extensive structure, and can additionally be built on different values (if necessary), which helps solve problems related to the modelling of non-stationary time series [58]. Moreover, these models are built only on the basis of statistical properties of modelled data—they do not require the search for any additional explanatory variables and automatically solve the problem of autocorrelation of residues, which is quite often found in “classic” models of linear or non-linear trend. The final step was the Granger causality test. According to this test, the variable X is a cause of the variable Y if current values of Y can be predicted with a greater probability based on former values of X than without them (with the rest as a constant), thus, when the coefficients of the delayed variables X are statistically significant.
Next, based on the 17 models, point projections for 2025 and 2030 were estimated along with 95% confidence intervals. As an additional method of verifying the quality and acceptability of forecasts estimated using these two types of models (i.e., trend and cause–effect), the straw surpluses forecast for individual voivodeships were summed and compared with the forecasts obtained for the whole of Poland.
3. Results
3.1. Statistical Characteristics of Variables
One of the main factors determining the possibility of the use of straw in the energy sector is the volume and stability of its production. In the analysed years, the average annual total straw harvest (Y4) in Poland amounted to 29.5 million tons. In terms of weight, it was similar to cereal grain harvests, which confirms the thesis put forward by V. Smil [60] that a significant part of the global production produced in agriculture are by-products. In countries with similar soil-natural conditions to Poland, straw is the most important among all by-products [61]. The highest harvests of straw in Poland, reaching 35.8 million tons, were recorded in 2014, and the lowest in 2000, 2003, and 2006 (respectively: 22.9, 24.0, and 23.4 million tons), which shows that they were characterized by significant fluctuations. In the harvest structure, the largest share had basic cereal straw with mixtures (84.8%), the production of which oscillated around an average of 25.1 million tons. Rapeseed had the lowest share (6.5%). Rapeseed straw (Y2) harvests were characterized by a slow upward trend until 2003 and a significant increase from 2004. The lowest harvests occurred in 2003 and amounted to 793 thousand tons, after which they increased relatively quickly and reached the highest value in 2014 (3.4 million tons). The corn (Y3) straw harvest was relatively small in 1999 (599 thousand tonnes) but began to increase very rapidly. In 2001, the corn straw harvest exceeded the level of the rapeseed straw harvest and in 2013 amounted to 4 million tonnes.
In the years 1983–1990, the average annual surplus over agricultural consumption (Y5) amounted to 5119 thousand tons, which in 2007–2013 rose, on average, to 17047 thousand tons [50]. Using them for energy purposes would meet 5% of primary energy demand. An increasing surplus of straw is caused by a decrease in the number of livestock and thereby a decreasing demand for (mainly) bedding. An unfavourable phenomenon, although characteristic to agriculture, were fluctuations in the straw harvest, which had a direct impact on the level of its surpluses. In the year 2000, the straw surplus amounted to only 6348 thousand tons, and in following year, they amounted to more than twice as much at 15,042 thousand tons. Such significant fluctuations, although occurring every few years, are one of the barriers that inhibit the use of straw outside agriculture.
The main factors determining the surplus straw were mainly the sown and crop area of cereals and oilseeds as well as its consumption. The area of sown basic cereals with mixtures (X11) reached a maximum value of about 8.6 million ha in 1999–2001, after which it fell sharply by 602 thousand ha in 2002 and by 169 thousand ha in 2003, covering an area of 7.8 million ha (reaching the level of the second decade of the 1970s). The following years brought a slow increase to 8.2 million ha, followed by another sharp decrease in the sown area—in 2013–2019 it ranged from 6.7 to 7.1 million ha. The increase in the area of sown basic cereals with mixtures (X11) in the initial years of the examined period was caused by the decrease in the animal population, and thus also the sown area of fodder plants, mainly grown for green matter. In addition, the animal nutrition model was changing, whereby concentrated feed was becoming increasingly more important. The reason for the decrease in the area of basic cereal sowing at the turn of the twentieth and twenty-first centuries was the preparation and implementation of the EU energy policy, which initially recommended and then obliged Member States to increase the production of biofuels, mainly biodiesel [17,21,22]. Hence, the area of rapeseed sowing increased from 426 thousand ha in 2003 to 952 thousand ha in 2014. The area of maize sowing, relatively small in 1999 (104 thousand ha), increased very rapidly and from 2013 oscillated between 562 and 678 thousand ha.
In the years 1999–2019, average yields of straw from basic cereal with mixtures (X12), rapeseed straw (X22) and maize straw (X32) yields were, respectively, 3.3, 2.6 and 6.1 t·ha−1. The highest yields of straw from basic cereal with mixtures were recorded in the 1980s, early 1990s and in 2010. The highest yields of rapeseed straw were observed in the late 1990s and in the years 2004–2009. A slow increase in total straw yields has been observed since 1975. Maize straw yields increased by about 50% in the analysed period (from 4 t·ha−1 in the 1980s to 6 t·ha−1 in the first decade of the 20th century) [50]. The highest corn straw yields were recorded in 2012 (7.4 t·ha−1).
Straw consumption in agriculture depends primarily on the animal population and its structure. This is because it can be used as bedding material for raising all farm animals or as feed for ruminants. During the period under consideration, straw consumption in both cases decreased by approx. 60%. Demand for bedding (X42) declined continuously throughout the entire period between 1999 and 2019. The consumption of straw for fodder (X41) after years of decline, since 2002, has remained at the level of approx. 5.5 million tons. These trends are the result of a decrease in the total livestock population and stabilization of ruminant populations (mainly cattle) since 2002 [50]. Basic descriptive statistics of variables for Poland in total are presented in Table 1. The test was selected automatically by the Wolfram Mathematica software, based on the statistical properties of each variable. For all variables, with the exception of X32, the non-parametric Kolmogorov-Smirnov test [62] was used to assess the compliance of an empirical distribution with a theoretical normal distribution. For the variable X32, the algorithm of the software has selected Pearson’s chi-square compatibility test [63].

Table 1.
Basic statistics of variables determining the straw surplus (Y5) in Poland.
Straw production and the possibilities to use it for energy purposes vary regionally. This strongly depends on the structure of land use, the structure of crops, the size of farms as well as the stocking density and method of breeding livestock. In 2019, the areas with the highest potential to use straw for energy purposes were in Wielkopolskie, Lublin, Lower Silesia, West and Kujawsko-Pomorskie. The lowest potential was seen in Podlaskie and Podkarpackie voivodeships, which in some years even had a deficit of straw. The basic characteristics of variables by voivodeships are presented in Table 2.
Table 2.
Basic statistics of variables determining the straw surplus (Y5) in Poland by voivodeships.
3.2. Trend Models for Straw Surplus (Y5) in Poland in the Years 1999–2019
Table 3 and Figure 1 present trend models of total straw surplus in Poland and by individual voivodeships.
Table 3.
Surplus straw (Y5) trend models in Poland by voivodeships.
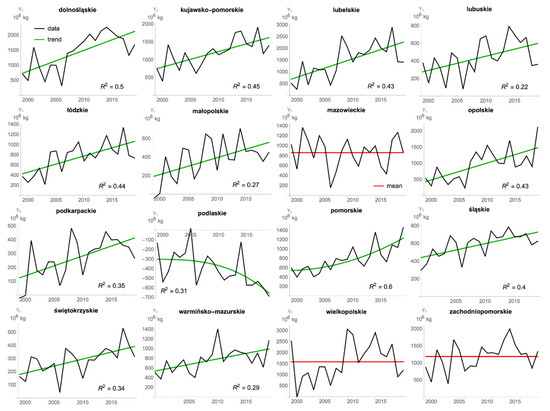
Figure 1.
Observed values and trend models of straw surpluses (Y5) in Poland by voivodeships.
In Poland, in total, for the surplus of straw (Y5), the best model turned out to be the linear function. Non-linear models—with a square and cube of a time variable—either had irrelevant parameters or indicated that, already in 2024, the surplus straw would fall to zero and would continue to fall, which is unacceptable. Residual components of the linear model did not show autocorrelation and are characterized by normal distribution, as proven by Ljung–Box test (Statistic 7357.54, p-value 0.616) and by Kolmogorov–Smirnov test (Statistic 1.162, p-value 0.187). The trend model was fitted to the data in 43.2%.
For most voivodeships (11), linear trends were the best. The estimated trend parameters for these voivodeships indicated an upward trend in the surplus of straw (Y5) in the years 1999–2019 (from 10.64 thousand tonnes on average a year in the Świętokrzyskie voivodeship, to 78.68 thousand tonnes on a yearly average in the Lubelskie voivodeship; on average, 33.86 thousand tonnes).
For the Pomorskie voivodeship the square trend turned out to be best suited, and for the Podlaskie voivodeship it was the cubic trend. At the same time, the Podlaskie voivodeship was the only voivodeship in which straw production was lower than demand.
In the case of the Wielkopolskie voivodeship, the non-linear trend turned out to be unacceptable due to generated forecasts, while the linear trend did not have a significant parameter of the time variable. Therefore, it was considered that no trend model could be obtained in this case. For the Mazowieckie and Zachodniopomorskie voivodeships, no trend model with significant parameters could be estimated. Therefore, for these three voivodeships, instead of the trend model, a constant level of straw surplus (with an average value) was adopted for the entire period considered.
The fitting of trend models to the data was not very high. The adjusted coefficients of determination R2 for obtained equations ranged from 0.22 to 0.60 (average 0.39). Of course, this does not mean that trends did not correctly reflect development trends. The relatively low values of the coefficients of determination were due to quite large fluctuations in production, and thus also surpluses of straw.
3.3. Cause-Effect Models of Surplus Straw (Y5) in Poland in the Years 1999–2019
Table 4 and Figure 2 show the cause-effect models of straw surpluses in Poland in total and by individual voivodeships in the years 1999–2019. Based on the tests of independence using Pearson’s correlation, Spearman’s correlation and Hoeffding’s D statistics, it was found that the surplus of straw (Y5) was significantly correlated with the following variables: sown area and yields of basic cereals with mixtures (X11; X12), rapeseed (X21), and corn (X31; X32), as well as consumption for fodder and bedding (X412) and ploughing (X43). As expected, the relationships (correlations) are positive with variables describing straw harvests, cereals and rapeseed sown areas and yields. Also expected were negative relationships describing straw consumption for fodder and bedding.
Table 4.
Cause-effect models for surplus of straw (Y5) in Poland by voivodeships.
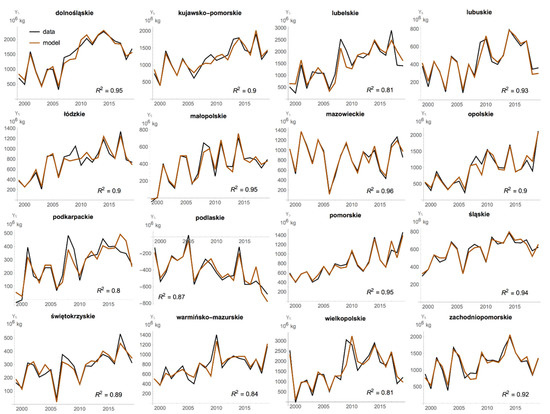
Figure 2.
Observed values and cause-effect models of straw surpluses (Y5) in Poland by voivodeships.
Granger causality tests were also performed [64]. The tests show that the amount of surplus straw is affected (in terms of Granger causality) by straw yields of four cereals and straw consumption for feed, bedding, and ploughing. Due to the possibility of apparent regression, the degree of integration of the variables was also examined. For the original time series, the basic integration test was used, taking into account the possibility of a non-zero mean and deterministic trend for different series.
During the construction of cause-effect models, a set of independent variables that would best explain the changes in the level of surplus straw in the years 1999–2019, were searched for. Subsequently, the equation parameters with all possible combinations of these variables were estimated and equations with the highest corrected coefficient of determination and the lowest value of the Akaike information criterion (AIC) were selected. Then the insignificant variable (X22) was removed from the model. For each voivodeship, models were finally estimated in which all parameters with explanatory variables were statistically significant (at the level of 0.05) and coincidental. No random component autocorrelation phenomenon was observed in the estimated models.
All received models contained at least two explanatory variables. The obtained models were very well fitted to the empirical data (Figure 2 and Table 4). The adjusted determination coefficients had values from 0.80 to 0.96, which means that the models explained at least 80% of the changes in the surplus of straw by voivodeships in the examined period.
The amounts of straw surpluses vary regionally because they depend on the land use, the structure of crops, the size of farms, as well as the stocking density and method of raising livestock. The greatest possibilities for straw use for energy production purposes were characterized in the following voivodeships: Wielkopolskie, Kujawsko-Pomorskie, Lubelskie, Zachodniopomorskie, Dolnośląskie, and Mazowieckie. The results obtained are close to the estimates presented by other authors [46,47,48,49,50,51,52,53,56].
3.4. Straw Surplus Forecasts
Long-term forecasts require that models meet certain prediction assumptions [65] in regard of stability over time of, among others, (i) economic regularity, (ii) model parameters, and (iii) random component distribution.
Therefore, obtained models for the Y5 variable were subjected to additional analysis to check their structural stability over time. The forecast based on this model required prior obtainment of the forecast values of the above seven explanatory variables.
The models in Table 3 and Figure 1 were used to forecast the straw surpluses based on the trend; their properties are described in Section 3.2. Based on the estimated trend models, point and interval forecasts were calculated for the lower and upper limits of the confidence interval (95%). The numerical results are shown in Table 5, and the visualization of forecasts in Figure 3.
Table 5.
Point and interval forecast of Surplus of straw (Y5) on the basis trend models (thous. t).
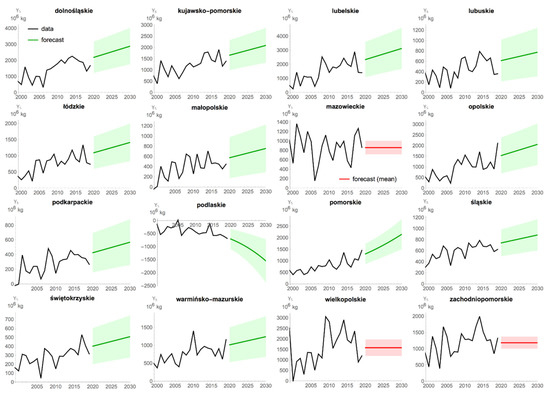
Figure 3.
Point and interval forecast of Surplus of straw (Y5) on the basis trend models (thous. t).
The presented forecast of surplus straw built on the basis of trend models shows that in most voivodeships growth of the straw surplus will be steady. In 2030, these surpluses will amount to over 22 million tons, the highest will be in the Lubelskie, Dolnośląskie, Pomorskie, Kujawsko-Pomorskie and Zachodniopomorskie voivodeships, and the lowest in Lubuskie, Małopolskie, Podkarpackie, and Świętokrzyskie voivodeships. Straw deficit in the Podlasie voivodeship will continue, due to the low share of cereals and rapeseed in the structure of sown crops and large-scale cattle breeding.
To prepare the straw surplus forecast based on cause-effect models, the equations given in Table 4 and Figure 2 were used; their properties are described in Section 3.3. Based on the estimated models, the point and interval forecasts were calculated for the lower and upper limits of the confidence interval (95%). Numerical results are presented in Table 6, and forecast visualization in Figure 4.
Table 6.
Point and interval forecast of Surplus of straw (Y5) based on cause-effect models (thous. t).
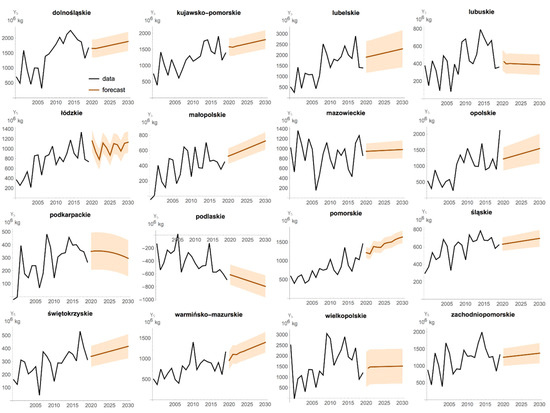
Figure 4.
Point and interval forecast of Surplus of straw (Y5) based on cause-effect models (thous. t).
For all voivodeships (except for Podlaskie and Warminsko-Mazurskie voivodeships), forecasts based on the trend are higher than forecasts resulting from the cause-effect model. Considering the values of determination coefficients, forecasts estimated on basis of cause–effect models are more reliable.
4. Discussion
Poland is perceived within the EU as having a substantial biomass production potential that could be used for energy generation purposes. One of the factors is the level of availability of agricultural areas (AA), which calculated per capita equals 0.41 ha and is higher compared to the EU-15 average. Studies [66,67] show that areas between 1.0 and 4.3 million hectares of Polish land are available for production of biomass suitable for energy generation purposes.
The 2019 statistical data reveals that out of 14.6 million hectares of land in Poland 10.9 million hectares are utilized for crop production. Within this area up to 8.787 million hectares could be utilized for cultivation of crops providing the straw as its by-product (primarily cereals, corn, and rapeseed). Currently the cereals and rapeseed show the largest shares in the crops’ structure (72.4% and 8.0% respectively). At the same time regional differences are present in regard to the crop structure, yet cereals are typical for all regions (reaching share of 75%). Therefore, the potential for removal of straw for the bioenergy generation purposes is highly probable and feasible, especially taking into account the current EU’s renewable energy policy targets [21,22]. Poland too aims to increase the renewable energy generation with the key national policies defining or regulating the use of straw for bioenergy purposes being the biomass energy law [68], Energy Policy of Poland until 2040 [69] and Renewable Energy Sources Act [70].
Numerous independent scientific projects as well as the Joint Research Centre [46] have conducted research aimed at assessment straw’s potential for bioenergy generation in Europe. France is the country with largest biomass potential due to highly spread production of cereals and declining trend of livestock production [71]. Significant possibilities of using straw for energy purposes are also possible in such countries as Poland, Germany, Great Britain, Romania, and Slovakia. However, the Danes have the greatest experience in the field of energy use of straw, where about 20% of the crop is allocated to this purpose [72]. Countries which show particularly large increases in use of straw for energy purposes towards 2020 and 2030 are Polish, France, UK, Romania, Hungary, and Denmark.
The interviews with companies interested in obtaining straw for energy purposes show that, these analyses do not seem to be sufficiently comprehensive. This applies especially in case studies conducted for larger countries such as Germany, France, UK, and Poland, which have a high theoretical potential for this resource. The report prepared for the World Bank [73] predicts that in the coming years straw will become most important of RES in Poland.
This study has confirmed the widely proclaimed thesis about significant surpluses of straw in Poland that can be used for energy purposes. In the years 1999–2019, the average annual surplus of harvested straw amounted to 12.5 million tons (4.2 Mtoe). The study presents those estimates by voivodeships. The largest straw surpluses were available in the following voivodeships: Dolnośląskie, Kujawsko-Pomorskie, Lubelskie, Wielkopolskie, and Zachodniopomorskie.
The main problem is the real availability of straw surplus. The area structure of farms in Poland is very unfavourable as it is dominated by small farms. This reduces substantially the possibility of using high-performance, large-sized presses, which in turn determines an economic feasibility of biomass supply. Hence, the presented study assessed the economic potential of the supply system which would guarantee its economic feasibility based on the system of collection, storage, and transport. It was assumed that potential suppliers of straw should be sought in regions which, in prediction, will have a significant straw surplus to at least 2030 and have a favourable agricultural structure with farms over 50 ha.
As was mentioned above, Polish agriculture is characterized by unfavourable area structure of farms dominated by small farms. From the total number of farms (1.4 million) 85.5% have farmland smaller than 15 hectares. However, farms with the area over 50 hectares (32.1 thousand) operate on total area over 3.4 million hectares. For the calculation purposes it was assumed that economic potential of straw used for energy production depends on the average size of farms. Averaged coefficients for each voivodship were used. For voivodship with a favourable structure of the area (e.g., Zachodnipomorskie Voivodship) the rate stands at 60%, which means that the economic potential is 60.1% of the technical potential.
The results show that in 2030 the economic potential of straw for energy production will account up to 5.4 million tons (1.8 Mtoe). The most promising areas were found in the north and south-west of the country. Limited possibilities of straw use for energy production were found in the Małopolskie, Podkarpackie, and Świętokrzyskie voivodships, whereas Podlaskie Voivodship showed absence of straw surplus. A regional differentiation of straw surplus for alternative use in Poland in the 2030 is illustrated in Figure 5.
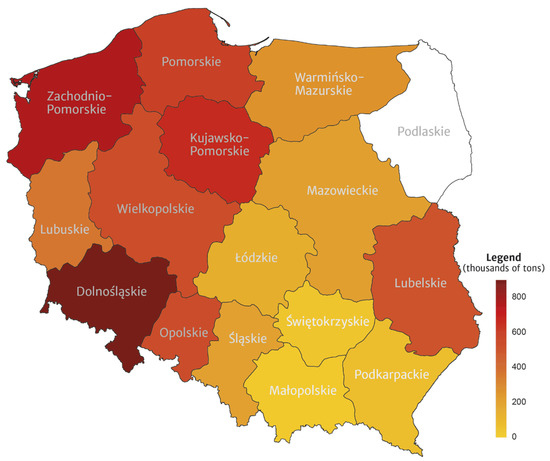
Figure 5.
Straw surplus for energy production in Poland.
So far, the surplus of straw has been used in the following sectors: composting plants, power plants, heating plants, processing plants (briquetting and pelleting plants). According to the author’s estimates, conducted in cooperation with Agricultural Advisory Centres, 600 thousand tons of straw have been earmarked for composting purposes in 2019. The following entities from the energy sector which use straw for energy production have been identify, not only in the studied region, but also in other parts of Poland: Fortum Power and Heat Polska Sp. z o.o.; EDF, which includes Kogeneracja Wrocław and Elektrownia Rybnik, EC Wybrzeże, EC Kraków; ZE PAK, which consists of El. Patnów—Adamów—Konin; GdF Suez Elektrownia Połaniec, The Tauron Group - branches: Elektrownia Jaworzno II, Elektrownia Jaworzno III, Elektrownia Siersza, Elektrownia Łaziska, Zespół Elektrociepłowni Bielsko Biała; PGE, including power plants in Bełchatów, ZE Dolna Odra and EC Szczecin, EL Turów, EL Opole, EC Gorzów Wielkopolski; Thermal power plants of the Veolia Polska Group in Łódź and in Poznań. According to information obtained from the Polish Chamber of Biomass, the studied enterprises acquired approximately 900 thousand tons of straw in the studied region in 2019. Pelleting and briquetting plants, as well as local heat plant are also significant straw users. In 2019, enterprises from this sector acquired approximately 400 thousand tons of straw.
5. Conclusions
The mitigation of climate change is a major challenge for the legal framework which aims to stimulate the development of renewable energy sources. The European Union direction for the use of renewable energy is distributed generation and an increase in the use of by-products and organic waste – particularly in the production of next-generation biofuels. This creates a huge opportunity for rural areas and agriculture where more than half of global production is unfit for consumption. Despite those possibilities, the current production of biofuels used in transportation are from cereals and rapeseed. Such policies are criticized by many as they cause increases in the prices of agricultural raw materials and food. At the same time, their ecological effects in terms of CO2 emission reduction are much lower than assumed.
However, due to the decision of the European Parliament and the European Council, the share of energy from first-generation biofuels is to be gradually reduced; they will be replaced by energy from advanced biofuels and biogas produced from waste materials, renewable nonbiological fuels and electricity from renewable sources [21,22]. There are significant resources of biomass waste in Poland (listed in parts A and B of Annex IX to Directive 2015/1513) that can be used for the production of second-generation biofuels. Such raw materials include straw, but the possibilities of using it for energy should be consistent with the provisions in the Code for Good Agricultural Practice [54].
Cause–effect models based on data for 16 voivodships from the period 1999–2019 were used to estimate the surplus straw. The estimated straw surplus in the studied years was significantly correlated with the following explanatory variables: sown area of the analysed crops (X11, X21, X31), straw yields from four cereals with mixtures (X12), corn X32) and straw consumption for fodder and bedding (X412). The obtained model was very well matched to the empirical data; the corrected coefficient of determination equalled 0.90. Based on the developed panel models (which were characterized by the ability to explain the described phenomena), forecasts for straw surpluses in Poland were presented in three perspectives: realistic, pessimistic, and optimistic. The forecasts show regional differentiation until 2030. Each of three perspectives indicate a slow increase in these surpluses; depending on the adopted version, it will range from 10.6% to 21.9%.
The basic problem, however, is the real availability of surpluses of straw. The area structure of farms in Poland is very unfavourable because of the domination of small farms. This significantly limits the possibility of using high-performance, large-scale straw harvesting presses and determines the success of the supply of biofuel (the organization of an efficient harvesting, storage, and transport system). Potential suppliers of straw for the biofuel sector should be sought in regions which will have significant surpluses of straw over the needs arising from agricultural production until at least 2030 and are characterized by a favourable area structure of farms (a significant number of large-scale farms, i.e., above 50 ha). These conditions are met by three regions: the southeastern (covering the eastern part of the Lubelskie and Podkarpackie voivodeships), the southwest (Dolnośląskie and Opolskie voivodeships), and the northwest (Pomorskie and Zachodniopomorskie voivodeships).
However, this does not mean that, on a local scale (township or county) in these regions, straw could not be employed for energy-related purposes. This would however require making calculations on a micro-scale, and it would then be possible to define the requisition of straw for agricultural purposes with greater accuracy, at the same time taking into account various methods of animal husbandry (litter and non-litter systems) and nutrition (nutritive or bulky fodder).
Author Contributions
P.G., Conceptualization, Investigation, Supervision, Software, Writing—original draft, -review & editing; B.G., Conceptualization, Investigation, Writing—original draft, -review & editing; A.T., Conceptualization, Investigation, Writing—original draft, review & editing; B.J., Investigation, Software, Writing—original draft, review & editing. All authors have read and agreed to the published version of the manuscript.
Funding
This research received no external funding.
Conflicts of Interest
The authors declare no conflict of interest.
References
- Buyx, A.; Tait, J. Biofuels: Ethics and policy-making. Biofuels Bioprod. Biorefin. 2011, 5, 631–639. [Google Scholar] [CrossRef]
- Thompson, P.B. The agricultural ethics of biofuels: The food vs. fuel debate. Agriculture 2012, 2, 339–358. [Google Scholar] [CrossRef]
- Gomiero, T.; Paoletti, M.; Pimentel, D. Biofuels: Efficiency, ethics, and limits to human appropriation of ecosystem services. J. Agric. Environ. Ethics 2009, 23, 403–434. [Google Scholar] [CrossRef]
- Mohr, A.; Raman, S. Lessons from first generation biofuels and implications for the sustainability appraisal of second generation biofuels. Energy Policy 2013, 63, 114–122. [Google Scholar] [CrossRef]
- Huang, J.; Yang, J.; Msangi, S.; Rozelle, S.; Weersink, A. Global biofuel production and poverty in China. Appl. Energy 2012, 98, 246–255. [Google Scholar] [CrossRef]
- Timilsina, G.; Shrestha, A. An overview of global markets and policies. In The Impacts of Biofuels on the Economy, Environment and Poverty; Springer Science and Business Media LLC: Berlin/Heidelberg, Germany, 2014; pp. 1–14. [Google Scholar]
- Gomiero, T. Are biofuels an effective and viable energy strategy for industrialized societies? A reasoned overview of potentials and limits. Sustainability 2015, 7, 8491–8521. [Google Scholar] [CrossRef]
- Mol, A.P. Environmental authorities and biofuel controversies. Environ. Politics 2010, 19, 61–79. [Google Scholar] [CrossRef]
- Selbmann, K.; Pforte, L. Evaluation of Ecological Criteria of Biofuel Certification in Germany. Sustainability 2016, 8, 936. [Google Scholar] [CrossRef]
- Lane, J. Letter Sent to Dutch Cabinet by 178 Dutch Scientists Urges End to Food-Based Biofuels. Available online: http://www.biofuelsdigest.com/bdigest/2017/12/04/letter-sent-to-dutch-cabinet-by-178-dutch-scientists-urges-end-to-food-based-biofuels/ (accessed on 23 February 2020).
- Cao, Y.; Pawlowski, L. Effect of Biofuels on Environment and Sustainable Development. Ecol. Chem. Eng. S 2013, 20, 799–804. [Google Scholar] [CrossRef]
- Copa Cogeca. Phasing Out First Generation Biofuels: What is at Stake? Available online: http://copa-cogeca.eu/Download.ashx?ID=1590445 (accessed on 2 February 2020).
- Falck-Zepeda, J.; Msangi, S.; Sulser, T.; Zambrano, P.; Falconi, C. Biofuels and Rural Economic Development in Latin America and the Caribbean; Cooperation Programme FAO/Inter-American Development Bank Latin America and the Caribbean Service Investment Centre Division: Washington, DC, USA, 2010; Available online: https://publications.iadb.org/publications/english/document/Biofuels-and-Rural-Economic-Development-in-Latin-America-and-the-Caribbean.pdf (accessed on 13 February 2020).
- USDA Foreign Agricultural Service; Global Agricultural Information Network. EU Biofuels Annual 2017; GAIN Report No. NL7015. Available online: https://apps.fas.usda.gov/newgainapi/api/report/downloadreportbyfilename?filename=Biofuels%20Annual_The%20Hague_EU-28_6-19-2017.pdf (accessed on 2 February 2020).
- Stattman, S.L.; Gupta, A.; Partzsch, L.; Oosterveer, P. Toward sustainable biofuels in the European Union? Lessons from a decade of hybrid biofuel governance. Sustainability 2018, 10, 4111. [Google Scholar] [CrossRef]
- Searle, S.Y.; Malins, C.J. Waste and residue availability for advanced biofuel production in EU Member States. Biomass Bioenergy 2016, 89, 2–10. [Google Scholar] [CrossRef]
- Directive 2009/28/EC of the European Parliament and of the Council of 23 April 2009 on the Promotion of the Use of Energy from Renewable Sources and Amending and Subsequently Repealing Directives 2001/77/EC and 2003/30/EC, 2009. Available online: https://eur-lex.europa.eu/legal-content/EN/TXT/PDF/?uri=CELEX:32009L0028&from=EN (accessed on 13 February 2020).
- Laborde, D. Assessing the Land Use Change Consequences of European Biofuel Policies; IFPRI (International Food Policy Research Institute): Washington, DC, USA, 2011; Available online: http://ebrary.ifpri.org/utils/getfile/collection/p15738coll5/id/197/filename/198.pdf (accessed on 2 February 2020).
- Marelli, L.; Ramos, F.; Hiederer, R.; Koeble, R. Estimate of GHG Emissions from Global Land Use Change Scenarios; Joint Research Centre (JRC), Publications Office of the European Union: Brussels, Belgium, 2011. [Google Scholar] [CrossRef]
- Fritsche, U.R.; Wiegmann, K. Indirect Land Use Change and Biofuels. Öko-Institut: Brussels, Belgium, 2011. Available online: https://www.europarl.europa.eu/document/activities/cont/201203/20120301ATT39667/20120301ATT39667EN.pdf (accessed on 14 February 2020).
- Directive (EU) 2015/1513 of the European Parliament and of the Council of 9 September 2015 Amending Directive 98/70/EC Relating to the Quality of Petrol and Diesel Fuels and Amending Directive 2009/28/EC on the Promotion of the Use of Energy from Renewable Sources, 2015. Available online: https://eur-lex.europa.eu/legal-content/EN/TXT/PDF/?uri=CELEX:32015L1513&from=EN (accessed on 14 February 2020).
- Directive (EU) 2018/2001 of the European Parliament and of the Council of 11 December 2018 on the Promotion of the Use of Energy from Renewable Sources (Recast), 2018. Available online: https://eur-lex.europa.eu/legal-content/EN/TXT/PDF/?uri=CELEX:32018L2001&from=EN (accessed on 14 February 2020).
- Bacovsky, D.; Ludwiczek, N.; Ognissanto, M.; Wörgetter, M. Status of Advanced Biofuels Demonstration Facilities in 2012, A Report to IEA Bioenergy Task 39, T39-P1b, 2013. Available online: http://task39.sites.olt.ubc.ca/files/2013/12/2013_Bacovsky_Status-of-Advanced-Biofuels-Demonstration-Facilities-in-2012.pdf (accessed on 13 February 2020).
- IRENA (International Renewable Energy Agency). Innovation Outlook: Advanced Liquid Biofuels; IRENA: Abu Dhabi, UAE, 2016; Available online: https://www.irena.org/-/media/Files/IRENA/Agency/Publication/2016/IRENA_Innovation_Outlook_Advanced_Liquid_Biofuels_2016.pdf (accessed on 12 February 2020).
- Sun, R.-C. Cereal Straw as a Resource for Sustainable Biomaterials and Biofuels, 1st ed.; Elsevier: Amsterdam, The Netherlands, 2010; ISBN 9780444561893. [Google Scholar]
- Sarkar, N.; Ghosh, S.K.; Bannerjee, S.; Aikat, K. Bioethanol production from agricultural wastes: An overview. Renew. Energy 2012, 37, 19–27. [Google Scholar] [CrossRef]
- Hammond, G.P.; Mansell, R.V. A comparative thermodynamic evaluation of bioethanol processing from wheat straw. Appl. Energy 2018, 224, 136–146. [Google Scholar] [CrossRef]
- Chen, H.; Qiu, W. Key technologies for bioethanol production from lignocellulose. Biotechnol. Adv. 2010, 28, 556–562. [Google Scholar] [CrossRef]
- Bacovsky, D. Advanced biofuels are just around the corner. In Proceedings of the Advanced Biofuels Conference, Gothenburg, Sweden, 19 May 2017; Available online: https://bioenergyinternational.com/app/uploads/2017/05/Bacovsky_Dina_ABC17.pdf (accessed on 5 February 2020).
- Kerstetter, J.; Lyons, J. Wheat Straw for Ethanol Production in Washington: A Resource, Technical, and Economic Assessment; Washington State University Cooperative Extension Energy Program: Olympia, WA, USA, 2001; Available online: http://pacificbiomass.org/documents/WA_AsssessmentWheatStrawToEthanol_rev.pdf (accessed on 10 June 2020).
- Zhang, C.; Xie, G.; Li, S.; Ge, L.; He, T. The productive potentials of sweet sorghum ethanol in China. Appl. Energy 2010, 87, 2360–2368. [Google Scholar] [CrossRef]
- Sultana, A.; Kumar, A. Optimal siting and size of bioenergy facilities using geographic information system. Appl. Energy 2012, 94, 192–201. [Google Scholar] [CrossRef]
- Viana, H.; Cohen, W.B.; Lopes, D.; Aranha, J.T.M. Assessment of forest biomass for use as energy. GIS-based analysis of geographical availability and locations of wood-fired power plants in Portugal. Appl. Energy 2010, 87, 2551–2560. [Google Scholar] [CrossRef]
- Ekman, A.; Wallberg, O.; Joelsson, E.; Börjesson, P. Possibilities for sustainable biorefineries based on agricultural residues—A case study of potential straw-based ethanol production in Sweden. Appl. Energy 2013, 102, 299–308. [Google Scholar] [CrossRef]
- Gauder, M.; Graeff-Hönninger, S.; Claupein, W. Identifying the regional straw potential for energetic use on the basis of statistical information. Biomass Bioenergy 2011, 35, 1646–1654. [Google Scholar] [CrossRef]
- Weiser, C.; Zeller, V.; Reinicke, F.; Wagner, B.; Majer, S.; Vetter, A.; Thraen, D. Integrated assessment of sustainable cereal straw potential and different straw-based energy applications in Germany. Appl. Energy 2014, 114, 749–762. [Google Scholar] [CrossRef]
- Chen, X. Economic potential of biomass supply from crop residues in China. Appl. Energy 2016, 166, 141–149. [Google Scholar] [CrossRef]
- Monforti, F.; Bódis, K.; Scarlat, N.; Dallemand, J.-F. The possible contribution of agricultural crop residues to renewable energy targets in Europe: A spatially explicit study. Renew. Sustain. Energy Rev. 2013, 19, 666–677. [Google Scholar] [CrossRef]
- Kaparaju, P.; Serrano, M.; Thomsen, A.B.; Kongjan, P.; Angelidaki, I. Bioethanol, biohydrogen and biogas production from wheat straw in a biorefinery concept. Bioresour. Technol. 2009, 100, 2562–2568. [Google Scholar] [CrossRef] [PubMed]
- Belal, E.B. Bioethanol production from rice straw residues. Braz. J. Microbiol. 2013, 44, 225–234. [Google Scholar] [CrossRef]
- Novy, V.; Longus, K.; Nidetzky, B. From wheat straw to bioethanol: Integrative analysis of a separate hydrolysis and co-fermentation process with implemented enzyme production. Biotechnol. Biofuels 2015, 8, 46. [Google Scholar] [CrossRef]
- Passoth, V.; Sandgren, M. Biofuel production from straw hydrolysates: Current achievements and perspectives. Appl. Microbiol. Biotechnol. 2019, 103, 5105–5116. [Google Scholar] [CrossRef]
- Lantz, M.; Prade, T.; Ahlgren, S.; Björnsson, L. Biogas and ethanol from wheat grain or straw: Is there a trade-off between climate impact, avoidance of iLUC and production cost? Energies 2018, 11, 2633. [Google Scholar] [CrossRef]
- Kretschmer, B.; Allen, B.; Hart, K. Mobilising Cereal Straw in the EU to Feed Advanced Biofuel Production; IEEP (Institute for European Environmental Policy): Brussels, Belgium, 2012; Available online: https://ieep.eu/uploads/articles/attachments/7027de1e-dc4d-43e8-8126-16402efe66ed/IEEP_Agricultural_residues_for_advanced_biofuels_May_2012.pdf?v=63664509775 (accessed on 13 February 2020).
- Gradziuk, P.; Jendrzejewski, B. Wyzwania dla Sektora Biopaliw w Kontekście Polityki Klimatyczno-energetycznej Unii Europejskiej. Roczniki Naukowe Stowarzyszenia Ekonomistów Rolnictwa i Agrobiznesu 2017, 12, 58–65. [Google Scholar] [CrossRef]
- Edwards, R.A.H.; Šúri, M.; Huld, T.A.; Dallemand, J.F. GIS-Based Assessment of Cereal Straw Energy Resource in the European Union. Available online: http://citeseerx.ist.psu.edu/viewdoc/download?doi:10.1.1.550.9051&rep=rep1&type=pdf (accessed on 10 February 2020).
- Baum, R.B.R.; Wajszczuk, K.W.K.; Pepliński, B.P.B.; Wawrzynowicz, J.W.J. Potential for agricultural biomass production for energy purposes in Poland: A review. Contemp. Econ. 2013, 7, 63–74. [Google Scholar] [CrossRef]
- Rozakis, S.; Kremmydas, D.; Pudełko, R.; Borzecka-Walker, M.; Faber, A. Straw potential for energy purposes in Poland and optimal allocation to major co-firing power plants. Biomass Bioenergy 2013, 58, 275–285. [Google Scholar] [CrossRef]
- Gradziuk, P. The potential of straw for energy purposes in Poland. Barometr Regionalny 2014, 12, 15–22. [Google Scholar]
- Gradziuk, P. The Economic Importance and Possibilities of Using Straw for Energy Purposes in Poland (org. Gospodarcze Znaczenie i Możliwości Wykorzystania Słomy na Cele Energetyczne w Polsce); IUNG-PIB (Instytut Uprawy Nawożenia i Gleboznawstwa Państwowy Instytut Badawczy): Puławy, Poland, 2015; ISBN 978-83-7562-190-7.
- Zbytek, Z.; Dach, J.; Pawłowski, T.; Smurzyńska, A.; Czekała, W.; Janczak, D. Energy and economic potential of maize straw used for biofuels production. MATEC Web Conf. 2016, 60, 4008. [Google Scholar] [CrossRef]
- Ziętara, W.; Zieliński, M. Straw as alternative energy source or organic matter in the soil. Probl. Agric. Econ. 2018, 355, 28–40. [Google Scholar] [CrossRef]
- Marks-Bielska, R.; Bielski, S.; Novikova, A.; Romaneckas, K. Straw stocks as a source of renewable energy. A case study of a district in Poland. Sustainability 2019, 11, 4714. [Google Scholar] [CrossRef]
- Ministry of Agriculture and Rural Development of Poland; Ministry of Environment of Poland. Kodeks Dobrej Praktyki Rolniczej, Warsaw, Poland, 2004, ss. 98. Available online: http://iung.pl/dpr_eng/publikacje/kodeks_dobrej_praktyki_rolniczej.pdf (accessed on 13 February 2020).
- Chojnicki, Z.; Czyż, T. Nowa Organizacja Terytorialna Polski i Układ Regionalny. Czas. Geogr. 2000, 71, 261–277. Available online: http://igsegp.amu.edu.pl/wp-content/uploads/2018/05/Chojnicki_Czy%C5%BC_2000a.pdf (accessed on 16 February 2020).
- Mazurkiewicz, J.; Marczuk, A.; Pochwatka, P.; Kujawa, S. Maize straw as a valuable energetic material for biogas plant feeding. Materials 2019, 12, 3848. [Google Scholar] [CrossRef]
- Harasim, A. Straw Management; Institute of Soil Science and Plant Cultivation—National Research Institute (IUNG-PIB): Puławy, Poland, 2011; ISBN 978-83-7562091-7.
- Ljung, G.G.E.P. Box, On a Measure of Lack of Fit in Time Series Models. Biometrika 1978, 65, 297–303. [Google Scholar] [CrossRef]
- Spiegel, M.R.; Stephens, L.J. Schaum’s Outline of Statistics, 4th ed.; McGraw-Hill: New York, NY, USA, 2008. [Google Scholar] [CrossRef]
- Smil, V. Crop residues: Agriculture’s largest harvest. Bioscience 1999, 49, 299–308. [Google Scholar] [CrossRef]
- Staniforth, A. Cereal Straw; Clarendon Press: Oxford, UK, 1979. [Google Scholar]
- Kafadar, K.; Sheskin, D.J. Handbook of parametric and nonparametric statistical procedures. Am. Stat. 1997, 51, 374. [Google Scholar] [CrossRef]
- Jaggia, S.; Kelly, A. Business Statistics. Communicating with Numbers, 3rd ed.; McGraw-Hill Education: New York, NY, USA, 2019; p. 443. [Google Scholar]
- Granger, C.W.J. Investigating causal relations by econometric models and cross-spectral methods. Econometrica 1969, 37, 424. [Google Scholar] [CrossRef]
- Bisgaard, S.; Kulahci, M. Time Series Analysis and Forecasting by Example; John Wiley & Sons, Inc.: Hoboken, NJ, USA, 2011; pp. 83–400. [Google Scholar]
- European Environment Agency. Estimating the Environmentally Compatible Bioenergy Potential from Agriculture; EEA Technical Report No. 12/2007. Office for Official Publications of the European Communities: Luxembourg, 2007. Available online: https://www.eea.europa.eu/publications/technical_report_2007_12 (accessed on 6 May 2020).
- Kołodziej, B.; Matyka, M. Odnawialne źródła Energii. Rolnicze Surowce Energe—Tyczne; Państwowe Wydawnictwo Rolnicze i Leśne: Poznań, Poland, 2012. [Google Scholar]
- Energy Law. Act of 10 kwietnia 1997 r. (Dz. U. z 1997 r. Nr 54, poz. 348). Available online: http://prawo.sejm.gov.pl/isap.nsf/download.xsp/WDU19970540348/U/D19970348Lj.pdf (accessed on 6 May 2020).
- Energy Policy of Poland until 2040 (Project); Ministerstwo klimatu: Warsaw, Poland, 2019. Available online: https://www.gov.pl/attachment/376a6254-2b6d-4406-a3a5-a0435d18be0f (accessed on 6 May 2020).
- Renewable Energy Sources Act. Available online: http://prawo.sejm.gov.pl/isap.nsf/download.xsp/WDU20150000478/U/D20150478Lj.pdf (accessed on 6 May 2020).
- Elbersen, B.; Startisky, I.; Hengeveld, G.; Schelhaas, M.; Naeff, H.; Böttcher, H. Biomass role in achieving the Climate Change & Renewables EU policy targets. Demand and Supply dynamics under the perspective of stakeholders. In Atlas of EU Biomass Potentials; ALTERRA: Copenhagen, Denmark, 2012; Available online: https://ec.europa.eu/energy/intelligent/projects/sites/iee-projects/files/projects/documents/biomass_futures_atlas_of_technical_and_economic_biomass_potential_en.pdf (accessed on 16 August 2020).
- Skøtt, T. Straw to Energy—Status, Technologies and Innovation in Denmark 2011; Network for Biomass (INBIOM): Copenhagen, Denmark, 2011; Available online: file:///C:/Users/Dell/Downloads/halmpjeceuk_2011_web.pdf (accessed on 16 August 2020).
- Hauff, J. Renewable Energy in Poland; Report to the World Bank: Warsaw, Poland, 1996; pp. 8–16. [Google Scholar]


© 2020 by the authors. Licensee MDPI, Basel, Switzerland. This article is an open access article distributed under the terms and conditions of the Creative Commons Attribution (CC BY) license (http://creativecommons.org/licenses/by/4.0/).