Abstract
The industrial sector is a major contributor to the economic growth of the Philippines. However, it is also one of the top consumers of energy, which is produced mainly from fossil fuels. The Philippine industrial sector must therefore be supported economically while minimizing the emissions associated with energy consumption. A potential strategy for minimizing costs and emissions is the installation of solar photovoltaic (PV) modules on the rooftops of industrial facilities, but this approach is hindered by existing energy policies in the country. In this work, we performed a techno-economic assessment on the implementation of rooftop solar PV in Philippine industrial facilities under different policy scenarios. Our study considered 139 randomly sampled industrial plants under MERALCO franchise area in the Philippines. Under the current net metering policy, 132 of the evaluated facilities were economically viable for the integration of rooftop solar PV. This corresponds to an additional 1035 MWp of solar PV capacity and the avoidance of 8.4 million tons of CO2 emissions with minimal financial risk. In comparison, an expanded net metering policy supports the deployment of 4653 MWp of solar PV and the avoidance of 38 million tons of CO2. By enabling an enhanced net metering policy, the widespread application of rooftop solar PV may present considerable savings and emission reduction for energy-intensive industries (electrical and semiconductors, cement and concrete, steel and metals, and textile and garments) and lower generation costs for less energy intensive industries (construction and construction materials, transportation and logistics, and food and beverages).
1. Introduction
The Philippine industrial sector contributed to around 35% of the country’s gross domestic product in 2019 [1]. Unfortunately, its development is hampered by the high cost of electricity (~USD 0.19/kWh), which ranks as the second highest in Asia [2]. In addition, the large energy consumption of the industrial sector is met with environmental pressure due to the CO2 emissions associated with the country’s energy mix. To solve these problems, the implementation of rooftop solar photovoltaic (PV) on industrial facilities has been investigated due to the ample solar energy potential in the Philippines [3]. The displacement of energy from the grid by solar PV generation can reduce emissions, while selling excess solar PV generation to the grid via net metering may yield profits [4]. Typically, these systems show a payback period (PBP) from 3 to 11 years and an internal rate of return (IRR) between 21% to 29% [5,6,7,8]. Furthermore, the feasibility of simultaneous heating and energy generation from solar PV has been demonstrated in other countries [9].
The cost savings and environmental benefits are not the only important factors. The widespread deployment of rooftop solar PV is heavily dependent on regulatory policies. One of the enabling support frameworks is net metering policy, which allows consumers to be prosumers by selling excess generation to the grid [10]. In the Philippines, this is promulgated by the Renewable Energy Act of 2008 and implemented through Energy Regulatory Commission (ERC) Resolution 9 Series of 2013. This scheme compensates exported electricity at a rate equal to the average monthly blended generation rate, but is applicable only for exports below 100 kW [11]. Thus, this policy benefits residential consumers in the Philippines [12] but provides limited opportunities for the industrial sector [13]. A study by Ghosh and co-workers demonstrated that increasing the export limit to 5 MWp in Bangalore, India can improve the economic viability of integrating solar PV systems into their industrial sector [7]. Enabling an expanded net metering policy in the Philippines may likewise promote the widespread adoption of solar PV by the country’s industrial sector [14].
In a prior study, we demonstrated that the implementation of rooftop solar PV in some Philippine sub-industries (Electrical and Semiconductors, Steel and Metals, Food and Beverages, Transportation and Logistics, and Textile and Garments) generated additional energy supply and cost savings, especially if the export limit is amended [15]. In this work, we extend our initial study by including more sub-industries to create a more comprehensive outlook on the viability of rooftop solar PV deployment. This work adopts the four-part analysis employed in our previous work. First, the feasibility of rooftop solar PV installations under the existing net metering policy was determined. Second, expanded scenarios were formed based on possible policy interventions. Third, a techno-economic optimization was performed on solar rooftop installations under the enhanced scenarios. Lastly, the rooftop solar PV installations on industrial plants were assessed based on economic metrics and the possibility for grid defection as demand-side management. This work equips various stakeholders with crucial quantitative information on the potential of rooftop solar PV, the associated economic benefits, and the reduction in CO2 emissions.
2. Materials and Methods
2.1. General Approach
This study will follow the same general approach used in our previous work [15]. This includes the scenarios of rooftop solar PV implementation, shown in Table 1, which are based on current and proposed policies in the Philippines.

Table 1.
Energy policy scenarios considered in this work.
The energy system in the Base Scenario, Improved Policy, and Max Roof Capacity scenarios are illustrated in Figure 1, while that of the Off-Grid scenario is depicted in Figure 2. The off-grid operation of an industrial facility is currently discouraged by the present economic outlook [16] but this scenario is described by the Interruptible Load Program (ILP) of the Philippine government. When the country’s energy supply is insufficient, especially during the summer period, the ILP encourages industrial facilities to disconnect from the main grid and operate in islanded mode [17].
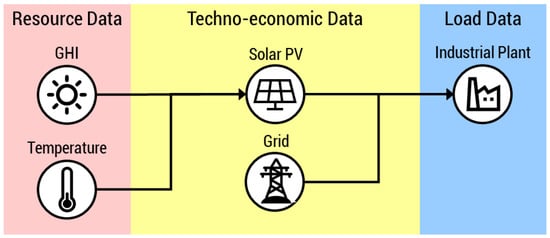
Figure 1.
The industrial plant under the Base Scenario, Improved Policy, and Max Roof Capacity scenarios are powered by solar PV and the grid.
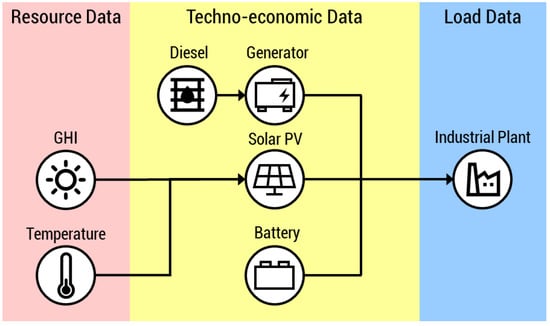
Figure 2.
The industrial plant under the Off-Grid scenario is powered by solar PV, a battery (either lithium-ion or lead–acid), and a diesel generator.
2.2. Philippine Industrial Sector Data
2.2.1. Sampling Methodology
A total of 139 randomly sampled industrial plants were considered in this study. This consists of the 66 facilities from the initial study [15] and 73 more facilities from the 13 additional sub-industries included in this work. The samples were sourced from the 17,793 plants located at the main industrial area of the Philippines being served by Manila Electric Company (MERALCO). The random sampling methodology was comparable to that used in surveys [18]. The total sample size was computed using a 7.5% margin of error and 92.5% confidence level, which were selected based on the available resources for the study. All the selected samples were classified based on the Philippine Standard of Industry Classifications from the Philippine Statistics Authority [19]. Table 2 shows the number of samples per industry classification and initial sub-industry demand data.
Table 2.
Number of samples and electricity demand per sub-industry.
2.2.2. Resource Data
The global horizontal irradiance and temperature data required for the simulation of solar PV modules were sourced from National Aeronautics and Space Administration (NASA) [20]. These were evaluated at the location of each industrial facility. The load profiles of the selected industries were obtained from MERALCO. The peak demand of a representative facility from each sub-industry is shown in Table 3, while the normalized hourly and monthly load profiles of these facilities are shown in Figure 3 and Figure 4, respectively. Other technical and economic parameters used in the simulations are presented in Appendix A and Appendix B.
Table 3.
Peak load from each sample sub-industry.
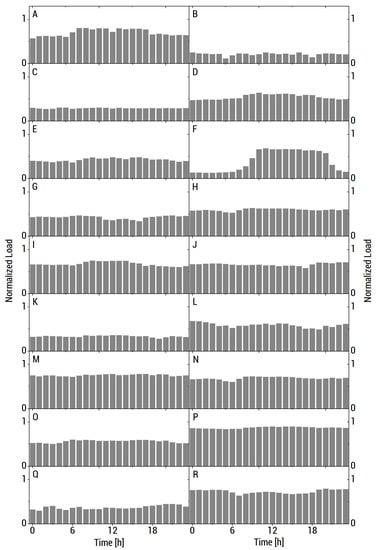
Figure 3.
Hourly average of normalized load profile. The industries referred to by the labels (A–R) are given in Table 3.
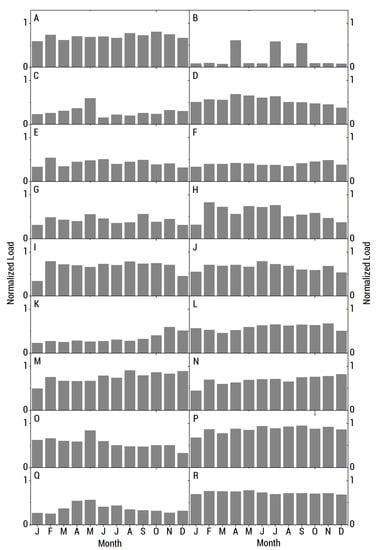
Figure 4.
Monthly average of normalized load profile. The industries referred to by the labels (A–R) are given in Table 3.
2.3. ISLA Optimization Tool
The energy systems are simulated and optimized by the Island System LCOEmin Algorithm (ISLA), an open-source energy systems optimization tool written in Python 3. The tool was developed by our group and subsequently validated with HOMER Pro® [15]. The operation of the different energy components is simulated using mathematical models. The interaction of these components is then determined by the load-following dispatch algorithm, wherein generation from solar PV and the battery are prioritized and the conventional resource (grid in the Base Scenario, Improved Policy, and Max Rooftop; diesel in the Off-Grid scenario) is dispatched by just enough to meet the load. The interaction of the components is simulated for one representative year in hourly time steps. The results of the simulation are then used to determine the net present value (NPV) and other economic metrics about the system. Optimization is performed by running multiple simulations with various energy component sizes, then selecting the set of component sizes that yield the highest NPV. Details about the optimization algorithm and the mathematical models of the energy components are presented in [21].
2.4. Rooftop Potential
The solar PV installation capacity on the rooftop of each industrial facility is estimated using the procedure outlined by Kouhestani [22]. An aerial photograph of the rooftop is obtained from Google MapsTM. The maximum solar PV potential is then calculated from the image while accounting for the rooftop construction, elevation, shading probability, and spaces for maintenance and operation workers. The solar PV panels considered in this work have a standard rating of 0.255 kWp. Other technical details are presented in Appendix B.
2.5. Economic and Environmental Parameters
The market competitiveness of an energy system is quantified by the levelized cost of electricity (LCOE), defined as the total discounted costs of an energy system per unit of electricity generated over its lifetime [23]. It is given by Equation (1) wherein is the discount rate, is the project lifetime (y), is the discounted cost (USD) at year , and is the annual energy consumption (kWh).
The NPV, IRR, and PBP determine the viability of an investment project [24]. The NPV assesses the profitability of a project and is defined as the difference between the discounted inflows and outflows. A positive value of NPV indicates a favorable investment [25]. It is given by Equation (2) wherein is the discounted revenue (USD) at year .
The IRR compares the profitability to the discount rate. An investment is more desirable if the difference in IRR and discount rate increases [25]. It is defined as the discount rate at which the NPV is zero, as shown by Equation (3).
The PBP represents the number of years required to recover the investment. It is also the time when the difference between the total discounted revenue and cost is zero, as shown by Equation (4). A lower PBP indicates lower risk on a project investment [24].
The environmental impact of the solar PV installations is also a key factor to its deployment [26]. It is quantified by the estimated reduction in CO2 emissions of the industrial plant upon the integration of rooftop solar PV with the industrial facility’s energy system. This parameter is determined from the energy supplied by the renewable energy components (solar PV and battery) and the national grid emission factor (NGEF) of the electrical grid where the MERALCO franchise area is connected to [27]. This is given by Equation (5) wherein is the CO2 emission reduction (metric tons) and is the total energy (kWh) supplied by the renewable energy components throughout the lifecycle of the project. Note that other sources of CO2 emissions are not considered by this metric.
3. Results and Discussion
3.1. Case Studies
In this subsection, detailed case studies are presented for two sample industrial facilities to demonstrate the application of the methodology to the industrial plants. The first case study illustrates the integration of rooftop solar PV into a grid-tied system, while the second case study shows a facility that has potential for off-grid operation.
3.1.1. Sample Cement Plant
Table 4 presents the techno-economic and environmental metrics for the sample plant while Figure 5 illustrates the rooftop utilization of solar PV under different policy scenarios.
Table 4.
Techno-economic and environmental metrics describing the cement plant.
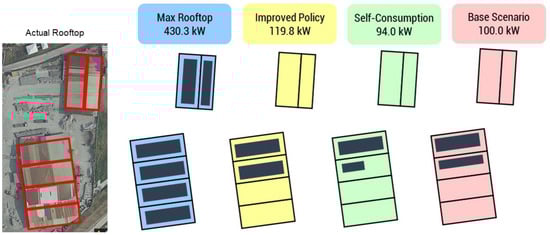
Figure 5.
Illustration of the installed solar PV on the cement plant’s rooftop under each scenario.
Based on the NPV increase and CO2 emission reduction, the results indicate that a transition from the Base Scenario to the Improved Policy scenario yields an improvement in profitability and environmental impact. The IRR and BEP are unchanged, which shows that the transition does not impose a financial risk. The application of the Max Roof Capacity scenario further decreases the CO2 emissions but drastically reduces the economic viability of the investment. In this scenario, the savings from the rooftop solar PV installation cannot compensate for the high capital costs within a reasonable time frame. It is noteworthy that the Max Roof Capacity scenario has a lower NPV than the Base Scenario, demonstrating that maximizing the rooftop solar PV installation is not necessarily economically viable. This sample cement plant is not suitable for the Off-Grid scenario due to the high variability of the load profile and the lack of excess solar PV during daytime.
3.1.2. Sample Transportation Facility
Table 5 presents the techno-economic and environmental metrics for the sample plant, while Figure 6 illustrates the rooftop utilization of solar PV under different policy scenarios.
Table 5.
Techno-economic and environmental metrics describing the transportation facility.
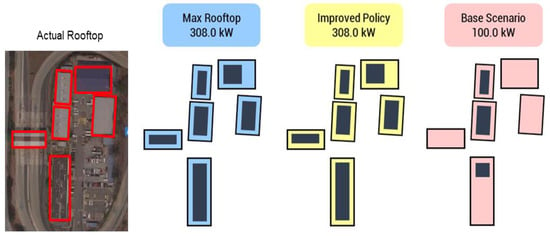
Figure 6.
Illustration of the installed solar PV on the transportation facility’s rooftop under each scenario.
In this case study, the optimized solar PV sizes for both the Improved Policy and Off-Grid scenarios were equal to the maximum rooftop solar PV capacity. The expanded net metering policies clearly decreased generation costs and CO2 emissions while improving the quality of the investment. Furthermore, this transportation establishment is compatible with the Off-Grid scenario, so this facility can participate in the ILP.
3.2. Grid-Tied Scenario Results
Table 6 summarizes the results describing the application of the grid-tied scenarios (Base Scenario, Improved Policy, and Max Roof Capacity).
Table 6.
Summary of results on the grid-tied scenarios.
The rooftop solar PV potential of the selected Philippine industries under the Base Scenario is 1035 MWp, which is comparable to the installed capacity of a large conventional power plant. Of the 139 facilities analyzed, only 7 of these were unviable for rooftop solar PV installation due to shading. Incorporation of the Improved Policy scenario raises the solar PV potential to 4653 MWp, resulting in a sharp increase in NPV and a large drop in CO2 emissions. This strongly supports the results of our earlier work that relaxing the net metering limits can reduce electricity costs. Despite the increased savings, however, the slight reduction in IRR and PBP suggest a lower quality of investment. This is due to the high capital costs of solar PV installation. A further transition into the Max Roof Capacity scenario increases the rooftop solar potential to 5760 MWp. This decreases the CO2 emissions without greatly affecting the quality of investment. The NPV, however, is less than that of the Improved Policy scenario. This supports the recommendation from our previous work that optimization must be performed when implementing rooftop solar in these industrial plants.
3.3. Grid-Tied Scenario Results by Sub-Industry
3.3.1. Rooftop Solar PV Potential
Figure 7 and Figure 8 show the average and total rooftop solar PV potential, respectively, of each sub-industry under different grid-tied scenarios.
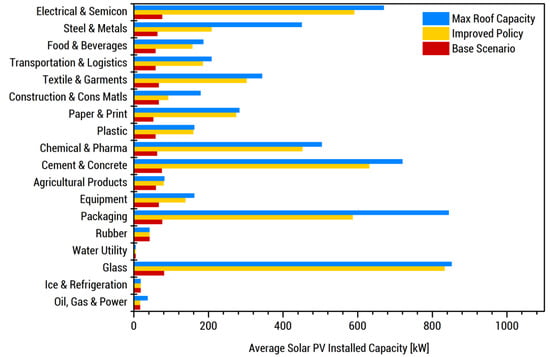
Figure 7.
Average rooftop solar PV potential of the sampled industrial plants under different scenarios.
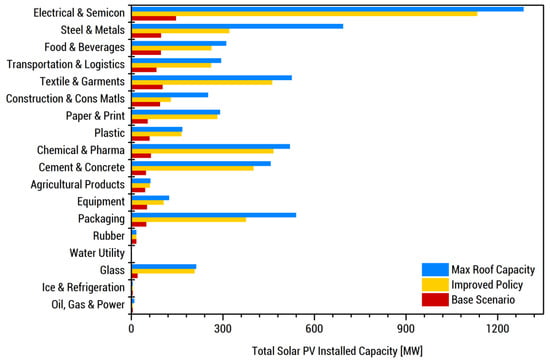
Figure 8.
Total rooftop solar PV potential of the sampled industrial plants under different scenarios.
The sub-industry analysis demonstrates that energy-intensive industries (Electrical and Semiconductors, Cement and Concrete, Packaging, and Glass) have high rooftop solar PV potentials. In addition, 61 of the 139 facilities (~44%) analyzed in this work have an optimum rooftop solar PV capacity greater than the 100 kWp export limit. This suggests that the expansion of the current net metering policies will support the widespread deployment of rooftop solar PV. The average rooftop solar PV potential among the sampled industries is 643.2 kWp. Raising the export limit to this value will cover majority of the scenarios during the actual implementation of rooftop solar PV in industrial plants. As for rooftop area usage, most of the sampled industries will require only 42% of their rooftop to be fitted with solar PV.
3.3.2. Economic Potential
Figure 9, Figure 10 and Figure 11 show the LCOE, NPV, and CO2 emission reduction, respectively, of each sub-industry under the different grid-tied scenarios.
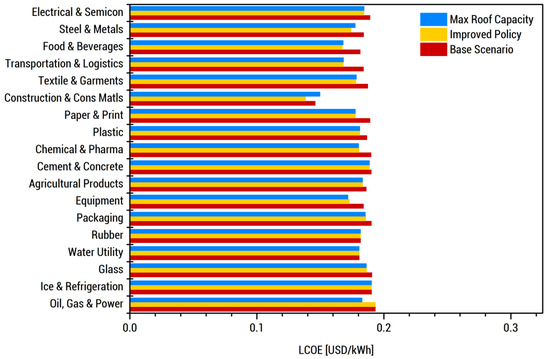
Figure 9.
Levelized cost of electricity (LCOE) of the sampled industrial plants under different scenarios.
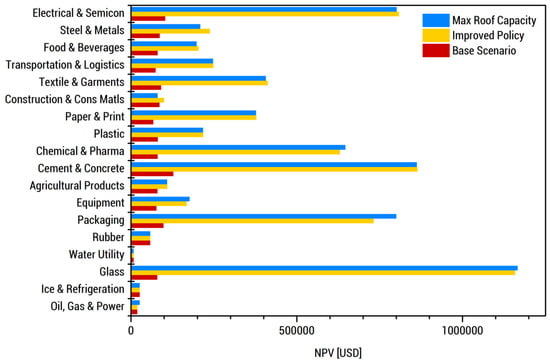
Figure 10.
NPV of the sampled industrial plants under different scenarios.
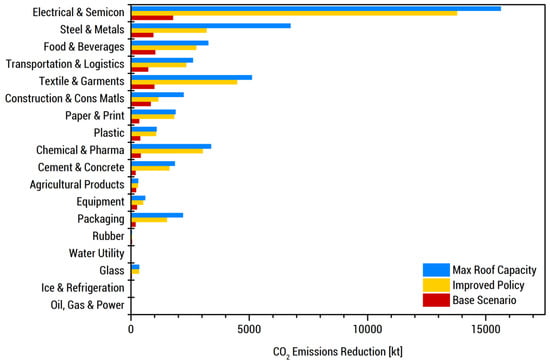
Figure 11.
CO2 emission reduction of the sampled industrial plants under different scenarios.
Most of the sub-industries have an optimized LCOE of around USD 0.17/kWh to USD 0.186/kWh, while only the Oil and Gas sub-industry has exceeded the average electricity retail price of ~USD 0.19/kWh. Sub-industries with low energy intensities (Construction and Construction Materials, Transportation and Logistics, and Food and Beverages) generally exhibited a lower optimized LCOE. Meanwhile, energy intensive sub-industries (Electrical and Semiconductors, Cement and Concrete, Steel and Metal, and Textile and Garments) accounted for higher NPV and lower CO2 emissions as these parameters are directly influenced by electricity demand and, hence, the larger effect of rooftop solar PV installation. This demonstrates the effect of a facility’s energy consumption on the LCOE, NPV, and CO2 reduction upon the integration of rooftop solar PV.
3.3.3. Investment Potential
Figure 12 and Figure 13 show the IRR and PBP, respectively, of each sub-industry under the different grid-tied scenarios.
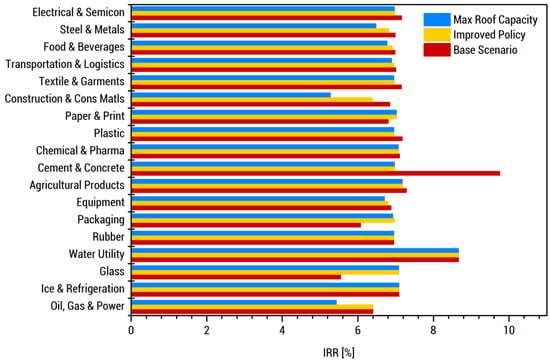
Figure 12.
IRR of the sampled industrial plants under different scenarios.
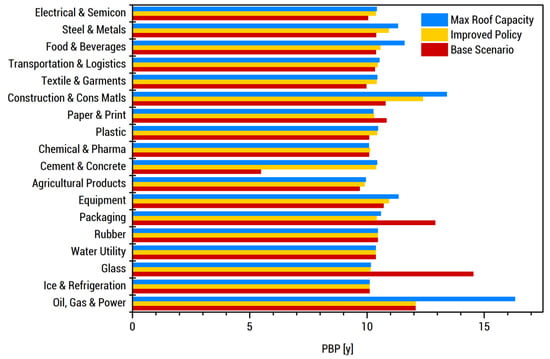
Figure 13.
PBP of the sampled industrial plants under different scenarios.
The IRR values of the additional sub-industries considered in this work averaged 6%–7%, which is slightly lower than the IRR of those considered in our previous work. Nonetheless, this is still higher than the 4% interest rate in 2019 [28], indicating minimal investment risk upon the deployment of rooftop solar PV. This is particularly true for energy intensive sub-industries, which are characterized by high IRR and low PBP values. In contrast, sub-industries with a low energy consumption had a higher PBP and an IRR near the 4% interest rate.
3.3.4. Overall Potential
From the results presented above, it is evident that rooftop solar PV is a more favorable investment particularly for energy intensive sub-industries. This is primarily because low energy intensity sub-industries have solar PV potentials higher than the demand of the plant. Excess solar energy generated by the system will then be sold to the grid. It is more economical, however, to utilize all the generated solar energy because electricity is sold at a rate of USD 0.076 kWh only as opposed to the retail electricity rate of ~USD 0.19/kWh. This explanation is validated by the findings from the Max Roof Capacity scenario wherein the investment efficiency decreases due to the increase in solar PV potential against the demand. This was also observed in our previous study [15] wherein the savings incurred from rooftop solar PV does not always compensate for the high capital costs.
3.4. Off-Grid Scenario Results
Table 7 shows the results describing the application of the Off-Grid scenario.
Table 7.
Summary of results on the Off-Grid scenario.
Of the 139 industrial facilities surveyed in this work, 14 of these (~10%) were viable for off-grid electrification. This consists of the seven viable facilities from our previous work and seven more facilities included in this study. Six of these facilities may use either lithium-ion or lead–acid batteries as energy storage. Four other industries can deploy only the lithium-ion battery, while the remaining four can utilize only the lead–acid battery. Off-grid solar PV systems employing the lead–acid battery have higher investment efficiencies based on the IRR and PBP. On the other hand, systems that have lithium-ion as energy storage benefit from higher energy storage capacities, NPV, and reduction in CO2 emissions. The viability of the Off-Grid scenario depends largely on the behavior of their load profile and the rooftop area. The industrial plants’ profile must have high energy usage during night-time and low energy usage during daytime to make it viable for off-grid application. It must also have a large rooftop area to obtain a solar PV potential that can supply both the batteries and the facility’s energy demand.
3.5. Sensitivity and Grid Defection Analysis
A sensitivity analysis was performed to illustrate the effect of the decreasing prices of solar PV and lithium-ion batteries over time on the optimum system configuration. The cost of solar PV and energy storage are projected to decrease as materials and manufacturing processes are always being improved. The increased production of these technologies also leads to economies of scale. In particular, the New Energy Outlook of the Bloomberg New Energy Finance predicts a 71% drop in solar PV costs by 2050 [29]. Meanwhile, lithium-ion battery prices will experience a 33% decrease by 2030 and a 50% decrease by 2050 [30]. This case study is based on a sample packaging plant with a rooftop area of 12,445 m2 and a maximum solar rooftop capacity of 1938.6 kWp. This plant has an optimized solar PV and lithium-ion storage potential of 743.2 kWp and 1.5 kWh in 2019, respectively, with a corresponding LCOE of USD 0.42/kWh.
Figure 14 demonstrates the increasing optimum potential of solar PV and lithium-ion battery installations as their cost decreases through the years. The potential of solar PV exhibited a consistent increase, while that of lithium-ion rose sharply by 50% at around 2040. The increasing renewable energy potentials also results in a reduction of CO2 emissions.
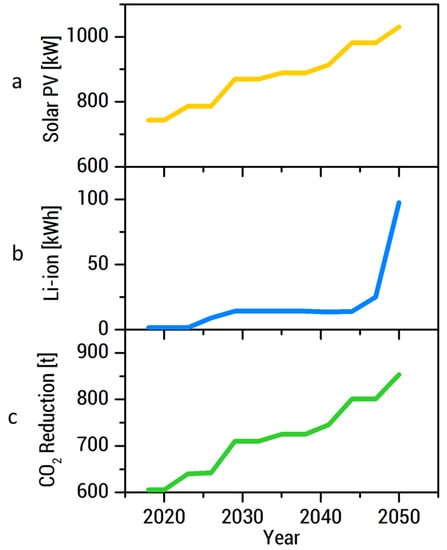
Figure 14.
Sensitivity analysis results showing the (a) solar PV potential, (b) lithium-ion storage potential, and (c) CO2 emission reduction over time for a sample industrial facility.
A grid defection study shown in Figure 15 was also performed to identify the point when the off-grid generation costs (LCOE) will be comparable to the retail electricity price. The optimum LCOE of the off-grid configuration experiences a slow decline from USD 0.42/kWh from 2019 to USD 0.38/kWh in 2050. The LCOE of the off-grid system and the electricity rate from the grid [31] are predicted to intersect around the year 2040 with a generation cost of ~USD 0.397/kWh. Therefore, industrial consumers may consider defecting from the grid around 2041. The reduced electricity costs will consequently improve the investment quality of rooftop solar PV installation.
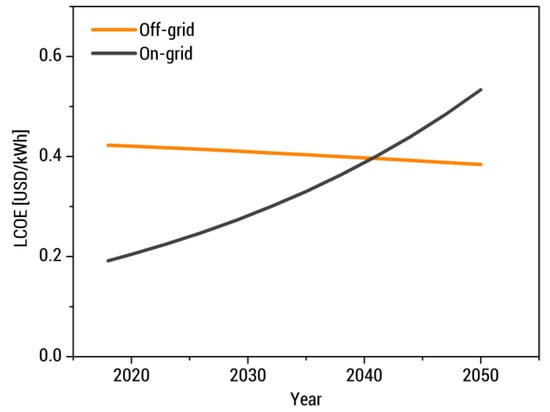
Figure 15.
Grid defection analysis results showing off-grid system LCOE and the projected retail electricity price in the MERALCO franchise area in the Philippines.
4. Conclusions
In this work, we demonstrated a techno-economic assessment framework that can be utilized by policymakers to evaluate the effect of changing policies to encourage more investments from the private sector and by industrial facilities in the Philippines to determine the viability of implementing rooftop solar PV. Additional conclusions from this study are outlined below.
- The untapped rooftop solar PV potential of the sampled industrial establishments is about 1035 MWp under the current net metering policy of the Philippines. This installed capacity is comparable to a large-scale coal power plant in the Philippines, which ranges from 500 to 1200 MW.
- Relaxing the 100 kWp net metering restriction will increase the total rooftop solar PV potential to 4654 MWp, concurring our initial results on the impact of net metering policies on the deployment of solar PV-based energy systems.
- A decline in the performance of economic indicators such as IRR and PBP was observed under the Max Roof Capacity scenario for several sub-industries due to the increase in capital investment requirements.
- Energy intensive industries such as Electrical and Semiconductors, Cement and Concrete, Steel and Metals, and Textile and Garments will greatly benefit from the integration of rooftop solar PV due to increased savings, higher investment quality, and reduced CO2 emissions.
- Some industrial plants can be powered by off-grid hybrid systems. The viability of this configuration depends on the load profile and rooftop solar PV potential.
- The optimum installed capacities, economic parameters, and investment efficiencies are highly dependent on solar PV and lithium-ion battery prices.
- Grid defection for some industrial establishments within the MERALCO franchise may occur as solar PV and lithium-ion batteries prices are declining continuously.
This framework can be applied to other electricity consumers, such as commercial and government establishments. The study can also be extended to other distribution utilities in the Philippines to create a nationwide rooftop solar PV resource assessment. Such a study may reduce land allocation for ground-mounted solar PV installations. Different compensation schemes for prosumers can also be investigated as this will affect the viability of rooftop solar PV systems, which could be patterned after net metering policies in other countries. Lastly, technical considerations, such as solar tracking, can be incorporated in future work.
Author Contributions
Conceptualization and methodology by P.G.B.J. and J.D.O., data gathering and analysis, methodology, simulation, and running of scripts was done by P.G.B.J. Development of ISLA scripts, debugging and running ISLA done by M.T.C. Writing—original draft preparation was done by P.G.B.J., M.T.C. and E.A.E.J. Writing—review, editing and supervision was done by E.A.E.J. and J.D.O. Funding acquisition was done by J.D.O. All authors have read and agreed to the published version of the manuscript.
Funding
This research is part of the Energy Research Fund (ERG) project entitled “ElectriPHI—Electrification Planning in Small Off-grid Islands in the Philippines” funded through the University of the Philippines Office of the Vice-President for Academic Affairs (UP OVPAA) and the Senate Committee on Energy led by Sen. Sherwin T. Gatchalian.
Acknowledgments
P.B.J. would like to thank Manila Electric Company (MERALCO) for the support on the conduct of the research. J.O. would like to acknowledge the Federico Puno Professorial Chair Award and the US-ASEAN Science & Technology Fellowship. M.T.C. would like to acknowledge the Department of Science and Technology Science Education Institute (DOST-SEI) Merit Scholarship Program and the DOST-SEI Engineering Research and Development for Technology (ERDT) Graduate Scholarship.
Conflicts of Interest
The authors declare no conflict of interest.
Nomenclature
| Abbreviation | Meaning |
| ILP | Interruptible Load Program |
| IRR | internal rate of return |
| ISLA | Island System LCOEmin Algorithm |
| LCOE | levelized cost of electricity |
| MERALCO | Manila Electric Railroad and Light Company |
| NGEF | national grid emission factor |
| NPV | net present value |
| PBP | payback period |
| PV | photovoltaic |
Appendix A
The economic values used in this work are presented in Table A1. Most of these are based on 1st Quarter 2019 Philippine market prices. The operating cost, project duration, and asset life are based on an existing study.
Table A1.
Economic values and assumptions used in this work.
Table A1.
Economic values and assumptions used in this work.
| Economic Data | Value | Reference |
|---|---|---|
| Discount rate | 4% | 1Q Forecast for 2019 [28] |
| Inflation rate | 2.08% | 1Q Forecast for 2019 [32] |
| Grid price | 0.19 USD/kWh | 1Q 2019 Average Local DU 1 Rate [33] |
| Net metering rate | 0.076 USD/kWh | 1Q 2019 Average Local DU 1 Rate [33] |
| Project duration | 25 years | |
| Solar PV capital cost | 1133.5 USD/kW | Based on 1Q 2019 market price of surveyed solar PV panels. Includes cost of polycrystalline solar PV panels, inverter, and frames |
| Solar PV annual operational costs | 23.85 USD/kW | Based on previous study [3] |
| Solar PV material life | 25 years | Based on previous study [3] |
| Diesel fuel price | 0.59 USD/L | Department of Energy [34] |
| Fuel inflation rate | 4.08% | From EIA 2 forecast up to 2050 [35] |
| Diesel generator capital cost | 534.48 USD/kW | Based on 1Q 2019 market price of surveyed diesel generators |
| Diesel generator operating cost | 0.05 USD/kW/year | Based on previous study [3] |
| Diesel generator equipment life | 10 years | Based on previous study [3] |
| Lead–acid battery capital cost | 157.06 USD/kWh | Based on 1Q 2019 market price of surveyed deep cycle lead–acid batteries |
| Lithium-ion battery capital cost | 922.9 USD/kWh | Based on 1Q 2019 market price of surveyed lithium-ion Batteries |
| Charge controller capital cost | 385.3 USD/kWh | Based on 1Q 2019 market price of surveyed battery charge controllers |
1 DU—distribution utility, 2 EIA—Energy Information Administration.
Appendix B
The technical values used in this work are presented in Table A2. These are the specifications of equipment often used by customers of the local distribution utility (MERALCO), except for several battery parameters which were based on an existing study.
Table A2.
Technical values and assumptions used in this work.
Table A2.
Technical values and assumptions used in this work.
| Technical Data | Value |
|---|---|
| Polycrystalline solar PV panel area | 6.42 m2 per 255 W module |
| Polycrystalline solar PV derating factor | 0.77 |
| Polycrystalline solar PV temperature coefficient | 0.004167 °C−1 |
| Diesel generator spinning reserve [36] | 15% |
| Maximum depth of discharge of battery [37] | 0.8 |
| Charging efficiency of battery [37] | 0.895 |
| Discharging efficiency of battery [37] | 0.895 |
| Maximum number of cycles for lead–acid battery | 1500 |
| Maximum number of cycles for lithium-ion battery | 5000 |
References
- Department of Trade and Industry Philippines Gross Domestic Product (GDP) Report. Available online: https://www.dti.gov.ph/resources/statistics/gross-domestic-product-gdp (accessed on 1 March 2020).
- Lectura, L. Average Electricity Price in PHL 2nd Highest in Asia—Think Tank. Available online: https://businessmirror.com.ph/2018/08/07/average-electricity-price-in-phl-2nd-highest-in-asia-think-tank/ (accessed on 1 September 2018).
- Ocon, J.D.; Bertheau, P. Energy Transition from Diesel-based to Solar Photovoltaics-Battery-Diesel Hybrid System-based Island Grids in the Philippines—Techno-Economic Potential and Policy Implication on Missionary Electrification. J. Sustain. Dev. Energy Water Environ. Syst. 2019, 7, 139–154. [Google Scholar] [CrossRef]
- Abidin, N.I.A.; Zakaria, R.; Pauzi, N.N.M.; Alqaifi, G.N.; Sahamir, S.R.; Shamsudin, S.M. Energy efficiency initiatives in a campus building. Chem. Eng. Trans. 2017, 56, 1–6. [Google Scholar]
- Xin-Gang, Z.; Yi-Min, X. The economic performance of industrial and commercial rooftop photovoltaic in China. Energy 2019, 187, 115961. [Google Scholar] [CrossRef]
- Chiaroni, D.; Chiesa, V.; Colasanti, L.; Cucchiella, F.; D’Adamo, I.; Frattini, F. Evaluating solar energy profitability: A focus on the role of self-consumption. Energy Convers. Manag. 2014, 88, 317–331. [Google Scholar] [CrossRef]
- Ghosh, S.; Nair, A.; Krishnan, S. Techno-economic review of rooftop photovoltaic systems: Case studies of industrial, residential and off-grid rooftops in Bangalore, Karnataka. Renew. Sustain. Energy Rev. 2015, 42, 1132–1142. [Google Scholar] [CrossRef]
- Lorenzo, C.; Narvarte, L. A Comparative Economic Feasibility Study of Heating and Cooling. Energies 2020, 13, 4114. [Google Scholar] [CrossRef]
- Mousa, O.B.; Taylor, R.A.; Shirazi, A. Multi-objective optimization of solar photovoltaic and solar thermal collectors for industrial rooftop applications. Energy Convers. Manag. 2019, 195, 392–408. [Google Scholar] [CrossRef]
- Abdin, G.C.; Noussan, M. Electricity storage compared to net metering in residential PV applications. J. Clean. Prod. 2018, 176, 175–186. [Google Scholar] [CrossRef]
- Energy Regulatory Commission. Energy Regulatory Commission Rules Enabling the Net-Metering Program for Renewable Energy; Energy Regulatory Commission: Cebu, Philippines, 2013. [Google Scholar]
- Farias-Rocha, A.P.; Hassan, K.M.K.; Malimata, J.R.R.; Sánchez-Cubedo, G.A.; Rojas-Solórzano, L. Solar photovoltaic policy review and economic analysis for on-grid residential installations in the Philippines. J. Clean. Prod. 2019, 223, 45–56. [Google Scholar] [CrossRef]
- Deutsche Gesellschaft für Internationale Zusammenarbeit (GIZ) GmbH. It’s More Sun in the Philippines: Facts and Figures on Solar Energy in the Philippines; Renewable Energy Developers Center: Makati City, Philippines, 2013; Volume 3, pp. 1–20. [Google Scholar]
- Thakur, J.; Chakraborty, B. Impact of compensation mechanisms for PV generation on residential consumers and shared net metering model for developing nations: A case study of India. J. Clean. Prod. 2019, 218, 696–707. [Google Scholar] [CrossRef]
- Jara, P.G.B.; Castro, M.T.; Esparcia, E.A.; Odulio, C.M.F.; Ocon, J.D. Cost Saving Potential of Grid-tied Solar Photovoltaic-based Hybrid Energy System in the Philippine Industrial Sector. Chem. Eng. Trans. 2019, 76, 937–942. [Google Scholar]
- Saviuc, I.; Peremans, H.; Van Passel, S.; Milis, K. Economic Performance of Using Batteries in European Residential Microgrids under the Net-Metering Scheme. Energies 2019, 12, 165. [Google Scholar] [CrossRef]
- Energy Regulatory Commission. Energy Regulatory Commission Resolution No. 5 Series of 2015—A Resolution Adopting the Amended Rules to Govern the Interruptible Load Program; Energy Regulatory Commission: Cebu, Philippines, 2015. [Google Scholar]
- Montgomery, D.C.; Runger, G.C. Applied Statistics and Probalisty for Engineers; Wiley: Hoboken, NJ, USA, 2014; ISBN 9781118539712. [Google Scholar]
- PSA 2012 Census of Philippine Business and Industry—Economy-Wide for All Establishments: Final Results. 2015. Available online: https://psa.gov.ph/content/2012-census-philippine-business-and-industry-economy-wide-all-establishments-final-results (accessed on 5 September 2018).
- Syaputra, S.D.T. Prediction of Worldwide Energy Resource (POWER), Solar Irradiance and Temperature Data Sets; Center for Open Science: Charlottesville, VA, USA, 2019. [Google Scholar]
- Ocon, J.D.; Cruz, S.M.M.; Castro, M.T.; Aviso, K.B.; Tan, R.R.; Promentilla, M.A.B. Optimal Multi-criteria Selection of Hybrid Energy Systems for Off-grid Electrification. Chem. Eng. Trans. 2018, 70, 367–372. [Google Scholar]
- Kouhestani, F.M.; Byrne, J.; Johnson, D.; Spencer, L.; Hazendonk, P.; Brown, B. Evaluating solar energy technical and economic potential on rooftops in an urban setting: The city of Lethbridge, Canada. Int. J. Energy Environ. Eng. 2018, 10, 13–32. [Google Scholar] [CrossRef]
- Subramanyam, V.; Jin, T.; Novoa, C. Sizing a renewable microgrid for flow shop manufacturing using climate analytics. J. Clean. Prod. 2020, 252, 119829. [Google Scholar] [CrossRef]
- Leite, G.D.N.P.; Weschenfelder, F.; Araújo, A.M.; Villa, A.A.O.; Neto, N.D.F.P.; Kraj, A. An economic analysis of the integration between air-conditioning and solar photovoltaic systems. Energy Convers. Manag. 2019, 185, 836–849. [Google Scholar] [CrossRef]
- Lee, J.; Chang, B.; Aktas, C.B.; Gorthala, R. Economic feasibility of campus-wide photovoltaic systems in New England. Renew. Energy 2016, 99, 452–464. [Google Scholar] [CrossRef]
- Wu, Y.; Wang, J.; Ji, S.; Song, Z.; Ke, Y. Optimal investment selection of industrial and commercial rooftop distributed PV project based on combination weights and cloud-TODIM model from SMEs’ perspectives. J. Clean. Prod. 2019, 234, 534–548. [Google Scholar] [CrossRef]
- DOE 2015–2017 National Grid Emission Factor (NGEF). Available online: https://www.doe.gov.ph/national-grid-emission-factor-ngef (accessed on 22 June 2019).
- Philippines Interest Rate. Available online: https://tradingeconomics.com/philippines/interest-rate (accessed on 22 June 2019).
- Grace, A.M.Y.; Henbest, S.; Giannakopoulou, E.; Kimmel, M. Bloomberg New Energy Finance—New Energy Outlook 2018. Available online: https://bnef.turtl.co/story/neo2018?teaser=true (accessed on 15 January 2019).
- Schmidt, O.; Melchior, S.; Hawkes, A.; Staffell, I. Projecting the Future Levelized Cost of Electricity Storage Technologies. Joule 2019, 3, 81–100. [Google Scholar] [CrossRef]
- Ver, A.A. The Real Price of Electricity in the Philippines, 2018–2029. Available online: https://opinion.inquirer.net/118590/the-real-price-of-electricity-in-the-philippines-2018-2029%0A (accessed on 6 October 2019).
- Philippines Inflation Rate. Available online: https://tradingeconomics.com/philippines/inflation-cpi (accessed on 21 June 2019).
- MERALCO Rates Archives. Available online: https://company.meralco.com.ph/news-and-advisories/rates-archives (accessed on 22 June 2019).
- Department of Energy DOE Oil Monitor. Available online: https://www.doe.gov.ph/oil-monitor (accessed on 10 March 2019).
- U.S. Energy Information Adminidtration. Energy Information Administration International Energy Outlook 2019. Available online: https://www.eia.gov/outlooks/aeo/ (accessed on 30 March 2019).
- Ramírez, L.E.L.; Sánchez, H.T.; Martínez, F.A.P. Spinning reserve analysis in a microgrid. DYNA 2015, 82, 85–93. [Google Scholar] [CrossRef]
- Bortolini, M.; Gamberi, M.; Graziani, A. Technical and economic design of photovoltaic and battery energy storage system. Energy Convers. Manag. 2014, 86, 81–92. [Google Scholar] [CrossRef]


© 2020 by the authors. Licensee MDPI, Basel, Switzerland. This article is an open access article distributed under the terms and conditions of the Creative Commons Attribution (CC BY) license (http://creativecommons.org/licenses/by/4.0/).