Article

Impedance Modeling and Stability Analysis of VSG Controlled Grid-Connected Converters with Cascaded Inner Control Loop

College of Electrical Engineering, Zhejiang University, Hangzhou 310027, China
*
Author to whom correspondence should be addressed.
Energies 2020, 13(19), 5114; https://doi.org/10.3390/en13195114
Submission received: 25 August 2020 / Revised: 26 September 2020 / Accepted: 29 September 2020 / Published: 1 October 2020
(This article belongs to the Special Issue Electric Power Systems Research 2020)

Abstract

:
This paper develops the impedance models of grid-connected converters under the virtual synchronous generator (VSG) strategy with a cascaded inner control loop and analyzes the system stability of VSG controlled converters with different kinds of weak grid. Different from existing small-signal models with high dimensions, a single-in-single-out (SISO) impedance model with simple mathematical expression is obtained in this paper, which is applied to identify the influence of the cascaded control loop on impedance characteristics and system stability. It is found that the impedance characteristics of VSG controlled converters can become capacitive below the fundamental frequency, and it is mainly caused by the voltage controller in the cascaded control loop of the VSG strategy. Impedance-based stability analysis shows that the capacitive impedance characteristics can benefit the compatibility of converters operated with the series-compensated weak grid, but may deteriorate the system stability with the inductive weak grid, which can be avoided by increasing the proportional coefficients of the cascaded voltage and current controllers or applying a larger virtual resistor to reduce the negative resistance in the capacitive frequency range. Experiments based on the control-hardware-in-loop (CHIL) platform were carried out to verify the developed analytical models and possible system instable cases.

Graphical Abstract

1. Introduction

With the development of renewable energy, the penetration of renewable energy generation systems (REGS) in the power system is gradually increasing. Most of the REGS connect to the grid through grid-connected converters and the grid-following control effects of the converters prevent REGS from providing inertial support to the power system. To address this problem, the concept of virtual synchronous generators (VSGs) is put forward, which emulates the behavior of traditional synchronous generators (SGs) and adds inertial to the power system by containing the mathematical model of a SG [1].
REGS usually connects to the weak grid with high impedance due to the long-distance transmission lines. In some places, series compensation devices are added to the weak grid to enhance transmission capability [2]. As reported in [3,4], stability accidents can be caused when the characteristics of the converter-based REGS do not match the connected weak grid. Thus, it is important to analyze the stability of VSG controlled converter system with the weak grid for practical applications.
The impedance-based stability analysis method is widely applied to analyze the stability of the grid-converter interconnected system [5,6]. In this method, the characteristics of the converter and the connected grid are described by their impedance models, respectively; the system stability can be analyzed with the impedance ratio of the converter and the connected grid; and the impedance ratio must satisfy the Nyquist stability criterion in order for the interconnected system to be stable [7].
The small-signal modeling and the impedance modeling of grid-connected converters under a typical VSG control strategy is analyzed in [8,9,10,11,12,13,14], where the output voltage reference from SG models is directly used to generate the PWM signals for converters as proposed in [15]. In [8], a line-frequency-averaged small-signal model is developed to design the power loop of the typical VSG strategy. In [9,10], small-signal state-space models are developed for VSG controlled converters with the connected grid, and critical parameters for system stability are identified with the eigenvalue analysis and the parameter sensitivity analysis. It is also found in [11,12,13,14] that the impedance characteristics of grid-connected converters under this typical VSG control strategy is generally inductive with relatively low magnitude, which is more compatible with the inductive weak grid than the traditional grid-following converter with a phase-locked loop (PLL), but grid-connected converters under this typical VSG control strategy also have the low-frequency oscillation risk with the series-compensated network similar as traditional SGs.
In practice, different implementations of VSG control strategy have been proposed [16,17,18,19,20]. In [18,19,20], a cascaded inner voltage–current control loop is adopted to regulate the output voltage reference from SG models. Virtual impedance control is also applied to emulate the quasi-stationary characteristics of the synchronous impedance in a traditional SG. Compared with above-mentioned typical VSG control strategy with direct open loop PWM control in [8,9,10,11,12,13,14,15], the cascaded inner control loop in the VSG strategy in [18,19,20] can conveniently implement the limitations and saturations of voltage and current outputs, which is a significant requirement to improve the current control capability and guarantee the safe operation of converters.
Recently, some small-signal modeling and analysis are carried to analyze the system stability of weak grid and the VSG controlled converters with cascaded inner control loop. In [18], a small-signal state-space model is developed to analyze the grid-converter interconnected system, and the system stability is assessed by eigenvalue analysis and the parametric sensitivities, while the impedance characteristics are not investigated. In [21], impedance models are transformed from the linearized state-space model, and the stability of this grid-converter interconnected system is mainly analyzed in the high frequency range (above 500 Hz) where the control effects of the cascaded control loop is relatively limited. In [22], grid-connected converters under the power synchronization control and the vector control are compared with the developed dq-axis impedance models, and opposite characteristics of system stability are found between two control strategies.
However, it should be noted that the existing state-space model in [22] and the existing impedance models in [21,22] are all high-dimensional small-signal models, thus the characteristics of the VSG controlled converters can only be analyzed with a group of bode plots or with pole maps. Besides, the impedance model in [21] and the determinant of dq-axis impedance ratio matrix in [22] both lack mathematical expressions to insightfully analyze and quantify the impedance shaping effects of the cascaded control loop.
Therefore, an impedance model with simple mathematical expression is required and this paper will develop a novel single-in-single-out (SISO) impedance model with simple mathematical expression from the small-signal modeling of the VSG controlled converters with cascaded inner control loop. The applicable frequency range of the developed SISO impedance model is verified in the low frequency range (1–100 Hz), where the impedance characteristics are focused in this paper. The developed SISO impedance model is also applied to analyze the influence of the cascaded inner control loop on impedance characteristics and system stability.
The main contributions of this paper can be concluded as:
(1)
A novel SISO impedance model with simple mathematical expression is developed to analyze the impedance characteristics of the VSG controlled grid-connected converters with the cascaded inner control loop.
(2)
Based on the developed SISO impedance model, the analysis on how the impedance characteristics are shaped by controllers in the cascaded inner control loop is provided.
(3)
Impedance-based system stability of VSG controlled converters with different kinds of weak grid is analyzed, and the influence of cascaded inner control loop on possible system instabilities are quantified by differentiating the expression of developed SISO impedance model.
The rest of this paper is organized as follows. In Section 2, detailed small-signal modeling of the VSG controlled converters with cascaded inner control loop is carried out. Section 3 obtains the SISO impedance models from the developed small-signal models and analyzes the impedance characteristics of VSG controlled converters. Section 4 identifies the influence of cascaded inner control loop on impedance characteristics and quantifies the influence of the control parameters. In Section 5, the impedance-based analysis is carried out to analyze the system stability of VSG controlled converters with different kinds of weak grid, based on which possible causes of system instability are also identified. Experiments based on the control-hardware-in-loop (CHIL) platform are presented to validate the developed models and the possible system instable cases. Finally, Section 6 concludes this work.

2. Small-Signal Modeling of VSG Controlled Converters with Cascaded Inner Control Loop

In this section, detailed small-signal modeling of the VSG controlled converters is carried out by applying the multi-harmonic linearization method as in [23,24,25,26]. The small-signal characteristics are described by a developed 2 × 2 order admittance matrix model, and CHIL-based frequency sweeping test is applied to validate the correctness of the developed small-signal models.

2.1. VSG Control Strategy with Cascaded Inner Control Loop

In this paper, the VSG strategy as in [18] is applied. In this VSG strategy, the inertial and damping characteristics of traditional SGs are implemented with a swing equation as:
d ω p u d t = P r e f J P J D p ( ω p u ω g , p u ) J
In (1), the per unit angular speed ωpu is determined by the integral of the active power balance between the active power reference Pref and the measured active power P. The damping characteristics of traditional SGs are emulated by a damping active power, which is defined by the damping coefficient Dp with the difference between the per unit angular speed ωpu and the per unit angular frequency of the connected grid ωg,pu. For VSG controlled converters, the per unit angular speed ωpu equals to the grid frequency ωg,pu in a stable grid-connected operating state, and ωg,pu of a normal power grid equals 1 in steady operating state.
Then, the virtual rotor angular position θ can be calculated by the integral of the per unit angular speed ωpu with the base of angular speed ωbase as:
d θ d t = ω p u ω b a s e
In this applied VSG strategy, the virtual back electrical magnetic field (EMF) ψf is regulated by reactive power control as:
d ψ f d t = K ( Q r e f Q + Q d ) ,   Q d = D q ( | V r e f | | V | )
where the virtual EMF is determined by the integral of the reactive power balance among reactive power reference Qref, the measured reactive power Q, and the damping reactive power Qd. The damping reactive power Qd is defined by the damping coefficient Dq and the difference between the voltage magnitude reference |Vref| and the measured voltage magnitude of the converter. In steady operating state, |Vref| is set to 1.0.
When adopting a cascaded inner control loop with virtual impedance in the VSG strategy, the dq-axis voltage references for modulations are selected as the output references of the cascaded control loop, otherwise the virtual EMF is directly selected as d-axis voltage reference.
In this paper, the configuration and applied VSG control strategy of the grid-connected converter system are shown in Figure 1, where the switch of modulation references turns to the upper side to select the output references of the cascaded control with the adoption of cascaded control.

2.2. Definition of Small-Signal Models

In small-signal modeling, the characteristics of grid-connected converters can be described by the relationship between the ac-terminal voltage small-signal perturbations and corresponding current responses. Since the frequency coupling effect, as analyzed in [23,24,25,26,27], exists in converters, the component at a given frequency fp and another component at the frequency fp − 2f1 always coexist in small-signal modeling, where f1 is the fundamental frequency of the system.
Following the same notation as in [23,24,25], in the frequency domain, the perturbed components of system voltages and currents can be defined as:
i ^ = [ I ^ p I ^ p 2 ] T , v ^ = [ V ^ p V ^ p 2 ] T
where I ^ p , V ^ p , I ^ p 2 , and V ^ p 2 are components at frequency fp and frequency fp − 2f1, respectively, and the symbol “^” means perturbing components.
Then, the small-signal models of VSG controlled converters can be described by a 2 × 2 order admittance matrix YVSG as in [23,24,25], and the degree of frequency coupling effect is represented by the magnitude ratio of the off-diagonal elements to the diagonal elements.
[ I ^ p I ^ p 2 ] = [ Y 11 ( s ) Y 12 ( s ) Y 21 ( s ) Y 22 ( s ) ] Y V S G [ V ^ p V ^ p 2 ]

2.3. Small-Signal Modeling of VSG Control Strategy

2.3.1. Modeling of Power Relationship

In converter system, active and reactive power can be calculated with voltages and currents as:
P ( t ) = v a ( t ) i a ( t ) + v b ( t ) i b ( t ) + v c ( t ) i c ( t )
Q ( t ) = 1 3 ( v b c ( t ) i a ( t ) + v c a ( t ) i b ( t ) + v a b ( t ) i c ( t ) )
In small-signal modeling, the active and reactive power fluctuations can be expressed with the voltage perturbations and current responses by linearizing (6) and (7) as:
[ P ^ ] = [ I 1 * I 1 ] G v 2 p [ V ^ p V ^ p 2 ] + [ V 1 * V 1 ] G i 2 p [ I ^ p I ^ p 2 ] [ Q ^ ] = [ j I 1 * j I 1 ] G v 2 q [ V ^ p V ^ p 2 ] + [ j V 1 * j V 1 ] G i 2 q [ I ^ p I ^ p 2 ]
where P ^ and Q ^ are perturbed power components at frequency fpf1; I1 and V1 are fundamental components of PCC current and voltage in p.u.; * means conjugate operation; and Gv2p, Gv2q, Gi2p, and Gi2q describe the relationship between power fluctuations and voltage/current perturbations.

2.3.2. Modeling of Active and Reactive Power Control

According to Figure 1, the virtual rotor angular position is affected by active power fluctuations and can be written as:
[ θ ^ ] = G p 2 θ [ P ^ ] , G p 2 θ = ω b a s e / s J s + D p
where s = j2π(fpf1), ωbase = 2πf1, and θ ^ is the perturbed component of virtual rotor angular position at frequency fpf1.
According to the reactive power control in Figure 1, the perturbed virtual back EMF ψf can be expressed with the reactive power and voltage fluctuations as:
[ ψ ^ ] = G q 2 ψ ( Q ^ + G m 2 q | V ^ | ) ,   G q 2 ψ = K / s , G m 2 q = D q
| V ^ | = G v 2 m [ V ^ p V ^ p 2 ] T ,   G v 2 m = [ V 1 * V 1 ]
where s = j2π(fp − f1), ψ ^ is the perturbed component of ψf at frequency fp − f1, K is the coefficient of the integral controller, and Dq is the coefficient of voltage droop controller.

2.3.3. Modeling of Cascaded Inner Control Loop with Virtual Impedance

According to Figure 1, in small-signal modeling, the perturbed dq-axis output voltage references can be expressed with perturbed virtual EMF output, perturbed dq-axis PCC voltages, perturbed dq-axis PCC currents, and perturbed dq-axis output currents of the converter as:
[ E ^ d E ^ q ] = T d q , ψ [ ψ ^ ] + T d q , v [ V ^ d V ^ q ] + T d q , i [ I ^ d I ^ q ] + T d q , i g [ I ^ g d I ^ g q ]
where s = j2π(fpf1); E ^ d , E ^ q , V ^ d , V ^ q , I ^ d , I ^ q , I ^ g d , and I ^ g q are components at frequency fpf1; and matrices Tdq,ψ, Tdq,v, Tdq,I, and Tdq,ig are defined for abbreviation as:
T d q , ψ = [ H v ( s ) H i ( s ) 0 ] ,   T d q , v = [ H v ( s ) H i ( s ) K F F v C f H i ( s ) C f H i ( s ) H v ( s ) H i ( s ) K F F v ] , T d q , i = [ R v H v ( s ) H i ( s ) L v H v ( s ) H i ( s ) L v H v ( s ) H i ( s ) R v H v ( s ) H i ( s ) ] ,   T d q , i g = [ H i ( s ) L f L f H i ( s ) ]
Since the cascaded control is carried out in dq-frame, the perturbed components of the virtual rotor angular position will also affect the dq-axis output voltage references. The perturbed dq-axis voltages and currents satisfy:
[ V ^ d V ^ q ] T = T p n 2 d q [ V ^ p V ^ p 2 ] T + T θ , v [ θ ^ ]
[ I ^ d I ^ q ] = T p n 2 d q [ I ^ p I ^ p 2 ] + T θ , i [ θ ^ ]
[ I ^ g d I ^ g q ] = T p n 2 d q [ I ^ g p I ^ g p 2 ] + T θ , i g [ θ ^ ]
where θ0, φv1, φi1, and φig1 are the initial angle of the virtual rotor angular position, PCC voltage, PCC current, and output current of the converter, respectively, and matrices Tpn2dq and Tθ,x (x = v, i, ig) are defined for abbreviation as:
T p n 2 d q = [ e j θ 0 e j θ 0 j e j θ 0 j e j θ 0 ] ,   T θ , x = [ X 1 , p u sin ( φ x 1 θ 0 ) X 1 , p u cos ( φ x 1 θ 0 ) ]
According to the LC filter structure of the converter, the relationship between the perturbed output current and PCC voltage and current can be represented as:
[ I ^ g p I ^ g p 2 ] T = [ I ^ p I ^ p 2 ] T + Y c f [ V ^ p V ^ p 2 ] T
where s = j2πfp and matrix Ycf is the admittance of the filter resistor Rf and filter capacitor Cf as:
Y c f = d i a g { 1 s C f + R f , 1 ( s 2 j ω 1 ) C f + R f } 1
Then, by substituting (14)–(19) into (12), the perturbed dq-axis output voltage references of the cascaded control loop satisfy:
[ E ^ d E ^ q ] = G ψ 2 E [ ψ ^ ] + G v 2 E [ V ^ p V ^ p 2 ] + G i 2 E [ I ^ p I ^ p 2 ] + G θ 2 E [ θ ^ ]
where detailed expressions of Gψ2E, Gv2E, Gi2E, and Gθ2E are as:
G ψ 2 E = [ H v ( s ) H i ( s ) 0 ] T
G v 2 E = T d q , v T p n 2 d q + T d q , i g T p n 2 d q Y c f
G i 2 E = T d q , i T p n 2 d q + T d q , i g T p n 2 d q
G θ 2 E = T d q , v T θ , v + T d q , i T θ , i + T d q , i g T θ , i g

2.3.4. Modeling of Modulation

According to Figure 1, the output current of the converter and the terminal voltage of converter in a/b/c-phase can be expressed as:
L f d i g x ( t ) d t = V g x ( t ) V x ( t )
V g x ( t ) = K m V d c E x ( t )
where x = a,b,c indicating that, for variables in a/b/c-phase, Km is the modulating coefficient and Vdc is the dc-link voltage.
In small-signal modeling, the perturbed voltage references in sequence domain can be transformed from dq-axis as:
[ E ^ p E ^ p 2 ] = ( T p n 2 d q ) 1 { [ E ^ d E ^ q ] + [ E 1 sin ( φ e 1 θ 0 ) E 1 cos ( φ e 1 θ 0 ) ] [ θ ^ ] }
where φe1, E ^ p , and E ^ p 2 are the initial angle and the components at frequency fp and fp − 2f1 of the output voltage references from the cascaded inner control loop, respectively.
By substituting (27) into (25) and (26), and considering the filter admittance in (19), the perturbed current can be described with voltage perturbations, the perturbed voltage references, and the perturbed virtual angular position as:
[ I ^ p I ^ p 2 ] = G v 2 i [ V ^ p V ^ p 2 ] + G E 2 i [ E ^ d E ^ q ] + G θ 2 i [ θ ^ ]
G v 2 i = d i a g { 1 s L f , 1 ( s j 2 ω 1 ) L f } Y c f
G E 2 i = d i a g { K m ( s ) V d c s L f K m ( s j 2 ω 1 ) V d c ( s j 2 ω 1 ) L f } ( T p n 2 d q ) 1
G θ 2 i = [ j 2 K m ( s ) V d c E 1 s L f j 2 K m ( s j 2 ω 1 ) V d c E 1 * ( s j 2 ω 1 ) L f ] T
where s = j2πfp, ω1 = 2πf1, and E1 is the fundamental component of the output voltage reference; the sampling and control delay is modeled in the transfer function Km(s).

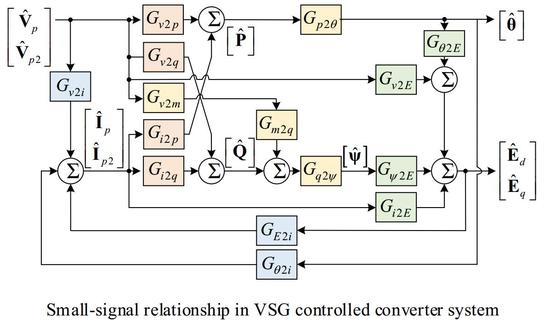
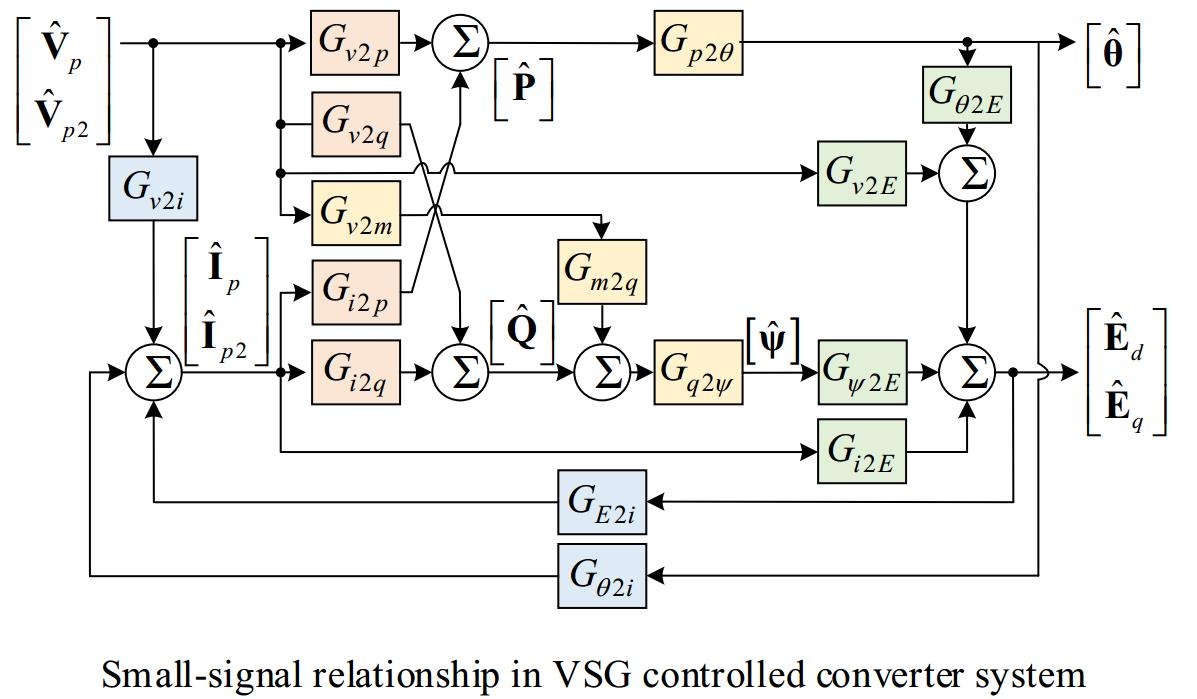
2.4. Small-Signal Models of VSG Controlled Converter System

The block diagram shown in Figure 2 can be used to describe the small-signal relationship in the VSG controlled converter system, where blocks in four different colors correspond to the above modeling of power relationship, power control, cascaded inner control loop, and modulation, respectively.
Then, based on the small-signal relationship in Figure 2 and the model definition in (2), the small-signal models of the VSG controlled converter can be obtained as:
Y V S G = ( I M i ) 1 M v
where I is a unit matrix and Mi and Mv are abbreviated as:
M i = G θ 2 i G p 2 θ G i 2 p + G E 2 i ( G i 2 E + G θ 2 E G p 2 θ G i 2 p + G ψ 2 E G q 2 ψ G i 2 q )
M v = G v 2 i + G θ 2 i G p 2 θ G v 2 p + G E 2 i ( G v 2 E + G θ 2 E G p 2 θ G v 2 p + G ψ 2 E G q 2 ψ ( G v 2 q + G m 2 q G v 2 m ) )
To validate the correctness of the developed small-signal models in (32), frequency sweeping experiments based on CHIL platform were applied to obtain the measured small-signal models as in [23,24,25]. Detailed introductions about the frequency sweeping test are given in [28], and the picture of the CHIL platform is given in Figure 3. The main circuit of the grid-connected converter system was emulated in the Typhoon HIL 602+ platform with the time step of 1 µs. Controllers were implemented on a TMS320F28335 DSP+FPGA control board and the sampling and switching frequency was set as 5 kHz. System and control parameters of the VSG controlled converter system are listed in Table 1. The control bandwidths of active power controller, reactive power controller, the cascaded voltage controller, and current controller were 1.7, 2.2, 54, and 155 Hz, respectively.
The measurements from the frequency sweeping test and analytical small-signal models YVSG in (32) are plotted in Figure 4. From the results in Figure 4, the following conclusions can be obtained:
(1)
The analytical small-signal models YVSG in (32) are in accordance with the measured results, which proves that the developed small-signal models of VSG controlled converters with cascaded inner control loop are correct.
(2)
The magnitude of off-diagonal elements in the developed admittance matrix YVSG is lower than the diagonal elements except around the fundamental frequency, which means the frequency coupling effect can be ignored except near the fundamental frequency.

3. Impedance Models and Impedance Characteristics of VSG Controlled Converter System

In this section, a SISO impedance model with simple mathematical expressions is simplified from above small-signal models in (32), based on which the impedance characteristics of the VSG controlled converter system with the cascaded inner control loop are analyzed.

3.1. A Simplified SISO Impedance Model

When focusing on the impedance shaping effects of cascaded inner control loop, the following simplifications can be applied to the developed small-signal models YVSG in (32) to obtain a simpler expression to benefit following impedance analysis.
Firstly, since the control effects of the cascaded voltage–current controller are relatively limited outside their control bandwidths, the sampling and control delay modeled by Km(s) can be ignored below 500 Hz (1/10 of the switching frequency 5 kHz). The resonance frequency of the filter inductor and filter capacitor is about 650 Hz; thus, the influence of delay and filter capacitor are seen as the characteristics in the high frequency range (above 500 Hz), and will not be concerned in the following analysis. Then, under this assumption, Km(s) equals constant gain Km and satisfies Km*Vdc = 1, while the admittance of the filter resistor and filter capacitor in (19) satisfies Ycf = 0.
Secondly, the frequency coupling effects caused by the active and reactive power control are ignored since the control bandwidth of power controller (1–2 Hz) is much smaller than the cascaded voltage and current controller (50–200 Hz). Then, under this assumption, the positive-sequence admittance of VSG controlled converters in (32) can be obtained by calculating Mv(1,1)/(1 − Mi(1,1)), where (1,1) indicates the first row and first line elements in the matrices.
Finally, setting the feedforward gain KFFv = 1 and KFFi = 0, simplifying the expressions according to the control bandwidths of different controllers, and substituting the detailed expressions of Gp2θ in (9) and Gq2ψ in (10), a positive-sequence SISO impedance model can be simplified from (32) as (35). The Appendix A shows the detailed explanation and derivation of the simplified SISO impedance model.
Z p v s g Z v + 1 H v ( s ) + ( s + j 2 π f 1 ) L f H v ( s ) H i ( s ) j 2 ω b a s e J s 2 + D p s j 2 K s
where s = j2π(fpf1) and Zv = Rv + jLv.
Different from existing impedance models with high dimensions in [21,22], the impedance model in (35) is a SISO model with simple mathematical expressions. Thus, the impedance characteristics of the VSG controlled converters with the cascaded inner control loop can be presented with a bode plot of (35), rather than a group of bode plots with pole maps as in [21,22]. The mathematical expression of the SISO impedance model in (35) can also be applied to indicate how each controller shapes the impedance characteristics of the VSG controlled converters and quantify how the impedance characteristics are influenced by the control parameters in the following impedance analysis.

3.2. Validation of Simplified SISO Impedance Model

Before identifying the impedance shaping effects of the cascaded inner control loop, the correctness of the simplified SISO impedance model in (35) should be validated to define the frequency range where the SISO impedance model applies, and the small-signal models YVSG in (32) are used as references.
Since the small-signal models in (32) is a 2 × 2 order admittance matrix, the following conversion, as adopted in [25], is applied to (32):
Y p e q l = Y 11 Y 21 Y 12 Z g p 2 1 + Y 22 Z g p 2 , Z p e q l = 1 Y p e q l
where Y p e q l and Z p e q l are equivalent admittance and impedance model of the small-signal models YVSG in (32) and Zgp and Zgp2 are defined as the impedances of ac-grid at frequency fp and fp − 2f1, respectively.
If the cascaded inner control loop is not adopted in the VSG control strategy, the switch of modulation references in Figure 1 turns to the lower side to directly select the virtual EMF as d-axis voltage reference, and the VSG control strategy becomes the same as in [8,9,10,11,12,13,14]. Then, according to the small-signal relationship shown in Figure 2, the small-signal models without the cascaded inner control loop can be obtained by applying the following simplification in (37) to the developed small-signal models YVSG in (32).
G ψ 2 E = [ 1 0 ] , G v 2 E = [ 0 0 0 0 ] , G i 2 E = [ 0 0 0 0 ] , G θ 2 E = [ 0 0 ]
Similar to (32), the simplified SISO impedance model of VSG controlled converters without cascaded control loop can be solved with (34) as:
Z p v s g , o p ( s + j 2 π f 1 ) L f j 2 ω b a s e J s 2 + D p s j 2 K s
where s = j2π(fpf1).
For VSG controlled converter systems, the simplified SISO impedance model in (32) and the equivalent small-signal model (33) are shown in Figure 5, where the system and control parameters are kept the same as in Table 1. The connected grid is assumed inductive and the corresponding short circuit ratio (SCR) is set to 3. The impedance characteristics of VSG controlled converters without cascaded inner control loop are also plotted for comparison.
Figure 5 shows that, whether the cascaded inner control loop is adopted in the VSG strategy or not, the simplified SISO impedance models in (35) and (38) both accord with the corresponding equivalent small-signal models obtained from (36) in the low frequency range (1–100 Hz). Thus, the simplified SISO impedance model in (35) can be applied to identify the influence of the cascaded inner controller loop within the low frequency range in the following analysis.

3.3. Impedance Characteristics of VSG Controlled Converters with Cascaded Inner Control Loop

Figure 5 also shows that the application of cascaded inner control loop in the VSG strategy can significantly shapes the impedance characteristics of the VSG controlled converters. The impedance characteristics with cascaded inner control loop can be summarized as:
(1)
The magnitude of VSG controlled impedance increases in the wide-band frequency range with the application of cascaded inner control loop.
(2)
The impedance of VSG controlled converters can become capacitive below the fundamental frequency with the application of cascaded inner control loop, while the impedance without cascaded inner control loop is generally inductive.

4. Influence Analysis of the Cascaded Inner Control Loop on Impedance Characteristics

In this section, the capacitive impedance characteristics of the VSG controlled converters with cascaded inner control loop are concerned and the frequency range of interest is selected as the frequency below the fundamental frequency. The SISO impedance model in (32) is applied to identify the specific causes of capacitive impedance characteristics in VSG controlled converters. The influence of control parameters in the cascaded inner control loop is also quantified by differentiating the mathematical expression of the developed SISO impedance models in (32).

4.1. Causes of Capacitive Impedance Characteristics

According to the simplified SISO impedance model in (32), the impedance model can be written as the sum of five parts, where the first three parts are related to the cascaded inner control loop with the virtual impedance and the last two parts are determined by the active and reactive power control. The real and imaginary expressions of (32) can be solved by substituting s = j2π(fpf1) into (32) to obtain equivalent resistance and reactance in p.u. with frequency fp variation as:
R ( f p ) = R v + R h v ( f p ) + R h v h i ( f p ) + R θ ( f p ) + R ψ ( f p ) X ( f p ) = L v + X h v ( f p ) + X h v h i ( f p ) + X θ ( f p ) + X ψ ( f p )
where Rv and Lv are constant virtual resistance and inductance. Expressions of Rhv(fp), Rhvhi(fp), Xhv(fp), and Xhvhi(fp), which are related to the cascaded inner control loop, are listed below with ω = 2π(fp − f1).
R h v ( f p ) = ω 2 k v p 2 ω 2 k v p 2 + k v i 2 , R h v h i ( f p ) = ω 4 L f ( k v i k i p + k v p k i i ) ( k v i k i i ω 2 k v p k i p ) 2 + ω 2 ( k v i k i p + k v p k i i ) 2
X h v ( f p ) = ω k v i 2 ω 2 k v p 2 + k v i 2 , X h v h i ( f p ) = ω 3 L f ( k v i k i i ω 2 k v p k i p ) ( k v i k i i ω 2 k v p k i p ) 2 + ω 2 ( k v i k i p + k v p k i i ) 2
According to (36)–(38), results of equivalent resistance and reactance are plotted in Figure 6, where parameters are the same as in Figure 5.
By comparing the equivalent resistance and reactance in (36) with the results obtained from (37)–(38), conclusions about the causes of capacitive characteristics can be reached from the results in Figure 6:
(1)
Since ω = 2π(fp − f1) < 0 when fp < f1, the reactance obtained from Xhv(fp) in (38) stays negative below the fundamental frequency, which means that the capacitive impedance characteristics are mainly caused by the effects of voltage controller in the cascaded control loop.
(2)
The resistance obtained from Rhvhi(fp) in (37) are negative below the fundamental frequency, which means the control effects of the cascaded voltage–current controller tend to cause negative resistance in this frequency range.
(3)
The resistance and reactance obtained from the Rv and Lv are both positive, which means the virtual impedance control can both reduce negative resistive and capacitive characteristics by choosing positive virtual resistance and virtual inductance.

4.2. Influence of Control Parameters in Cascaded Inner Control Loop

In the following, the simplified SISO impedance model in (32) is differentiated with respect to each related control parameter x, and the real and imaginary parts of this differential expression are calculated to refer to the influence on the equivalent resistance and reactance of the impedance characteristics as:
( d R d x ) p . u . = Re { x d Z p v s g d x } , ( d X d x ) p . u . = Im { x d Z p v s g d x }
Based on the differential expression in (39), the absolute value of (39) can represent the influence ability of this parameter in p.u., and the sign of the real and imaginary part reflects the influence direction of this parameter.
For example, if (dR/dx)p.u. < 0 and |dR/dx|p.u. is not close to zero in a certain frequency range, it represents that decreasing control parameter x will increase the equivalent resistance (equally to reduce the negative resistive characteristics) in this frequency range.
Similarly, if (dX/dx)p.u. > 0 and |dX/dx|p.u. is larger than zero in a certain frequency range, increasing control parameter x will increase the equivalent inductance (equally to reduce the capacitive impedance characteristics) in this frequency range.
The gain and integrator coefficients of the cascaded voltage controller and current controller are calculated with the differential analysis in (39), respectively, and the differential results below the fundamental frequency are given in Figure 7, from which it can be observed that:
(1)
The negative resistive characteristics below the fundamental frequency can be reduced by increasing kip and kvp, or by decreasing kvi, and the influencing ability of kii is as not significant as the other control parameters in cascaded control loop.
(2)
The capacitive impedance characteristics below the fundamental frequency can be reduced by increasing kvp and kvi, and the influence ability of current controller is not as significant as the voltage controller.

5. Impedance-Based System Stability Analysis of VSG Controlled Converters with Weak Grid

In this section, impedance-based stability analysis is carried out to analyze the possible system instability of VSG controlled converters with the different kinds of weak grid. The influence of the cascaded inner control loop on the system stability are also provided by changing the control parameters. CHIL-based experiments were also carried out to validate the instability cases.

5.1. Possible System Instability with Different Weak Grid

The system stability of converters and the connected grid can be analyzed with impedance models. According to the impedance characteristics of VSG controlled converters, the following two conditions with different kinds of weak grid may lead to possible system instability:
(1)
When connecting with the inductive weak grid, the capacitive impedances characteristics that shaped by the cascaded inner control loop may be incompatible with the inductive weak grid, especially when there is negative resistance in the capacitive frequency range.
(2)
When connecting with the series-compensated weak grid, the inductive impedance characteristics of converters may be unmatched with the capacitive grid, while the capacitive impedances characteristics shaped by the cascaded inner control loop can match the capacitive grid better.
In the following, two cases are provided to verify above two possibilities, and the influence of cascaded inner control loop on these possible instabilities are verified by changing the control parameters. CHIL-based experiments were also carried out to validate these cases.

5.2. System Instability with Inductive Weak Grid—A Case Study

In this subsection, a case to verify the possible instability of VSG controlled converters with inductive weak grid is provided. In this case, the parameter kip is decreased from 1.0 to 0.2 p.u., while other parameters are unchanged as in Table 1 and the SCR of the inductive weak grid is kept as 3.
The impedance characteristics of VSG controlled converters with the inductive weak grid and the corresponding Nyquist plot are given in Figure 8. Figure 8a shows that, when adopting the VSG control strategy with cascaded inner control loop, the phase below the fundamental frequency decreases after decreasing the kip, which accords with the analysis in Section 4.2 that the negative resistance in this frequency range can be reduced by increasing kip. In contrast, the impedance of VSG controlled converters without adopting cascaded control loop is generally inductive in the wide frequency range, and accords with the inductive grid impedance, as shown in Figure 8a.
In Figure 8b, the Eigen loci of VSG control strategy without cascaded inner control loop are away from (−1, j0) point, while the Eigen loci of VSG control strategy with cascaded inner control loop circle the (−1, j0) point at the frequency about 15 Hz after decreasing the kip from 1.0 to 0.2 p.u., which predicts that the system becomes unstable when kip decreases to 0.2 p.u. in this case.
Time-domain simulations based on Simulink and CHIL-based experiments were both carried out to verify above system stability analysis. In simulations and experiments, parameters of VSG control strategy and the SCR of the inductive grid were kept the same as the former impedance-based stability analysis, and the control parameter kip changed from 1.0 to 0.2 p.u. to cause this instable case after the VSG controlled converter with the cascaded inner control loop reached a stable operating state and generated about 1.375 MW active power to the connected weak grid.
In simulations, parameter kip changed from 1.0 to 0.2 p.u. at 10.5 s. The waveforms of active power and reactive power are plotted in Figure 9, where resonances at 36 Hz (fundamental 50 Hz minus 14 Hz) can be observed in the active and reactive power, and the amplitude of resonances increases with time.
In CHIL-based experiments, the control parameter kip changed from 1.0 to 0.2 p.u. and then changed back to 1.0 p.u. after 0.5 s. The system current in phase-a/b/c and the active and reactive power generated from the VSG controlled converter to the inductive weak grid are plotted in Figure 10.
Figure 10 shows that, before decreasing the parameter kip in the cascaded control loop, the VSG controlled converter operates stably with the connected weak grid. When the parameter kip decreases to 0.2 p.u., resonances arise in waveforms of system current, active power, and reactive power, and resonances are suppressed when the parameter kip increases back to 1.0 p.u. Besides, resonances in the active and reactive power are at around 35 Hz (fundamental 50 Hz minus 15 Hz), which accords with above impedance-based stability analysis that the impedance characteristics of the VSG controlled converter and the inductive weak grid are mismatched with a small parameter kip since the corresponding Eigen loci circle the (−1, j0) point at the frequency about 15 Hz, as shown in Figure 8b.
It should be noted that the control of the converter was simulated in the Simulink platform, while controllers were implemented on a TMS320F28335 DSP+FPGA control board and with the sampling and switching frequency set as 5 kHz in CHIL-based experiments. Thus, the control effects of the hardware controller applied in the experiments and the simulated controller in simulations were slightly different due to the sampling error, control delay and other factors, which then led to different impedance characteristics of VSG controlled converters in experiments and simulations to some extent. Therefore, the resonant frequencies in experiments and simulations are slightly different in Figure 9 and Figure 10. However, even though there are some slight differences from simulation results, the experimental results in this manuscript are still valid and accord with the theoretical impedance-based stability analysis.
It should also be noted that decreasing kip to 0.2 p.u. is an example to explain that the operation of VSG controlled converters may be unstable with the inductive weak grid due to the capacitive impedance characteristics shaped by the cascaded inner control loop. According to the impedance-based analysis in Section 4.2, the instability can also be avoided by increasing kvp, kip, and Rv to increase the equivalent resistance in the capacitive frequency range.

5.3. System Instability with Series-Compensated Weak Grid—A Case Study

In this subsection, a case to verify the possible instability of VSG controlled converters with series-compensated weak grid is provided. Parameters of VSG control strategy are kept the same as in Table 1, and the compensated level of the series-compensated grid is set as 10%. Impedance characteristics and Nyquist plot of the grid-converter system are given in Figure 11.
In Figure 11a, the impedance characteristics of the VSG controlled converters with cascaded control loop and the compensated grid both can behave capacitive below the fundamental frequency, while the magnitude curves of VSG strategy without cascaded inner control loop and the series-compensated grid intersect at the frequency about 13 Hz, and the phase difference between the grid and the converter is around 180 degrees.
As shown in Figure 11b, the Eigen loci of VSG strategy without cascaded inner control loop cross the (−1, j0) point at the frequency about 13 Hz, while the Eigen loci with cascaded inner control loop keep away from the (−1, j0) point. This system stability analysis predicts that, when connecting with this series-compensated grid, the application of cascaded inner control loop can avoid causing resonances in the interconnected system.
The above analysis can be verified by both time-domain simulations based on Simulink and CHIL-based experiments. In simulations and experiments, parameters of VSG control strategy and the compensated level of the series-compensated grid were kept the same as the former impedance-based stability analysis shown in Figure 11, and active power reference of the VSG controlled converter was set as 1.375 MW. When the grid-converter system reached the stable operating state, the cascaded inner control loop was disabled and then re-enabled later to compare the different system stability of VSG controllers with and without cascaded inner control loop.
In simulations, the cascaded control loop was disabled at 6 s and re-enabled at 7 s. The waveforms of PCC current in phase-a, the active power, and reactive power are plotted in Figure 12. FFT analysis was applied to the current waveform from 6 to 7 s, and the FFT results are plotted in Figure 13. Figure 12 shows that, when the cascaded inner control loop was disabled at 6 s, resonances were caused, and, when the cascaded inner control loop was re-enabled at 7 s, resonances were suppressed. In Figure 13, the most significant resonant components of the system current in phase-a from 6 to 7 s are at frequencies 13 and 14 Hz.
In CHIL-based experiments, the system current in phase-a/b/c, active power and reactive power generated from the VSG controlled converter to the compensated weak grid are plotted in Figure 14. Figure 14 shows that, before disabling the cascaded inner control loop in the VSG strategy, the VSG controlled converter operated stably with generating about 1.375 MW active power to the compensated weak grid. When the switch of modulation references turned to the lower side, as shown in Figure 1, to directly select the virtual EMF as d-axis modulation reference, the cascaded inner control loop was disabled in this VSG strategy. In Figure 14, when the cascaded inner control loop is disabled, resonances are caused in the waveforms of system currents, active power, and reactive power, and the resonances gradually reduce when the cascaded control loop is re-enabled. Besides, the resonances in the active and reactive power are about 37 Hz (fundamental 50 Hz minus 13 Hz), which accords with the above stability analysis in Figure 11 that the impedance characteristics of the VSG controlled converters without cascaded control loop are mismatched with the impedance characteristics of compensated weak grid at 13 Hz.
Therefore, different from the possibly poor system stability with the inductive weak grid, the capacitive impedance characteristics of the VSG controlled converters with the cascaded control loop match the series-compensated weak grid better. This case study can also be seen as an example to explain the possible advantage of adopting the cascaded inner control loop in VSG strategy.

6. Conclusions

In this paper, a SISO impedance model with simple mathematical expression is obtained from the small-signal modeling of the VSG controlled converters with cascaded inner control loop. Based on the simplified SISO impedance model, the impedance shaping effects of cascaded inner control loop are identified, and the influence of control parameters on system stability are quantified by differential analysis. Possible system instabilities of VSG controlled converters with different kinds of weak grid are revealed and validated with CHIL-based experimental cases.
The main conclusions are summarized as follows:
(1)
The impedance characteristics of VSG controlled converters with cascaded inner control loop can become capacitive below the fundamental frequency, which is mainly caused by the voltage controller in the cascaded control loop. The cascaded voltage and current controller with the virtual impedance can also shape the capacitive and negative resistive characteristics in this frequency range.
(2)
The capacitive impedance characteristics can benefit the compatibility of converters operated with the series-compensated weak grid but may deteriorate the system stability with the inductive weak grid. Possible system instabilities can be avoided by increasing control parameter kvp, kip, and virtual resistance Rv to reduce negative resistance in the capacitive frequency range.

Author Contributions

Conceptualization, Y.X. and H.N.; data curation, Y.X.; formal analysis, Y.X.; funding acquisition, H.N. and D.S.; investigation, Y.X.; methodology, Y.X.; project administration, H.N.; resources, H.N. and D.S.; software, Y.X.; supervision, H.N.; validation, Y.X.; visualization, Y.X. and Y.W.; writing—original draft preparation, Y.X.; and writing—review and editing, H.N. and Y.W. All authors have read and agreed to the published version of the manuscript.

Funding

This research was supported in part by National Natural Science Foundation of China under Grant 51977194 and in part by Zhejiang Provincial Natural Science Foundation of China under grant LZ18E070001.

Conflicts of Interest

The authors declare no conflict of interest.

Nomenclature

V, I, Evoltage, current, and modulation signals
P, Q, |V|active power, reactive power, and voltage magnitude
abc, dq, dcsubscripts indicating variables are in a/b/c-phase, on d/q-axis, or on dc side
refsubscript indicating variables are reference variables
Lf, Cf, Rffilter inductor, filter capacitor, and filter resistor of the converter
Vg, Zggrid voltage and grid impedance
ψf virtual back electrical magnetic field
θvirtual rotor angular position
ωpuper unit angular speed
ωg,puper unit angular frequency of the connected grid
Jinertial constant
Dpdamping coefficient of active power
Dqvoltage droop coefficient
Kintegral coefficient of reactive power controller
Lv, Rvvirtual inductor and virtual resistor
KFFi, KFFvfeedforward gain of current and voltage
kvp, kviproportional and integral coefficient of cascaded voltage controller
kip, kiiproportional and integral coefficient of cascaded current controller
Hv(s), Hi(s)transfer functions of the cascaded voltage and current controller
X ^ bold variables with symbol ^ above indicating variables are perturbed frequency components
1, p, p2subscripts indicating components at fundamental frequency, frequency fp, and frequency fp − 2f1
Gx2ysmall-signal blocks to describe the small-signal relationships between variables x and y
Tm,nabbreviations of transfer matrices between variables m and n
YVSGsmall-signal models of VSG controlled converters in 2 × 2 order admittance matrix
Ycf2 × 2 order admittance matrix model of the filter resistor Rf and filter capacitor Cf
Z p v s g / Z p v s g , o p SISO impedance model for VSG controlled converters with/without the cascaded control loop
Y p e q l / Z p e q l equivalent admittance/impedance of the small-signal models
VSGvirtual synchronous generator
SISOsingle-in-single-out
CHILcontrol-hardware-in-loop
SGsynchronous generator
REGSrenewable energy generation system
PLLphase-locked loop
EMFvirtual back electrical magnetic field
PCCpoint of common coupling

Appendix A

Based on the small-signal modeling in Section 2, the small-signal models of the VSG controlled converter can be described by a 2 × 2 order admittance matrix YVSG in (32), whose detailed expressions can be obtained by substituting the detailed expressions of each blocks Gx2y as given in Section 2.3.
Then, with the simplification in Steps 1–3 in Section 3.1, the impedance of VSG controlled converters can be simplified as:
Z s i m p 1 = 1 M i ( 1 , 1 ) M v ( 1 , 1 ) = Z v H v H i + H i + ( s j ω 1 ) L f + j 2 F ψ , i ( s ) G q 2 ψ + j 2 F θ , i ( s ) G p 2 θ ( H v j ω 1 C f ) H i j 2 F ψ , v ( s ) G q 2 ψ + j 2 F θ , v ( s ) G p 2 θ
where Zv = Rv + jLv and expressions of transfer functions Fψ,i, Fψ,v, Fθ,I, and Fθ,v are:
F ψ , i ( s ) H v ( s ) H i ( s ) , F ψ , v ( s ) H v ( s ) H i ( s ) ( I 1 e j φ i 1 + j θ 0 j D q V 1 ) F θ , i ( s ) ( H v ( s ) j ω 1 C f ) H i ( s ) + ( H i ( s ) j ω 1 L f ) ( I g 1 e j φ v 1 + j φ i g 1 ) + Z v H v ( s ) H i ( s ) ( I 1 e j φ v 1 + j φ i 1 ) F θ , v ( s ) ( H v ( s ) j ω 1 C f ) H i ( s ) ( I 1 e j φ i 1 + j φ v 1 ) + ( H i ( s ) j ω 1 L f ) ( I 1 I g 1 ) + Z v H v ( s ) H i ( s ) ( I 1 I 1 )
For VSG controlled converters, the control bandwidths of the active and reactive power controllers (1–2 Hz) are much smaller than the cascaded voltage controller and the cascaded current controller (50–200 Hz). Then, according to (A2), the denominator of (A2) is dominated by the multiplication of cascaded transfer function Hv(s) * Hi(s) and the expressions of power controllers Gp2θ and Gq2ψ in the denominator can be simplified to zero, which means (A2) is further simplified as follows:
Z s i m p 2 Z v H v H i + H i + ( s j ω 1 ) L f + j 2 F ψ , i ( s ) G q 2 ψ + j 2 F θ , i ( s ) G p 2 θ ( H v j ω 1 C f ) H i
Besides, within the control bandwidth of the cascaded voltage controller (54 Hz in this manuscript), the value of Hv(s) * Hi(s) is larger than Hv(s). Then, within the frequency range 54 Hz below the fundamental frequency to 54 Hz above the fundamental frequency (1–100 Hz for convenience), the expression of transfer function Fθ,i(s) in (A2) can be further simplified as:
F θ , i ( s ) ( H v ( s ) j ω 1 C f ) H i ( s ) + Z v H v ( s ) H i ( s ) ( I 1 e j φ i 1 )
Furthermore, the decoupling gain of voltage controller in (A3) and (A4) is ignored, and substituting the above-simplified Fθ,i(s) to (A3), (A3) is then simplified as:
Z s i m p 3 Z v + 1 H v ( s ) + s L f H v ( s ) H i ( s ) + j 2 G q 2 ψ + j 2 ( 1 + Z v I 1 ) G p 2 θ Z v + 1 H v ( s ) + s L f H v ( s ) H i ( s ) + j 2 G q 2 ψ + j 2 G p 2 θ   ,   since   Z v I 1 1   in   this   case
Finally, substituting the detailed expressions of Gp2θ and Gq2ψ to (A5), the simplified SISO impedance model of VSG controlled converters can be obtained as (35) in Section 3.1.

References

  1. Beck, H.-P.; Hesse, R. Virtual synchronous machine. In Proceedings of the 9th International Conference on Electrical Power Quality and Utilization, Barcelona, Spain, 9–11 October 2007; pp. 1–6. [Google Scholar]
  2. Subsynchronous Resonance Working Group of the System Dynamic Performance Subcommittee. Reader’s guide to subsynchronous resonance. IEEE Trans. Power Syst. 1992, 7, 150–157. [Google Scholar] [CrossRef]
  3. Liu, H.; Xie, X.; He, J.; Xu, T.; Yu, Z.; Wang, C.; Zhang, C. Subsynchronous interaction between direct-drive PMSG based wind farms and weak ac grid. IEEE Trans. Power Syst. 2017, 32, 4708–4720. [Google Scholar] [CrossRef]
  4. Shu, D.; Xie, X.; Rao, H.; Gao, X.; Jiang, Q.; Huang, Y. Sub- and super- synchronous interactions between STATCOMs and weak AC/DC transmissions with series compensations. IEEE Trans. Power Electron. 2018, 33, 7424–7437. [Google Scholar] [CrossRef]
  5. Chen, X.; Zhang, Y.; Wang, S.; Chen, J.; Gong, C. Impedance-phased dynamic control method for grid-connected inverters in a weak grid. IEEE Trans. Power Electron. 2017, 32, 274–283. [Google Scholar] [CrossRef]
  6. Zhang, B.; Du, X.; Zhao, J.; Zhou, J.; Zou, X. Impedance modeling and stability analysis of a three-phase three-level NPC inverter connected to the grid. CSEE J. Power Energy Syst. 2020, 6, 270–278. [Google Scholar]
  7. Sun, J. Impedance-based stability criterion for grid-connected inverters. IEEE Trans. Power Electron. 2011, 26, 3075–3078. [Google Scholar] [CrossRef]
  8. Wu, H.; Ruan, X.; Yang, D.; Chen, X.; Zhao, W.; Lv, Z.; Zhong, Q. Small-signal modeling and parameters design for virtual synchronous generators. IEEE Trans. Ind. Electron. 2016, 63, 4292–4303. [Google Scholar] [CrossRef]
  9. Mo, O.; D’Acro, S.; Suul, J.A. Evaluation of virtual synchronous machines with dynamic or quasi-stationary machine models. IEEE Trans. Ind. Electron. 2017, 64, 5952–5962. [Google Scholar] [CrossRef] [Green Version]
  10. Du, W.; Fu, Q.; Wang, H.F. Power system small-signal angular stability affected by virtual synchronous generators. IEEE Trans. Power Syst. 2019, 34, 3209–3219. [Google Scholar] [CrossRef]
  11. Li, G.; Chen, Y.; Luo, A.; He, Z.; Wang, H.; Zhu, Z.; Wu, W.; Zhou, L. Analysis and mitigation of subsynchronous resonance in series-compensated grid-connected system controlled by a virtual synchronous generator. IEEE Trans. Power Electron. 2020, 35, 11096–11107. [Google Scholar] [CrossRef]
  12. Yu, Y.; Zhang, M.; Antoine, M.; Li, H. Analysis of synchronous frequency resonance in VSG based on the sequence impedance models. In Proceedings of the 22nd International Conference on Electrical Machines and Systems, Harbin, China, 11–14 August 2019; pp. 1–6. [Google Scholar]
  13. Zhang, X.; Chen, J.; Chen, X. Impedance modeling and stability analysis of weak-grid interfaced single-phase VSG. In Proceedings of the 22nd International Conference on Electrical Machines and Systems, Harbin, China, 11–14 August 2019; pp. 1–6. [Google Scholar]
  14. Wu, W.; Zhou, L.; Chen, Y.; Luo, A.; Dong, Y. Sequence-impedance-based stability comparison between VSGs and traditional grid-connected inverters. IEEE Trans. Power Electron. 2019, 34, 46–52. [Google Scholar] [CrossRef]
  15. Zhong, Q.; Weiss, G. Synchronverters: Inverters that mimic synchronous generators. IEEE Trans. Ind. Electron. 2011, 58, 1259–1267. [Google Scholar] [CrossRef]
  16. Wang, X.; Chen, L.; Sun, D.; Zhang, L.; Nian, H. A modified self-synchronized synchronverter in unbalanced power grids with balanced currents and restrained power ripples. Energies 2019, 12, 923. [Google Scholar] [CrossRef] [Green Version]
  17. D’Arco, S.; Suul, J.A. Virtual synchronous machines—Classification of implementations and analysis of equivalence to droop controllers for microgrids. In Proceedings of the 2013 IEEE Grenoble Conference, Grenoble, France, 16–20 June 2013; pp. 1–7. [Google Scholar]
  18. D’Arco, S.; Suul, J.A.; Fosso, O.B. A virtual synchronous machine implementation for distributed control of power converters in smart grids. Electr. Power Syst. Res. 2015, 122, 180–197. [Google Scholar] [CrossRef]
  19. Hou, X.; Sun, Y.; Zhang, X.; Lu, J.; Wang, P.; Guerrero, J.M. Improvement of frequency regulation in VSG-based ac microgrid via adaptive virtual inertia. IEEE Trans. Power Electron. 2020, 35, 1589–1602. [Google Scholar] [CrossRef]
  20. Chen, J.; Liu, M.; Milano, F.; O’Donnell, T. Placement of virtual synchronous generator controlled electric storage combined with renewable generation. In Proceedings of the IEEE Milan PowerTech, Milan, Italy, 23–27 June 2019; pp. 1–6. [Google Scholar]
  21. Unamuno, E.; Rygg, A.; Amin, M.; Barrena, J.A. Impedance-based stability evaluation of virtual synchronous machine implementations in converter controllers. In Proceedings of the International Power Electronics Conference, Niigata, Japan, 20–24 May 2018; pp. 759–766. [Google Scholar]
  22. Li, C.; Liang, J.; Cipcigan, L.M.; Ming, W.; Colas, F.; Guillaud, X. DQ impedance stability analysis for the power-controlled grid-connected inverter. IEEE Trans. Energy Convers. 2020, 1. [Google Scholar] [CrossRef]
  23. Xu, Y.; Nian, H.; Xu, G.; Qiu, J. Cross-coupling over frequency and sequence in impedance modelling of grid-connected inverter. J. Eng. 2017, 2017, 990–995. [Google Scholar] [CrossRef]
  24. Xu, Y.; Nian, H.; Wang, T.; Chen, L.; Zheng, T. Frequency coupling characteristic modeling and stability analysis of doubly fed induction generator. IEEE Trans. Energy Convers. 2018, 33, 1475–1486. [Google Scholar] [CrossRef]
  25. Nian, H.; Xu, Y.; Chen, L.; Zhu, M. Modeling and analysis of dc-link dynamics in DFIG system with an indicator function. IEEE Access 2019, 7, 125401–125412. [Google Scholar] [CrossRef]
  26. Zou, X.; Du, X.; Tai, H. Two-variable admittance model for D-PMSG-based wind turbine and stability criterion based on magnitude and phase contour plot. IEEE Trans. Power Electron. 2020, 35, 1484–1498. [Google Scholar] [CrossRef]
  27. Liu, W.; Xie, X.; Zhang, X.; Li, X. Frequency-coupling admittance modeling of converter-based wind turbine generators and the control-hardware-in-the-loop validation. IEEE Trans. Energy Convers. 2020, 35, 425–433. [Google Scholar] [CrossRef]
  28. Li, G.; Sun, J. Control hardware-in-the-loop simulation for turbine impedance modeling and verification. In Proceedings of the 16th Wind Integration Workshop, Berlin, Germany, 16–18 October 2017; pp. 1–6. [Google Scholar]
Figure 1. Configuration of VSG controlled converter system.
Energies 13 05114 g001
Figure 2. Small-signal relationship in the VSG controlled converter system.
Energies 13 05114 g002
Figure 3. CHIL platform used in the following experiments.
Energies 13 05114 g003
Figure 4. Validation of small-signal models YVSG.
Energies 13 05114 g004
Figure 5. Impedance characteristics of VSG controlled converters.
Energies 13 05114 g005
Figure 6. Equivalent resistance and reactance in p.u. of VSG controlled converters with cascaded inner control loop.
Energies 13 05114 g006
Figure 7. Influence of cascaded voltage–current control parameters on the impedance characteristics of VSG controlled converters.
Energies 13 05114 g007
Figure 8. Stability of VSG controlled converters with the inductive weak grid: (a) impedance characteristics; and (b) Nyquist plot.
Energies 13 05114 g008
Figure 9. Simulation waveforms of active power and reactive power in p.u. in the VSG controlled converter when kip decreases (blue lines, active power; orange lines, reactive power).
Energies 13 05114 g009
Figure 10. Waveforms of system current and active and reactive power when kip decreases.
Energies 13 05114 g010
Figure 11. Stability of VSG controlled converters with series-compensated grid: (a) impedance characteristics; and (b) Nyquist plot.
Energies 13 05114 g011
Figure 12. Simulation waveforms when disable/enable the cascaded control loop in the VSG controlled converter with the series-compensated grid: (top) system current in phase-a; and (bottom) the blue line is active power and the orange line is reactive power.
Energies 13 05114 g012
Figure 13. FFT analysis of resonant current in grid-converter interconnected system.
Energies 13 05114 g013
Figure 14. Waveforms of disable and re-enable the cascaded inner control loop in VSG control strategy with series-compensated grid.
Energies 13 05114 g014
Table 1. Parameters of VSG controlled converter system.
ParameterValueParameterValue
Rated voltage, Us690 VDamping coefficient, Dp400
Rated power, Sb2.75 MWVoltage reference, |V|ref1.0 p.u.
Rated frequency, f150 HzReactive power reference, Qref0.0 p.u.
Power reference, Pref0.5 p.u.Voltage droop coefficient, Dq0.02
Inertial constant, J2 sIntegral coefficient, K0.5
Filter resistor, Rf0.003 p.u.Voltage controller, kvp, kvi0.59 736
Filter inductor, Lf0.08 p.u.Current controller, kip, kii1.27 14.3
Filter capacitor, Cf0.074 p.u.Virtual impedance, Lv, Rv0.2 0.01

