Article

Comparison of Torrefaction and Hydrothermal Treatment as Pretreatment Technologies for Rice Husks

by
Tianjiao Cheng
1,
Andante Hadi Pandyaswargo
2 and
Hiroshi Onoda
1,*
1
Graduate School of Environment and Energy Engineering, Waseda University, Tokyo 162-0041, Japan
2
Environmental Research Institute, Waseda University, Tokyo 162-0041, Japan
*
Author to whom correspondence should be addressed.
Energies 2020, 13(19), 5158; https://doi.org/10.3390/en13195158
Submission received: 10 August 2020 / Revised: 28 September 2020 / Accepted: 1 October 2020 / Published: 3 October 2020
(This article belongs to the Special Issue Biomass Conversion Technologies)

Abstract

:
Many agricultural waste residues are generated in Southeast Asia while some areas in the region still do not have electricity. This study explores the potential effective utilization of agricultural residues in Southeast Asia to generate power. Firstly, visualization of the potential for energy generation was completed using a geographic information system (GIS). Secondly, a comparison of effectiveness was completed between the torrefaction and hydrothermal treatment of low-grade agricultural residues as pretreatment techniques for the modification of agricultural residues. In this study, the feasibility of utilizing rice residues was analyzed (i.e., rice husks, which are produced in large quantities in Southeast Asia) to determine their suitability for pretreatment as feedstock for power plants. This was assessed experimentally by focusing on the pyrolytic characteristics of the husks and the rate of ash change both before and after treatment, while the subsequent implications on transportation costs were also noted. The results indicated that the percentage of ash in torrefied rice husks was 26.7%, whereas the percentages of ash in rice husks that were treated with water or an NaOH solution were 13.96% and 8.87%, respectively. The reduction in transportation costs after compression was 90.8% for hydrothermal treatment and 88.7% for torrefaction.

1. Introduction

The use and application of biomass, which is carbon-neutral, has been attracting attention in recent years as a renewable resource in the attempts to address the call for the reduction of energy-related carbon dioxide emissions. Biomass utilization technologies are currently being developed in Southeast Asian countries, which have abundant biomass resources. Countries like Myanmar and Cambodia, which have a lower electrification rate compared to other Southeast Asian countries, are expressing great interest in biomass power generation [1]. In Myanmar, in particular, there are power generation projects using rice husks, a form of agricultural biomass with an abundant supply in the country, that are drawing much attention [2].
Occupying a massive land area, Myanmar is known worldwide as a country with high food production output [3]. However, the slow development of its electricity supply network, partly due to its vast land area, is a significant problem. Areas without electricity are faced with various problems that make it challenging to increase the electrification rate, such as capital procurement and diffusion of residential areas. In one region in Myanmar, electricity is supplied through diesel power generation, but this does not represent a fundamental solution [4]. Under these circumstances, it can be said that an independent or distributed-type energy system utilizing renewable energies that include biomass would be suitable for providing electricity to areas that are located away from the main electrical supply line. In fact, at the Kyawzan village in Myanmar, 20–140 kW gasifiers using rice husks have been installed in 14 locations, and studies are now being conducted toward developing the village’s electrification. However, numerous problems have yet to be solved, such as the decrease in power generation efficiency and environmental pollution due to clinker trouble and tar formation. Figure 1 shows the rice husk gasifiers, as well as the clinker and tar drainage situation in Kyawzan village.
The promotion of agricultural biomass utilization would require technology and systems that improve the quality of fuel. However, in our evaluation of 86 biomass-related projects supported by Japan in Southeast Asian countries using the Technology Readiness Assessment (TRA) method, the results showed low maturity of biomass energy conversion technology and suggested many technical problems [1].
Concerning biomass energy conversion technology, numerous research studies have focused on improving the energy yield from biomass raw materials to products or on solving problems related to transportability and storability. Sano et al. [5] have shown that torrefaction can be advantageous for wood chips and pellets based on energy density by weight. Torrefaction is a heating process for biomass in the absence of oxygen or for when it is drastically reduced to a temperature of about 250–350 °C. This temperature range is lower than the heat of pyrolytic processes that are usually used to transform the energy of biomass [6]. During the heating process, water and volatiles are removed, which makes the original biomass more brittle, improves its grindability, and reduces its ability to absorb moisture [7]. These properties make a torrefied biomass fuel more suitable for energy plants by giving it better storability and transportability. Jeeban Poudel [8] et al. produced a solid biomass fuel with properties similar to lignite by torrefaction of waste woody material. As for the method of coal-mixed combustion power generation using semi-carbonized torrefaction products, Omura et al. [9] used life cycle CO2 (LCCO2) to analyze a mixed combustion with 30% semi-carbonized products to achieve an annual reduction of 95,000 t-CO2 (approximately 28.5%) in CO2 emissions. The hydrothermal process is a thermochemical conversion process that is used to convert biomass into biofuel. The process is usually performed in water at a temperature between 250 °C and 374 °C and at pressures of 4–22 MPa. In the water, the biomass is degraded into small components. The temperature, pressure, and time are adjusted depending on the intended output of the process (oil, gas, or carbon). Because hydrothermal biomass processing can process various types of biomass and co-utilize waste materials, significant effort and attention have been given to evaluating this approach [10]. Nepu Saha [11] et al. have shown that, through the conversion of paper mill sludge into solid hydrothermal fuels, solid fuels with combustion properties very similar to those of coal can be obtained.
Although there is a good potential market for rice husks as biomass powerplant feedstock, the clinker problem that results from the ash that is generated is regarded as a significant challenge [10]. It is also necessary to select an appropriate process for pretreating rice husks. The objective of this report is to verify, through experiments and analyses, the improvements resulting from the use of torrefaction and hydrothermal methods in the pretreatment of rice husks as a low-grade source of biomass, with respect to problems such as the decrease in power generation efficiency and environmental pollution due to clinker trouble and tar.
First, the electrification rate and overall production levels of rice husks in Myanmar by region are presented as visualized data using QGIS [12] in an attempt to characterize the potential of rice husks and the state of the electrification rate throughout the country.
Based on data from 2014 [3], the results of the visualization of the electrification rate by region are shown in Figure 2a. From that figure, it can be seen that, in Myanmar, the electrification rate is 60% in the Yangon region and exceeds 40% in the Kayah region. Other areas throughout Myanmar have an electrification rate below 40%. In particular, the electrification rates in the Ayeyarwady region, which has the highest rice production in Myanmar, the Tanintharyi region, and the Rakhine region, are 9%, 9%, and 6%, respectively. Based on data from 2010 [13], rice production in each region in Myanmar is shown in Figure 2b. This shows that the production and processing of rice in Myanmar is centralized in the Ayeyarwady, Bago, and Sagaing regions. The more current rice production data in Myanmar does not show the detailed production capacity per region, but the new proportional data still shows that the three regions remain the central production areas for rice and produced 28 million tonnes in 2016–2017 [14,15].
Rice husks have a low bulk density and low heat value because they are composed of 20% ash [16]. This results in significantly poor transportation efficiency with respect to the amount of energy. Hence, rice husks are favored for use “as-is”, implying that they would have to be produced and consumed locally [17]. Consequently, rice husk use is more desirable in areas such as the Ayeyarwady and Bago regions, where the rice yield is high and power generation is locally produced and consumed. While rice husk gasification power generation is possible in areas with low rice husk production through transportation of rice husks from the high producing regions, an investigation of transportation efficiency is still required to determine feasibility.
An experimental validation of torrefaction and hydrothermal methods was performed with Thermogravimetry/Differential Thermal Analysis (TG/DTA). The discussion of the effect on the reduction of the biomass transportation cost under the premise that pretreatment through torrefaction and hydrothermal methods would be applied was completed at the same time. Specifically, we tested a theoretical situation wherein rice husks from Myanmar’s Ayeyarwady region, which has an abundant supply of rice husks, are transported to areas with a low production of rice husks, and then estimated the reduction in transportation cost when the resource island model was used. The objective of the above investigations was to obtain knowledge toward the efficient utilization of agricultural biomass.

2. Materials and Methods

This section discusses the experimental equipment and methods used for the torrefaction and hydrothermal pretreatment of rice husks, which are a form of low-grade biomass.
The purpose of the experiment was to study the processing capacity and performance of the two pretreatment methods on rice husks and then find a treatment method that can be used for Myanmar rice husks. The experimental equipment is located in Japan, but due to transportation restrictions, rice husks produced in Myanmar could not be used. Understanding the impact of regional differences in production is a future issue. All the rice husks used for the experiments in this study were produced in Nagano Prefecture, Japan.

2.1. Experimental Equipment and Method of Torrefaction

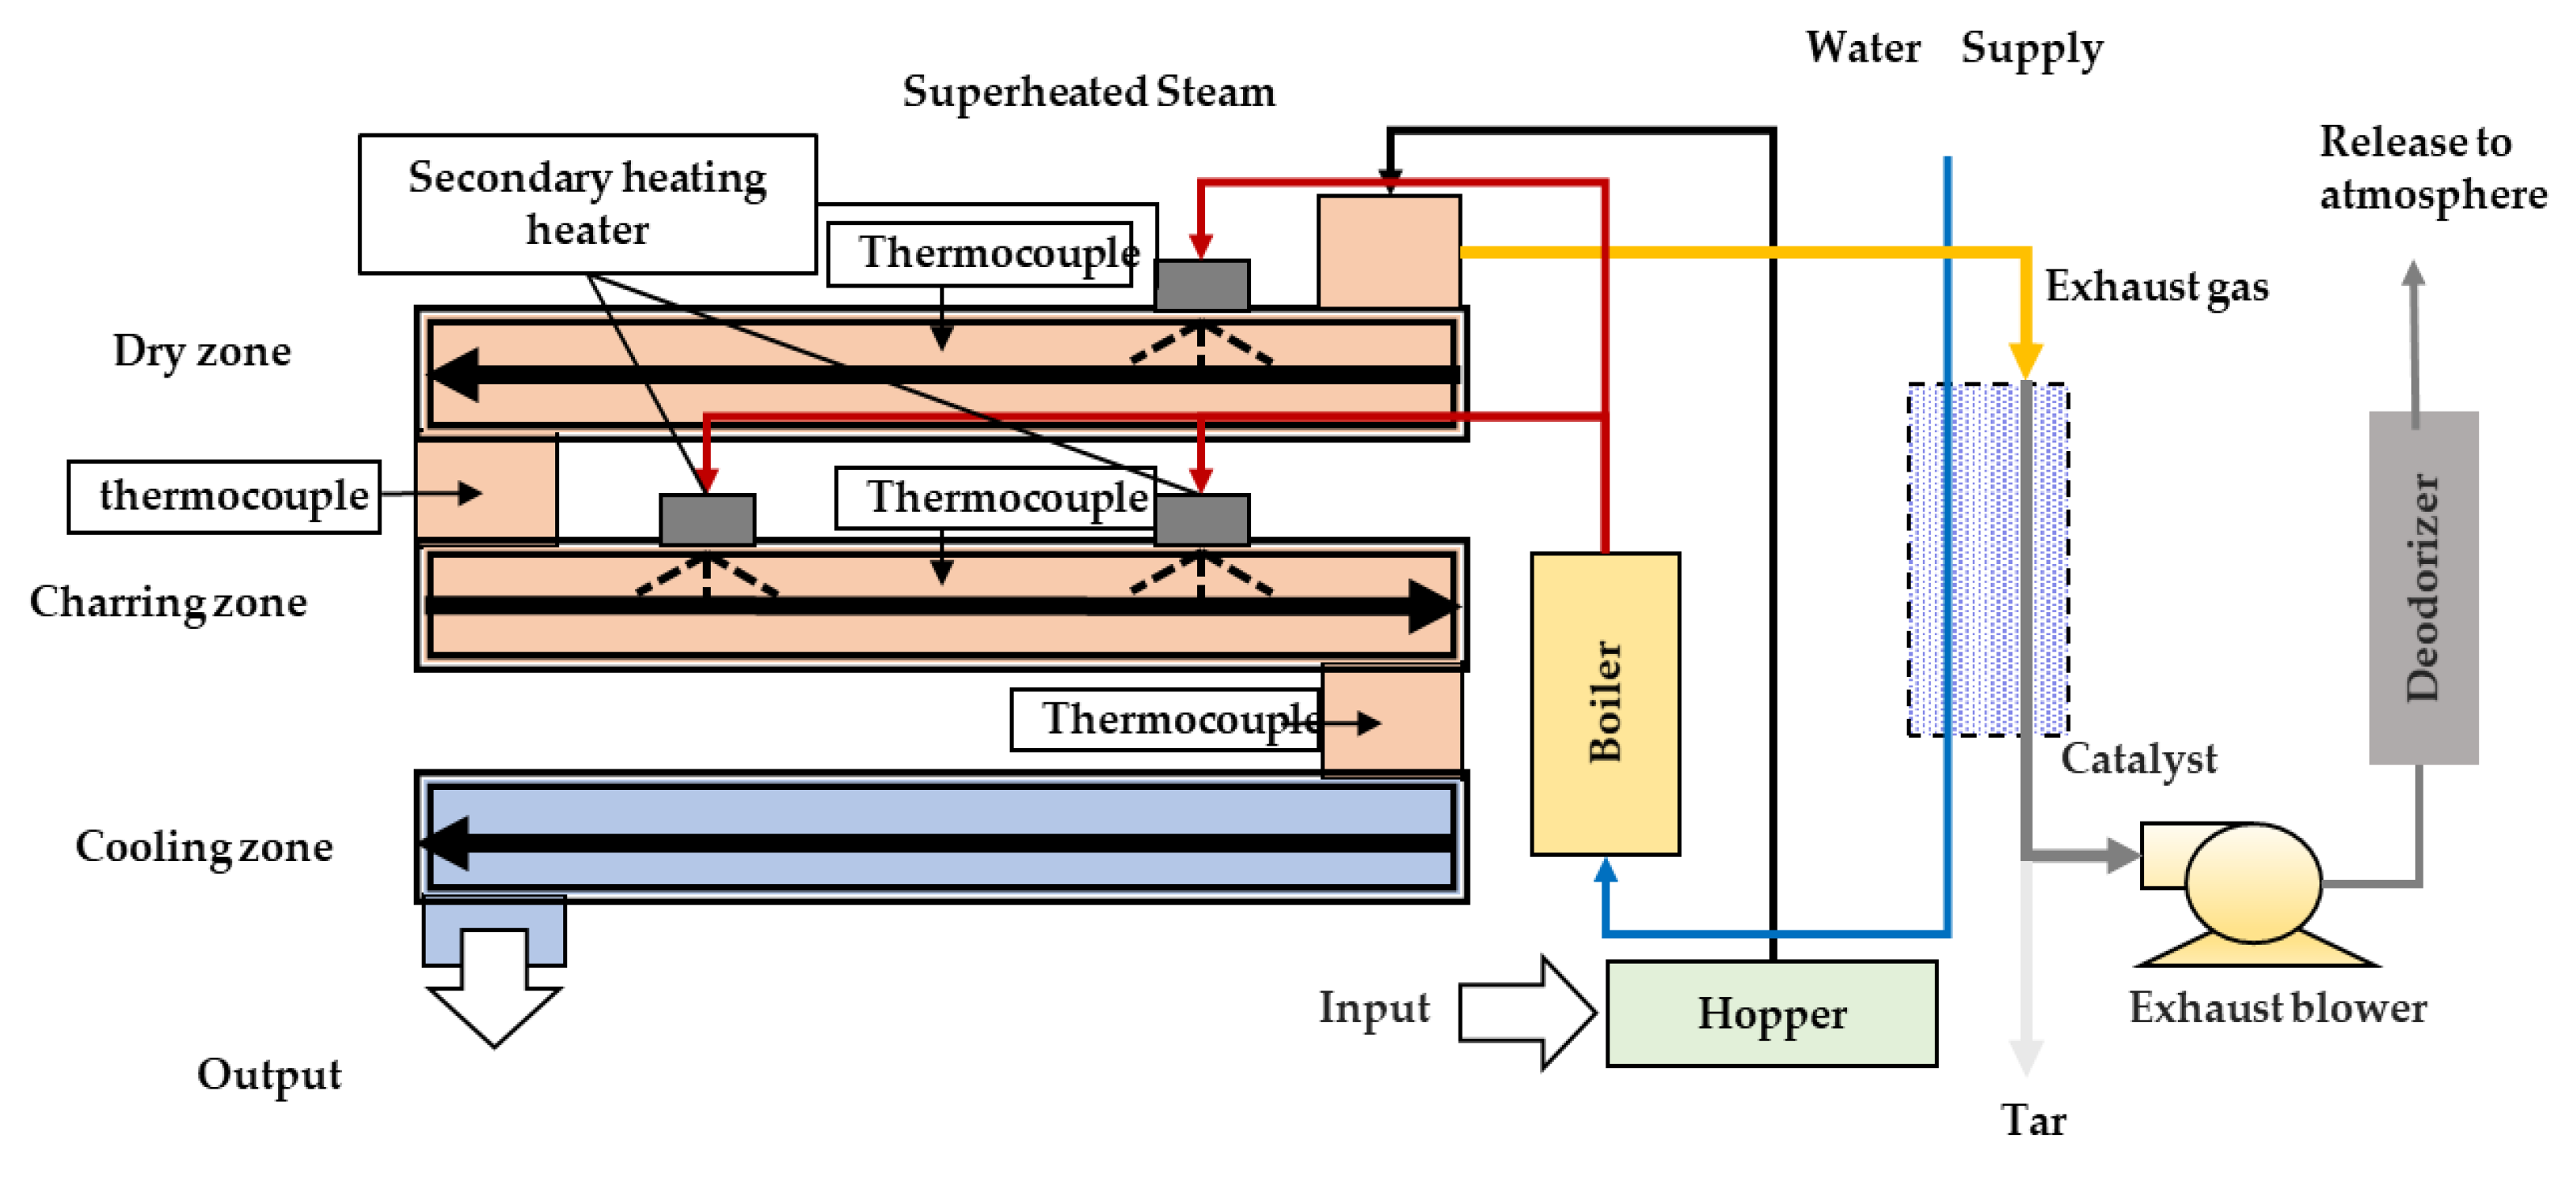
Figure 3a–c and Figure 4 show the superheated steam torrefaction tester that was used in the experiments and an overview of that tester. The equipment consists of two layers of heating zones and one layer of a cooling zone. The raw material is fed from the upper chute through the hopper, and is moved inside by a screw feeder. The equipment is heated by electric heaters at the bottom of each layer that can be set to approximately 300–600 °C and superheated steam injection systems, one of which is located in the upper layer and two are located in the middle layer. The central section of the upper and lower layers and the chutes that connect each layer have a thermocouple that measures the temperature. The exhaust gas that is generated in the equipment is cooled, and some of it is recovered as drainage that contains tar. The rest is released into the atmosphere after passing through a deodorizer. Table 1 shows the specifications of rice husk torrefaction equipment.
The objective of this torrefaction experiment was to obtain a high heat retention ratio with the goal of improving transportation efficiency, so 250 °C was set, which has a high mass residual rate, as a target condition. For comparison, torrefaction experiments at 150 and 180 °C were also conducted.
Regarding the above-mentioned mass residual ratio ( R e ) and heat retention ratio ( H r ), they can be calculated as follows.
R e = M P M 0
where M 0 and M P are the weight before and after preprocessing.
H r = H P M P H 0 M 0
where H 0 and H P are the heat before and after preprocessing.

2.2. Experimental Equipment and Hydrothermal Treatment Method

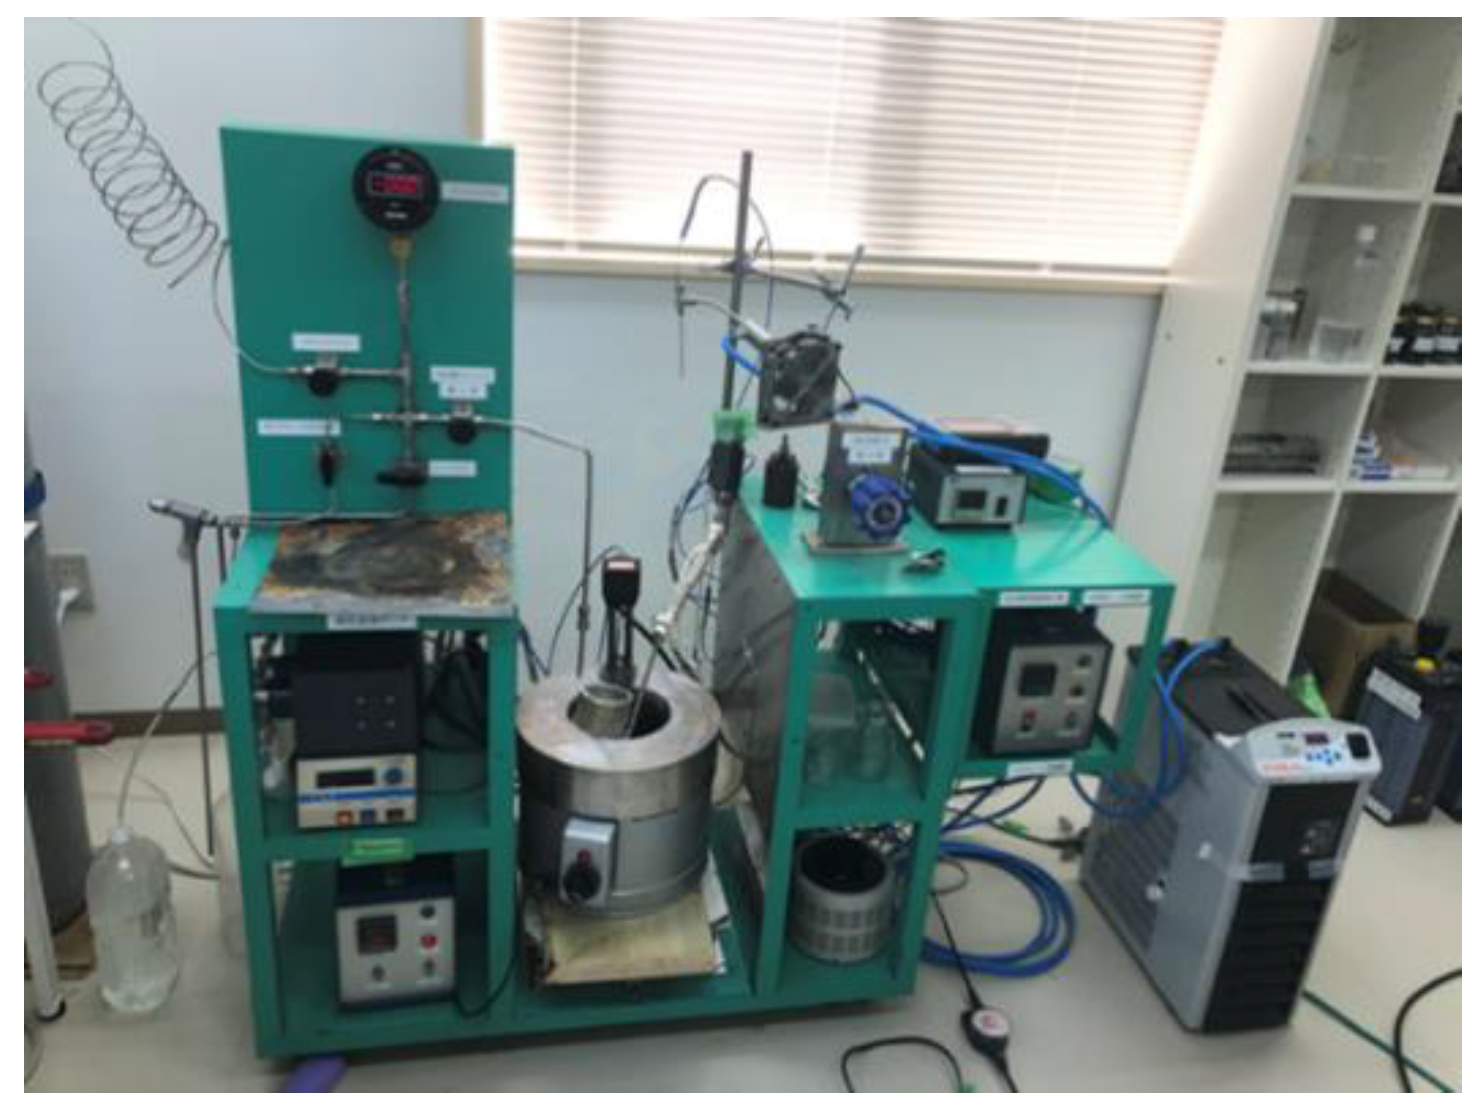
The hydrothermal experimental equipment used in the experiment was a batch reactor and a liquid flow reactor that can continuously recover water-soluble degradation products. The batch reactor keeps water and the raw materials in a sealed container and heats the container to the designated temperature using an external electric furnace. Figure 5 and Figure 6 show the flow of the liquid flow reactor and the external appearance of the experimental equipment. With the liquid flow reactor, the raw materials are kept above the filter, and water is supplied via the liquid feeding pump at the designated flow rate. An electric furnace heats the area around the raw materials to the reaction temperature. The reaction temperature in the experimental conditions for hydrothermal processing was set to 200 °C. Additionally, due to restrictions caused by the experimental equipment, only 5 g of rice husk samples were processed.

2.3. Evaluation of Transportation Cost Using a Resource Island Model

To evaluate the efficiency of transportation of products by torrefaction and hydrothermal treatment, the effect of reducing transportation costs was estimated by introducing the resource island model [19], imagining the transportation of rice husks from the Ayeyarwady district in Myanmar, where there is a large surplus of rice husks, to a region where the supply of rice husks is low.
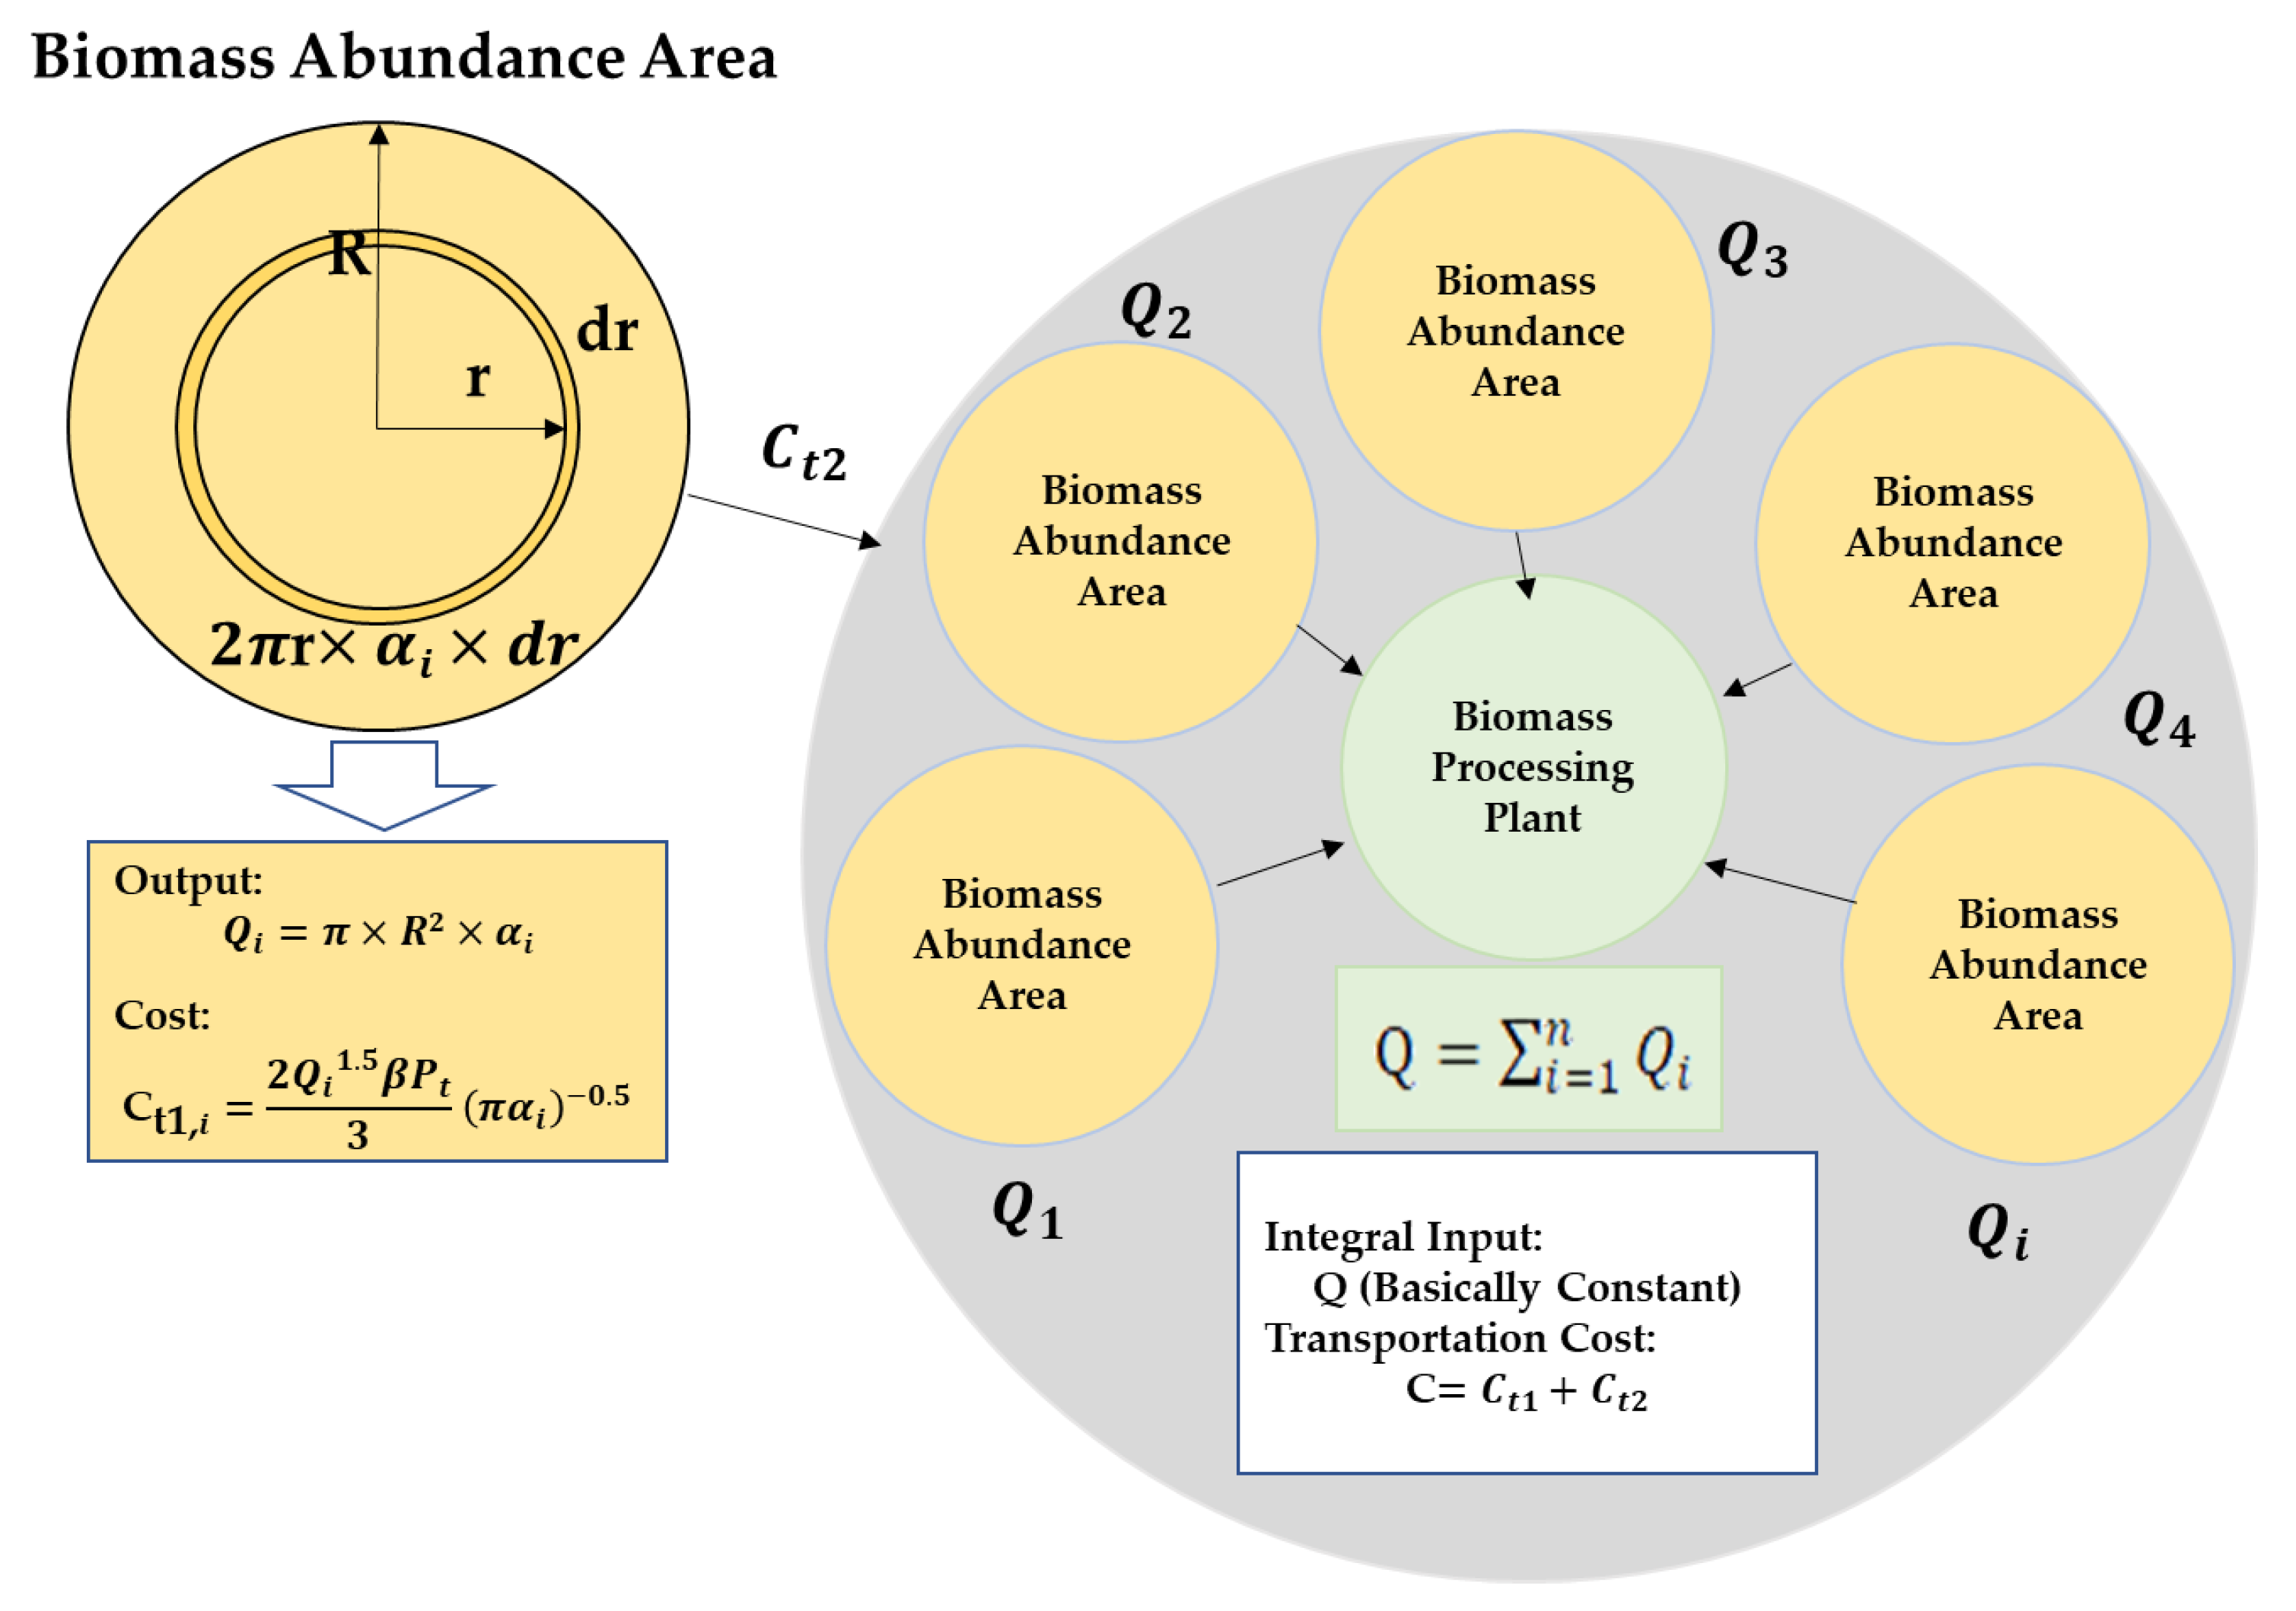
The evaluation of the transportation efficiency of biomass necessitates an estimation model for transportation costs. There are two main methods for collecting rice husks [20]. If the transportation distance is short, the farmer can collect the agricultural residues and directly transport them to the power plant. If the transportation distance is long, the agricultural residues in a certain region are generally collected by a broker and then transported to the power plant. The general distribution of agricultural biomass resources is fairly dispersed, and the resource production regions are relatively isolated such that, overall, it could be considered as a resource island distribution. Figure 7 shows an overview of the resource island model. Based on the resource island distribution model, the following were assumed regarding the rice husk collection process.
  • The production cycle unit for biomass resources is one year.
  • Biomass resources are evenly distributed in the same resource island, and differences in yield of the same crop due to different conditions are ignored.
  • The differences in parameters between the biomass of different types are also ignored.
The transportation cost of biomass mainly comprises collection within the island and transport outside the island. If a compression process is introduced, we envision a flow wherein the collection process is one in which the rice husks are collected at the central region of the island and then compressed, and from the central region of the island the products are transported to power plants and processing facilities.
Referring to Figure 8, L i is the distance between the central area of each resource island to the transportation destination, where there are power plants and processing facilities. R is the radius of the island. α is the biomass density. Q i is the quantity of biomass collected at each island. The biomass collection quantity Q  can be calculated as follows.
Q i = π R 2 α i
Q = i = 1 n Q i
where n is the number of resource islands in the collection area.
The purchasing cost C b can be calculated as follows.
C b = i = 1 n C b , i = i = 1 n Q i P b
where P b is the price of biomass.
The labor cost C 0 can be calculated as follows.
C 0 = P 0 Q
where P 0 is the labor cost of unit biomass.
From the above, the transportation cost within the resource island C t 1 can be calculated as follows:
C t 1 = 0 R 2 π r α β r P t d r = 2 π R 3 3 P t β α = 2 Q 1.5 β P t 3 ( π α ) 0.5
where β is the twist factor. The twist factor is to correct the distance calculation in the formula. Considering that the collection distance is not a straight line, a twist factor correction is introduced. In this experiment, β was set to 1.5. Pt as the biomass transportation cost per unit distance.
On the other hand, the transportation cost from the resource island to the power plant C t 2 can be calculated as follows.
C t 2 = Q β L i P t
There are pretreatment and compression processes, so it is necessary to include equipment costs and operational costs in the calculation.
The total labor cost of pretreatment and compression processes C 1 can be calculated as follows.
C 1 = P 1 Q
where P 1 is the labor cost of unit biomass pretreatment and compression. Q is the collected biomass.
The total costs of pretreatment and compression are considered as initial investment C F , operational cost   C p o , and labor cost C 1 .
The total costs of pretreatment and compression cost C p can be calculated as follows.
C p = C F + C p o + C 1 = ( Q Q c ) r ( C F , c + C p o , c ) + ( Q Q c ) C p o , c + P 1 Q
where r is the productivity index, and it changes according to the treatment technology applied. C F , c is the equipment depreciation cost, C p o , c is the maintenance cost adjusted according to the production index, and C p o , c is the maintenance cost without adjustments.
From the above, the total raw material cost for one resource island C can be calculated as follows.
C = C b + C 0 + C t 1 + C t 2 + C p + C 1 2 3 Q 1.5 β P t ( π α ) 0.5 + Q ( P b + P 0 + β L i P t ) + ( Q Q c ) r ( C F , c + C p o , c ) + ( Q Q c ) C p o , c
From the above formula, the major factors that affect cost are biomass purchasing cost P b , biomass transportation cost per unit distance P t , and transportation distance Li.
A resource island model was used based on the transport of rice husks from Myanmar’s Ayeyarwady region, which has an abundance of rice husks, to an area with a small supply of rice husks, and then we calculated the transportation cost reduction effects.
In terms of transportation, we calculated three parameters in the pretreatment process: mass residual ratio   R e , energy density improvement ratio I r , and energy residual ratio E r . Considering the entire energy balance, the income of the power plant is proportional to the energy residual ratio   E r . The biomass accumulated at each island that is corrected through pretreatment   Q i can be calculated as follows.
Q i = π R 2 α i R e
The correction of the cost to transport from an island to the power plant C t 2 can be calculated as follows.
C t 2 = Q i β L i P t I r
The simplified decrease ratio in transportation cost after pretreatment D r is expressed by Formula (14).
D r = R e I r
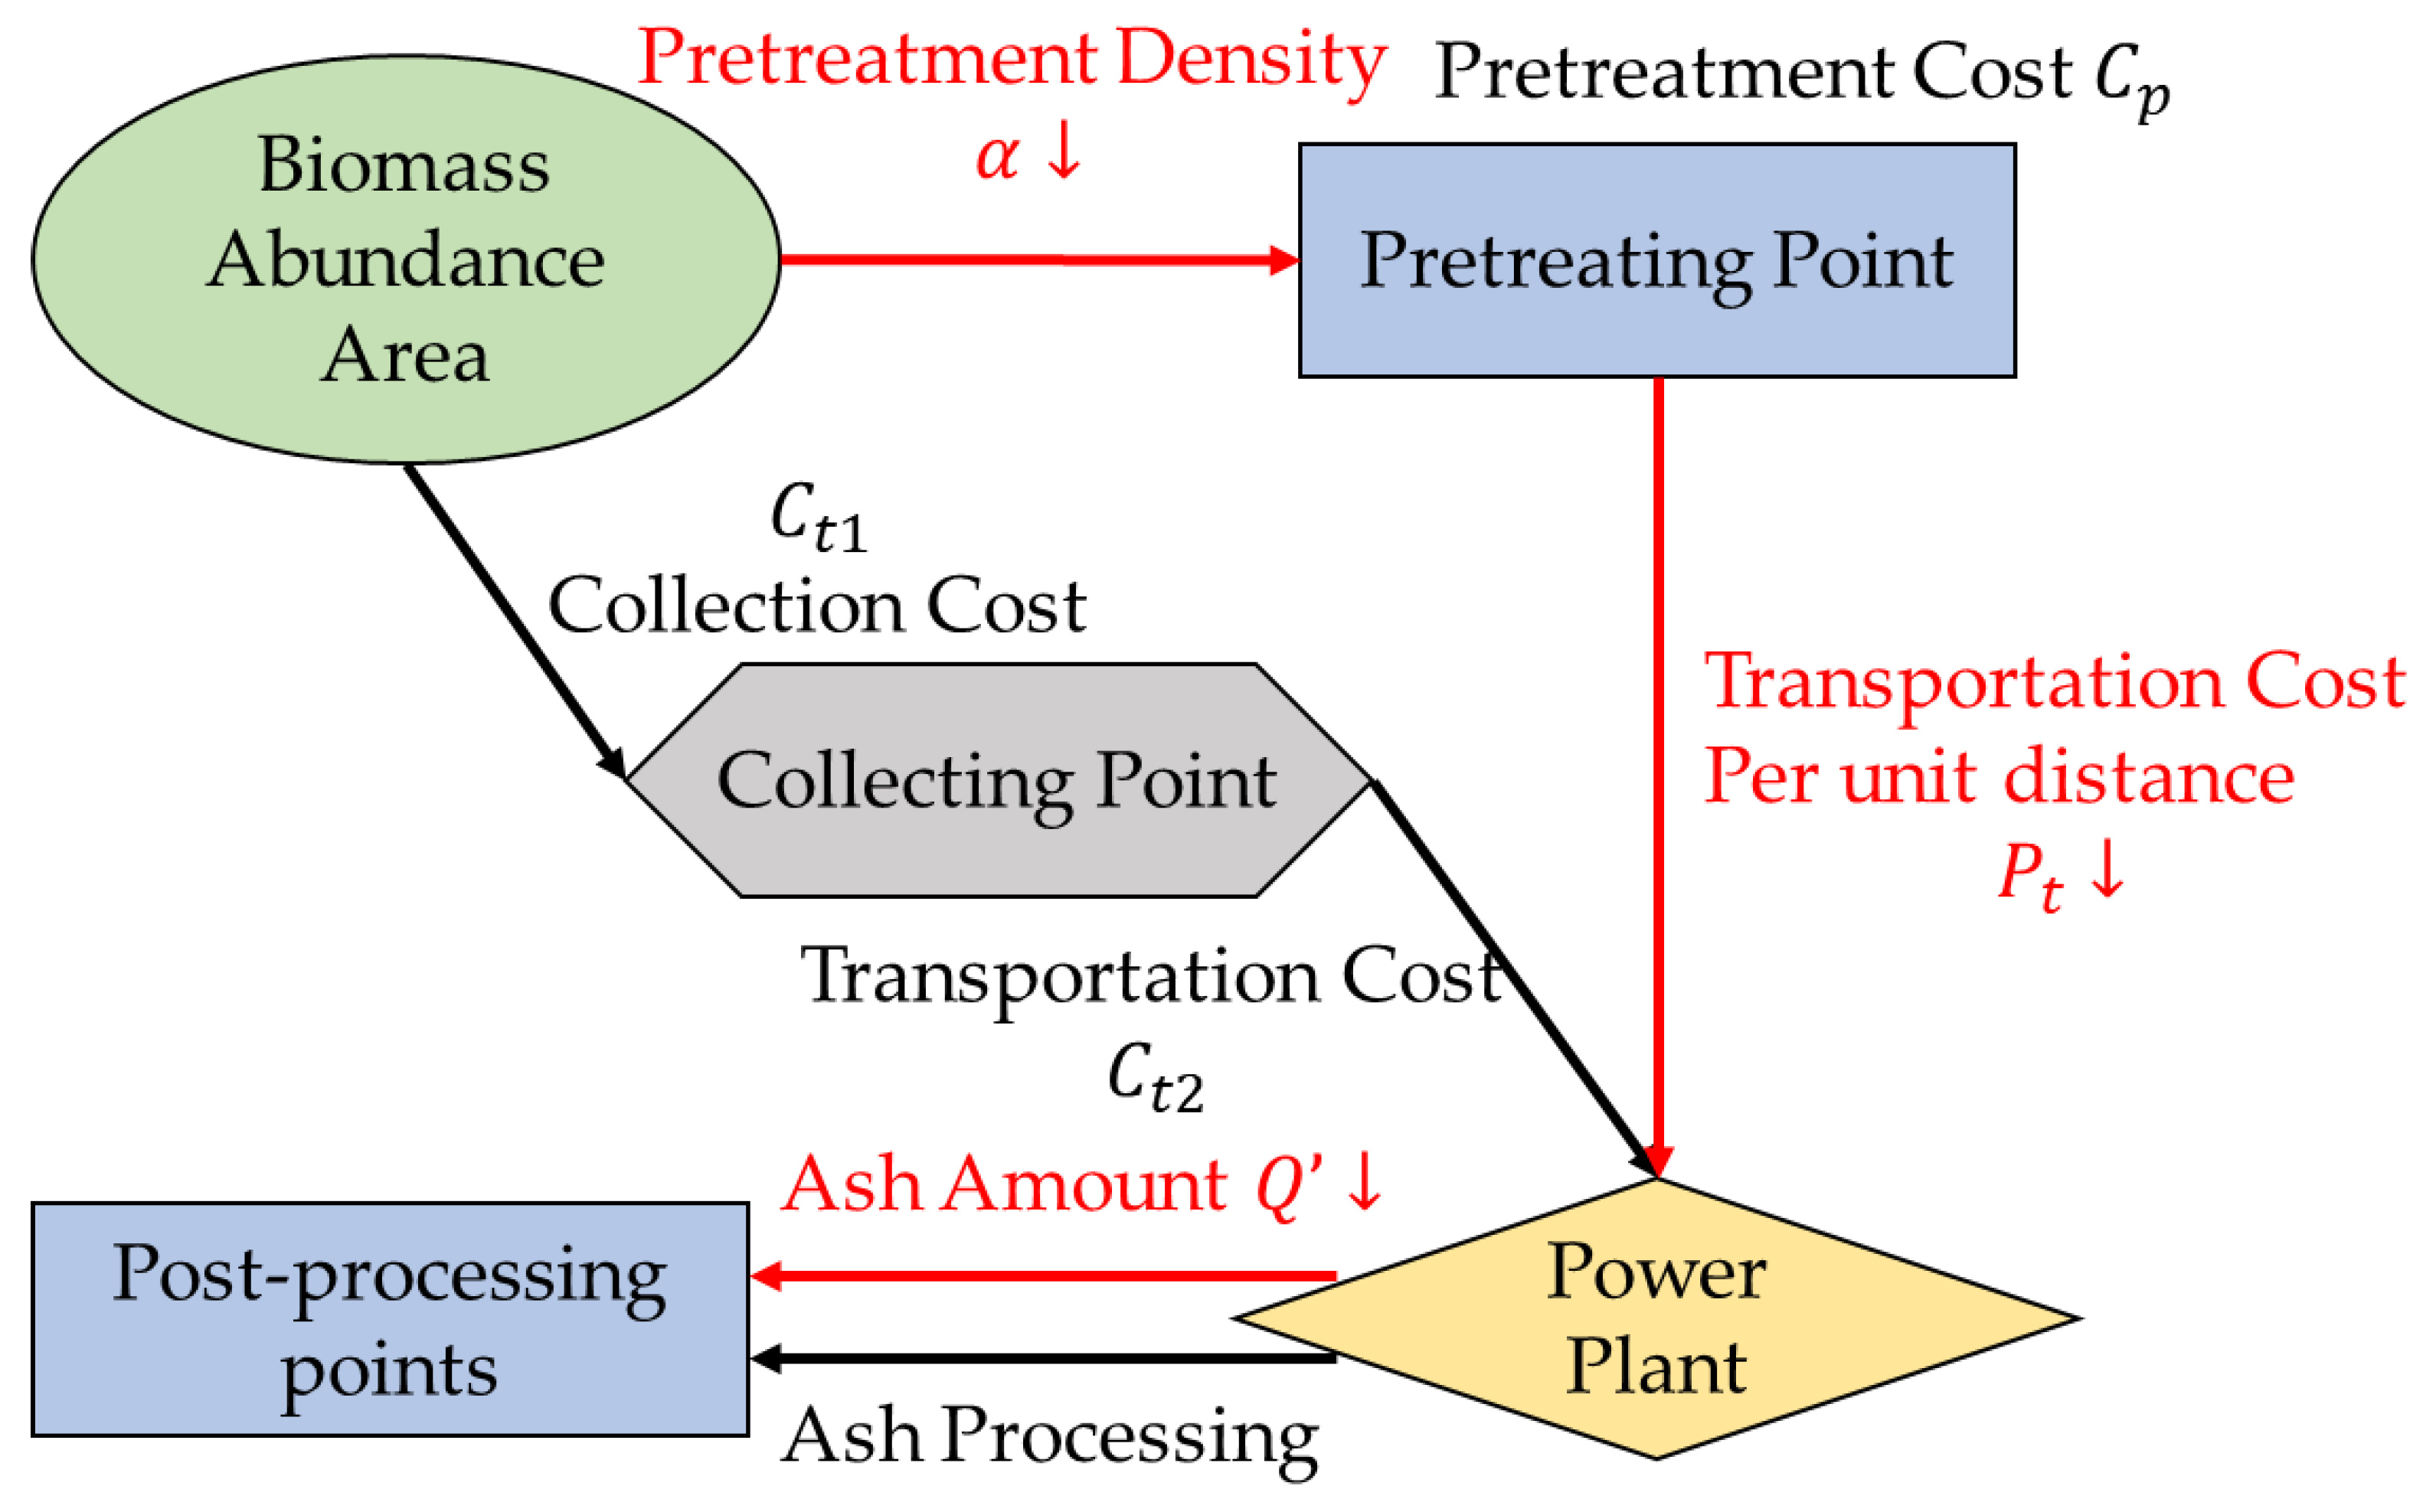
Figure 8 shows the difference in raw material cost between when pretreatment exists and when direct combustion is applied. By improving the energy density of the raw materials through pretreatment, the transportation cost from collection to power generation is significantly reduced. The longer the transportation distance, the more it becomes necessary to perform pretreatment on agricultural biomass.

3. Results and Discussion

3.1. Torrefaction

The torrefaction experiment changes the sample’s characteristics as a fuel, including its composition, higher heating value (HHV) and lower heating value (LHV), and the energy loss during processing. Ash, volatiles, and fixed carbon are essential evaluation criteria when determining suitability as a fuel. However, the cost also makes the heat retention rate an essential factor.
The torrefaction experiment was used to test the manufacture of solid fuels derived from biomass energy. From the viewpoint of the residual energy rate, a higher solid residual rate can ensure more energy residual, up to a point. In the experiment, the benchmark of 80% solid residue rate was set. A higher solid residue rate brings higher moisture residue. Thermal analysis images also show that the stage of 80% solid residue rate is less chemically changed. One stage was conducive to energy retention, so the experimental condition of 250 °C was determined, corresponding to the solid residue rate of 80%, and the experimental conditions were adjusted several times to obtain this result. An experiment with 250 °C was processed to obtain 50% mass residue. From this, the temperature in the experimental conditions was adjusted and lowered, and we obtained close to 80% mass residue results in the 150-degree experiment. The 150-degree experimental result was close to our expectations, therefore, the low-temperature experiment was not performed.
Table 2 shows the rice husk torrefaction experiment results [17]. According to the results, the residual rate of roasted rice husk varies with the experimental temperature. Under the conditions of 140.1 °C, 176.3 °C, and 234.4 °C, the mass retention rates were 87.18%, 62.26%, and 51.07%, respectively.
Table 3 shows the industrial analysis results. The results show that the ash content, volatile matter, and fixed carbon content of the product changed. The calorific value also changed. Due to processing loss under the experimental conditions of 140.1 °C, 176.3 °C, and 234.4 °C, the heat retention rates were 90.2%, 77.2%, and 59.2%, respectively.
Figure 9 shows the ratios of energy loss, pyrolysis gas’s energy, and energy of the solid residue of the torrefied rice husks. This figure shows that with the increase in reaction temperature, the energy of solid residue decreased to 59.19%. The energy loss reached 28.07% in the torrefaction process. This experiment confirmed that as the reaction temperature increased in the torrefaction process, the energy loss and the ratio of the pyrolysis gas’s energy to the energy of the solid residue increased. Figure 10 shows the low heat value of torrefied rice husks. As shown in this figure, the low heat value of torrefied rice husks was 17.2 MJ/kg when the mean reaction temperature was 234.4 °C, about 1.16-fold higher than the low heat value of raw rice husk at 14.84 MJ/kg. This shows that increasing the reaction temperature of the torrefaction process led to an increase in the low heat value of rice husk products.
Figure 11 shows the components of torrefied rice husks. This figure shows that at 234.4 °C, the fixed carbon content in the rice husks changed from 16.8% to 41.7%, while the ratio of ash changed from 19.7% to 39%. The ratio of volatile matter also changed from 63.5% to 19.3%. These results indicate that with the increase in the temperature setting of the torrefaction process, the fixed carbon content tends to increase as well. On the other hand, it also showed an increase in ash, which inhibits burning, and a decrease in volatile matter. The results show that the treated material at 234.4 °C has a high fixed carbon content, which is highly effective in increasing the LHV, but may increase the ash content and decrease the mass residue. Energy loss is common. On the other hand, the 140.1 °C and 176.3 °C treatments had a higher solids content and higher heat retention than those of the 234.4 °C treatments; the 140.1 °C and 176.3 °C treatments have a closer LHV, so the product treated at 140.1 °C is better, which has a higher solids content. The specific application is also related to the equipment and its usage.

3.2. Hydrothermal Treatment

In the hydrothermal treatment, the raw material undergoes complex chemical reactions in solvents, resulting in the decomposition of solvent–soluble components, often accompanied by a reduction in weight.
Table 4 shows the results of the hydrothermal treatment experiment [18].
  • In the hydrothermal treatment of rice husks, the weight after air-drying was 2.58 g, and the residual mass rate was 58.6%.
  • With hydrothermal treatment in a NaOH solution, the solid matter’s weight after air-drying was 2.29 g, and the residual mass rate was 53.3%, which is lower than the results for the rice husk hydrothermal treatment in water.
The lower mass residue of rice husks by hydrothermal treatment as compared to torrefaction may be due to the excessive dissolution of some of the substances in the husk in solvents. In future studies, control of the experimental conditions may be considered to obtain more experimental products.

3.3. Analysis of Torrefaction and Hydrothermal Treatment by TG/DTA

Using TG/DTA analysis, it is possible to visualize the changes in the specimen’s weight with at different temperatures and over time, which helps us understand the changes in the specimen during torrefaction and hydrothermal treatment.
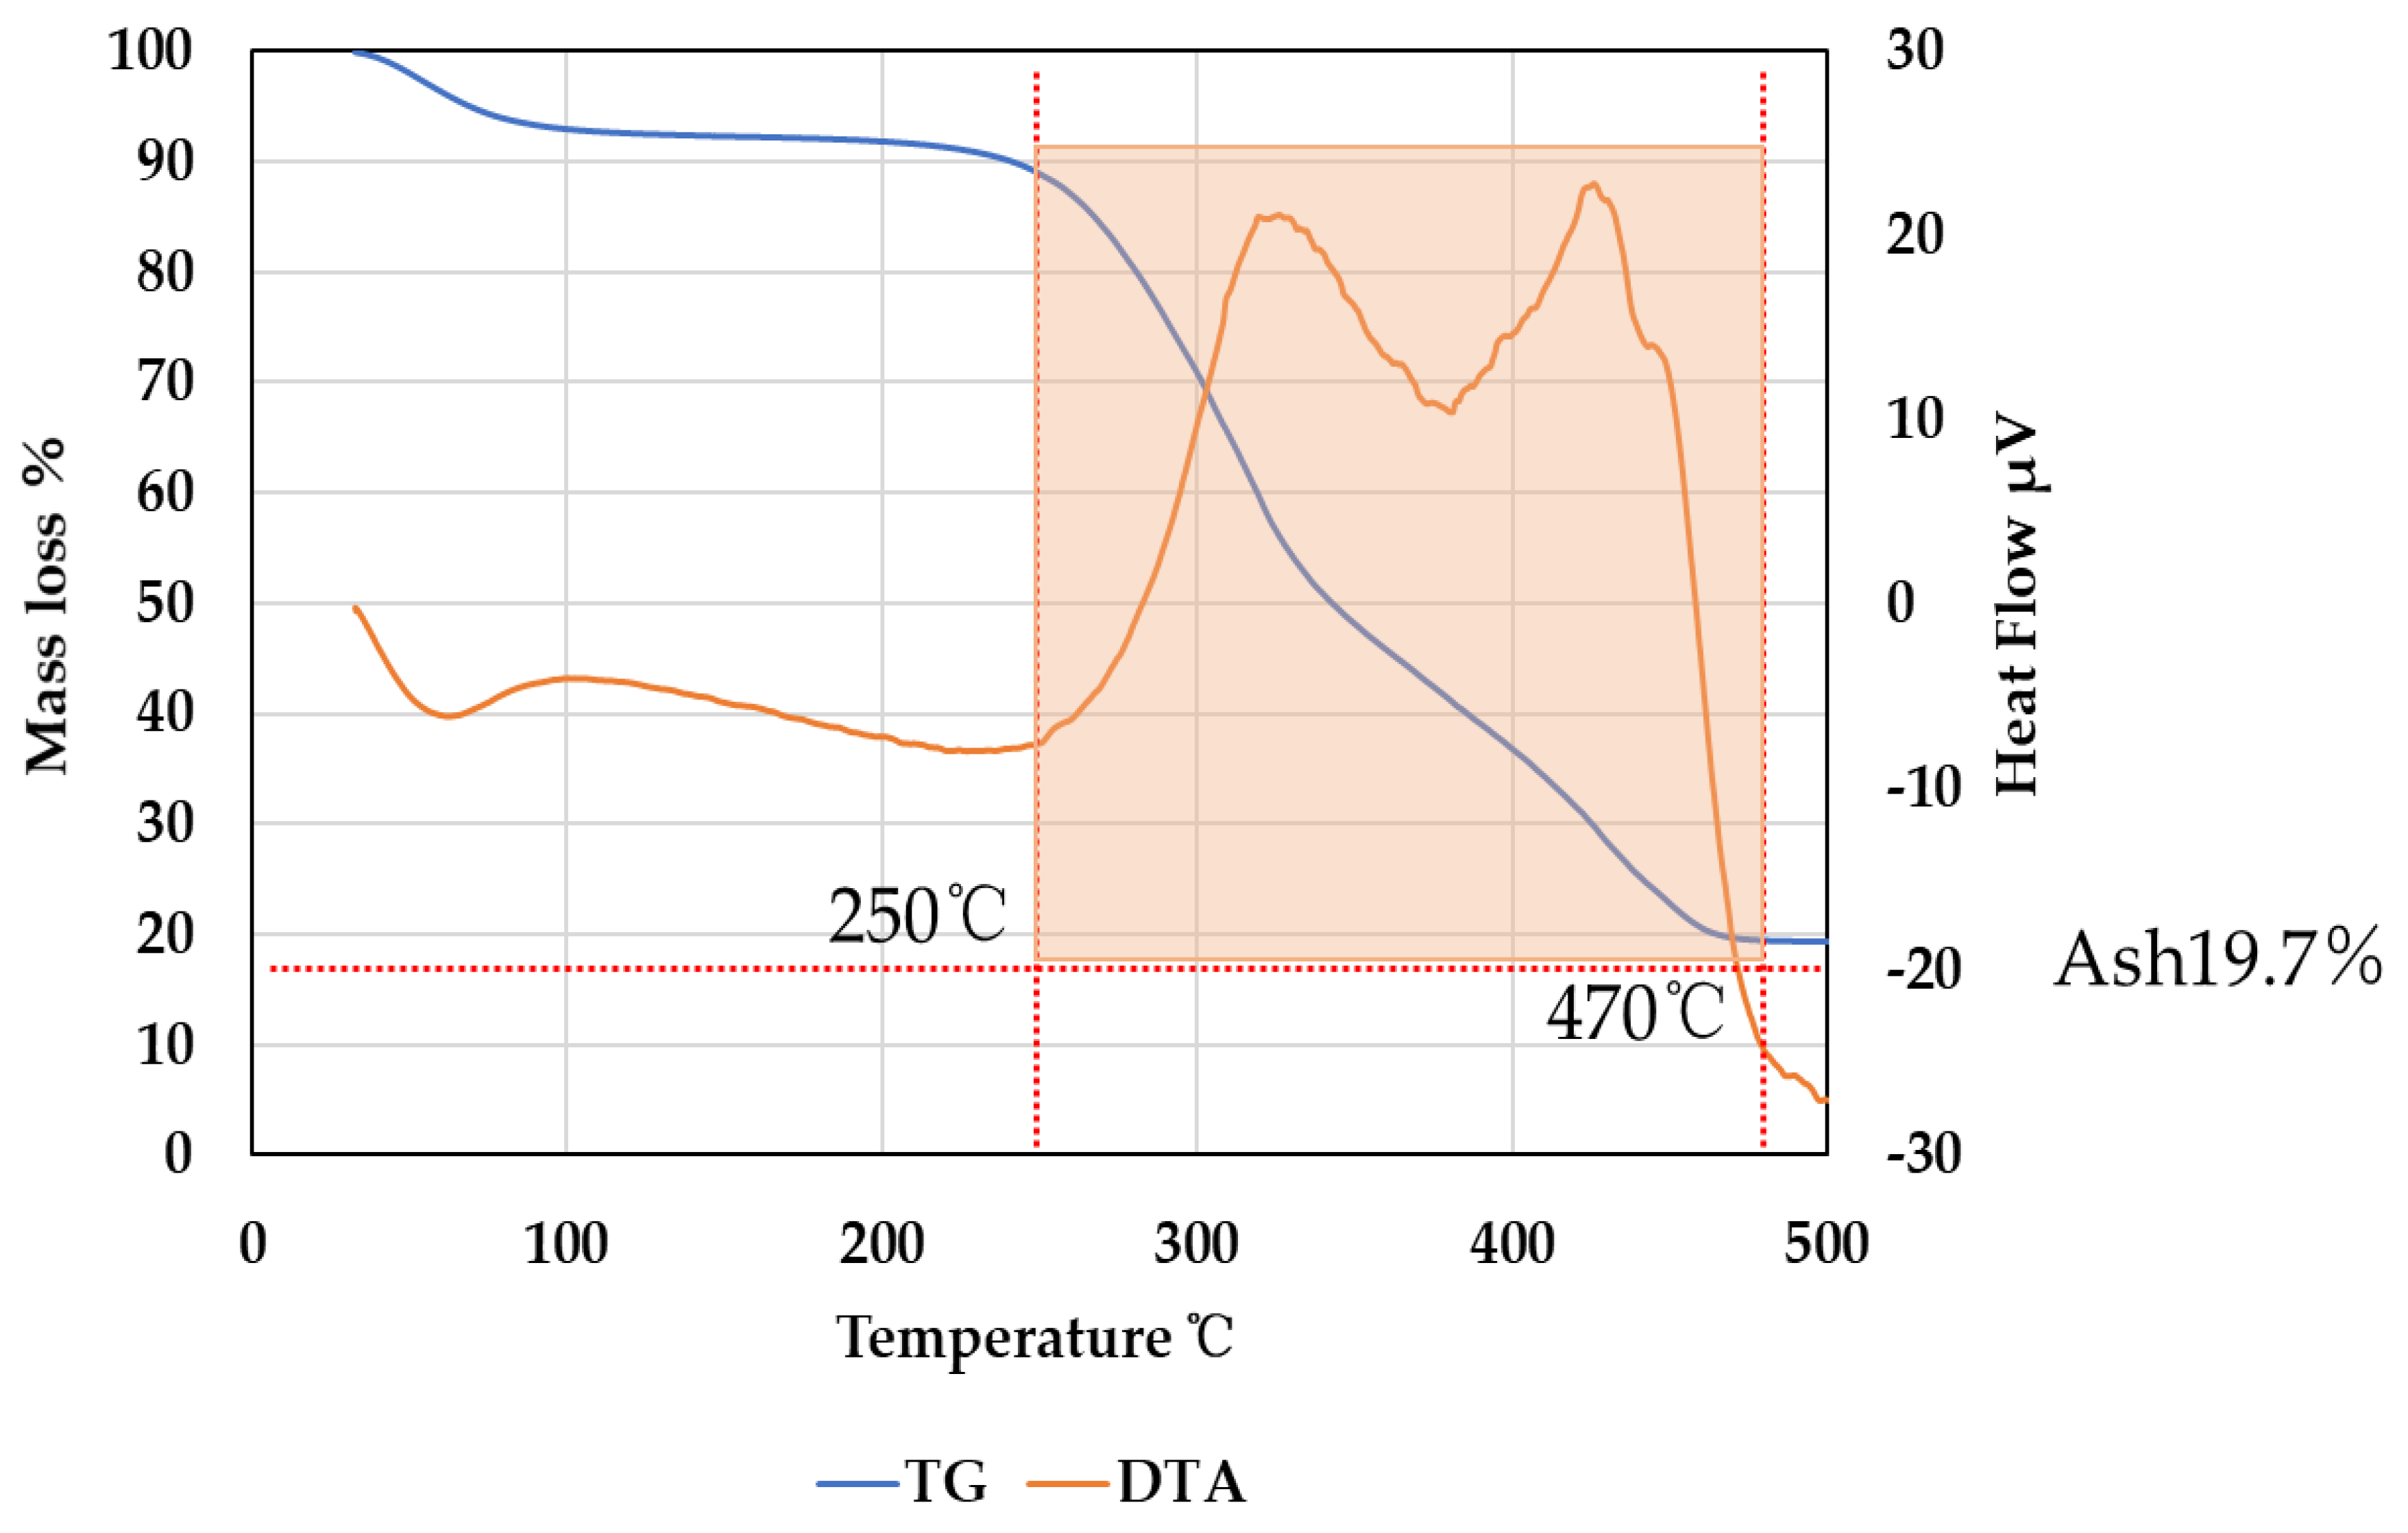
Figure 12 shows the results of the TG/DTA analysis on rice husks from Nagano, which were used as the experimental material. These results show that the rice husks’ weight reduction was significant when treated at temperatures exceeding 250 °C.
Figure 13 shows the results of the TG analysis of the torrefied rice husks and raw rice husks. From this figure, it can be seen that there was no drastic change in the torrefied rice husks during the interval when there was a significant weight decrease. With the torrefied rice husks, the weight decrease started after 250 °C, similar to the raw rice husks, and complete combustion occurred at approximately 470 °C. On the other hand, the analysis atmosphere was set as air, and the ratio of ash was shown for the last mass residue. As a result, the ratio of ash in the torrefied rice husks showed a tendency to increase with the rise in reaction temperatures. Specifically, the ash content in the raw rice husk changed from 19.7% to 22.5%, 26.7%, and 39% at reaction temperatures of 140.1, 176.3, and 234.4 °C, respectively.
Figure 14 shows the TG of raw rice husks or rice husks that were treated through the hydrothermal process. This figure shows that for rice husks that had been subjected to hydrothermal treatment, their weight decrease started at 240 °C, at which point a rapid reduction in weight manifested until a temperature of approximately 330 °C. The assumption, in this case, is that the ratio of products that are easily combustible increases due to the degradation of the sample through hydrothermal treatment. It is also clear that the sample’s ash content significantly decreased. Specifically, while the ash content ratio of the raw rice husks was 19.7%, the ash content ratio of rice husks that had been processed with either water or an NaOH solution stood at 13.96% and 8.87%, respectively.
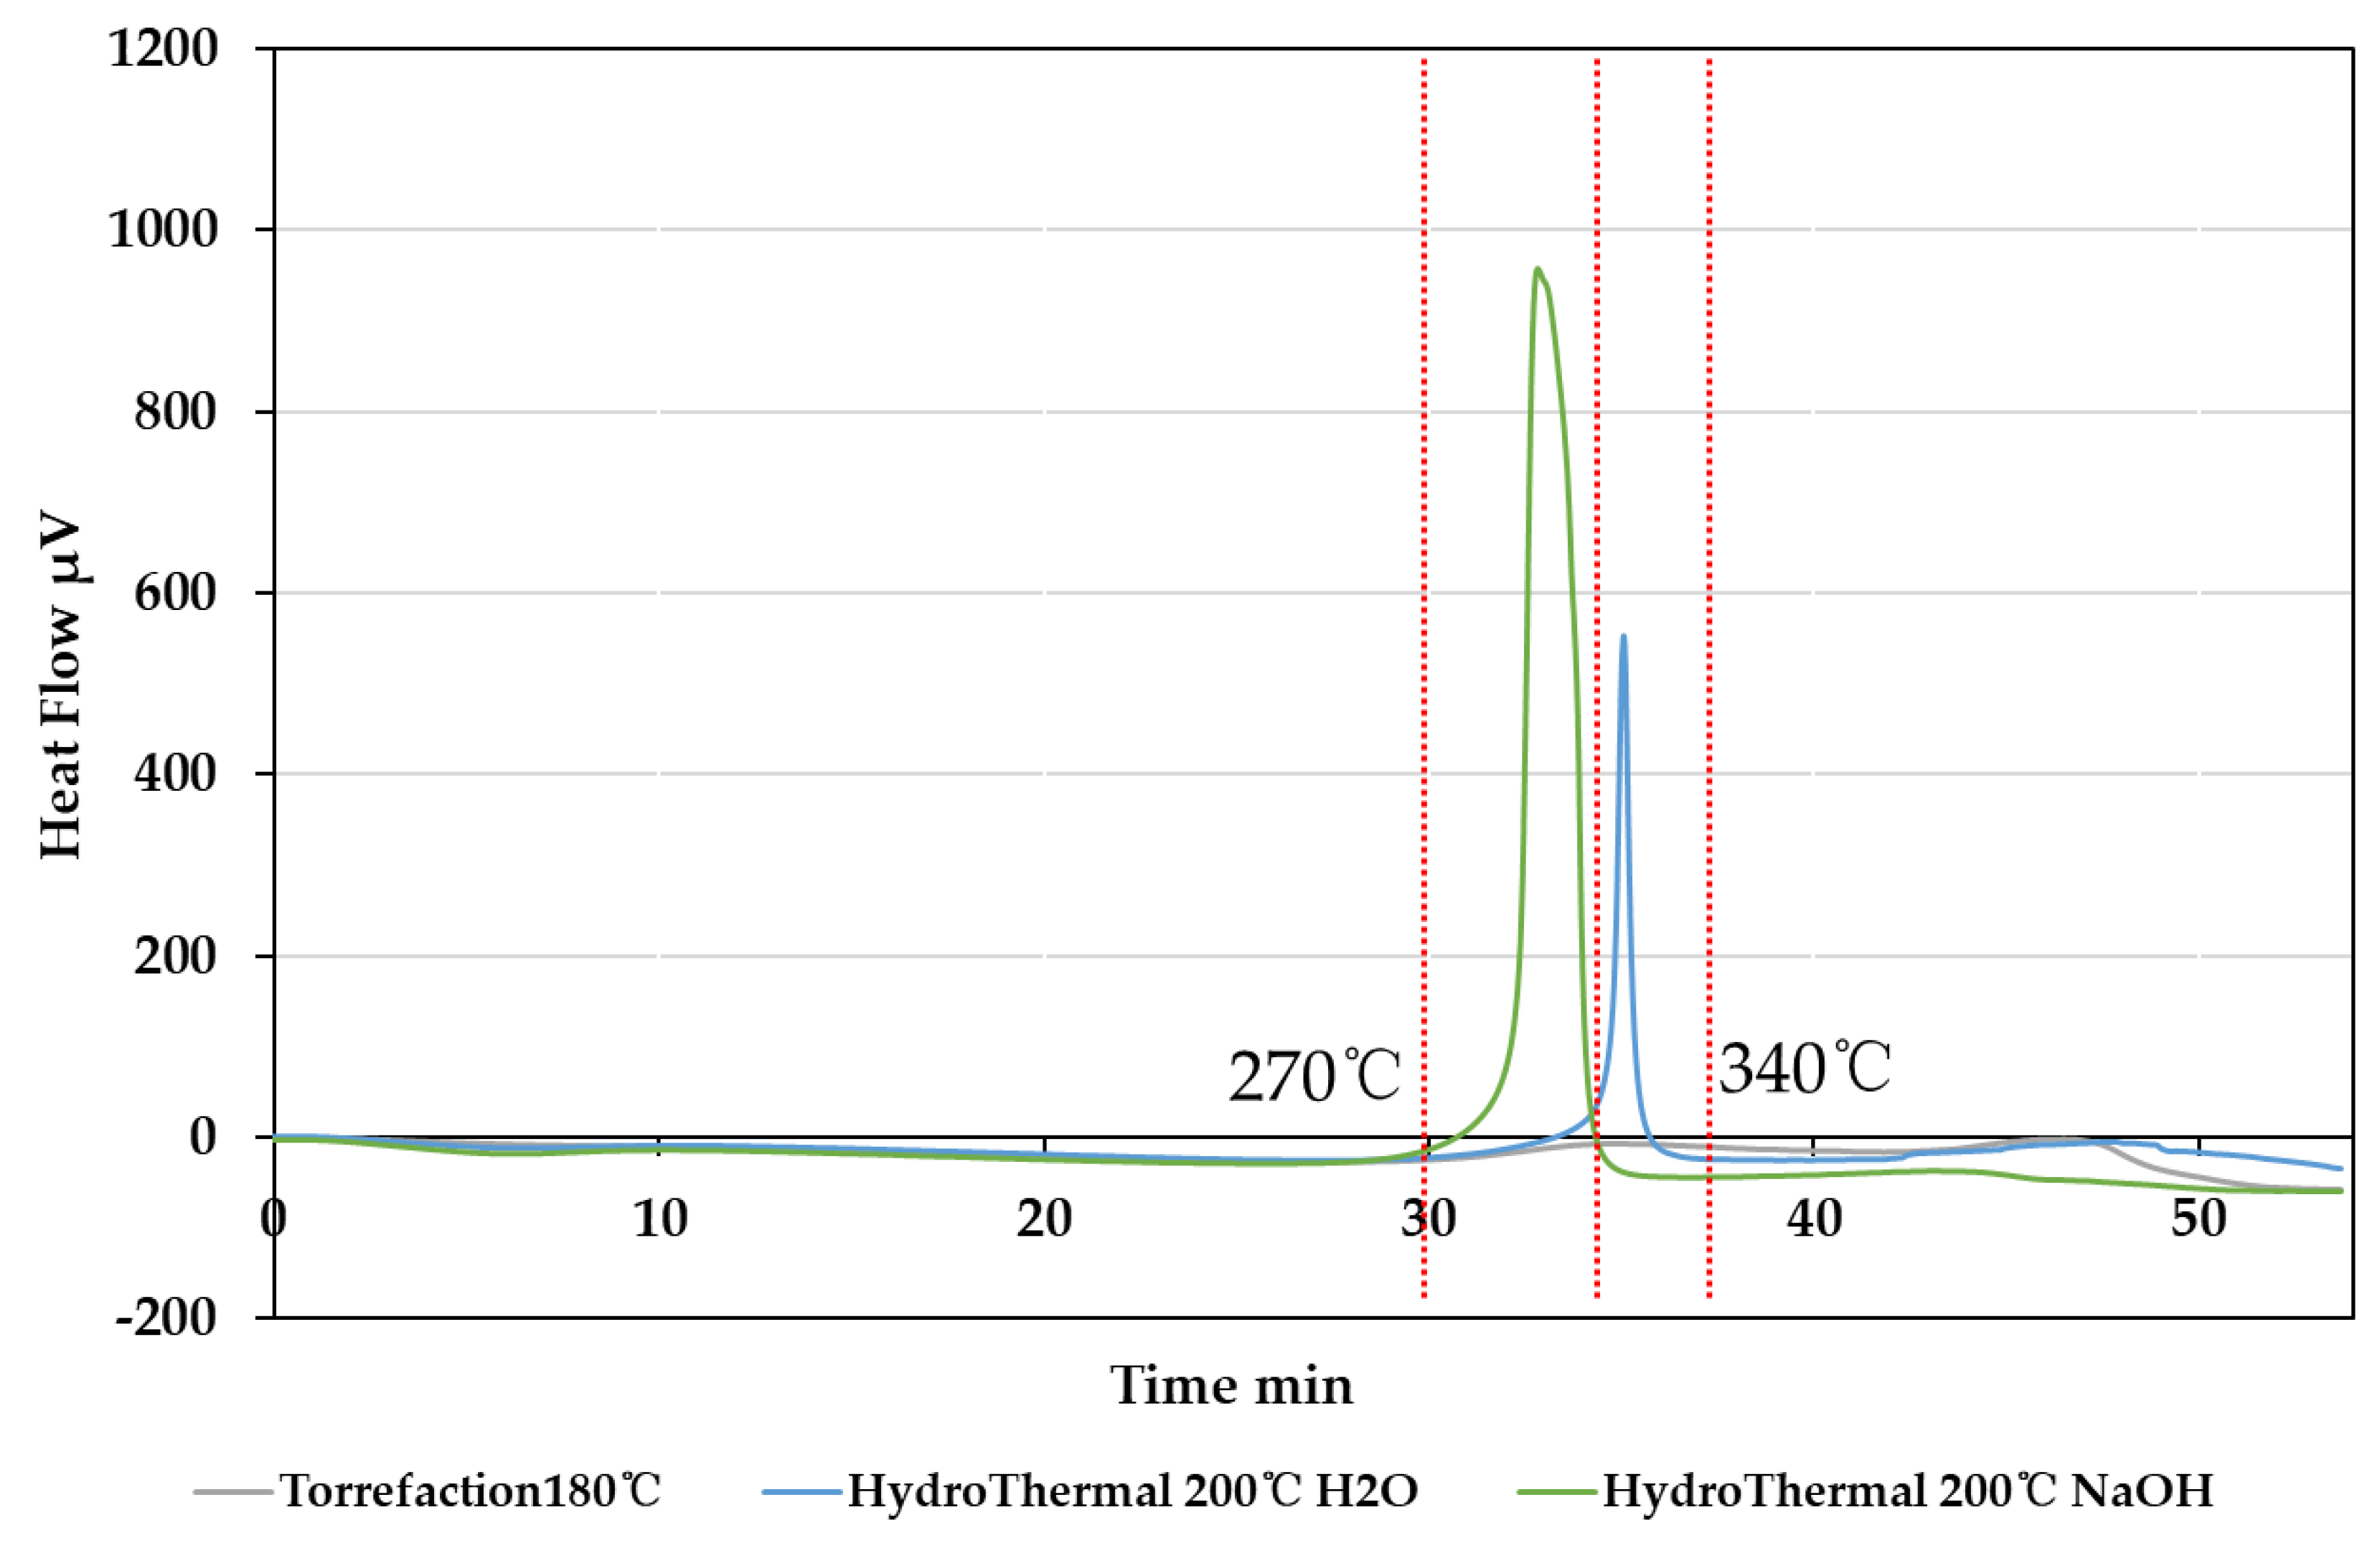
Figure 15 and Figure 16 show the results of the comparison with 180 °C torrefied rice husks with experimental conditions close to those used in the hydrothermal method. As shown in these results, the ratio of ash is lower in products that underwent hydrothermal treatment. However, unlike continuous combustion in torrefaction, hydrothermal products experience intense combustion, undergo a heat release peak between 240 and 340 °C, and then subsequently enter a stable combustion state. In addition, the figures show that rice husks processed by NaOH tend to be more combustible.
Table 5 summarize the comparison of the rates of change in the ash content of biomass raw materials by pretreatment technology. Direct carbonization and torrefaction increased the ash content ratio of raw materials, with the rate of increase rising with the surge in temperature. These results suggest that hydrothermal treatment tends to reduce the ash content ratio of raw materials. Meanwhile, the rice husk samples treated in the water had an ash content ratio that was 29.14% lower than that of the raw rice husks, and the reduction in ash content ratio of the rice husks subjected to hydrothermal treatment in NaOH was 54.97%.

3.4. The Resource Island Model

Table 6 draws from the experimental data and summarizes the mass residual rate obtained from direct combustion, torrefaction, and hydrothermal treatment using the raw husks―which are a form of agricultural biomass―as raw material, as well as their respective rate of increase in energy density, assuming there is compression. The calculation of energy density includes the compression process, which improves the bulk density of agricultural residues. According to the authors of [21], the bulk density of rice husks is approximately 0.09–0.15 t/m3, with its mean deemed to be 0.12 t/m3. The bulk density of rice husks can be improved by 3- to 9-fold through compression. Here, pelletization is assumed as the compression method, and the bulk density of rice husk pellets was 0.6 t/m3, while the improvement rate of the bulk density by compression was 5 times. The rate of improvement of energy density through hydrothermal treatment could not be obtained from this experimental data, so it was set to 1.3-fold according to data in the literature for the hydrothermal treatment of cellulose [22] and Empty Fruit Bunches (EFB) [23].
Figure 17 shows the results for the computation of transportation costs that were calculated using the resource island model. Considering rice husks as the raw material, when the transportation cost decrease ratios for torrefaction and hydrothermal treatment are calculated, assuming no compression, then the transportation cost is 54.9% for hydrothermal treatment and 43.6% for torrefaction in the case of a mass residual ratio of 60%. Figure 17 also shows the transportation cost under the premise of pelletization. The decrease ratio in transportation costs, assuming compression, was 90.8% for hydrothermal treatment and 88.7% for torrefaction.

4. Conclusions

In this report, the status of electrification and profile of rice husks in Myanmar are described in the context of biomass utilization in Southeast Asia and the torrefaction and hydrothermal treatment as pretreatment technologies were analyzed for rice husks, a form of low-grade biomass, which included calculation of their respective effects on decreasing transportation costs. The findings are summarized below.
  • The utilization of rice husks, which are abundant in Myanmar, shows great potential. Studies are being conducted regarding gasification power generation for local production and local consumption, but the utilization of rice husks has so far been limited given the problems concerning bulk density and ash.
  • In the torrefaction experiments on rice husks, results that showed improvement in the low heat value of rice husks were obtained. Whereas the low heat value of raw rice husks was 14.84 MJ/ kg, the low heat value of torrefied rice husks with a mean reaction temperature of 234.4 °C was 1.6-fold higher, at 17.2 MJ/kg. The experiments also showed that increasing the reaction temperatures in the torrefaction process tended to result in an increase in the low heat value of rice husk products. However, the experiments also showed that with the rise in reaction temperature, there will be less solid residue, with increases in the ratios of mass loss and ash.
  • Hydrothermal treatment experiments were conducted in a liquid flow reactor to reduce ash and improve its characteristics as fuel. With hydrothermal treatment, it is possible to obtain products with less ash content than the torrefied rice husks of the same mass residual rate. Specifically, compared to the 26.7% ash ratio of the torrefied rice husks, the ash ratios of the rice husks processed with either water or NaOH solution were 13.96% and 8.87%, respectively. It can therefore be said that the significant advantage of this treatment lies in its reduction of the ash content of rice husks, which are an agricultural biomass material with a high ash ratio. In terms of ash content alone, rice husks treated with a NaOH solution are more suitable for energy fuel use. However, there is a trade-off between the use of NaOH and the increased efficiency of ash treatment, as the use of sodium hydroxide will increase the cost. This will be an issue for further research and review. Silica is the main component of ash. At room temperature, it can be partially dissolved in a NaOH solution. The solubility increases with increasing temperature. The sodium silicate produced by the dissolution can be dissolved in water, which means that the alkaline solution can separate the raw material’s silica component. Therefore, a speculation could be made that a large amount of silica can be dissolved in the reaction solvent to reduce ash under NaOH-hydrothermal treatment conditions.
  • The effects on the reduction of transportation costs was computed through the resource island model. When rice husks were the raw material, the transportation cost reduction ratios, assuming no compression, were 54.9% for the hydrothermal treatment and 43.6% for torrefaction when the mass residual rate was 60%. Meanwhile, the transportation cost reduction ratio in the case of compression was 90.8% for the hydrothermal treatment and 88.7% for torrefaction. Regarding pretreatment of rice husks, the results demonstrate that the transportation cost reduction effect of hydrothermal treatment is more significant.
As described above, we studied the pretreatment of rice husks by torrefaction and hydrothermal treatment for utilization of rice husks in Myanmar. The utilization of rice husks and other agricultural biomass has various issues related to specific utilization methods, the maturity of energy transformation technology, commercialization, and marketing. We anticipate that the effective utilization of low-grade biomass will become a part of the solution to the electrification problems in Southeast Asia.

Author Contributions

Conceptualization, H.O.; methodology, H.O.; software, T.C.; validation, T.C., A.H.P., and H.O.; formal analysis, T.C.; investigation, T.C., A.H.P., and H.O.; resources, T.C., A.H.P., and O.H.; data curation, T.C. and H.O.; writing—original draft preparation, A.H.P. and H.O.; writing—review and editing, A.H.P. and H.O.; visualization, T.C.; supervision, H.O.; project administration, H.O.; funding acquisition, H.O. All authors have read and agreed to the published version of the manuscript.

Funding

The APC was funded by Waseda University.

Acknowledgments

The authors express gratitude to Finetech CO., LTD., who assisted with the experiments in this study. This study was supported by the Japan Science and Technology (JST) Agency, Strategic International Collaborative Research Program (JST SICORP), under the e-Asia Feasibility Study on Social Implementation of Bioenergy in East Asia.

Conflicts of Interest

The authors declare no conflict of interest.

References

  1. Pandyaswargo, A.H.; Pang, D.; Ihara, I.; Onoda, H. Japan-Supported Biomass Energy Projects Technology Readiness and Distribution in the Emerging Southeast Asian Countries: Exercising the J-TRA Methodology and GIS. Int. J. Environ. Sci. Dev. 2020, 11, 1–8. [Google Scholar] [CrossRef]
  2. Study on Rice Husk Power Generation System for Low-Carbon Communities in Ayeyarwady Region; Institute Fujita Corporation: Tokyo, Japan, 2015; pp. 11–16.
  3. World Bank East Asia and Pacific Economic Update 2012: Remaining Resilient. The World Bank, 19 December 2012, pp. 20–21. Available online: https://www.worldbank.org/en/news/feature/2012/12/19/east-asia-and-pacific-economic-update-december-2012-remaining-resilient (accessed on 16 June 2020).
  4. Feasibility Study on Rice Husk Power Generation System for Low-Carbon Communities in Ayeyarwady Region, Myanmar; Mitsubishi Research Institute, Fujita Corporation: Tokyo, Japan, 2015.
  5. Sano, H.; Honjo, T. Principle of Semi-carbonization of Biomass and the Effect on Use. J. High Temp. Soc. 2011, 37, 43–49. [Google Scholar] [CrossRef] [Green Version]
  6. European Biofuels. Bioenergy Value Chains4: Pyrolysis and Torrefaction. 2016. Available online: http://www.etipbioenergy.eu/images/EIBI-4-torrefaction%20and%20pyrolysis.pdf (accessed on 7 September 2020).
  7. Cremers, M.; Koppejan, J.; Middelkamp, J.; Witkamp, J.; Sokhansanj, S.; Melin, S.; Madrali, S. Status Overview of Torrefaction Technologies: A Review of the Commercialisation Status of Biomass Torrefaction Executive Summary; IEA Bioenergy: Paris, France, 2015. [Google Scholar]
  8. Poudel, J.; Karki, S.; Oh, S.C. Valorization of Waste Wood as a Solid Fuel by Torrefaction. Energies 2018, 11, 1641. [Google Scholar] [CrossRef] [Green Version]
  9. Omura, K.; Pandyaswargo, A.H.; Hiroshi, O. LCCO2 of coal co-firing with imported torrefied woody biomass in Japan. J. E3S Web Conf. 2018, 74, 03001. [Google Scholar] [CrossRef]
  10. Tekin, K.; Karagoz, S.; Bektaş, S. A review of hydrothermal biomass processing. Renew. Sustain. Energy Rev. 2014, 40, 673–687. [Google Scholar] [CrossRef]
  11. Saha, N.; Saba, A.; Saha, P.; McGaughy, K.; Franqui-Villanueva, D.; Orts, W.J.; Hart-Cooper, W.M.; Reza, M.T. Hydrothermal Carbonization of Various Paper Mill Sludges: An Observation of Solid Fuel Properties. Energies 2019, 12, 858. [Google Scholar] [CrossRef] [Green Version]
  12. Available online: https://qgis.org/ja/site/ (accessed on 16 June 2020).
  13. Myanmar: Capitalizing on Rice Export Opportunities. The World Bank, 28 February 2014, pp. 53–54; Economic and Sector Work Report No. 85804. Available online: https://www.worldbank.org/en/country/myanmar/publication/myanmar-capitalizing-on-rice-export-opportunities (accessed on 16 June 2020).
  14. Aung, S.M. Burma—Union of Grain and Feed Annual, 2018 Annual Report; USDA Foreign Agricultural Service: Washington, DC, USA, 2018.
  15. Agriculture Guide 2019; EuroCham Myanmar: Yangon, Myanmar, 2018.
  16. Mofijur, M.; Mahlia, T.M.I.; Logeswaran, J.; Anwar, M.; Silitonga, A.; Rahman, S.A.; Shamsuddin, A.H. Potential of Rice Industry Biomass as a Renewable Energy Source. Energies 2019, 12, 4116. [Google Scholar] [CrossRef] [Green Version]
  17. Ogawa, G.; Wu, S.; Pandyaswargo, A.H.; Onoda, H. Experimental Study on Rice Husks Torrefaction: Technology Development Potential in Myanmar’s Unelectrified Area. In Proceedings of the International Workshop on Environmental Engineering 2019, Okinawa, Japan, 25–28 June 2019; E209. p. 6. [Google Scholar]
  18. Wu, S.; Cheng, T.; Onoda, H. Study on Applicability of Pretreatment Technology for Low-Grade Biomass Focusing on Hydrothermal Treatment and Torrefaction. In Proceedings of the Symposium on Environmental Engineering 2020, Turin, Italy, 29 June–2 July 2020; p. 208. [Google Scholar]
  19. Xing, A.; Liu, G.; Wang, Y.; Wei, F.; Jin, Y. Economic, Energy and Environment Analysis on Biomass Collection Process. Chin. J. Process Eng. 2008, 8, 305–313. [Google Scholar]
  20. Tan, Q.; Yang, H.; Zhang, X.; Deng, Y.; Wei, Y. Estimation Model and Empirical Analysis of Biomass Power Generation Fuel Collection Cost. Available online: www.china-nengyuan.com (accessed on 11 July 2017).
  21. Siddique, A.; Cachim, P. Waste and Supplementary Cementitious Materials in Concrete, Characterisation, Properties and Applications; Woodhead Publishing Series in Civil and Structural Engineering; Woodhead Publishing: Sawston, UK, 2018; pp. 417–460. [Google Scholar]
  22. Hu, J.; Du, Z.; Min, E. Progress in Research of Reaction Mechanism Concerning Hydro Thermal Liquefaction of Biomass; 100083; Research Institute of Petroleum Processing, SINOPEC: Beijing, China, 2012. [Google Scholar]
  23. Ruksathamcharoen, S.; Ajiwibowo, M.W.; Chuenyam, T.; Surjosatyo, A.; Yoshikawa, K. Effect of Hydrothermal Treatment on Grindability and Fuel Characteristics of Empty Fruit Bunch Derived Hydrochar. Int. J. Technol. 2018, 9, 1246–1255. [Google Scholar] [CrossRef] [Green Version]
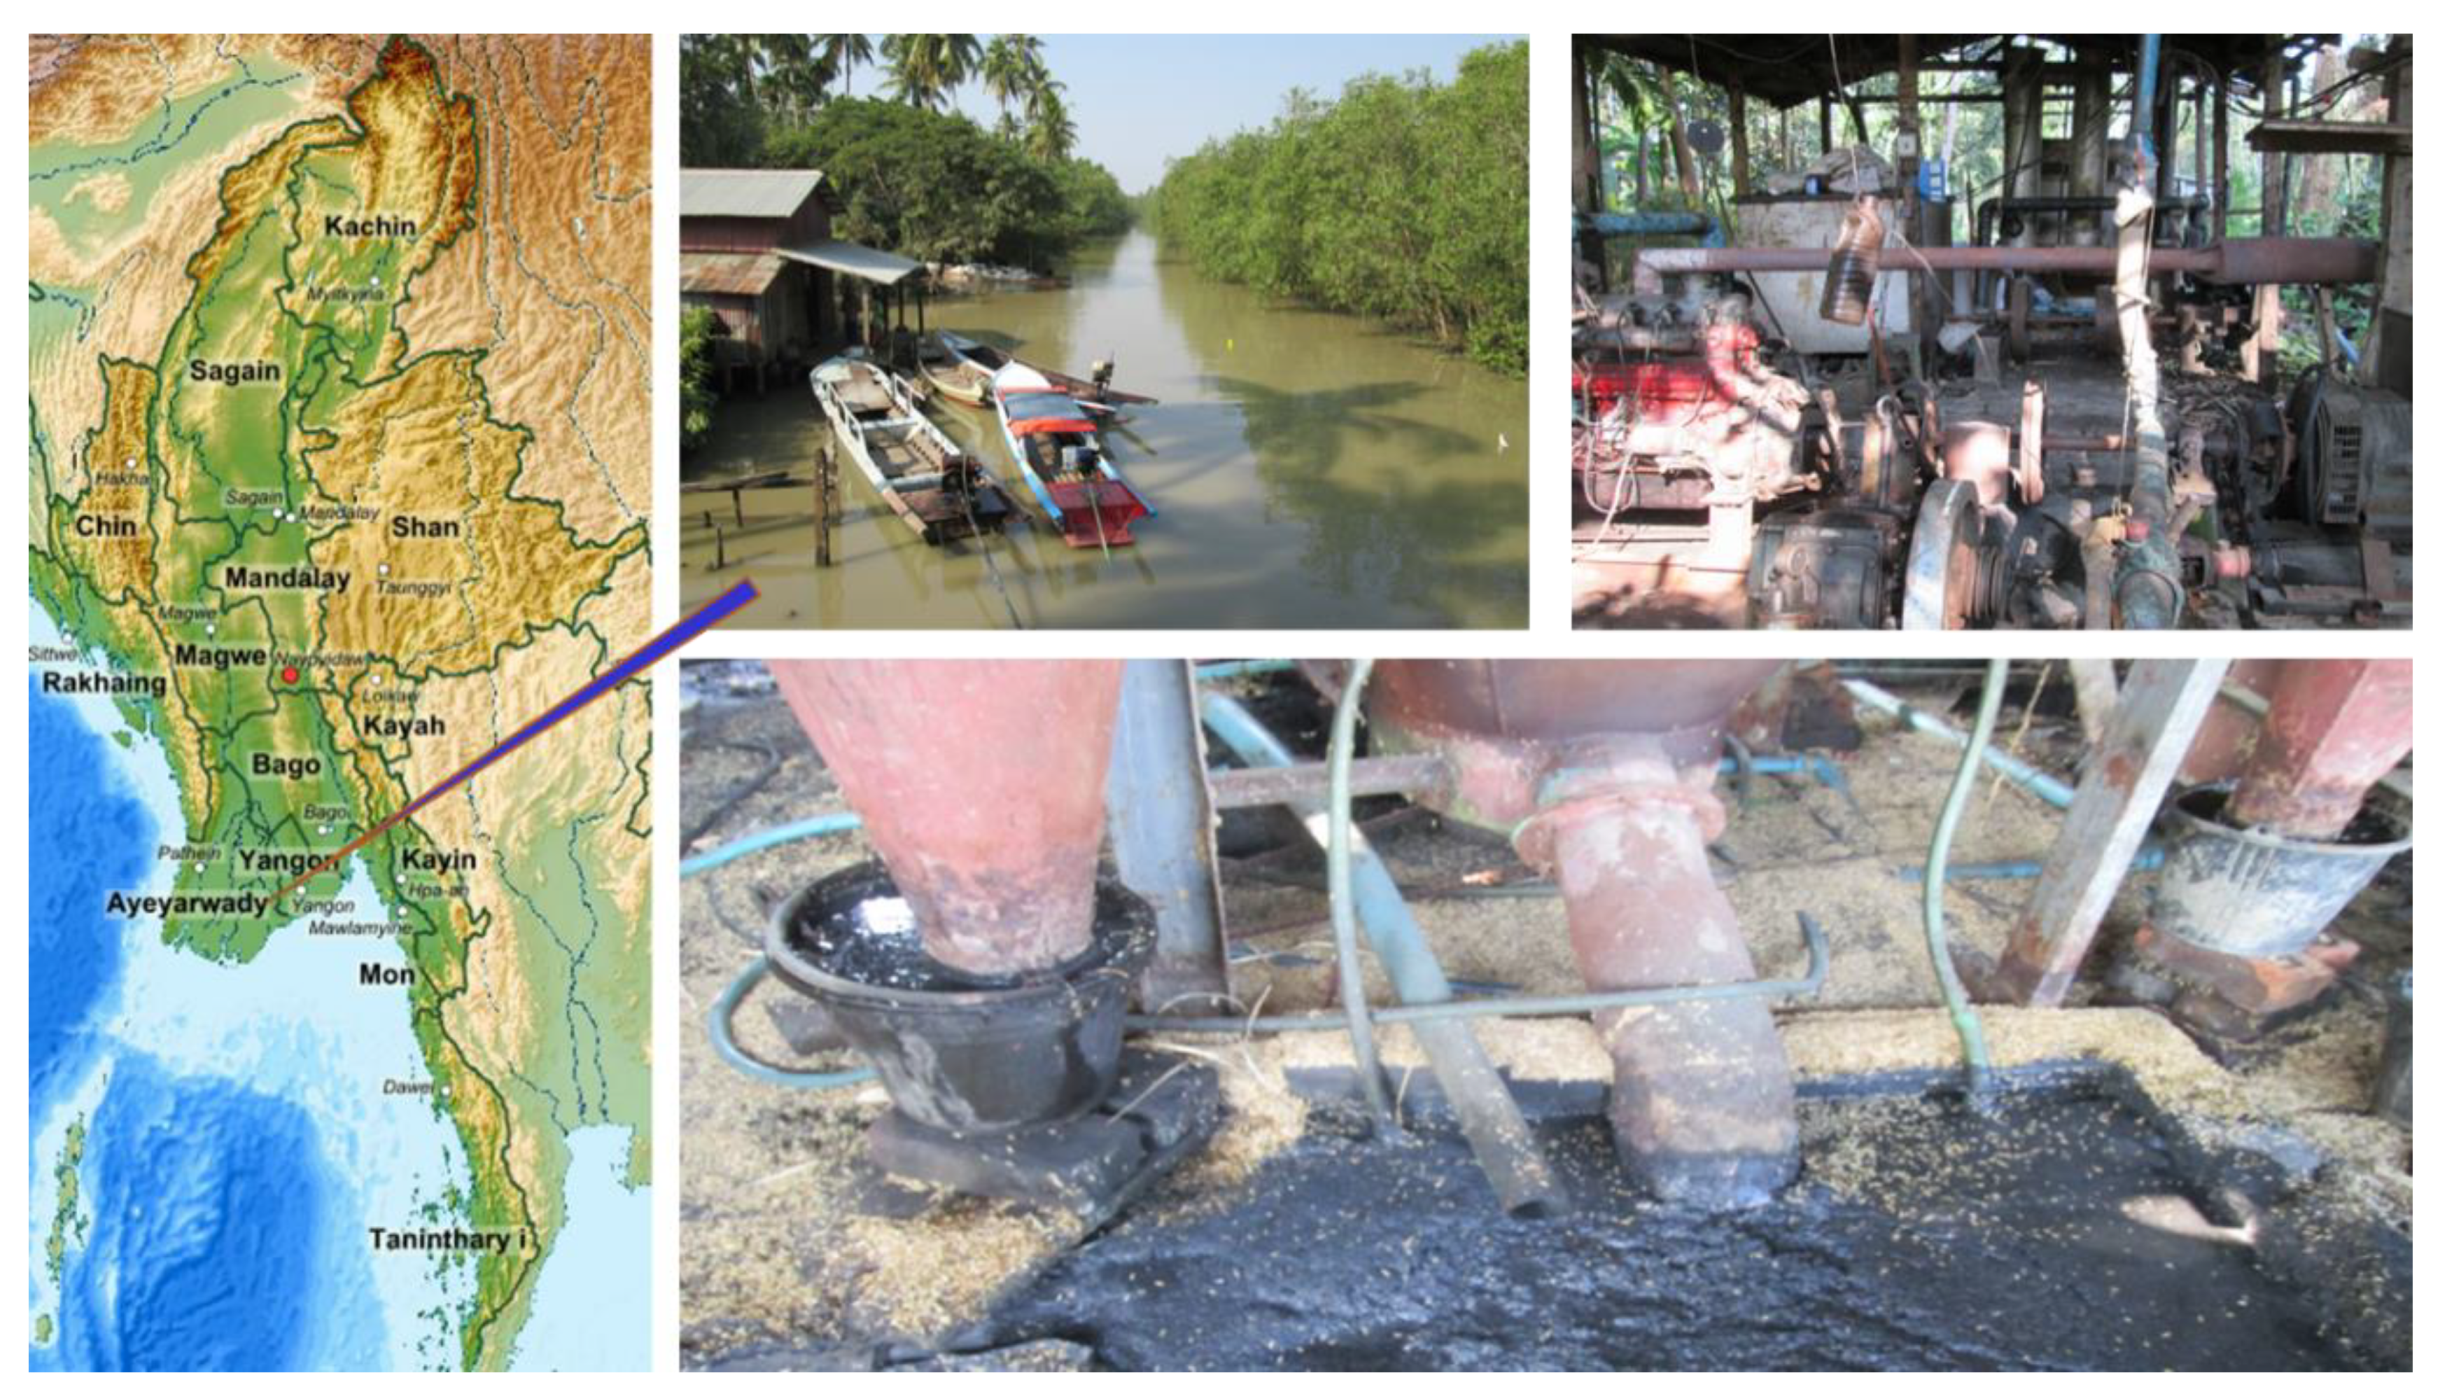
Figure 1. Case study of rice husk gasifiers in Kyawzan village, Ayeyarwady region.
Energies 13 05158 g001
Figure 2. Electrification rate and levels of rice production in Myanmar. (a) Electrification ratio of household; (b) Production volume of paddy in each district of Myanmar.
Energies 13 05158 g002
Figure 3. Torrefaction equipment: (a) appearance, (b) inside of the superheated steam torrefaction tester (front), and (c) inside of superheated steam torrefaction tester (back).
Energies 13 05158 g003
Figure 4. Torrefaction experimental equipment.
Energies 13 05158 g004
Figure 5. Floor plan of the liquid flow reactor.
Energies 13 05158 g005
Figure 6. Device diagram of the liquid flow reactor [18].
Energies 13 05158 g006
Figure 7. Biomass resource island distribution model and collection process illustration.
Energies 13 05158 g007
Figure 8. Comparison of direct combustion and pretreatment (taking Myanmar as an example).
Energies 13 05158 g008
Figure 9. Energy loss of rice husk materials before and after the torrefaction process.
Energies 13 05158 g009
Figure 10. Comparison of low heat value between rice husks and torrefied rice husks.
Energies 13 05158 g010
Figure 11. Comparison of weight residual rate between rice husks and torrefied rice husks.
Energies 13 05158 g011
Figure 12. TG/DTA analysis results of raw rice husks.
Energies 13 05158 g012
Figure 13. TG analysis results of the rice husk torrefaction products.
Energies 13 05158 g013
Figure 14. TG analysis results of the rice husk hydrothermal products.
Energies 13 05158 g014
Figure 15. Comparison of the rice husk torrefaction and hydrothermal products.
Energies 13 05158 g015
Figure 16. DTA analysis results of the rice husk torrefaction and hydrothermal products.
Energies 13 05158 g016
Figure 17. Changes in transportation costs (with the cost of transporting raw rice husks set as 100).
Energies 13 05158 g017
Table 1. Specifications of torrefaction equipment.
ItemProcessing PowerPower ConsumptionWeightPower SupplySizeElectric HeaterMode
Unitkg/hkW/htVmm °C-
Value50152Three-phase 200D400 × W100 × H1900300–600Superheated steaming
Table 2. Torrefaction experiment results.
ItemUnitExperiment 1Experiment 2Experiment 3
Set temperature °C250180150
Experiment timemin454545
Input speedg/min505050
Inputg454.6454.6454.6
Water content%8.38.38.9
Dry zone °C224.2156.3136.1
Charring zone °C234.4176.3140.1
Weightg232.1283.0396.3
Mass Residue Rate%51.0762.2687.18
Table 3. Proximate analysis results of torrefied rice husks.
ProjectUnitRaw Rice HusksTorrefied Rice Husks
234.4 °C176.3 °C140.1 °C
Water content%9.097.155.675.65
Ash%19.73926.722.5
Volatile%63.519.348.557.6
Fixed carbon%16.841.724.819.9
HHVMJ/kg15.9417.6516.6816.36
LHVMJ/kg14.8417.215.7815.35
Heat retention rate%-59.277.290.2
Table 4. Results of the hydrothermal treatment experiment.
MaterialAmount of SampleSolventTemperaturePressureAmount of OutputRe (Mass Residual Rate)
Rice Husk4.4 gwater200 °C5.8 MPa2.58 g58.64%
Rice Husk4.3 g1.5% NaOH200 °C1.2 MPa2.29 g53.26%
Table 5. Ash content change of different technologies.
TechnologyAsh Content %Raw Ash Content %Ash Change RateMaterial
Direct Combustion19.719.7100.00%Rice Husk
Torrefaction 234.4 °C39197.97%
Torrefaction 176.3 °C26.7135.53%
Torrefaction 140.1 °C22.5114.21%
Hydrothermal 200 °C H2O13.9670.86%Rice Husk
Hydrothermal 200 °C NaOH8.8745.03%
Table 6. Mass residue rate and energy density increase rate of different technologies.
TechnologyRe (Mass Residue Rate)Ir (Energy Density Increase Rate)Dr (Delivery Efficiency Rate)
By PretreatmentBy CompressTotal
Direct Combustion1111-
Torrefaction 250 °C0.51.1655.88.6
Torrefaction 180 °C0.61.065.311.3
Torrefaction 150 °C0.81.035.1515.5
Hydrothermal 200 °C H2O [22,23]0.6≈1.36.59.2