Modelling of Hard Coal Beneficiation Process Utilising Negative Pressure Pneumatic Separator


Central Mining Institute, Plac Gwarków 1, 40-166 Katowice, Poland
Energies 2020, 13(19), 5174; https://doi.org/10.3390/en13195174
Submission received: 29 July 2020
/
Revised: 27 September 2020
/
Accepted: 1 October 2020
/
Published: 5 October 2020
(This article belongs to the Special Issue Coal Mining Sustainable Development)
Abstract
:The dry separation methods for coal beneficiation have been regaining attention in the past decades. A number of improved or newly designed devices have been developed—one of them is a negative pressure pneumatic separator (NPPS). The said method of separation is based on the differences in the physical properties between coal and gangue minerals, such as the grain density, size, and shape. The aim of the hereby presented work was to develop working models describing the operation of the NPPS. To validate the models, the calculation results were compared with experimental results of the tests carried out in the previous study on the topic. Based on the findings it can be inferred that the models accurately predict the separation results, i.e., the majority of results are within the range of estimated measurement uncertainties. Consequently, the models allow one to optimise the process to obtain the products with desirable properties.
1. Introduction
Despite the rapid development of technologies utilising renewable sources of energy, coal remains a crucial resource worldwide, playing an important role in satisfying global energy demands due to its availability, reliability, safety of use, and low cost [1,2]. In most cases, the run-of-mine (ROM) coals are characterised with a high content of ash-forming mineral impurities that need to be removed via the beneficiation process before they can be efficiently utilised as fuel [3,4,5]. The most commonly used techniques for hard coal beneficiation are density-based wet methods, being continuously developed for decades, with new or improved solutions still emerging [6,7,8,9,10,11,12,13]. Nevertheless, the dry separation techniques exhibit certain advantages over the traditional solutions, which, depending on the circumstances, may ultimately decide in favour of their implementation, hence recent intensification of research in the field [14,15,16,17,18,19,20,21,22,23,24]. The properties of grains that can facilitate the dry separation process are: density, shape, size, porosity, and colour, as well as electrical and magnetic properties.
Some of the developed technologies rely on the differences in more than one of these properties simultaneously. The negative pressure pneumatic separator (NPPS) utilises an air stream to create a drag force acting upon the grains, with a magnitude dependent on shape and size of a given particle. The resulting net force of the drag and gravitation leads to separation of the particles with different density, size, and shape [25,26].
In case of an air table, ambient air enters a deck and fluidises the feed coal, which stratifies depending on the difference in the terminal velocity of the particles. Chalavadi and Das reported that around a 10% (absolute) reduction in ash content of the beneficiated fine coal was achieved in a single stage operation of the tested air table [27]. The tests carried out by Patil and Parekh showed that the air table was able to reduce the ash from 27% to 10–12% ash with a clean coal yield of 75–80% [28]. Jambal et al. examined the performance of KAT (Korean Advanced Technology) pneumatic table separator—the results indicate that the overall combustible recovery was in the range of about 77–90%, dependant on grain size class and densimetric distribution of the feed material tested [29,30]. The tests performed by Gupta on Indian coarse coal showed that successful recovery of the organic matter higher than 90% with simultaneous removal of high ash gangue grains was possible. Furthermore, a feasibility analysis showed significant economic gains in terms of transportation cost, improving power plant efficiency, and reducing emissions rates by using the technology [31].
One of the commercially available solutions for dry coal beneficiation is the Fuhe Ganfa Xuan mei (FGX) separator—developed in China, this device incorporates pulsing air stream and inclined vibrating deck to separate the grains. The process results in three fractions—product, middlings, and refuse. Honaker et al. performed a number of experiments with the use of different coals and proved that, when treating ROM bituminous coal in a grain size class of 6–50 mm, 70–90% of the gangue material with a relative density higher than 2.0 g/cm3 can be rejected [32]. The tests carried out by Blaschke et al. showed that with use of FGX it was possible to obtain coal with acceptable market quality from low-rank coal feed material [33]. It is worth noting that, while the air tables are suitable for the beneficiation of fine coals (0–6 mm), the FGX technology is most effective for the separation of coarse coal materials (6–80 mm).
Some of the researchers tried to combine more than one technique in order to achieve even better results. A coupled system, an air dense medium fluidized bed (ADMFB), and a FGX separator were used by Xuliang et al. to increase the calorific value of the material by as much as 10.32 MJ/kg [34]. Dong et al. performed a series of tests with the use of similar configuration, which allowed one to achieve an effective dry separation of coal in the 0–100 mm grain size class [35].
Introduction of a new deshaling technique is inseparably tied with a need for extensive performance tests of the proposed solution. The number of experiments needs to be performed to assess the effects of the beneficiation for each different coal material under specific operating conditions of the new device. However, there are only a limited number of tests that can be performed. In order to fully present the capability of the device, the working model needs to be developed. A significant part of the research focused on developing models, be that based on statistical correlations, aerodynamic equations, or computational fluid dynamics (CFD) methods, to fully address the problem of process optimisation and to assess achievable effectiveness of the proposed solutions [36,37,38,39,40].
One of the possible approaches to mathematical modelling is creating simple regressive models based on experimental results [41]. More complex models incorporate the conservation principles and other physical laws that are obeyed by all physical systems [42]. Chalavadi and Das adopted a fundamental force balance approach to develop a mathematical model that allows one to estimate the trajectories of particles subjected to the beneficiation process using the air table, thus enabling computation of the mass yield and the product quality (ash level) [27]. Zhou and Dong et al. proposed an equation for predicting minimum fluidization velocity, as well as correlation between bed density and the bubble behaviour in the gas–solid fluidised bed, in order to predict the performance of the implemented coal cleaning system [43]. The system has been investigated further by Zhao et al., Tang, and Zhang et al., which resulted in the development of CFD numerical models that simulate the beneficiation process [44,45,46]. The two-phase flow model was applied to accurately simulate the fluidised bed behaviour. The presented findings suggest that the simulated results are consistent with the provided experimental data.
Since the NPPS is a device developed and presented relatively recently, there is an urgent need for further investigation of the solution, including optimisation of its performance with use of the modelling techniques. The aim of the hereby presented work was to develop working models describing the operation of the NPPS and thus accurately predicting the separation results. The mathematical model was based on equations describing the dynamics of body movement in the fluid. The model calculates the trajectory of movement, velocity, and acceleration of individual particles taking into account properties of the feed material and the operation parameters of the device. The numerical model simulating the process of dry separation was based on detailed technical documentation describing the construction of the device. The collected measurement data regarding the separator operation characteristics and the results of the previous experiments were used to validate the models. The developed models allow one to estimate output yield values and physicochemical properties of the products of the enrichment process for a given feed material at specified NPPS operating conditions. In addition, it is possible to assess the impact of individual process parameters on the quality and yield of the products.
This work builds on the methodology and results of the research on the hard coal enrichment process, carried out using a negative pressure pneumatic separator, presented in the previous study [26]. The research included extensive study on the influence of the device operating parameters and different feed characteristics on the separation results. Samples of the separation products and the feed materials used were subjected to sieve analysis and laboratory tests to determine their ash content and calorific values. Some of the raw coals used were additionally subjected to a densimetric analysis. The results of these tests are available online [47].
2. Materials and Methods
2.1. Experimental Setup
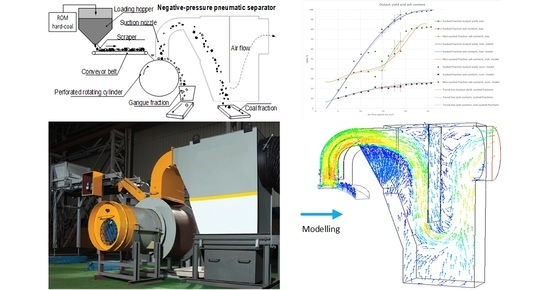
The sorting method is based on separation of the grains of feed material with the use of negative pressure, generated by a nozzle located above the layer of enriched material, thus setting particles in motion. The separation occurs due to differences in size, density, and shape of the grains. The operating principle of the NPPS device has been thoroughly presented in the previous article on the subject [26]. The general idea of how the device work is presented in the Figure 1.
The construction of the NPPS allows for adjusting the following work parameters:
- The speed of the conveyor belt (inverter control in the range of 0–50 Hz);
- The speed of the perforated rotary cylinder (inverter control in the range of 0–50 Hz);
- The rotational speed of the fan (inverter control in the range of 20–50 Hz);
- The position of the suction nozzle above the surface of the rotating cylinder (manual control) and;
- The position of the scraper, i.e., its height above the conveyor belt (manual control).
The results of experiments on the coal enrichment process with the use of different hard coal materials, carried out at optimal configuration of the work parameters, has been presented in the previous work [26]. The data include the measurements of air flow velocity in the suction zone depending on the main fan frequency. However, in order to implement the developed numerical model, additional measurements concerning pressure in the body of the separator had to be carried out.
The air flow conditions in the suction zone and the separator were controlled mainly through adjusting the frequency of the main fan. The physics behind the flow is the pressure difference generated in the system by the fan work. To find a relationship between the fan frequency and the pressure, measurements of the vacuum pressure inside the separator were carried out at various settings of the main fan (intervals of 5 Hz in the range of 20–50 Hz). The pressure value was measured at several dozen points inside the separator, in its axis, an electronic pressure manometer was used, and the measuring probe was introduced to different depths through four openings drilled in the upper part of the separator housing. The measurement uncertainty was calculated according to the methodology presented in [46,48,49,50].
Based on the measurements, the trend lines representing the relationship between the main fan frequency/rotational speed and pressure and flow velocity/volume were determined in accordance to the following equations representing the “fan laws” [51,52,53].
The volumetric flow rate (V, m3/h) varies directly proportional to the ratio of the rotational speed (RPM) of the impeller:
Pressure (p, Pa) varies as the square to the ratio of the rotational speed (RPM, u/min) of the impeller:
The air flow intensity in the system is influenced by both the suction fan operating parameters and the resistance characteristics of the entire installation. Figure 2 shows examples of fan flow characteristics and a system resistance curve.
The fan characteristic is represented by a fan curve, which shows the relationship between static pressure and the air flow rate of the fan. The resistance to air flow through the installation is shown by a system curve. Point OP (1–3), located at the intersection of both curves, constitutes the operating point at given fan operating parameters. It determines the actual flow and pressure developed by the fan in a given installation.
The presented different fan curves show the fan characteristics for various example fan speeds (regulated for instance by means of a frequency inverter). The system curve of the installation may change due to, e.g., the use of dampers or channel clogging, thus influencing the fan operating point.
2.2. Materials
The materials used for tests were 4 different coals in a grain size class of 0–20 mm. The information on density and size distribution were presented in the previous paper on the subject of NPPS [26] and are available online [47]. The materials in question were labelled No. 1, 2, 4, and 5. The data include washability curves determined for each of these materials in accordance to the equations presented in Table 1.
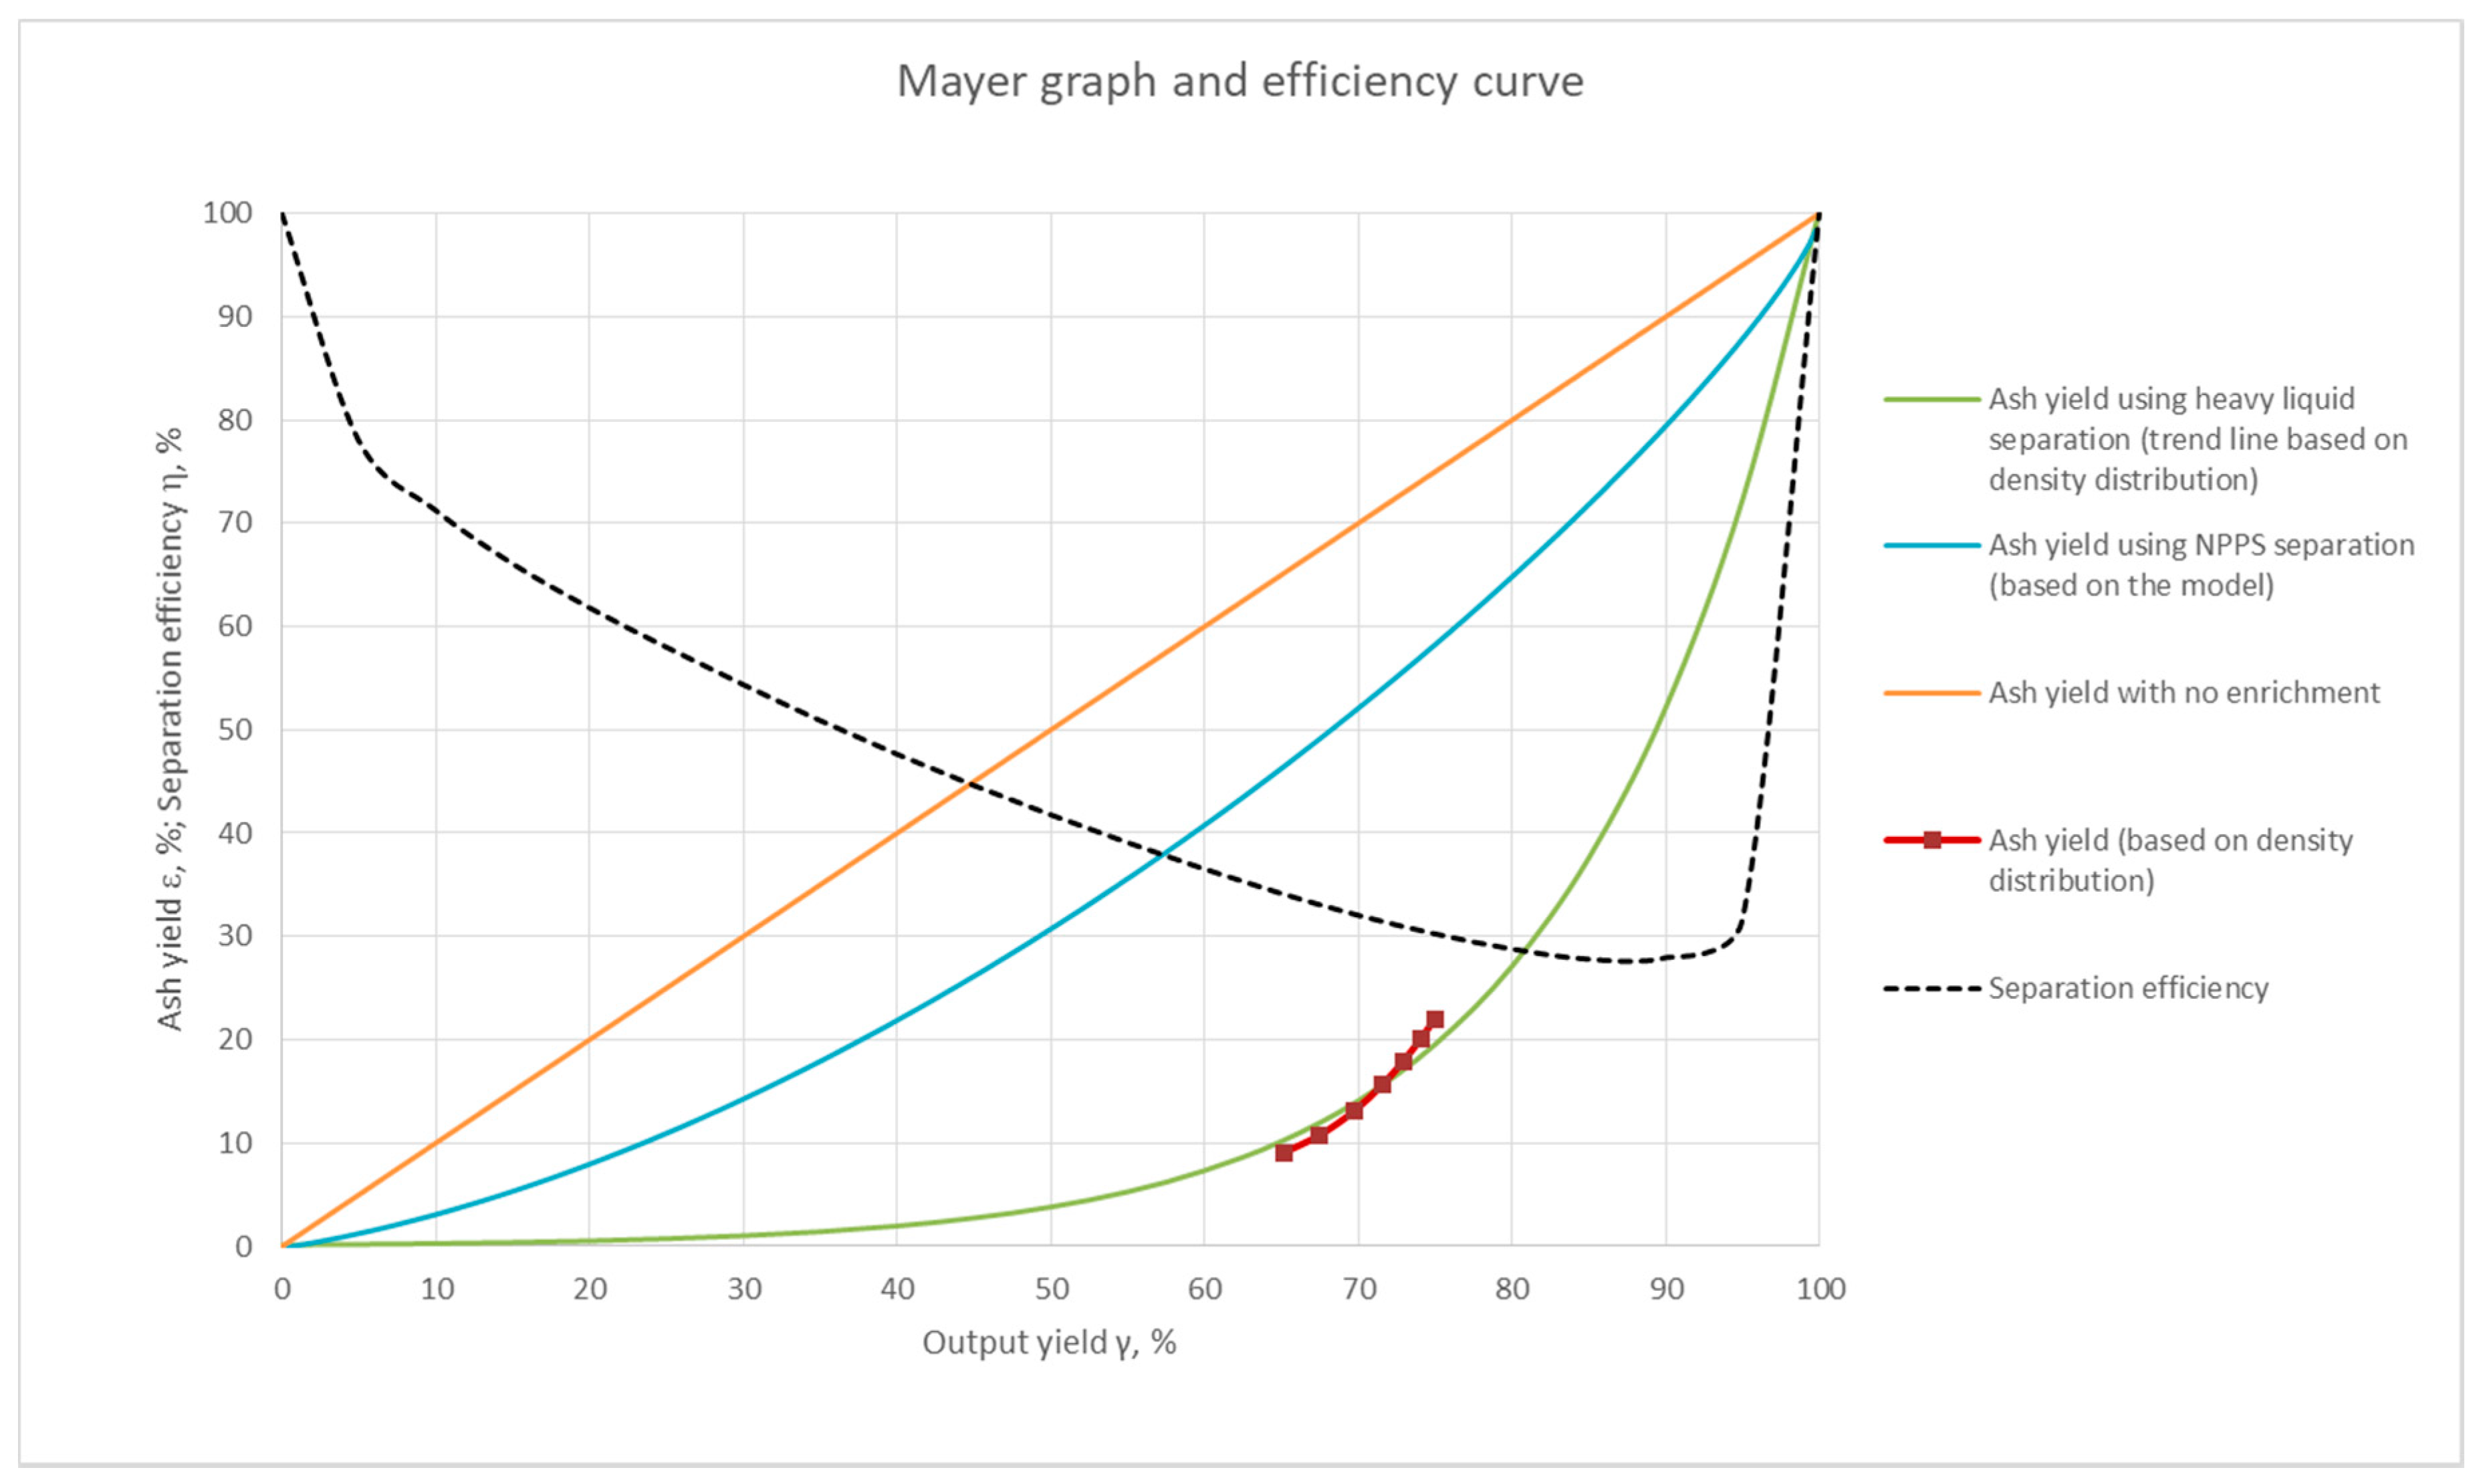
In addition, to assess the efficiency of the NPPS in comparison to the traditional wet methods, the Mayer graph was developed, as shown in the Figure 3. The beneficiation efficiency was assessed through the following equation:
where:
| η —enrichment efficiency, % | εa —actual enrichment ash yield, % |
| εw —washability ash yield, % | εn —no enrichment ash yield, % |
2.3. Mathematical Model
The developed 2D mathematical model was based on equations describing the dynamics of fluid flow over bodies. In the case of the NPPS application, the body was considered a grain of the feed material with a specific diameter, density, and shape (flakiness index), while the fluid was air with density depending on the temperature and pressure of the environment. Figure 4 presents a diagram of forces acting on the grain in the suction zone (the space between the rotary cylinder and the suction nozzle) just before and at the moment of its suction. In addition, velocity vectors related to these forces have been presented. Blue arrows represent the direction of an air flow (vertically upward).
The forces acting on the grain were defined based on the properties of the grain material and fluid (air). The formulas describing the values of these forces are as follows [58,59]:
In addition:
where:
| wa —vertical air speed (relative to the grain movement), m/s | wx —horizontal grain speed (relative to the air flow), m/s |
| g —gravitational acceleration, m/s2 | FD —drag force, N |
| Fg —gravity force, N | d —grain diameter, m |
| R —rotary cylinder radius, m | ρa —air density, kg/m3 |
| ρg —grain density, kg/m3 | m —grain mass, kg |
| CD —drag coefficient, - | ω —rotational speed, rad/s |
| A —grain cross-section, m2 | V —grain volume, m3 |
The Ax and Ay represent the grain cross-section in the horizontal and vertical directions respectively. The cosα takes into account the exact position of the grain on the curved surface of the rotary cylinder (at the highest position cosα = 1).
The mathematical model consists of analytical formulas describing particle trajectory, its velocity and acceleration as a function of time. They were derived from the basic formulas describing the dynamics of the particle’s movement, separately for the horizontal direction x and vertical y. The most important, from the point of view of predicting the results of the separation process, is the equation of the particle’s trajectory. Based on the trajectory, it is possible to estimate whether a given particle will be sucked into the suction nozzle under specific conditions. The trajectory for each grain differs from each other due to the differences in their physical parameters. All trajectories take a parabolic shape due to the fact that the grains move in an accelerated motion. Based on the sum of particles trajectories, it is possible to calculate the output yield of each fraction (mass share of the sucked/non-sucked material in relation to the total weight of the feed) and, in the case of coal materials, estimate the ash content of each.
The initial equations and their final forms are as follows:
Process parameters can be divided into:
- Related to the physical properties of the material,
- Related to the physical properties of the medium (fluid) in which the separation is carried out and,
- Operating parameters of the device itself.
To use the models, the feed should be subjected to densimetric tests and sieve analysis in order to determine the material characteristics in terms of grains density and size distribution. This allows for determining of washability curves for a given feed (in the case of coal materials). Based on the sieve analysis, the Rosin-Rammler diameter distribution can be determined [60]. In addition, the ratio of cubical to flat grains was estimated for each material by determining the flakiness index. For each of these groups, the aerodynamic drag coefficient was estimated based on the literature data and the correlation of Haider and Levenspiel regarding the calculation of the drag coefficient for non-spherical bodies [61]:
where:
- A = exp(2.3288 − 6.4581Φ + 2.4486Φ2); B = 0.0964 + 0.5565Φ;
- C = exp(4.905 − 13.8944Φ + 18.4222Φ2 − 10.2599Φ3); D = exp(1.4681 + 12.2584Φ − 20.7322Φ2 + 15.8855Φ3).
and the shape factor (sphericity) is defined as:
where s is the surface of a sphere having the same volume as the particle and S is the actual surface area of the particle. Since the sphere is characterized by the smallest possible area per volume, any particle that is not a sphere will have a sphericity less than 1 (0 < Φ ≤ 1).
Based on the results of the above tests, a multidimensional data matrix was developed, describing the feed material in terms of the proportion of individual grain mass streams with different combinations of diameter, density, and drag coefficient.
Physical properties of air were determined for a temperature of 20 °C and a pressure of 1 atm.
The parameters that define the operation of the device are: the linear speed of the rotary cylinder, the position of the suction nozzle relative to the drum axis (x coordinate) or relative to its surface (y coordinate) and the speed of air flow. These values are indirectly resulting from the device operating conditions applied during an experiment.
The output yield and properties of the sucked fraction is determined by adding up all material streams that meet the following condition for point P (Figure 4)
where:
Additional assumptions for the model:
- Process parameters (physical properties of grains and fluid, device operating parameters) are constant for a given simulation;
- The air velocity profile in the suction zone is vertical-only and uniform;
- Due to the non-streamlined shape of the grains, the impact of aerodynamic drag due to friction of the fluid against their surface is ignored;
- The coupled effect of grains on the fluid flow is omitted (volume fraction of the particles in the flow was estimated to be about 0.5%);
- Grain rotation or interactions between them (collisions) are not included;
- The initial position of the grain (x, y coordinates) depend on the grain diameter and nozzle position:
- ○
- y0 = above the cylinder’s surface;
- ○
- x0 = position of the nozzle front wall + .
2.4. Numerical Model
Fluid flow occurs in a number of natural and industrial processes. Computational fluid dynamics (CFD) has now become an essential analytical tool in almost every branch of engineering and in many scientific disciplines. The secret behind the success of CFD is its ability to simulate flows in close to practical conditions—in terms of tackling real, three-dimensional, irregular flow geometries and phenomena involving complex physics. This is made possible by resorting to the numerical solution of the equations governing fluid flow rather than seeking an analytical solution [62].
Modelling of processes using CFD includes solving the differential equations describing the conservation of mass and momentum, and if the calculations include heat flow, also the conservation of energy. Depending on the type of calculation performed, the simulation may involve more calculation activities. The model developed in frame of this work included only the first two equations; i.e., [60,63,64,65]:
- Conservation of mass:
- Conservation of momentum:
where:
| ρ —fluid density, kg/m3 | —stress tensor, kg/m3 s |
| t —time, s | —gravitational body force, m/s2 |
| —flow velocity field, m/s | —external body force, N. |
| p —static pressure, Pa |
The numerical model was developed using ANSYS Fluent software. The geometry of the model was based on detailed technical documentation describing the construction of the NPPS. The developed geometry is a 3D solid with the dimensions of a real large laboratory device (about 1.8 m × 1.8 m × 0.7 m).
Since the geometry is symmetrical with respect to the cross-sectional plane in the axis of the device, only half of the body was used for the meshing process. The mesh has been inflated in the suction zone, because the accuracy of calculations in this area of the model is crucial for the final result. Due to the high level of flow complexity (flow in different directions, local flow swirls), it was decided to generate an unstructured mesh consisting of tetrahedral elements, as this type of mesh is considered well suited for handling calculations within domains having high curvature boundaries [66]. The generated mesh represents the fluid (air) inside the separator—it consists of 175,948 nodes and 691,329 elements, with the volume of the body of about 0.6 m3. The incorporated grid was deemed optimal as a result of a mesh-independence study—the simulation of coal no.1 at 38 Hz served as a case study. The results are presented in Table 2.
The grid variant number 4 ensured comparable results as denser (no. 5 and 6) mesh variants, while providing significantly different results than simpler mesh variants (no. 2 and 3). In case of the simplest mesh variant no. 1, the convergence of calculations could not be reached. On the other hand, the variant no. 7 proved to be too resource demanding to be incorporated.
The calculations were carried out for the steady state simulating the continuous operation of the device for specific operating parameters. Due to the turbulent nature of the air flow in the device, as well as the high probability of local air swirls inside the separator, the Reynolds stress model (RSM) was implemented for calculation. The “Coupled” scheme was used for the pressure–velocity coupling, which allowed for use of the “Pseudo-Transient” solution method. The “Least Squares Cell-Based” method was used to compute the gradients. In addition, the warped-face gradient correction was enabled to further improve gradient accuracy. The “PRESTO!” pressure interpolation scheme was incorporated, while the second order discretization scheme was used for the remaining parameters.
Particles of the grain material were simulated using the discrete phase model (DPM). In addition to solving equations for the continuous phase, FLUENT allows the introduction of a second dispersion phase in the Lagrange reference system. This second phase consists of dispersed particles in the continuous phase. FLUENT calculates the trajectories of these particles as well as the heat and mass transfer to/from them. For particles described using DPM, the following physical properties were defined: material density, grain shape factor Φ, and grain size distribution.
The total stream of 0.4 kg/s of DPM particles is injected for a given simulation, as a sum of defined inert particles with different physical properties in proportions corresponding to the results of the density distribution and flakiness index analyses for a given material [47]. Basic information concerning injection properties is presented in Table 3.
The DPM iteration interval was set to 5, with enabled additional cell-averaged discrete phase variables for postprocessing. Since the simulation was run as a steady state, with no collisions/coalescence/break-up of the particles, steady particle tracking was incorporated. The particles were introduced at the hypothetical junction of the chute and the rotary cylinder of the real device, with an initial velocity equal to the linear speed of the cylinder. Based on the amount and type of particles sucked into the separator (trapped) and those that were not sucked (escaped), output yields and ash content were determined for both the sucked and non-sucked fractions.
The negative pressure in the system (in reality generated by the main fan) was regulated by the pressure-outlet boundary condition representing a junction of the lute leading to the main fan and the separator body. The construction of the separator was defined by the “wall” type condition, while the other surfaces were defined as pressure-inlet. Due to the use of DPM, it was also necessary to determine the behaviour of individual surfaces in relation with the dispersion phase. To be able to visualize the trajectory of particle movement, both the surface of the rotary cylinder and the walls of the suction nozzle were defined as impermeable to DPM (“reflect”). Other surfaces in the suction area were defined as “escape”, while the separator walls as “trap”. Boundary conditions together with the model’s grid are shown in Figure 5.
Additional assumptions for the model:
- Interaction between the individual grains (collisions) and grain degradation effect due to collisions with the separator were not included;
- The particle trajectory was simulated only until the first contact with the inner walls of the separator (wall-trap condition);
- A perforated cylinder was simulated by a “pressure inlet” boundary condition, permeable to fluid but reflecting DPM (wall-reflect) particles.
2.5. Validation
To determine the accuracy of the developed models, the experimental and predicted results have been compared in the form of graphs. The control data constituted experimental results of the beneficiation carried out with 4 different coals in a grain size class of 0–20 mm. The measurement uncertainty for each measurement was presented to show whether accuracy of the model predictions are within the range of error bars.
In case of the numerical model, a comparison with measurement data regarding separator operation characteristics (pressure in the separator and air velocity in the suction zone) at various operating points was carried out for enhanced validation.
3. Results
3.1. Pressure Measurements
The results of pressure measurements inside the separator are presented in the form of an illustrative drawing showing the cross-section of the separator in its symmetry plane. The measuring points for each of the four openings are presented in different colours and sizes, proportional to the negative pressure value. Sample results at the main fan operating frequency of 35 Hz are shown in Figure 6. The measurements show that the vacuum in the part of the separator closest to the fan (right side of the figure) was the highest and decreased towards the suction nozzle. The largest pressure difference occurred between the zones divided by the partition. For these operating conditions, the air flow velocity in the suction zone was about 17.5 m/s [26]. The fluid flows in the direction of decreasing pressure (increasing vacuum).
The pressure value at the outlet of the separator was a key input variable needed for the numerical model to work. Therefore, it was essential to accordingly determine the relationship between main fan frequency and the pressure measured at opening no. 4, including the measurement uncertainty. The measurement uncertainties were calculated according to the accuracy of the instrument used (digital pressure gauge) and the estimated experimental error. The characteristic of the used measuring device was as follows: ±(0.1 hPa + 1.5% measured value) in the range of 1.01 to 100 hPa and a resolution of 0.01 hPa.
The measured values together with the calculated uncertainties are presented in Table 4. Due to large fluctuations of pressure during the measurements, relatively large error values Δex were applied.
The results of the air velocity measurements in the suction zone, as well as the pressure values at the outlet of the separator, are presented in the graph, along with the corresponding trend lines (Figure 7). The regression was carried out taking into account the relationships presented in Equations (1) and (2)—the trend line for velocity was determined through a linear function, while the relationship of pressure and the operating main fan frequency was described by the quadratic equation. The resulting trend lines constituted the basic input information for the developed mathematical model (based on the function of air flow velocity) and numerical model (based on the function of vacuum values at the separator outlet).
The relationship between the pressure and thus generated air flow is presented in Figure 8. The points on the graph constitute the intersection points of the installation resistance curve and the fan capacity curves during operation at different frequencies. In this way, the duct system curve was obtained.
3.2. Modelling
The input data for simulations reflected the conditions of the experiments, i.e., optimal working parameters of the device (cylinder linear speed vB = 0.5 m/s and suction nozzle in the “−5 cm” position) [26], and characteristics of the feed material used. The main variable for mathematical calculations was the air flow velocity in the suction zone. In the case of numerical calculations, the simulation was carried out with use of “pressure-outlet” value as the main variable, until the results were stabilized. The results of the calculations, together with the comparison to the experimental values, are presented in the form of a graph in Figure 9.
The results of the calculations based on the material no. 1 are presented in the main body of the paper, while the results of calculations on materials no. 2, 4, and 5 are presented in Appendix A.
Velocity vectors describing the air movement in the separator symmetry plane are shown in Figure 10. It can be seen that the air follows a visible stream from the suction nozzle to the outlet of the separator, bypassing the partition. Figure 11 presents the example of the calculated gauge pressure profile in the sorter symmetry while simulating the work at a main fan setting of 35 Hz, i.e., the corresponding “pressure-outlet” boundary condition was set to p = −718 Pa, and the corresponding pressure profile determined experimentally (more of similar comparisons at different operating pressures are presented in Appendix B). The model shows that local air swirls occurred in other areas of the separator. The occurrence of unwanted air swirls could probably be reduced by changing the sorter’s design to a more rounded and contoured shape, accordingly to the predicted shape of the air stream.
Figure 12 shows the trajectory of DPM particles depending on their mass. It can be seen that, in general, lighter particles tend to be sucked more often. However, there is no clear value dividing the two fractions. It is because the final result of the process is influenced by different properties of grains, such as density, diameter (volume), and shape. Therefore, the final result depends on the specific configuration of these parameters.
4. Discussion
The tests of pneumatic separation carried out at different device operating parameters and with the use of various feed materials allowed for validation of the developed models. Despite the applied simplifications, the results predicted by the models were convergent with the experimental data—in most cases they were within the range of standard deviation of the measured values. The basic input data required for the models to work consist of size and density distribution of a given feed material, as well as the flakiness index of the feed grains. Therefore, model calculations were carried out only for the part of the feeds for which the necessary data was available (materials No. 1, 2, 4, and 5).
The mathematical model is based on the dynamics of fluid flow over the body. Based on the determined relationship between the set frequency of the main fan and the speed of air flow in the suction zone, it was possible to create the curves of output yield and ash content for individual fractions in the entire spectrum of device operation parameters. The model allows one to predict the physicochemical properties of potential products for a given feed material, as well as to examine the impact of individual device operating parameters on the results of pneumatic separation. Since the model is based on universal equations, it is highly probable that it could be adapted to simulate the work of other devices, which operation is based on similar principles.
The numerical model simulates the work of the separator based on the applied boundary conditions of the model. The 3D solid geometry was developed based on the technical documentation of the device, and the calculations were carried out using Ansys FLUENT software. The basic variable in the simulation is the constant negative pressure set at the outlet from the separator, reflecting the work of the main fan at a given frequency—the pressure difference between the outlet and inlet of the separator (suction zone) forces an air flow.
Feed grains were introduced into the system using the DPM function. Based on the amount and type of DPM grains sucked in (trapped), the washability curve for a given feed material was determined. As in the case of the mathematical model, the numerical model allows one to study the effect of various device operating parameters on the separation process. In addition, by introducing changes into the separator geometry, it could be possible to estimate the impact of potential design changes of NPPS, thus allowing for the optimization of the device for more efficient operation.
The results of the model calculations were visually compared with the experimental ones in order to evaluate the convergence of the test results and the determined trends of variables. In majority of cases, the differences between calculated and measured values were within the estimated measurement uncertainty. The most accurate results were obtained for the feed material no. 4, while the least accurate for the feed no. 5. The differences probably result from the simplifications used in the calculations—depending on how much the simulation assumptions differ from the actual properties of the given feed material, differences in results may vary significantly.
In majority of simulations, the results of both modelling approaches diverge most significantly at lower air flow speeds. This may be the result of the fact that particle size distribution for numerical simulation is limited to 1 mm (min. diameter of injected particles set to 1 mm), while the mathematical model calculates the distribution down to the fraction of millimetre.
The graph summarizing the results of the study is shown in Figure 13—it is a summary of Henry’s washability curves (developed on the basis of density distribution studies), enrichment curves determined using the models (points and regressions), and experimental results of separation. The graph shows a significant difference between the fractions obtained using traditional separation in a heavy liquid and enrichment in the air medium.
To estimate the enrichment efficiency of the NPPS, the comparison between products obtained through separation with use of air and heavy liquid sink–float was calculated. The relationship between carbon yield and total output yield for each technique was presented on Mayer’s chart (Figure 14). The enrichment curve representing process with the use of NPPS was calculated with the use of the mathematical model, while the curve representing the traditional wet methods constitute a trend line (described by an exponential equation) based on the results of densimetric analysis. The enrichment efficiency was calculated with Equation (3).
The graph shows that the process efficiency for most of the experiments carried out for coal no. 1 was within 30%–40%. This is consistent with a general consensus that the separation in heavy liquids is generally more precise than separation in air.
Existence of a significant amount of research in the field of dry beneficiation modelling indicates that there is a demand for such models. Due to the complexity of the separation phenomena, each deshaling process needs a dedicated model, tailored to the specific applied solution. Most of the developed models are based either on CFD numerical methods, or incorporate mathematical equations describing the balance of forces acting on particles.
The simplest models, based on correlations between variables, do not seem capable of reliably predicting the separation results (unless machine/deep learning is incorporated, which would require a significant amount of detailed experimental data). This is because the separation process is dependent on a number of parameters, simultaneously influencing the outcome. It is extremely hard to perfectly simulate the process, hence most of the modelling results are characterised with a certain level of deviation from the experimental results.
It is important to include the measurement uncertainty of the provided experimental results for the purposes of model validation. Some of the earlier referenced studies lack this information; in such cases, it still can be recognized whether the modelling results follow/do not follow the trend of the experimental data, but the exact value validation is not possible.
The level of achievable modelling precision is strongly dependent on complexity level of the simulated process. In most cases of the referenced research in the field of dry coal beneficiation, the estimated relative error of the modelling results was within the range of 5%–15% in relation to the experimental values. The presented models of the NPPS operation exhibit a similar degree of precision. Further improvement of accuracy might be achieved through additional studies, including a reduction in the number of model simplifications or incorporation of detailed coupled density-size distribution analysis of the feed materials used. It should be kept in mind, however, that for the model to be functional, it should require as little input data as possible.
It is not unusual for the industrial processes to be developed and continuously improved for years or even decades; therefore, since the NPPS is a relatively new device, the developed model may provide valuable aid in the advancement of the solution.
5. Conclusions
The developed models allow prediction of the results of grain material separation with a known grain size and density distribution, and shape factor. A significant number of results obtained experimentally allowed for proper validation of the models. The analysis of the graphical summary led to the conclusion that, despite the simplifications used in the model calculations, the simulation results were within the measurement uncertainty of the corresponding experimental values. It could be concluded that the in-depth research of the process, exhaustive analysis of the feed materials properties, and detailed knowledge of the device design led to the development of models that could accurately predict the results of dry coal separation with the use of the NPPS.
Model results indicate the possibility of optimizing the construction design of the device, e.g., analysis of air velocity vectors allowed us to notice that a distinct stream of air flow was created in the separator along with its numerous local swirls. The more streamlined shape of the separator could probably prevent such unnecessary medium turbulence in the device, reducing power consumption and noise due to vibrations.
Functionality of the developed models in summary:
- Prediction of output yields and physicochemical properties of the fractions for a given material with a known size and density distribution (preferably flakiness index as well) at various operating parameters of the device,
- Optimization of the NPPS operation,
- Analysis of the influence of each device operating parameters on the effects of the separation process (output yields and physicochemical properties of obtained products),
- Analysis of the impact of individual physicochemical properties of the feed materials on the results of the separation process,
- Analysis of the impact of changes in device geometry on the separation process, and thus possibility of optimization of the device design (only numerical model).
Funding
The research presented in this paper was performed as a part of the project AMSEP “Novel dry sorter for coal processing and coal recovery from mine originating wastes”, which was conducted with a financial grant from the European Institute of Innovation and Technology in frame of InnoEnergy S.E.; with Central Mining Institute as the project coordinator. It was also financially supported by Statutory Research No. 11325018-173.
Conflicts of Interest
The author of this paper is a coauthor of the patent “Device for pneumatic sorting of grainy materials, and method of sorting” submitted by Central Mining Institute.
Appendix A
Appendix A presents the modelling results for the feed materials no. 2, 4, and 5.
Appendix A1. Coal no. 2
Figure A1.
Comparison of values obtained experimentally and calculated using the developed models—output yield and ash content in relationship to air flow velocity; feed material no. 2 (0–20 mm).
Figure A1.
Comparison of values obtained experimentally and calculated using the developed models—output yield and ash content in relationship to air flow velocity; feed material no. 2 (0–20 mm).
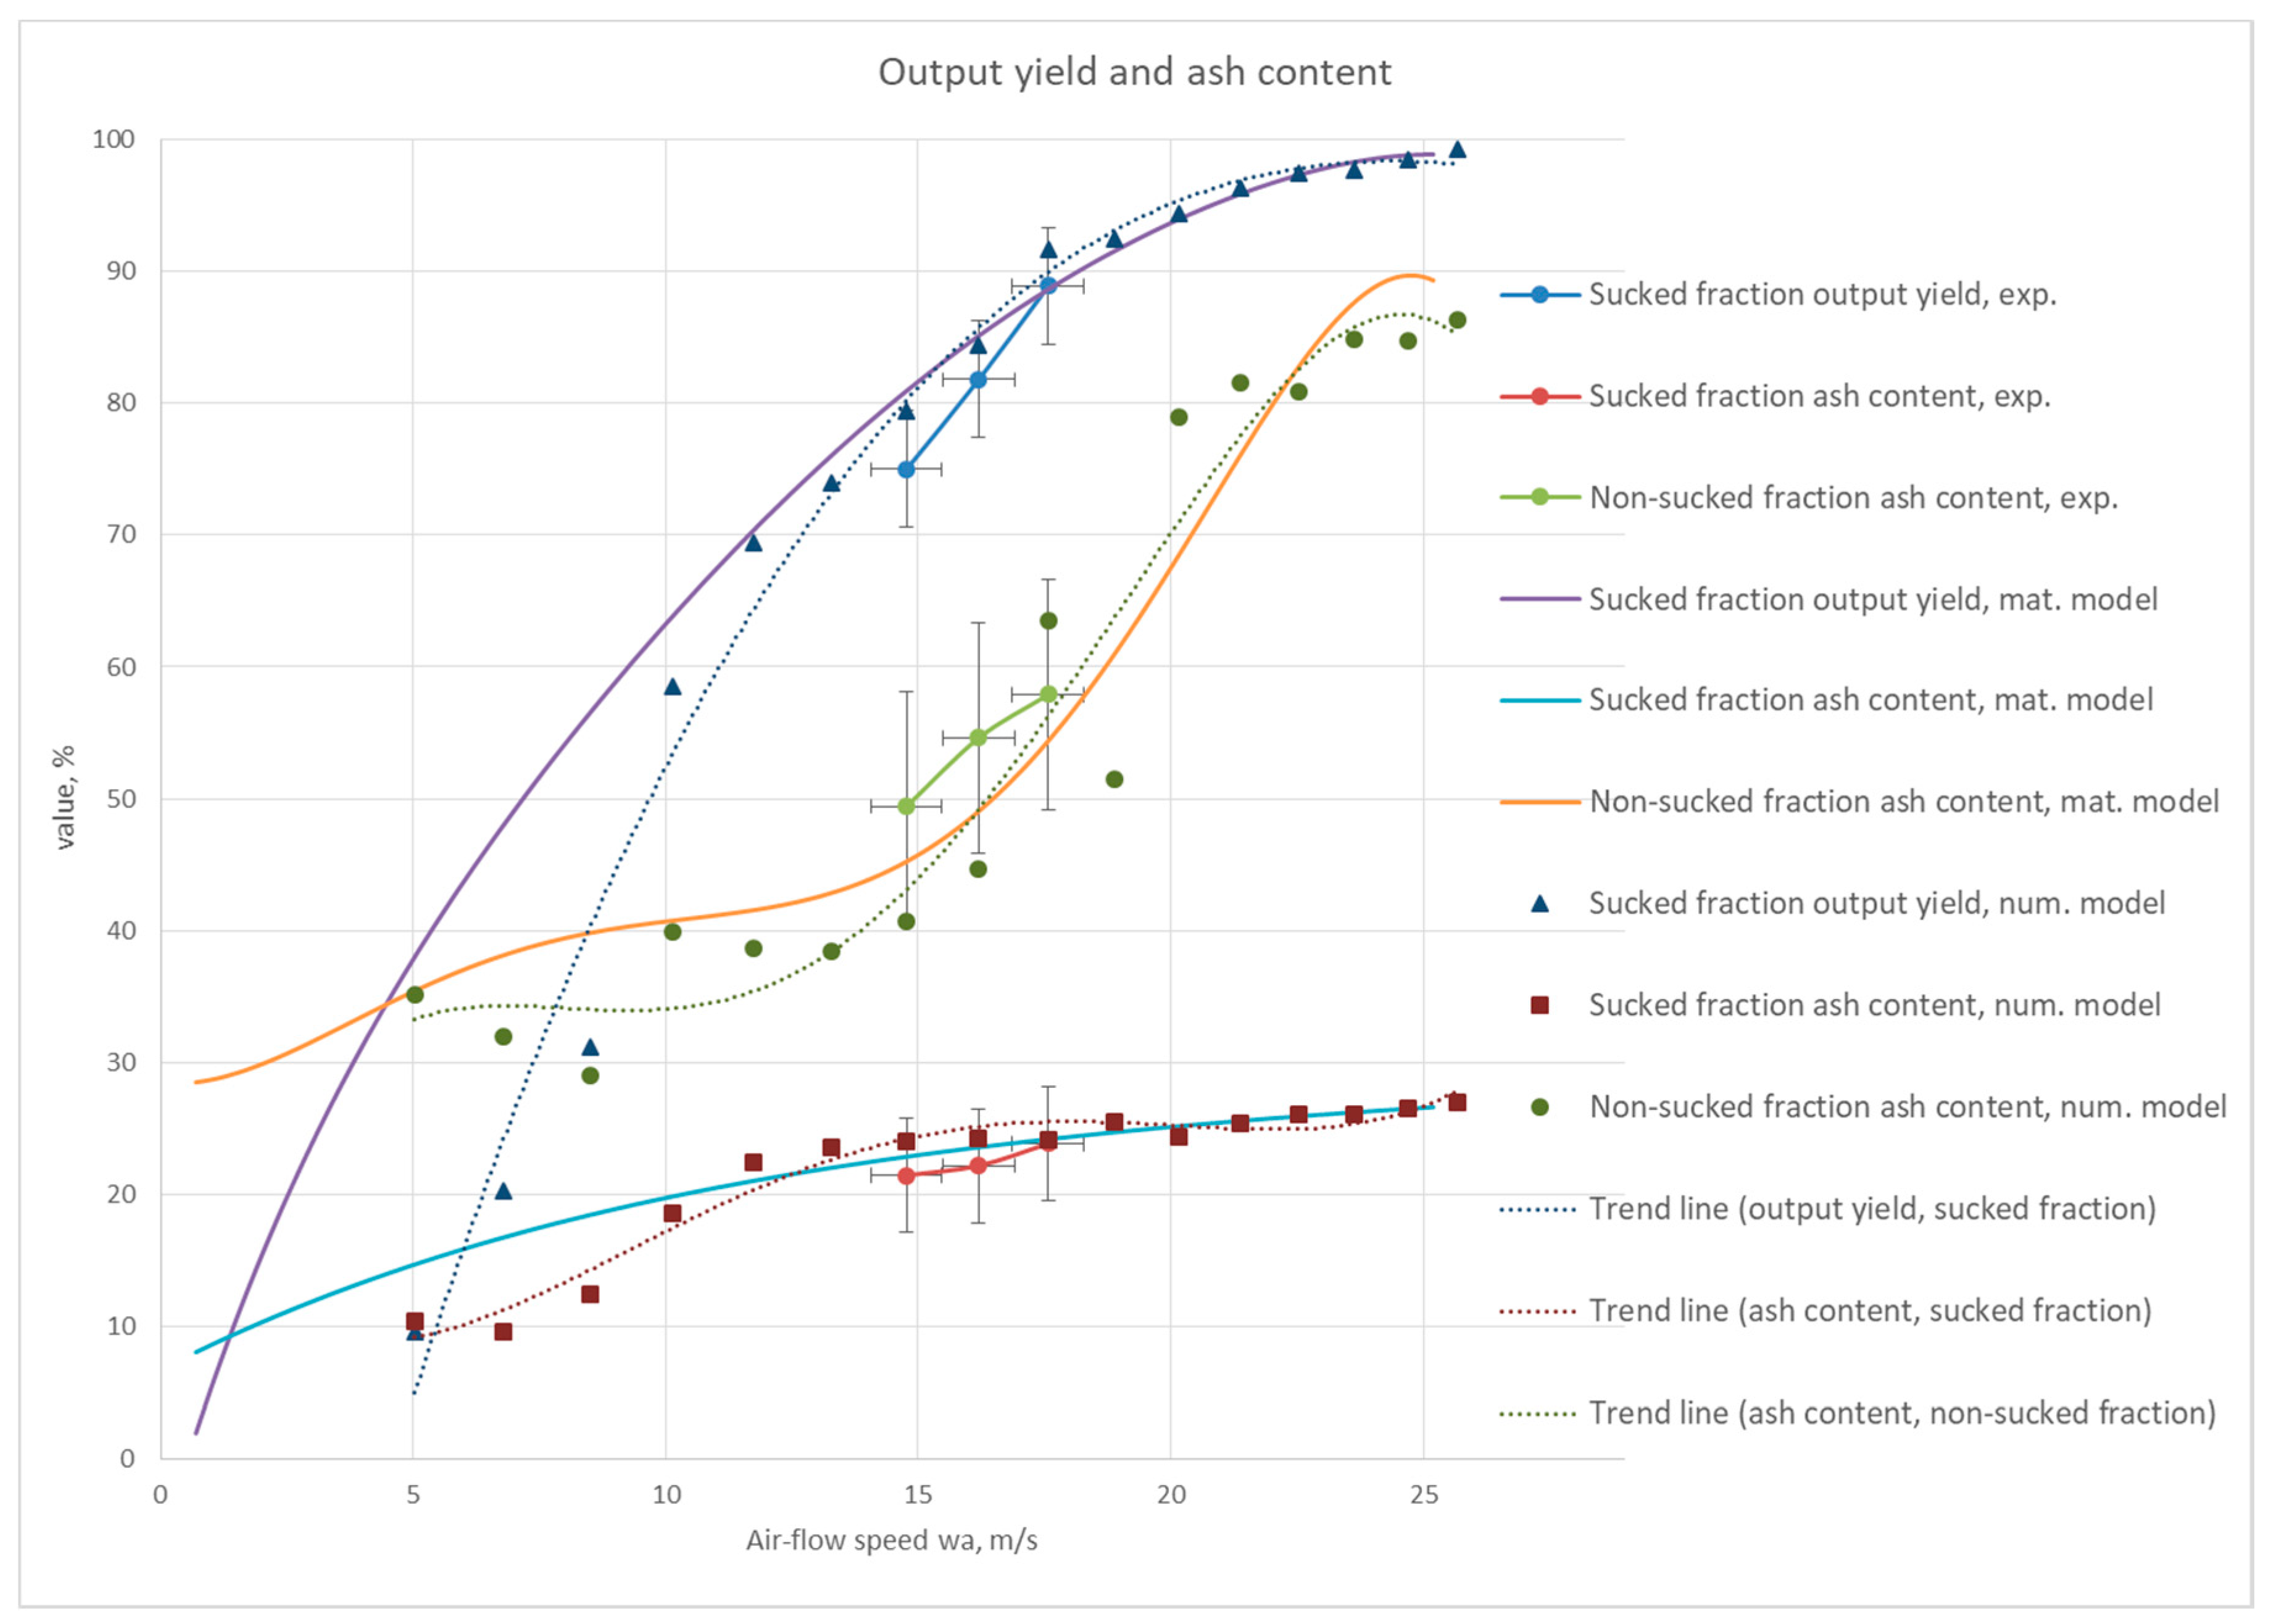
Figure A2.
Summary of washability curves, enrichment curves, experimental results and modelling results—feed material no. 2 in grain size class 0–20 mm.
Figure A2.
Summary of washability curves, enrichment curves, experimental results and modelling results—feed material no. 2 in grain size class 0–20 mm.
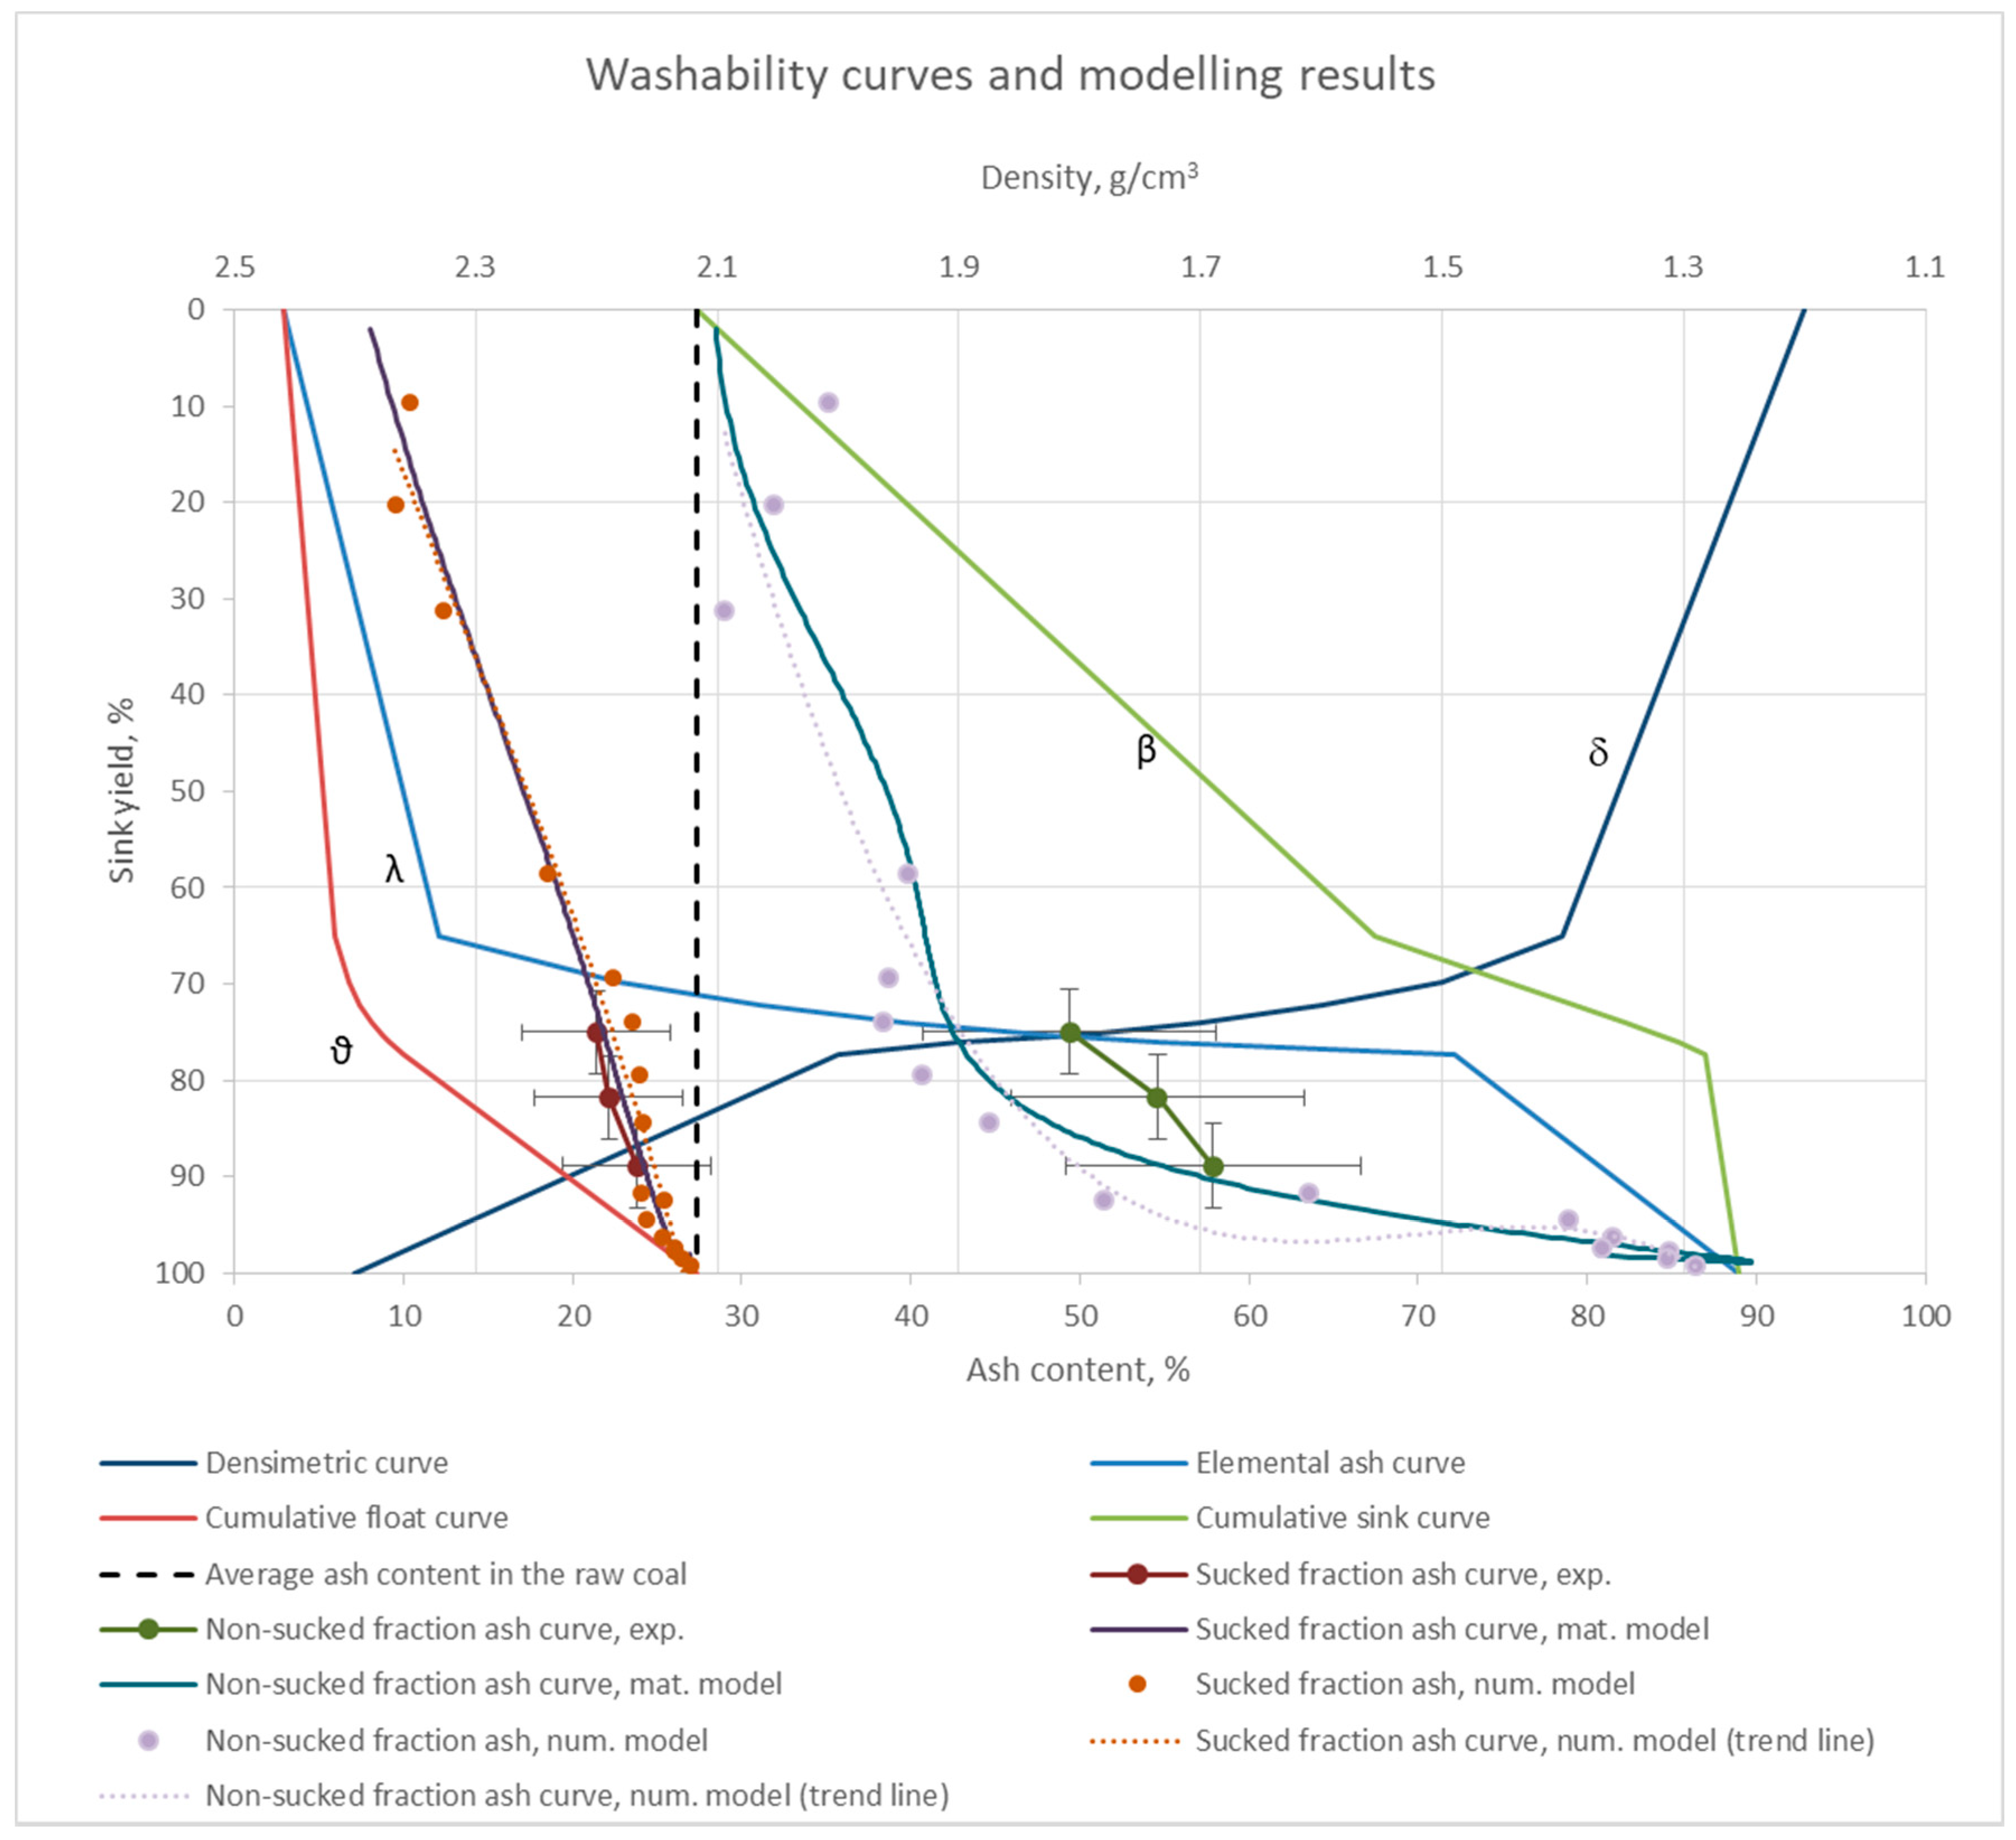
Figure A3.
Assessment of the efficiency of coal separation with the use of the NPPS in comparison to wet methods—feed material no. 2 in grain size class 0–20 mm.
Figure A3.
Assessment of the efficiency of coal separation with the use of the NPPS in comparison to wet methods—feed material no. 2 in grain size class 0–20 mm.

Appendix A2. Coal no. 4
Figure A4.
Comparison of values obtained experimentally and calculated using the developed models—output yield and ash content in relationship to air flow velocity; feed material no. 4 (0–20 mm).
Figure A4.
Comparison of values obtained experimentally and calculated using the developed models—output yield and ash content in relationship to air flow velocity; feed material no. 4 (0–20 mm).
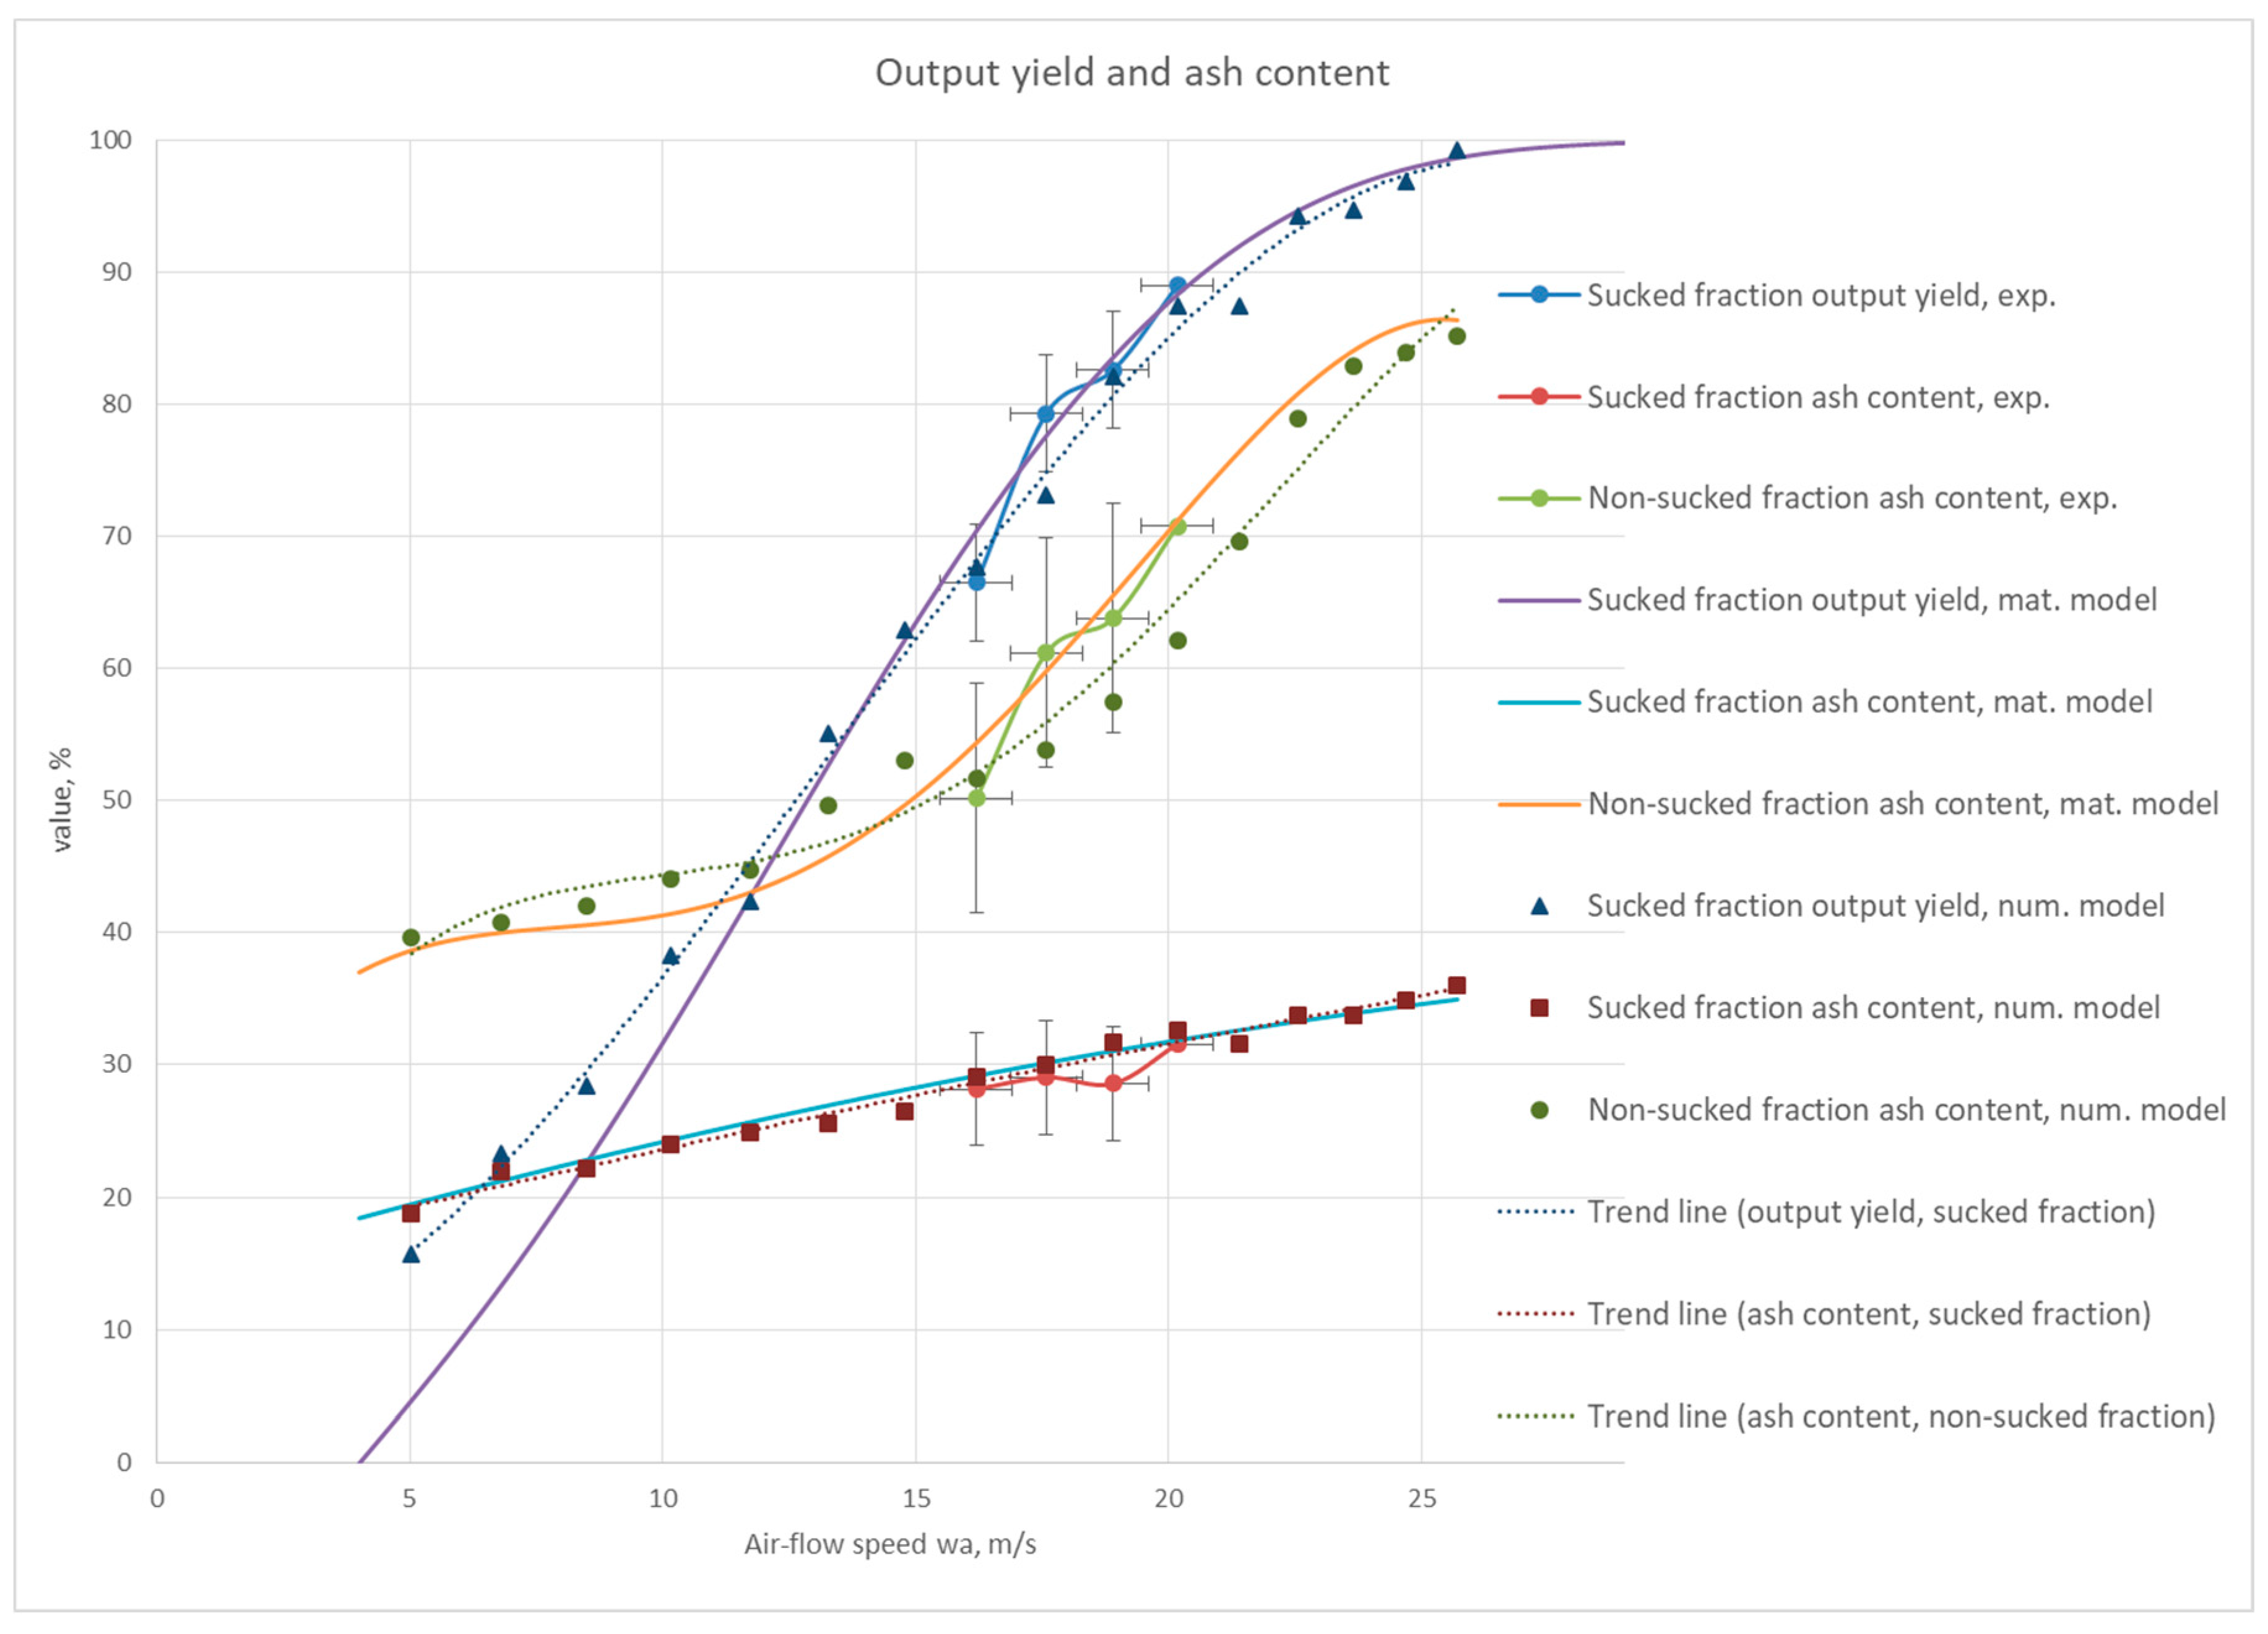
Figure A5.
Summary of washability curves, enrichment curves, experimental results and modelling results—feed material no. 4 in grain size class 0–20 mm.
Figure A5.
Summary of washability curves, enrichment curves, experimental results and modelling results—feed material no. 4 in grain size class 0–20 mm.
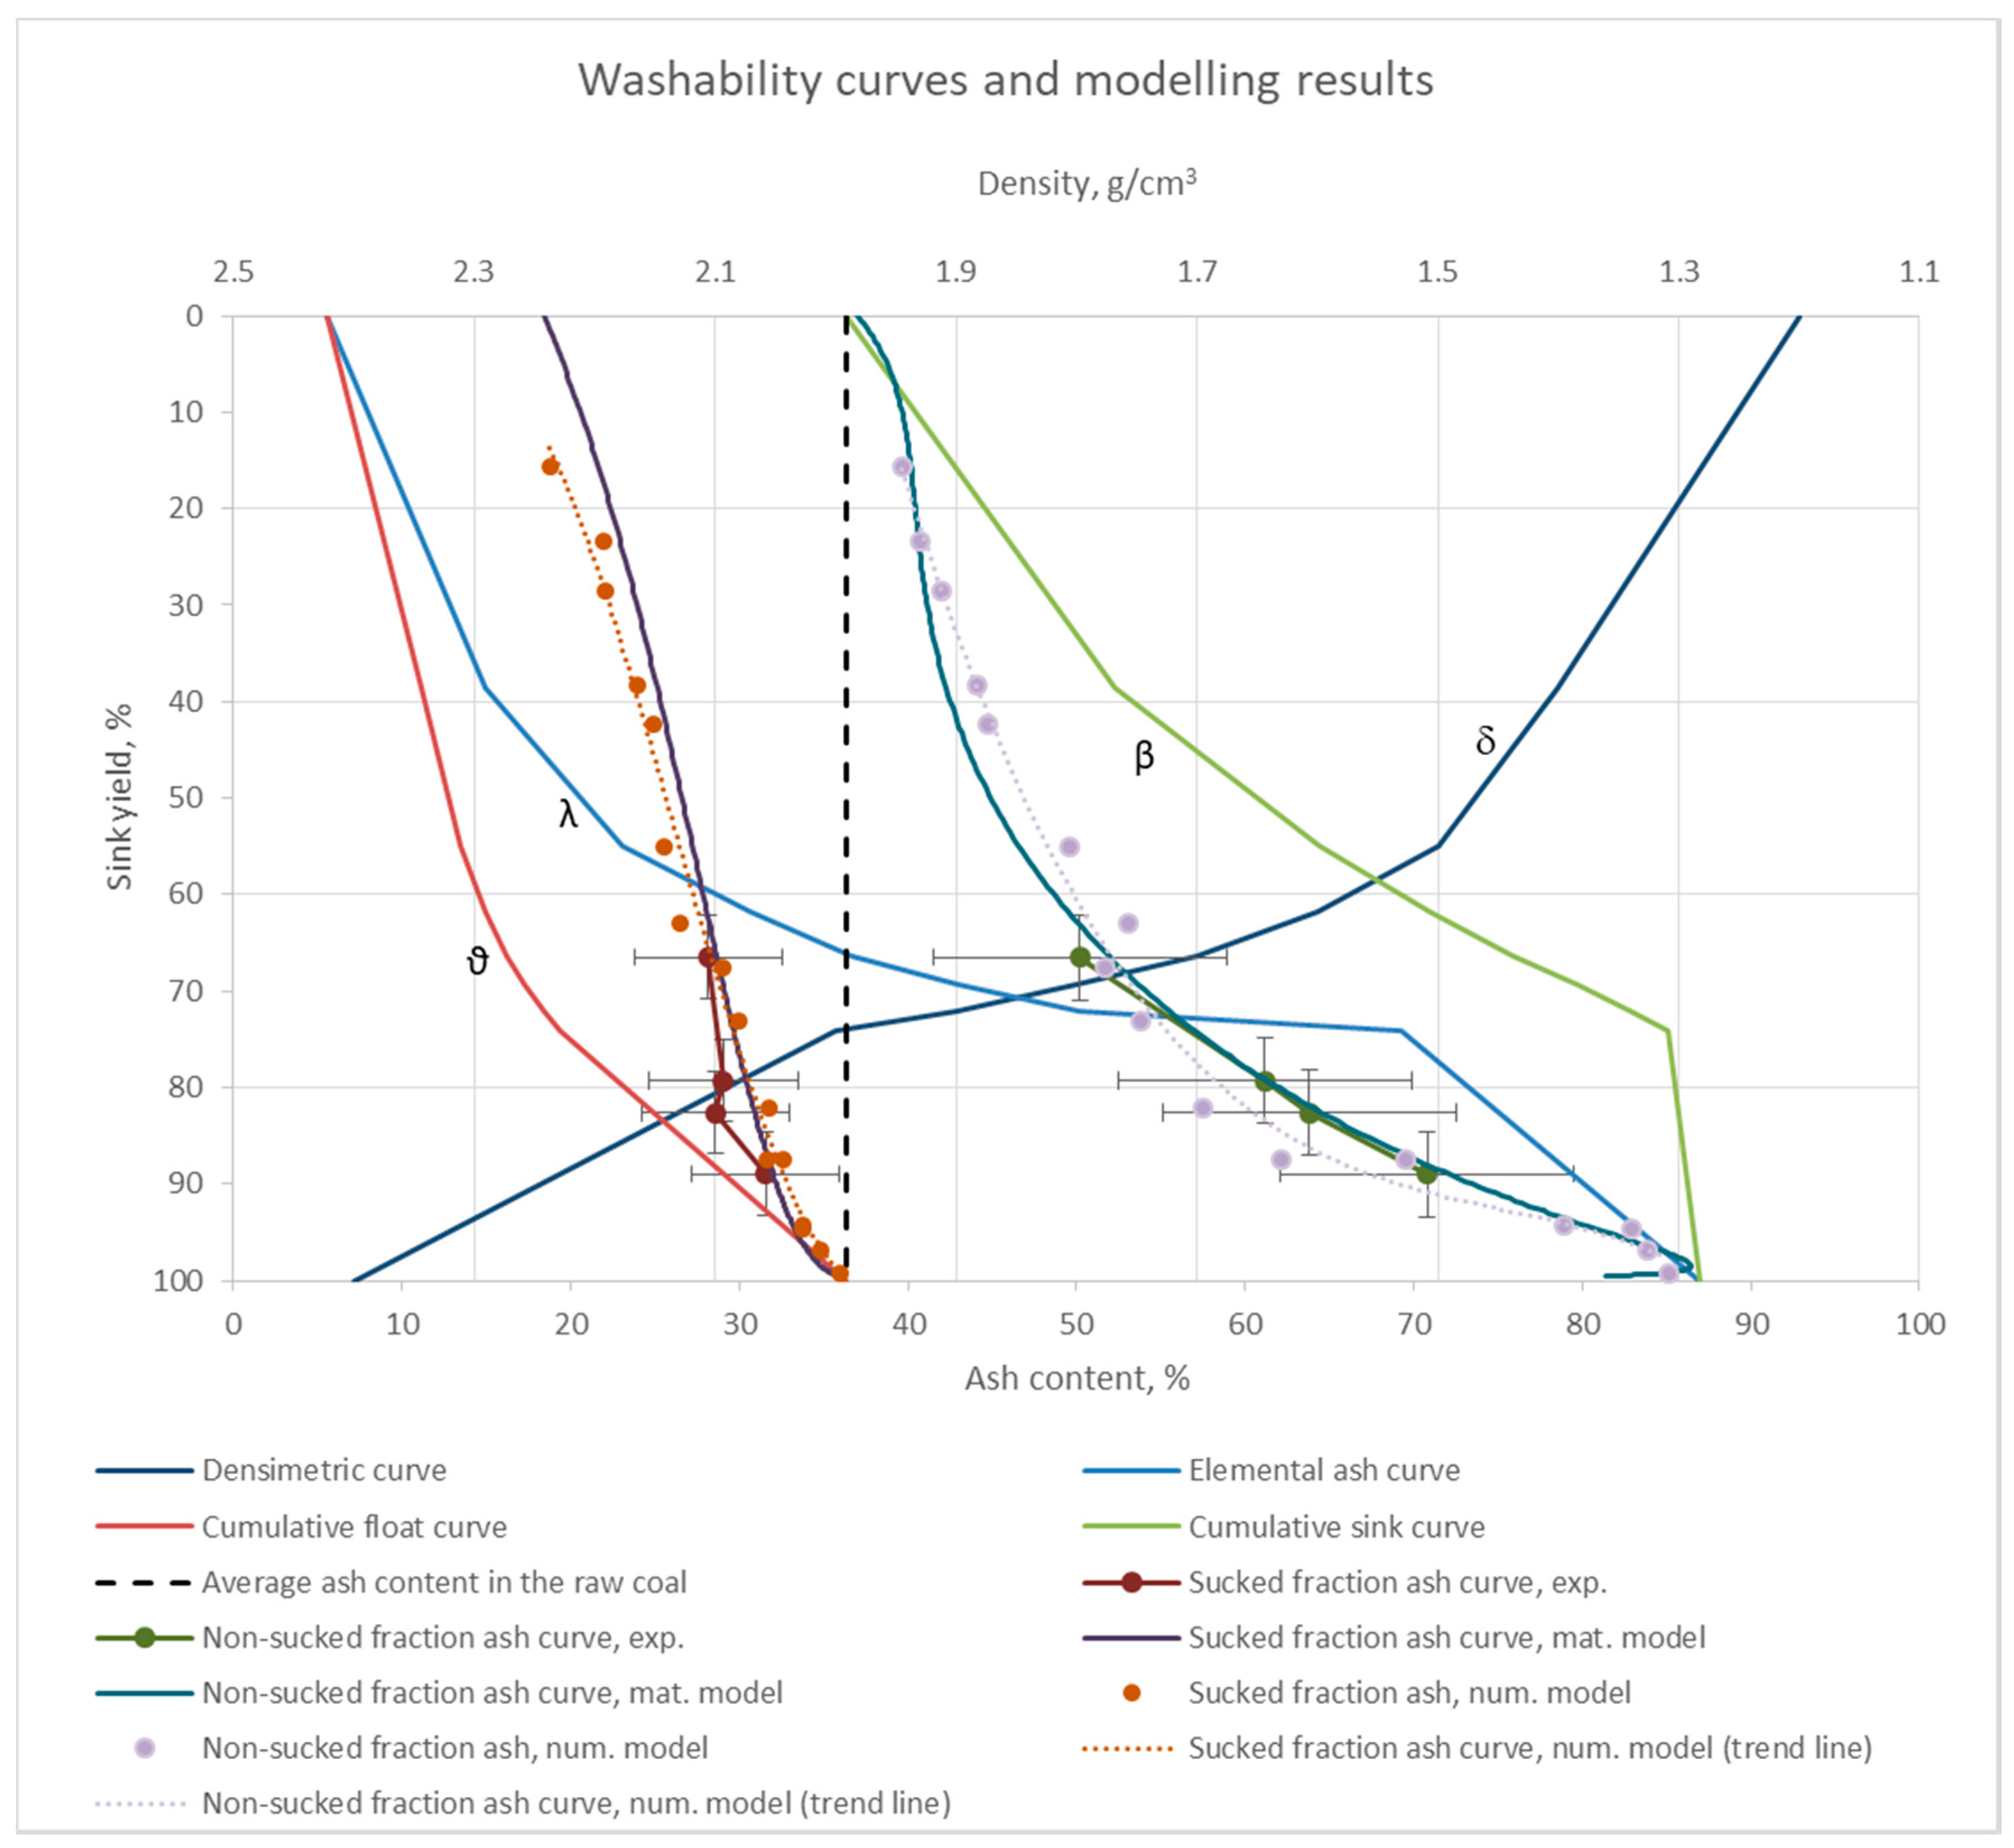
Figure A6.
Assessment of the efficiency of coal separation with use of the NPPS in comparison to wet methods—feed material no. 4 in grain size class 0–20 mm.
Figure A6.
Assessment of the efficiency of coal separation with use of the NPPS in comparison to wet methods—feed material no. 4 in grain size class 0–20 mm.

Appendix A3. Coal no. 5
Figure A7.
Comparison of values obtained experimentally and calculated using the developed models—output yield and ash content in relationship to air flow velocity; feed material no. 5 (0–20 mm).
Figure A7.
Comparison of values obtained experimentally and calculated using the developed models—output yield and ash content in relationship to air flow velocity; feed material no. 5 (0–20 mm).
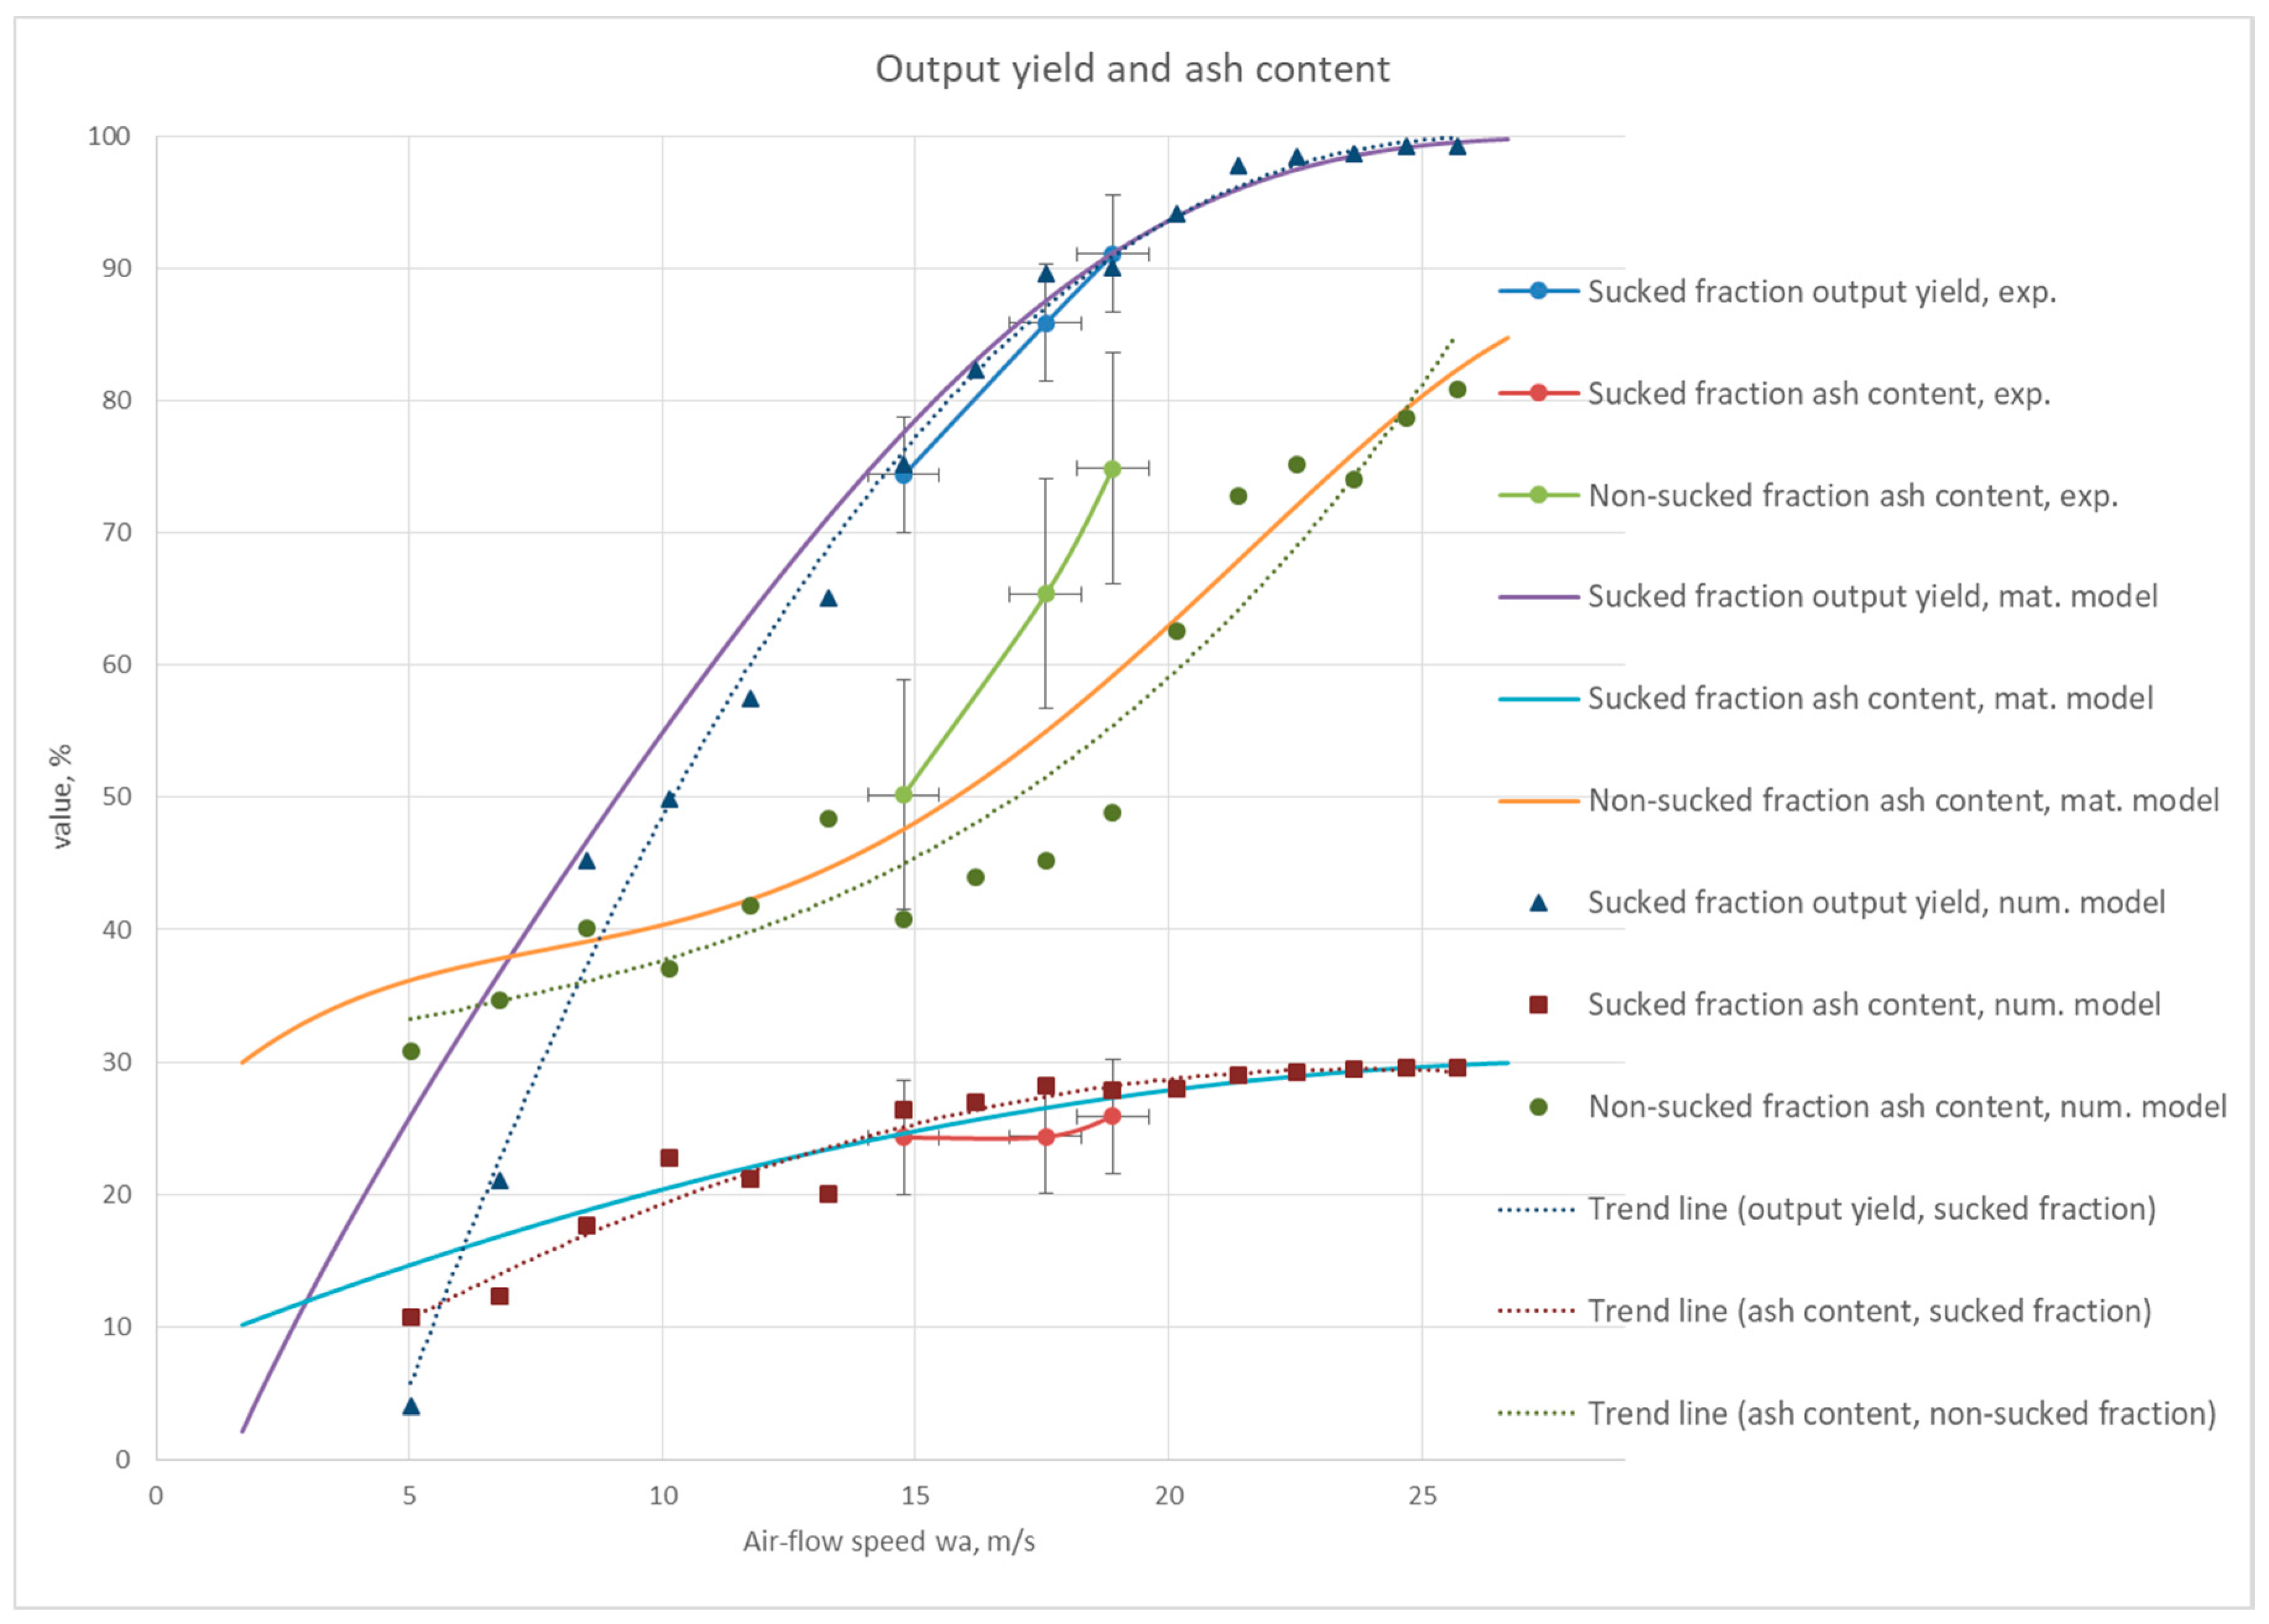
Figure A8.
Summary of washability curves, enrichment curves, experimental results and modelling results—feed material no. 5 in grain size class 0–20 mm.
Figure A8.
Summary of washability curves, enrichment curves, experimental results and modelling results—feed material no. 5 in grain size class 0–20 mm.
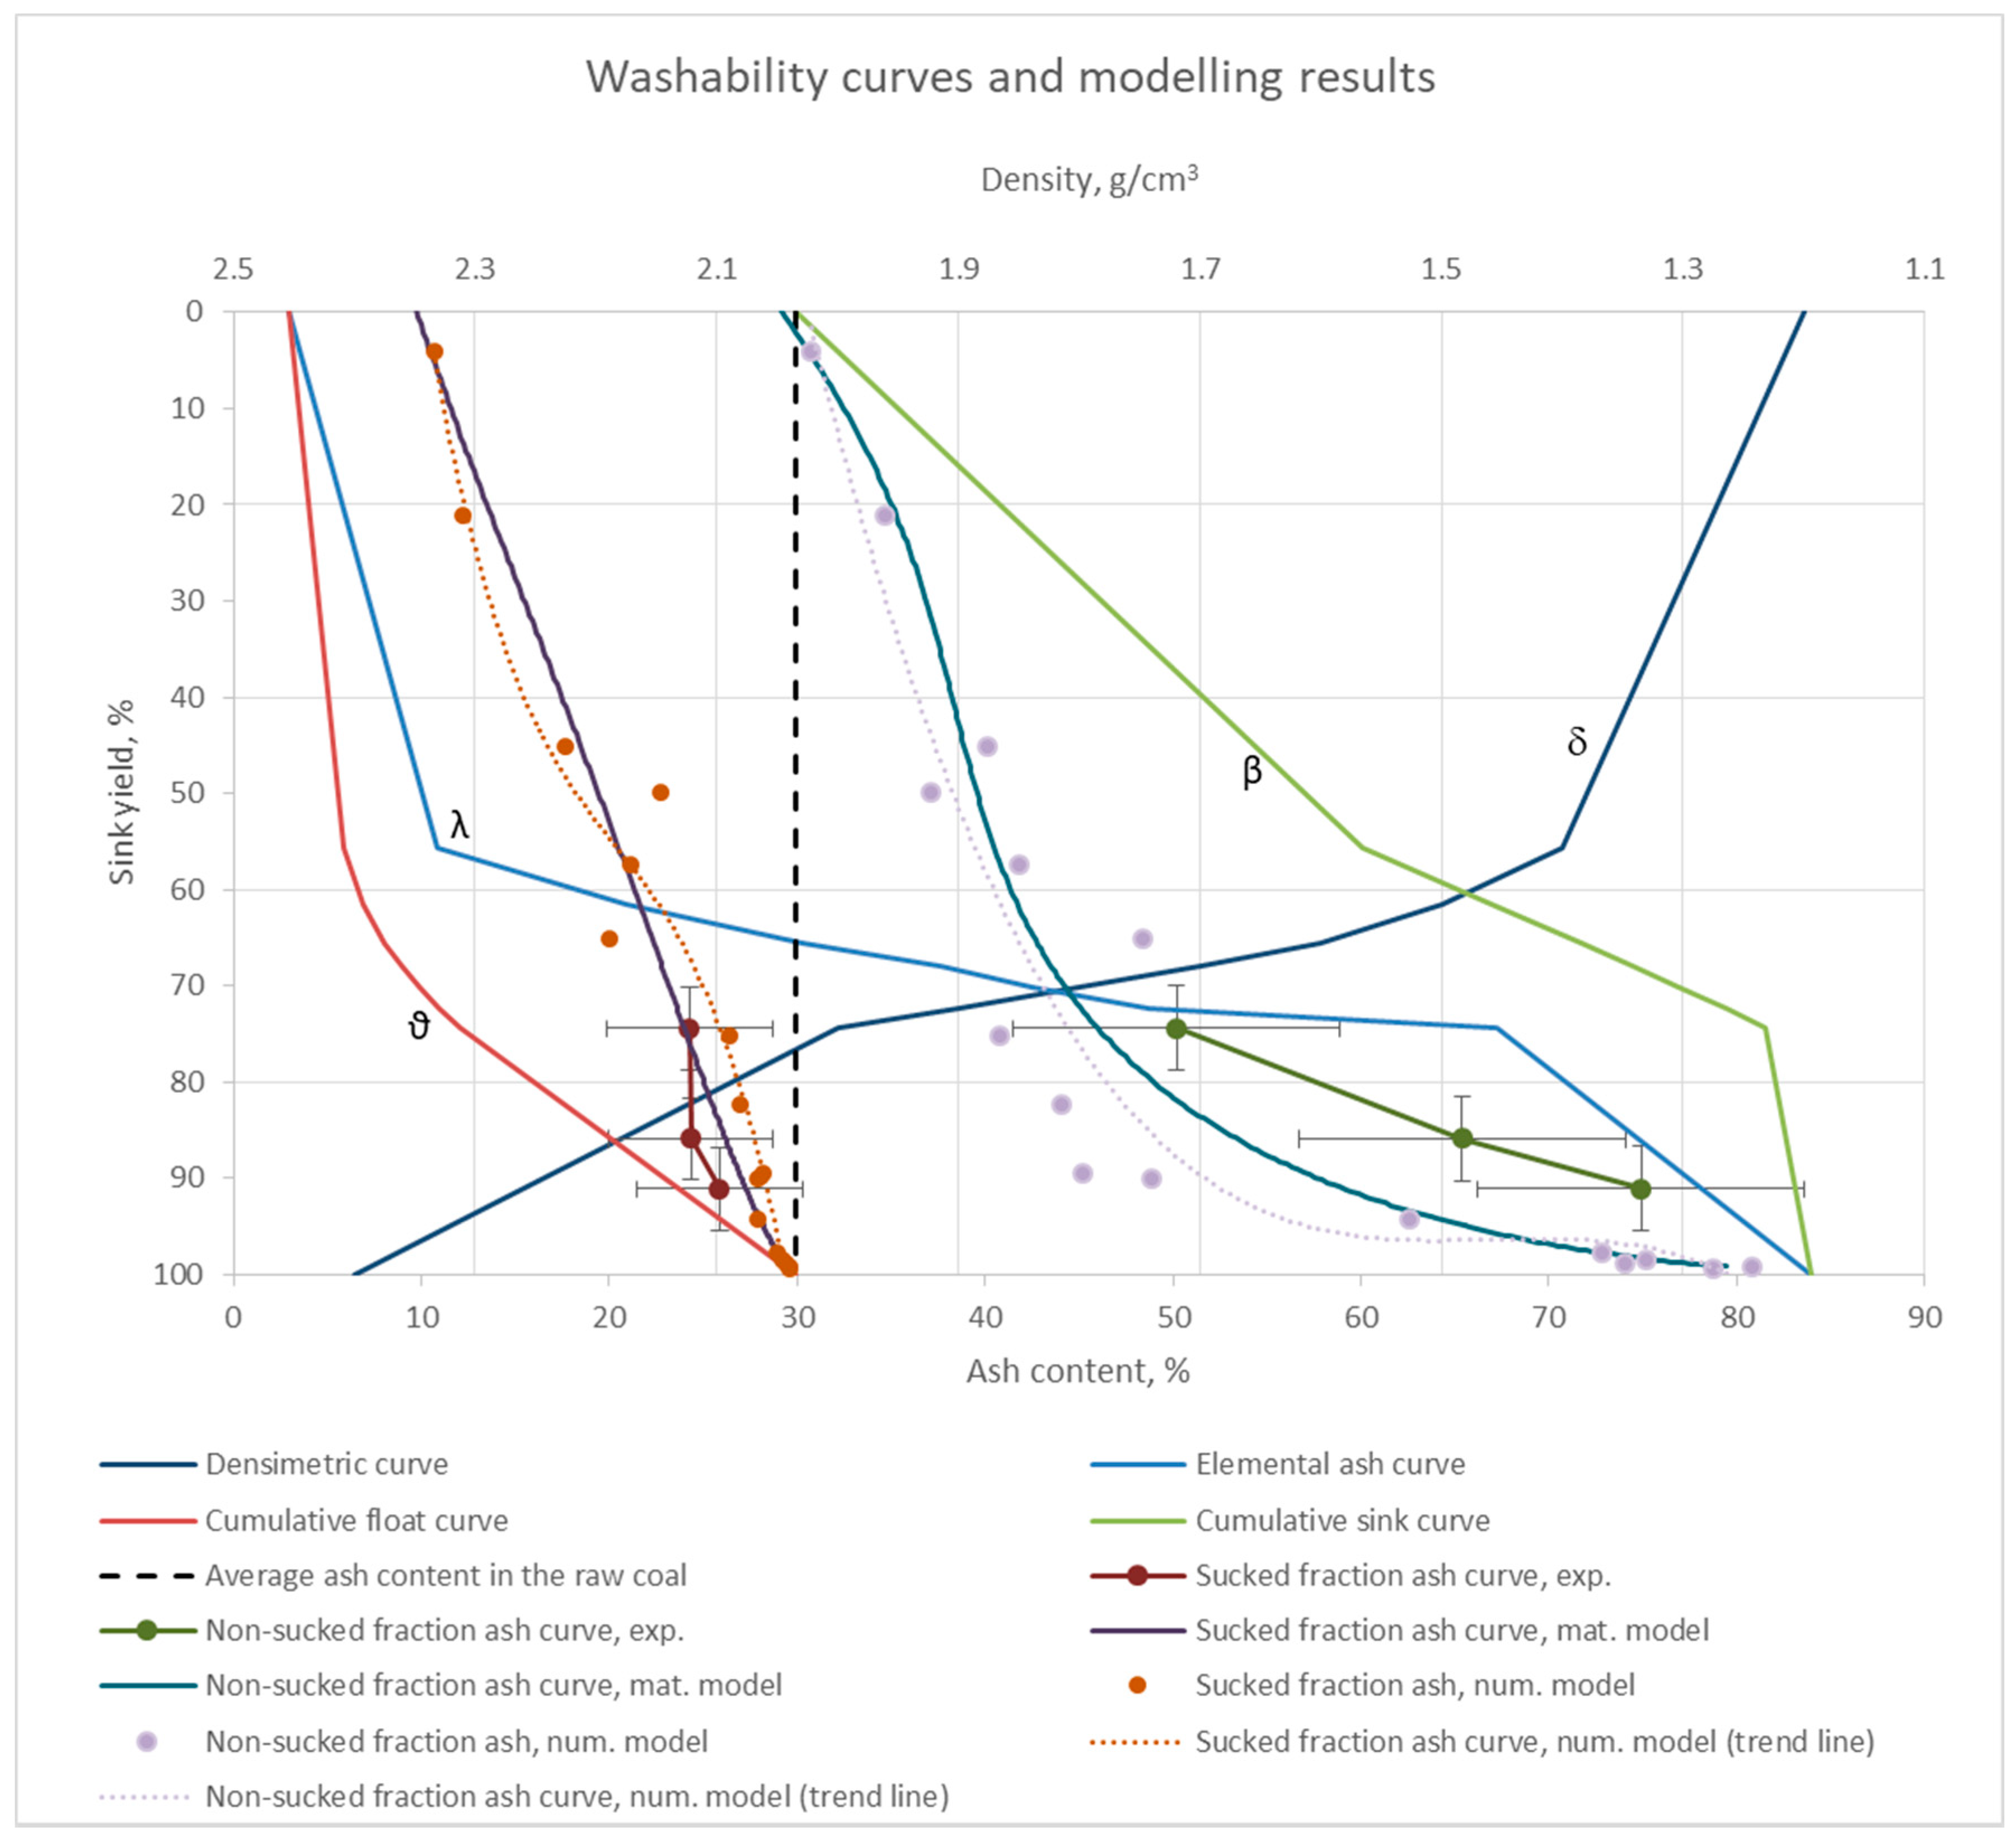
Figure A9.
Assessment of the efficiency of coal separation with the use of the NPPS in comparison to wet methods—feed material no. 5 in grain size class 0–20 mm.
Figure A9.
Assessment of the efficiency of coal separation with the use of the NPPS in comparison to wet methods—feed material no. 5 in grain size class 0–20 mm.

Appendix B
The Appendix B presents the comparison of pressure measurements and modelling results for supplementary model validation.
Figure A10.
Pressure profile in the sorter symmetry plane (simulation of the main fan at 20 Hz): (a) numerical model (gauge pressure) and (b) measured (negative pressure).
Figure A10.
Pressure profile in the sorter symmetry plane (simulation of the main fan at 20 Hz): (a) numerical model (gauge pressure) and (b) measured (negative pressure).
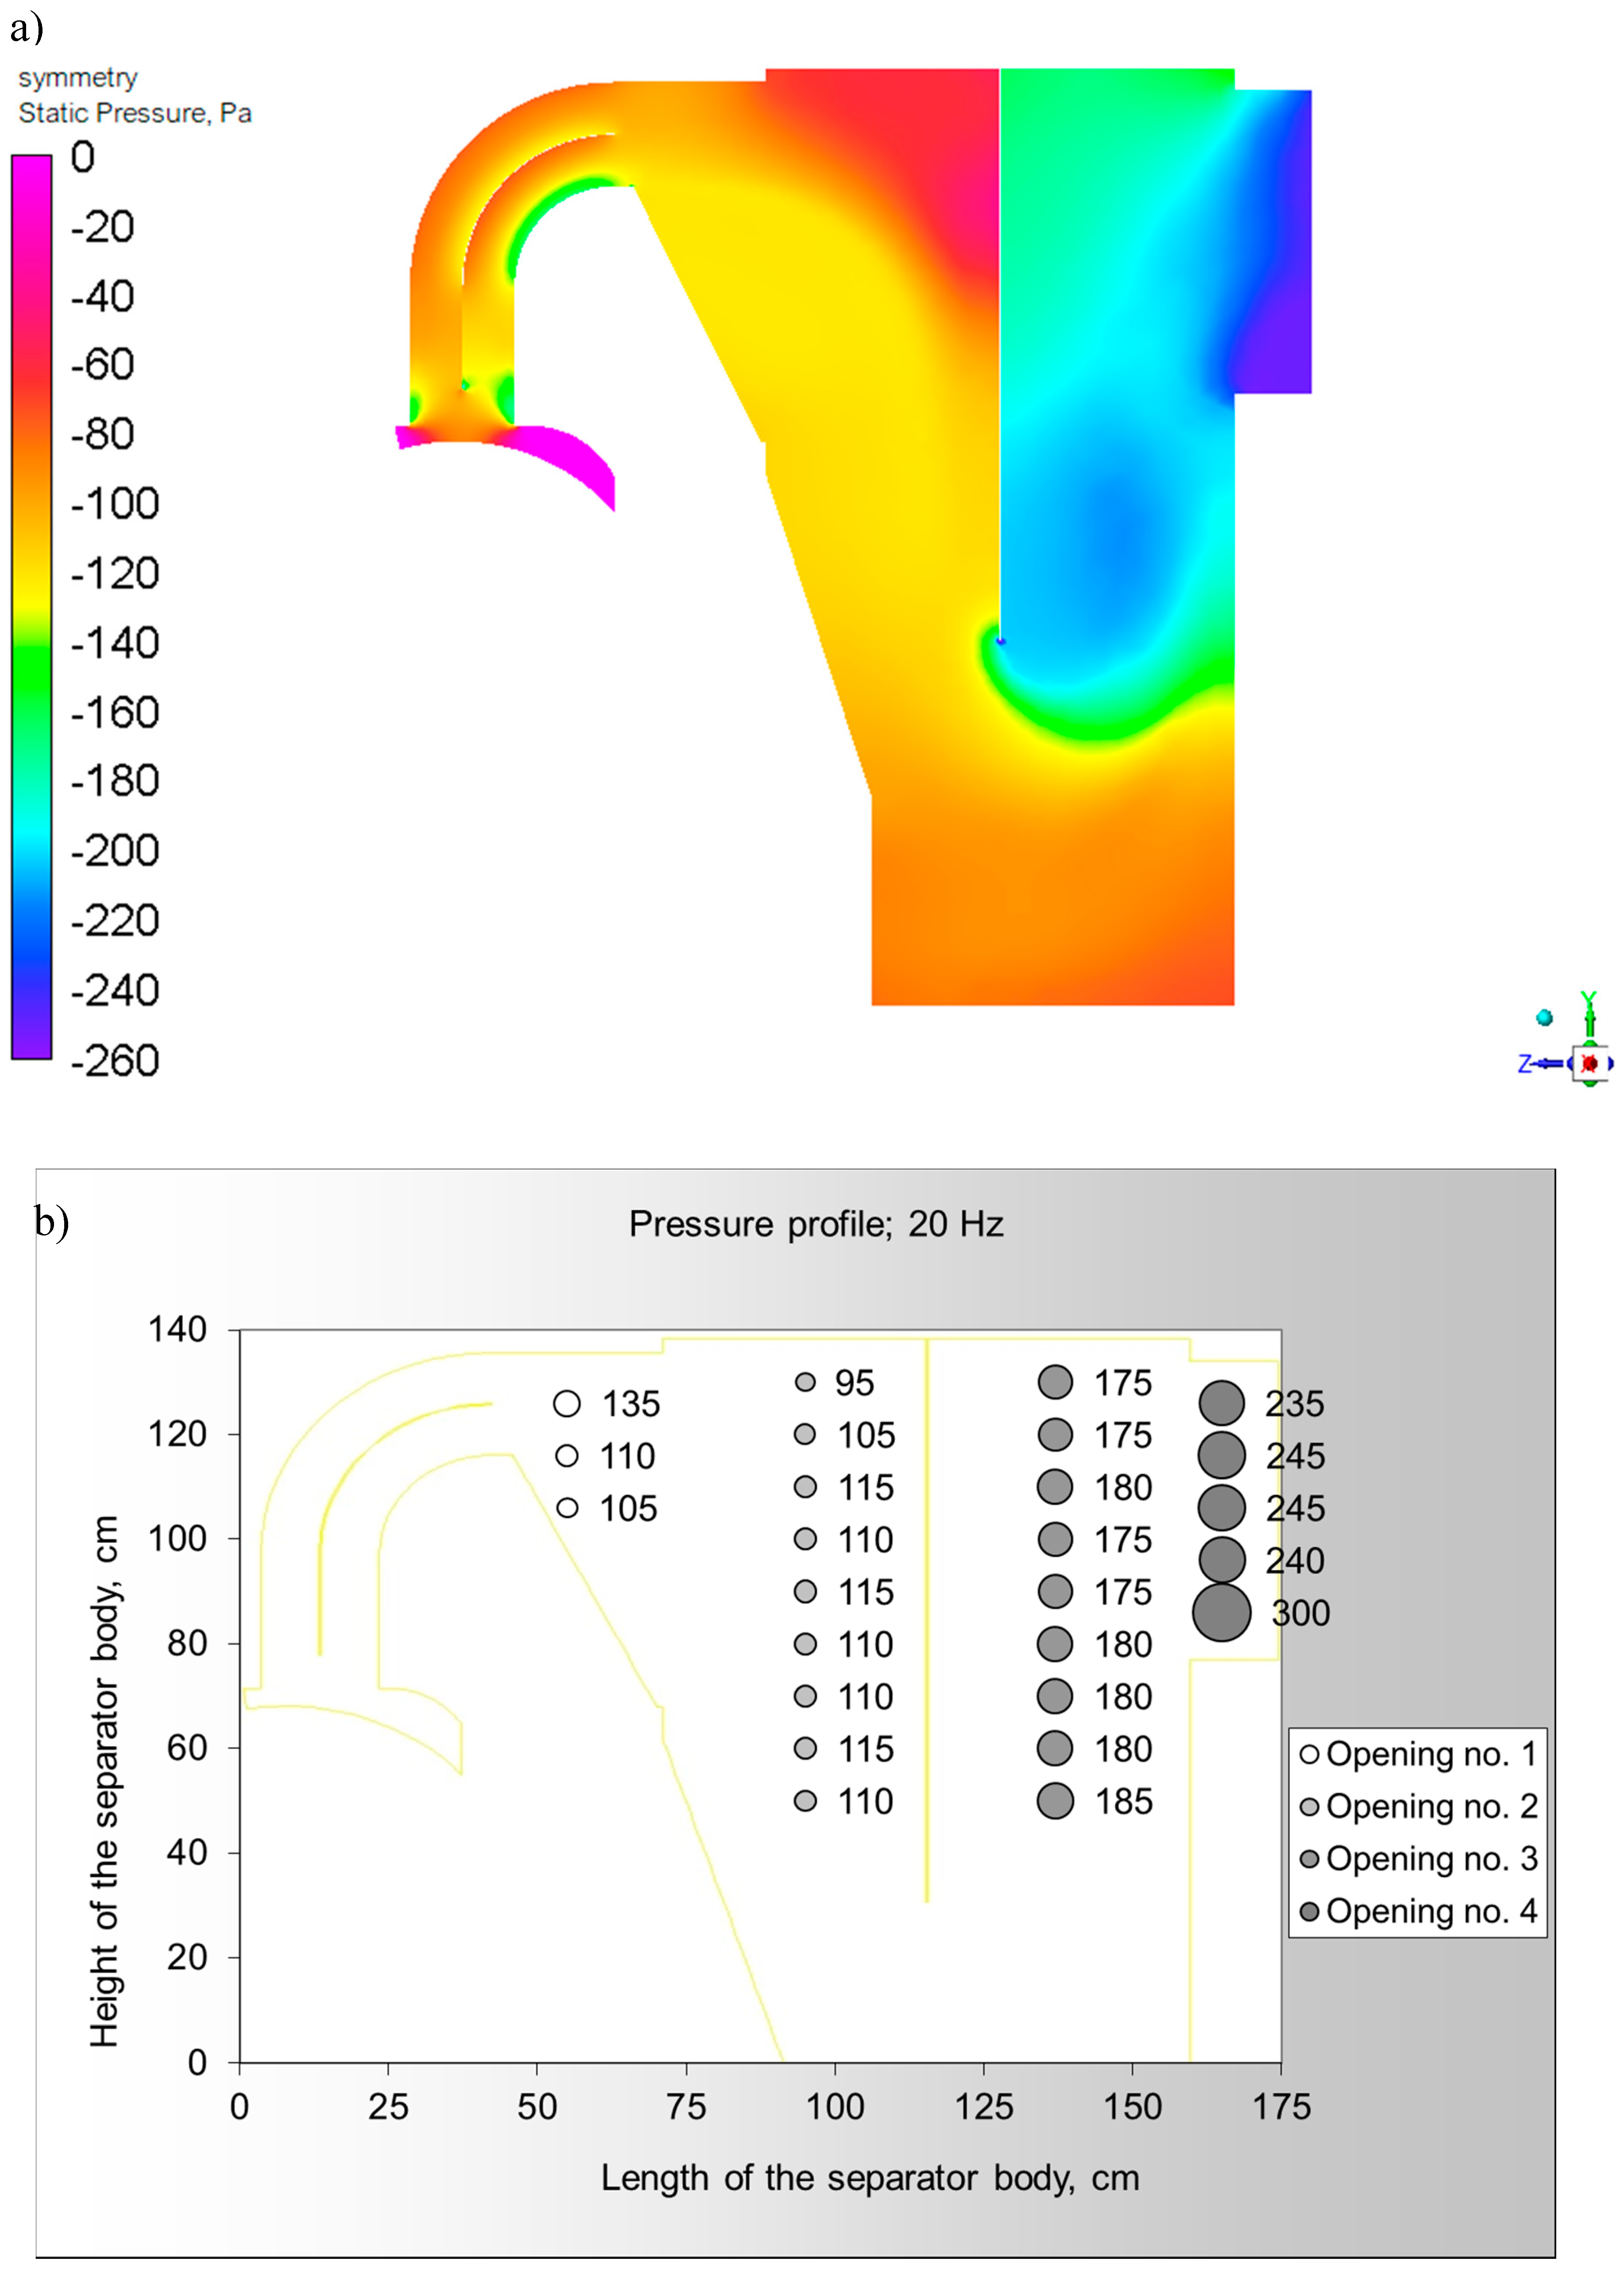
Figure A11.
Pressure profile in the sorter symmetry plane (simulation of the main fan at 25 Hz): (a) numerical model (gauge pressure) and (b) measured (negative pressure).
Figure A11.
Pressure profile in the sorter symmetry plane (simulation of the main fan at 25 Hz): (a) numerical model (gauge pressure) and (b) measured (negative pressure).
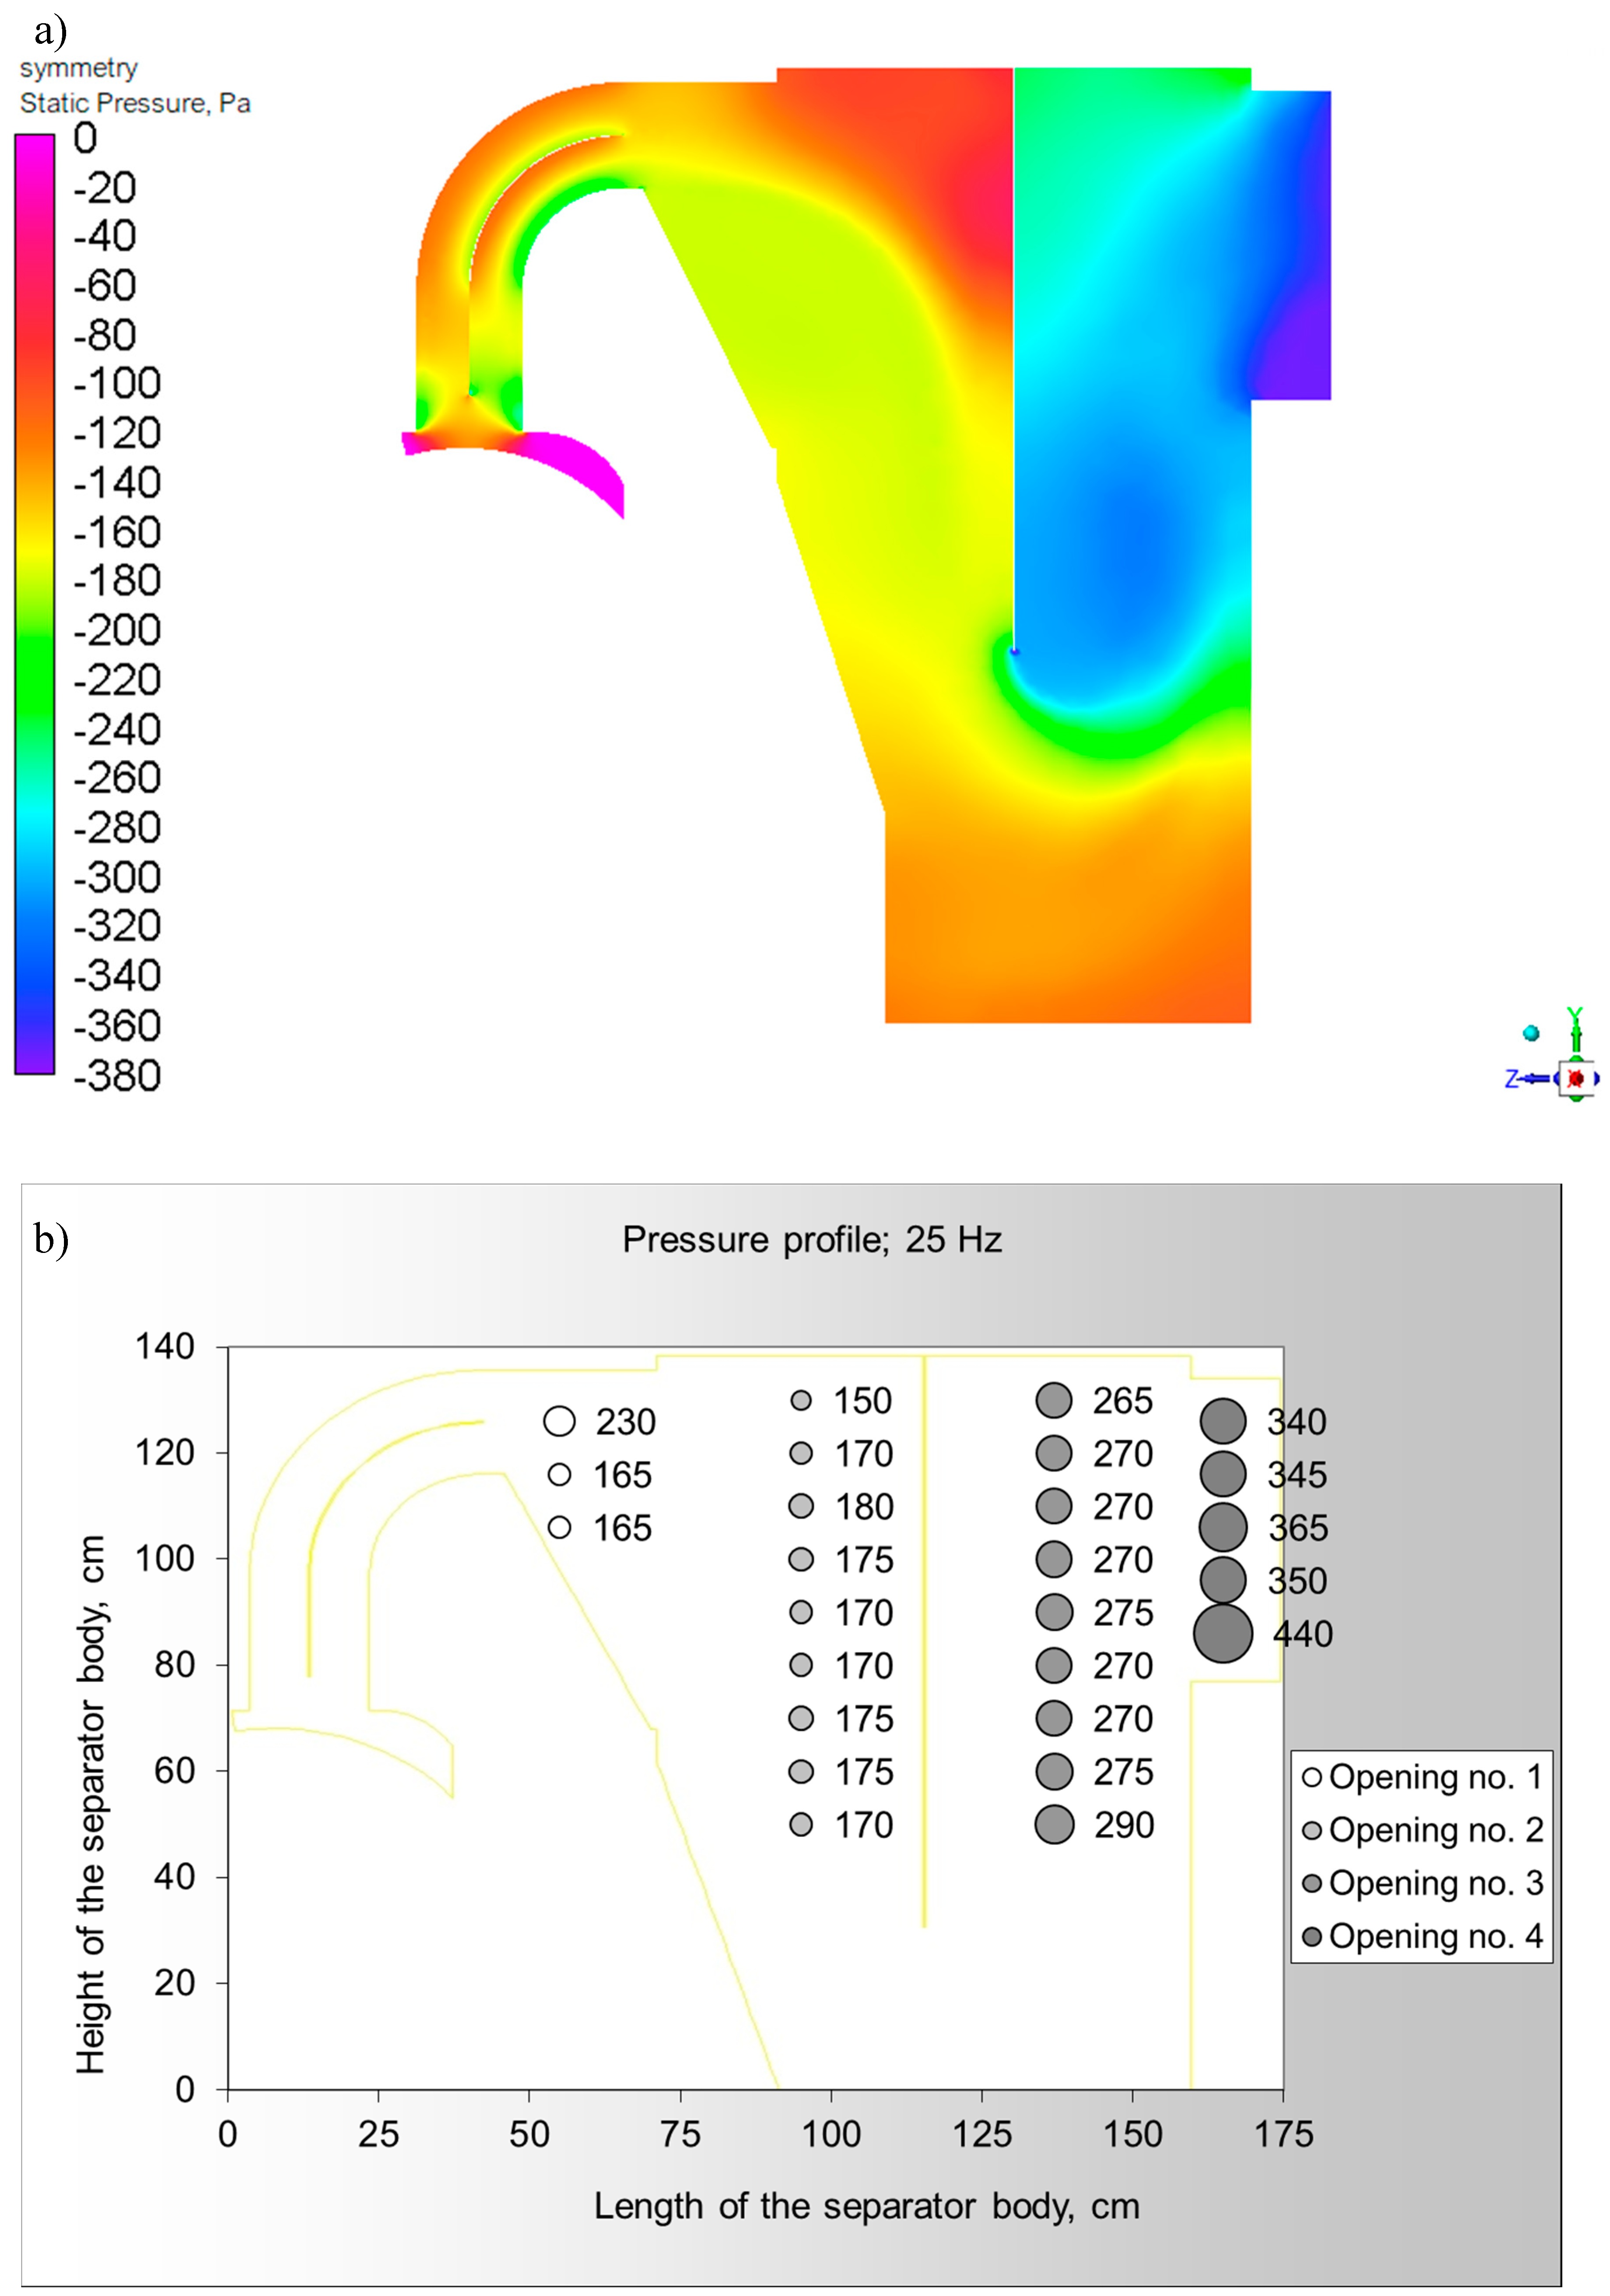
Figure A12.
Pressure profile in the sorter symmetry plane (simulation of the main fan at 30 Hz): (a) numerical model (gauge pressure) and (b) measured (negative pressure).
Figure A12.
Pressure profile in the sorter symmetry plane (simulation of the main fan at 30 Hz): (a) numerical model (gauge pressure) and (b) measured (negative pressure).

Figure A13.
Pressure profile in the sorter symmetry plane (simulation of the main fan at 40 Hz): (a) numerical model (gauge pressure) and (b) measured (negative pressure).
Figure A13.
Pressure profile in the sorter symmetry plane (simulation of the main fan at 40 Hz): (a) numerical model (gauge pressure) and (b) measured (negative pressure).
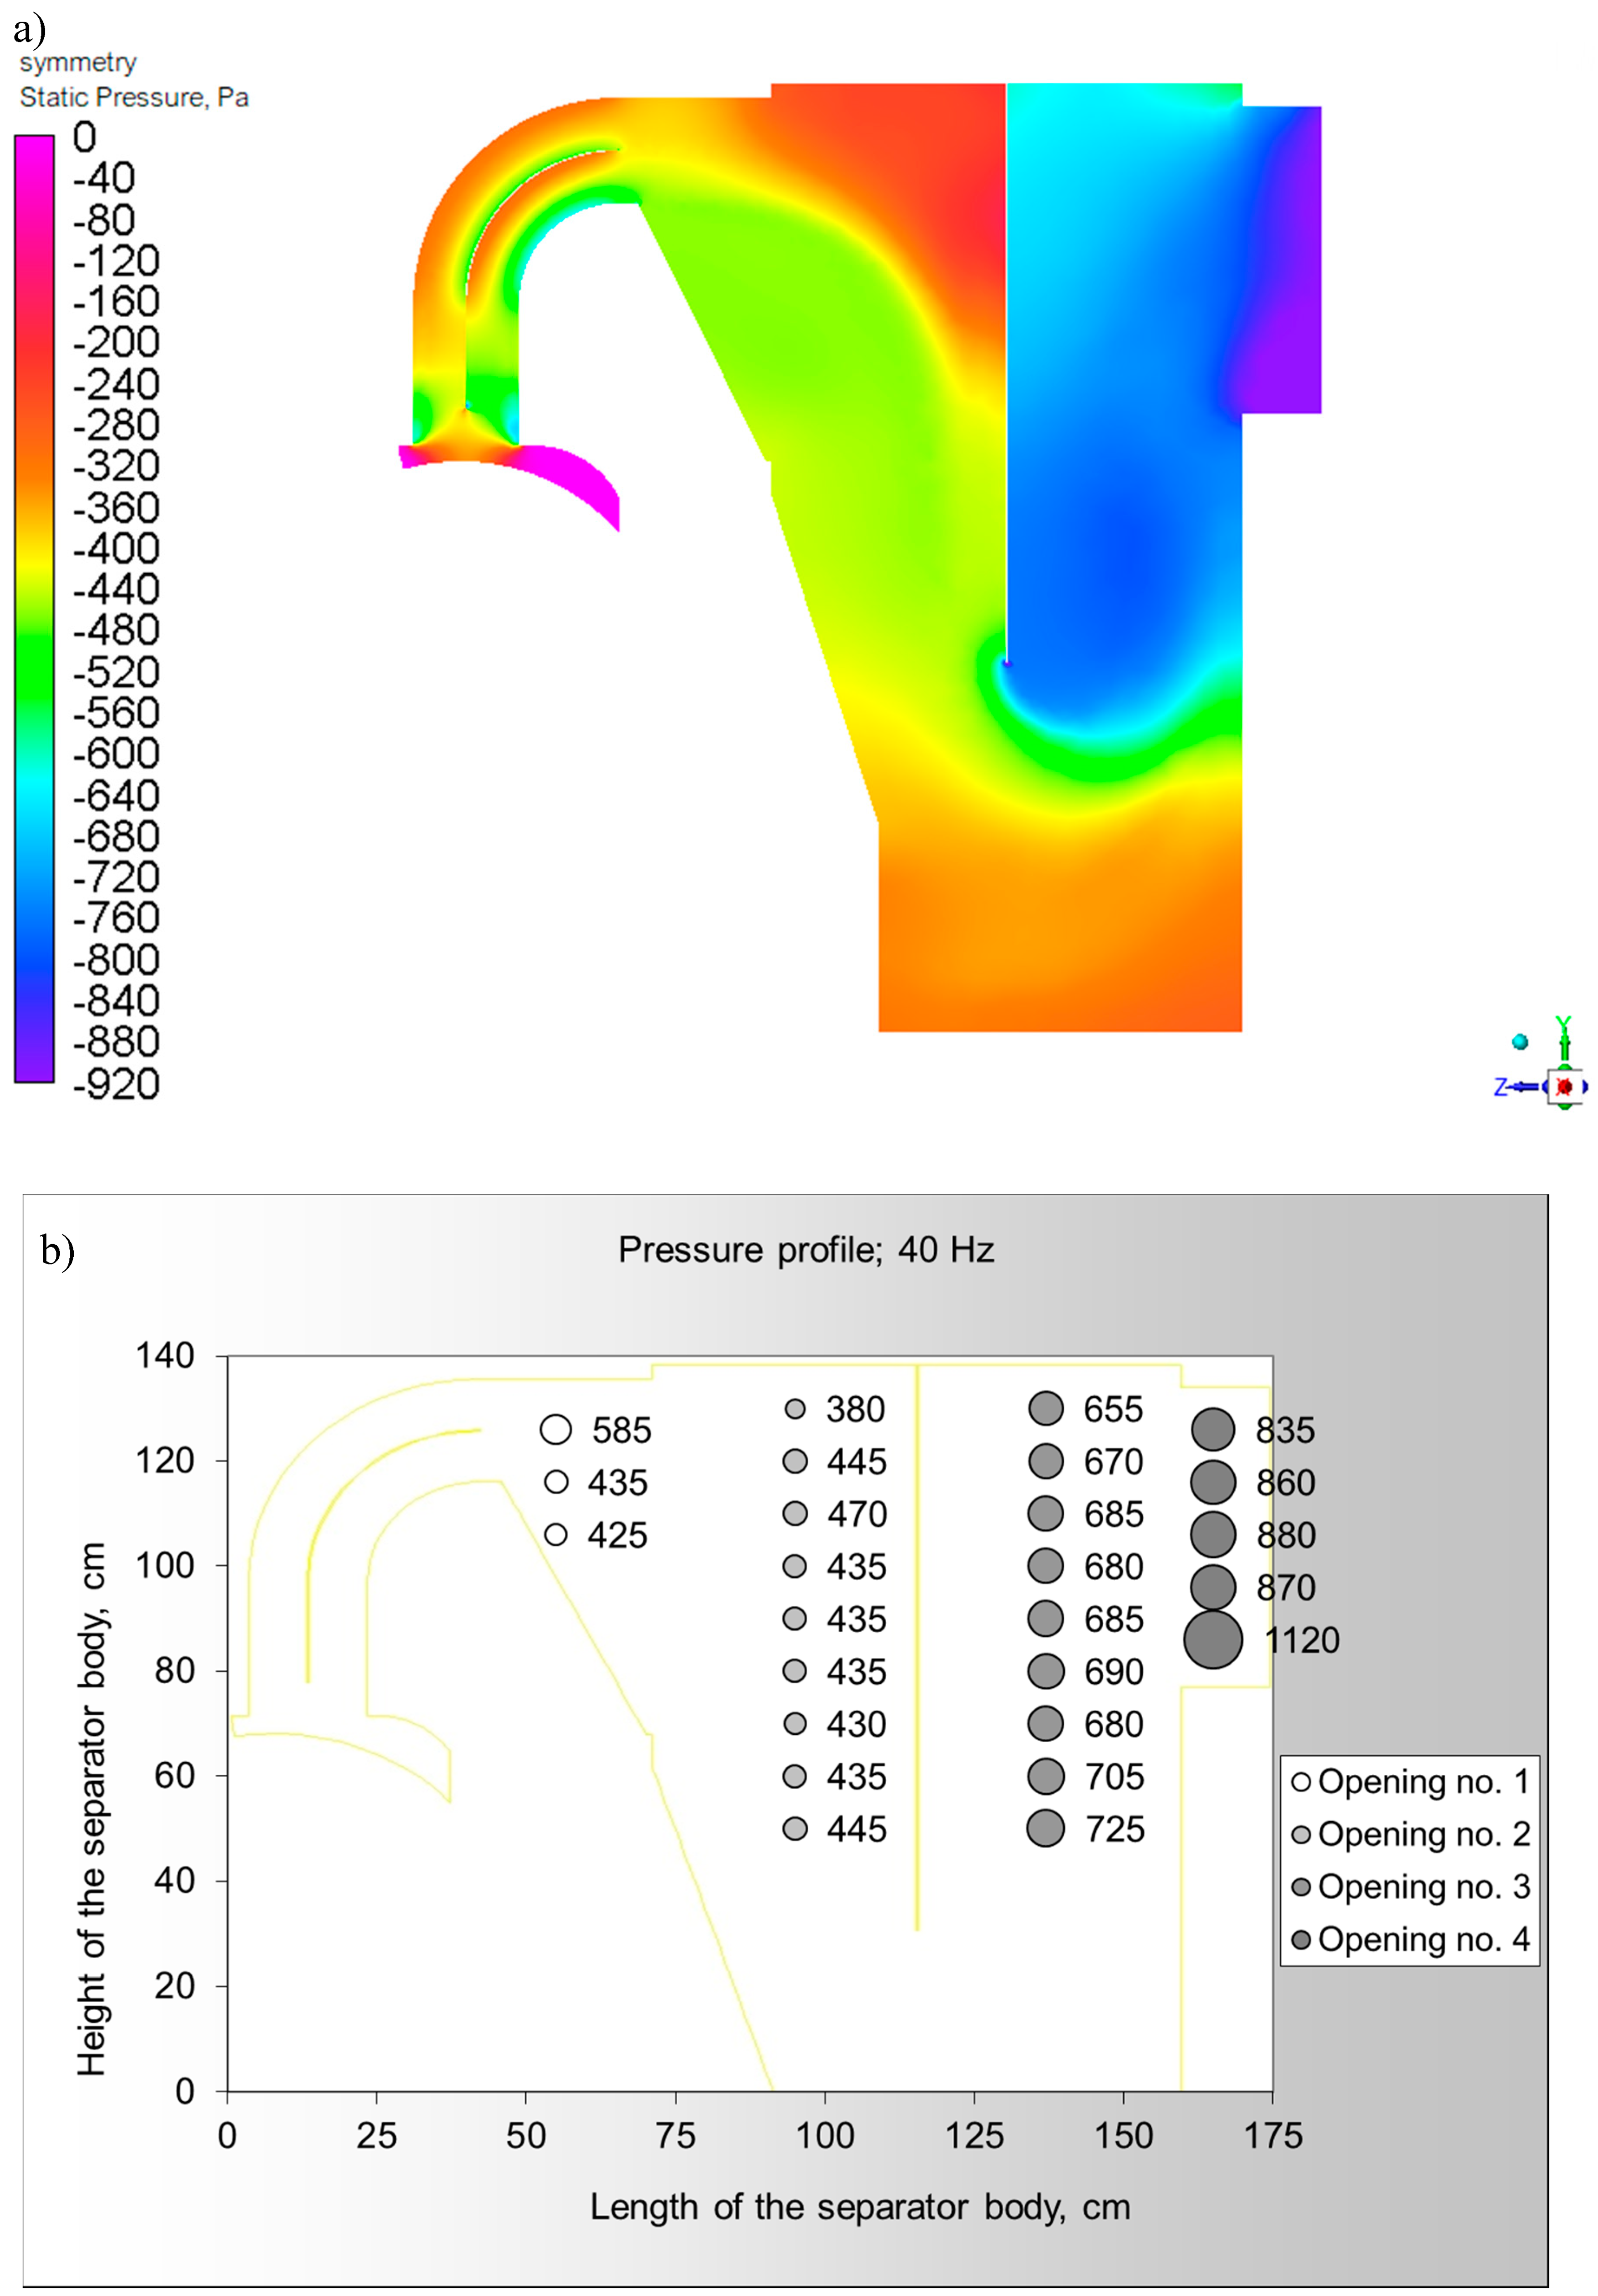
Figure A14.
Pressure profile in the sorter symmetry plane (simulation of the main fan at 45 Hz): (a) numerical model (gauge pressure) and (b) measured (negative pressure).
Figure A14.
Pressure profile in the sorter symmetry plane (simulation of the main fan at 45 Hz): (a) numerical model (gauge pressure) and (b) measured (negative pressure).

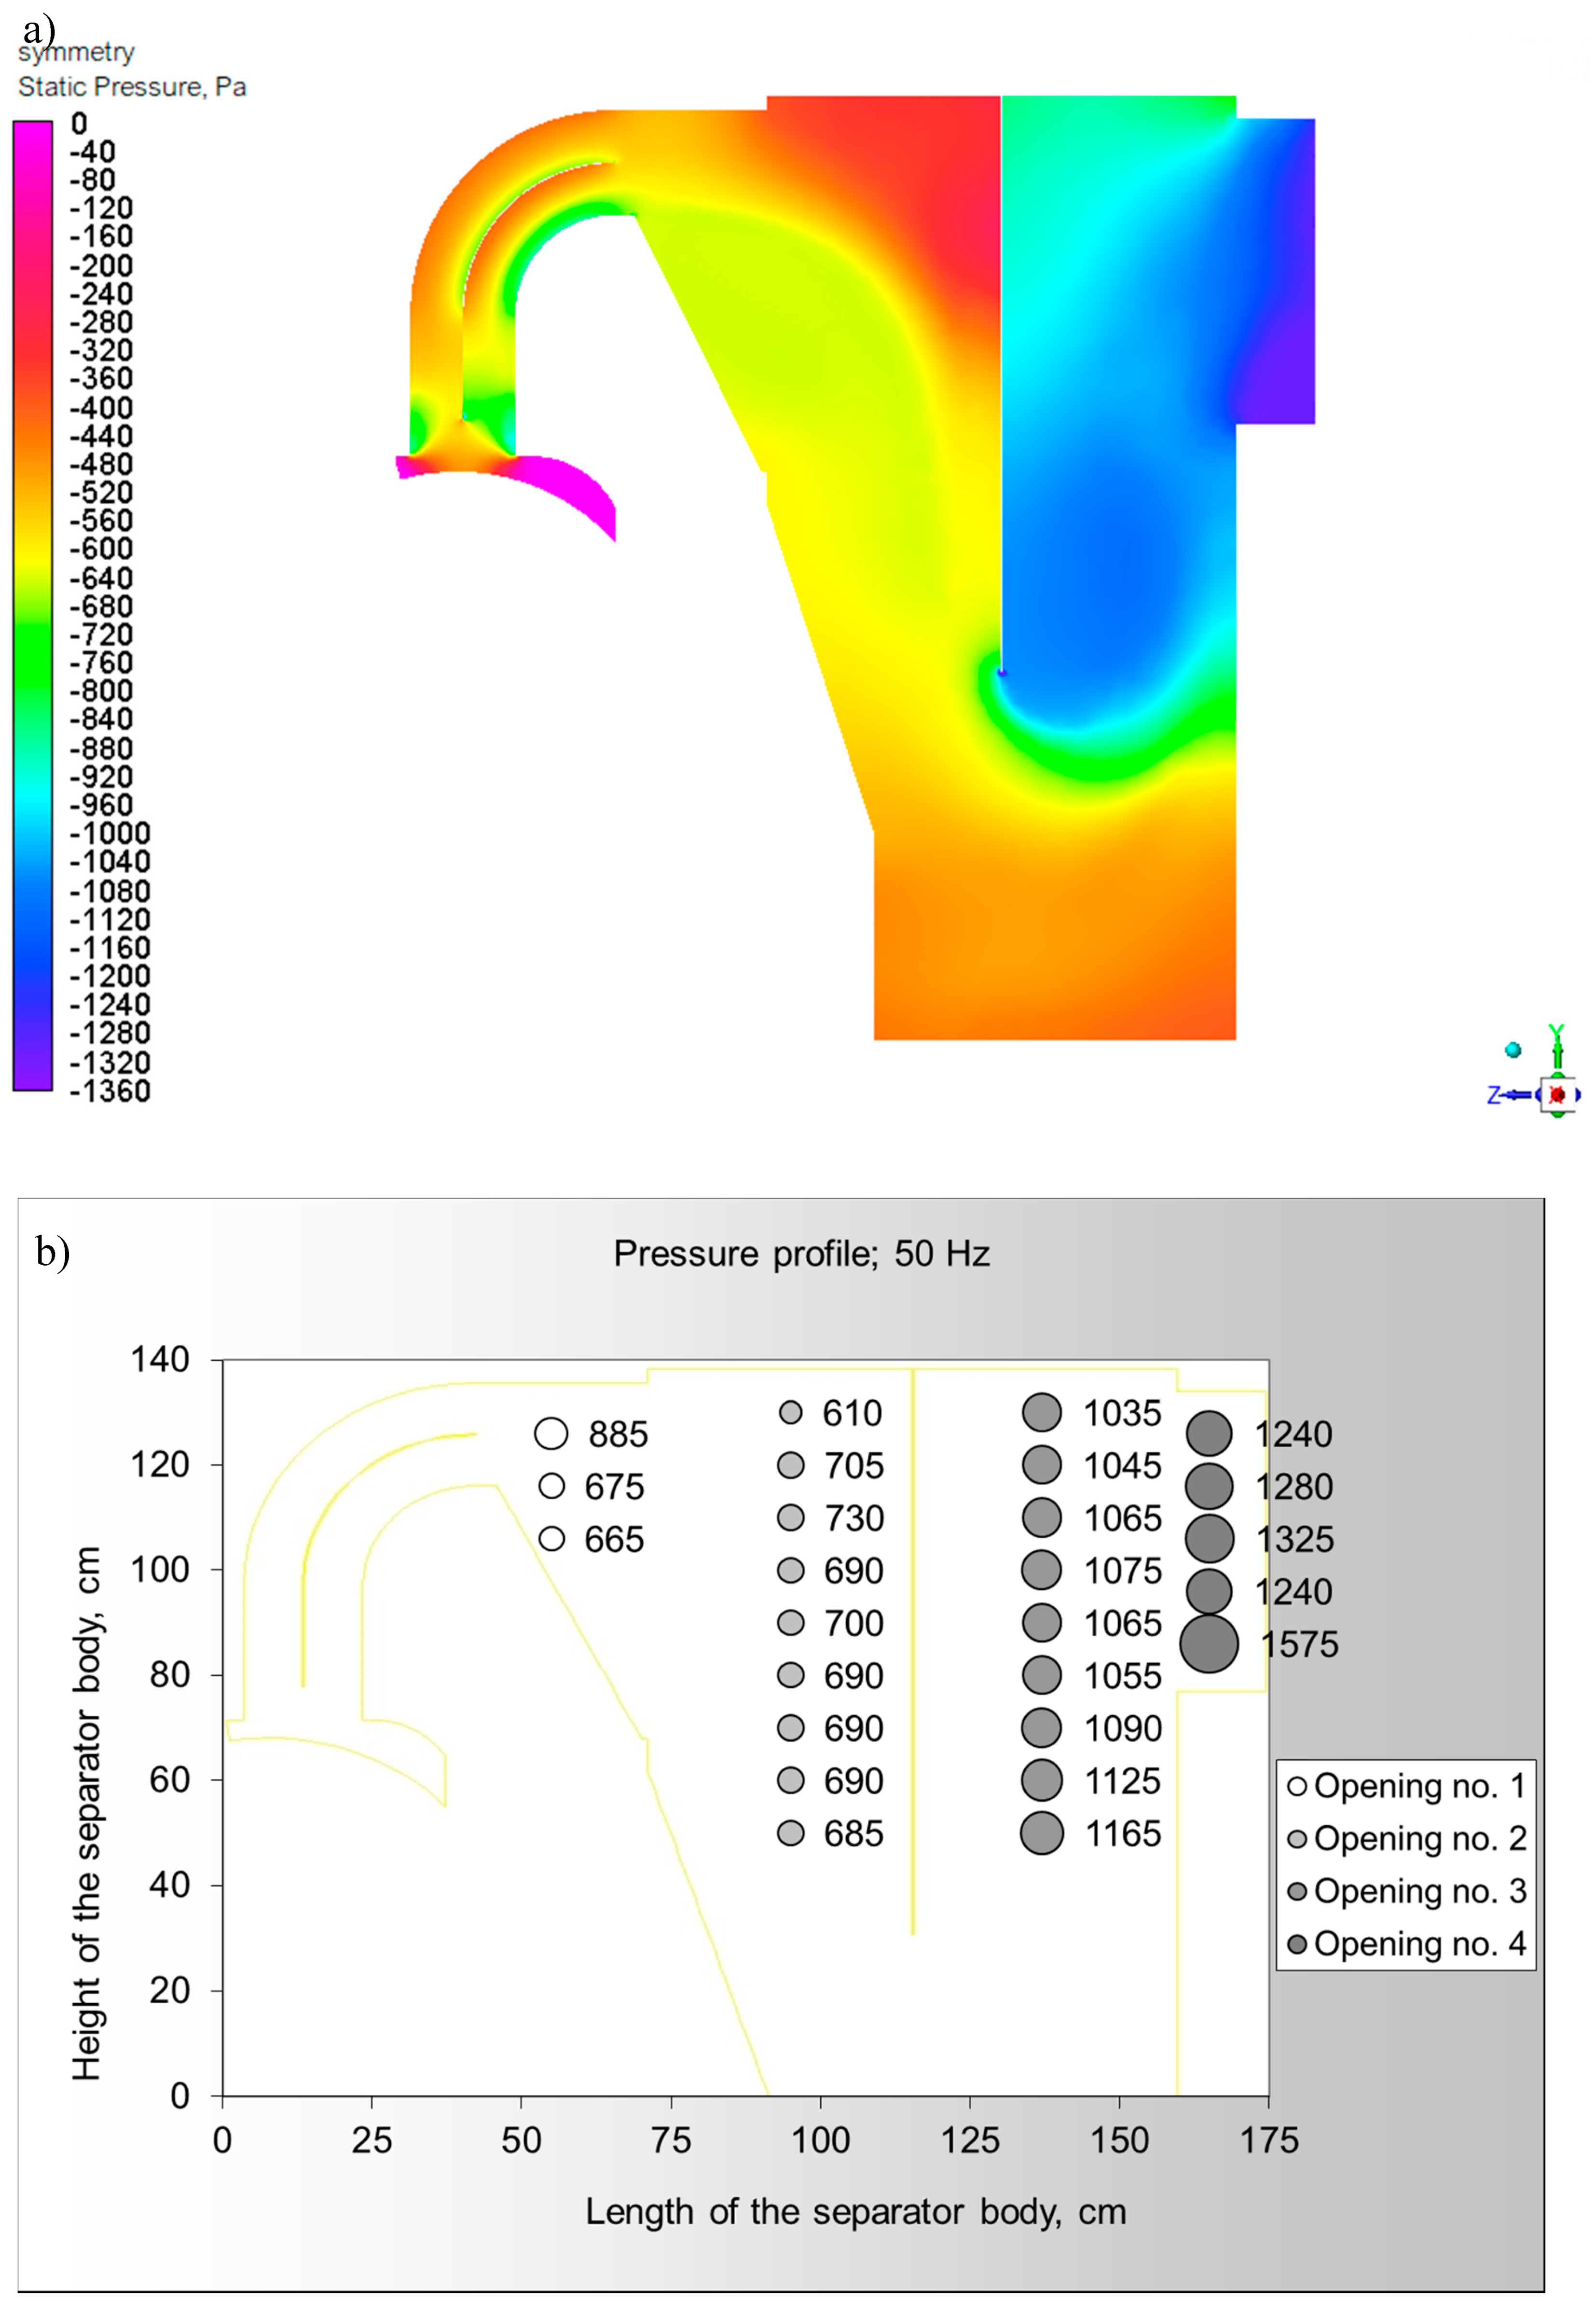
Figure A15.
Pressure profile in the sorter symmetry plane (simulation of the main fan at 50 Hz): (a) numerical model (gauge pressure) and (b) measured (negative pressure).
Figure A15.
Pressure profile in the sorter symmetry plane (simulation of the main fan at 50 Hz): (a) numerical model (gauge pressure) and (b) measured (negative pressure).
References
- World Energy Council. World Energy Resources: 2013 Survey. Available online: https://www.worldenergy.org/publications/entry/world-energy-resources-2013-survey (accessed on 29 July 2019).
- U.S. Energy Information Administration. International Energy Outlook 2016. Available online: https://www.eia.gov/outlooks/archive/ieo16/ (accessed on 29 July 2019).
- Lockhart, N.C. Dry beneficiation of coal. Powder Technol. 1984, 40, 17–42. [Google Scholar] [CrossRef]
- Van Houwelingen, J.A.; De Jong, T.P.R. Dry cleaning of coal: Review, fundamentals and opportunities. Geol. Belgica 2004, 7, 335–343. [Google Scholar]
- Dwari, R.K.; Hanumantha, R.K. Dry beneficiation of coal—A review. Miner. Process. Extr. Metall. Rev. 2007, 28, 177–234. [Google Scholar] [CrossRef]
- Galvin, K.P.; Pratten, S.J.; Nicol, S.K. Dense medium separation using a teetered bed separator. Miner. Eng. 1999, 12, 1059–1081. [Google Scholar] [CrossRef]
- Nguyentranlam, G.; Galvin, K.P. Particle classification in the reflux classifier. Miner. Eng. 2001, 14, 1081–1091. [Google Scholar] [CrossRef]
- Galvin, K.P.; Doroodchi, E.; Callen, A.M.; Lambert, N.; Pratten, S.J. Pilot plant trial of the reflux classifier. Miner. Eng. 2002, 15, 19–25. [Google Scholar] [CrossRef]
- Honaker, R.Q.; Jain, M.; Parekh, B.K.; Saracoglu, M. Ultrafine coal cleaning using spiral concentrators. Miner. Eng. 2007, 20, 1315–1319. [Google Scholar] [CrossRef]
- Das, A.; Sarkar, B.; Mehrotra, S.P. Prediction of separation performance of Floatex Density Separator for processing of fine coal particles. Int. J. Miner. Process. 2009, 91, 41–49. [Google Scholar] [CrossRef]
- Sarkar, B.; Das, A.; Mehrotra, S.P. Study of separation features in floatex density separator for cleaning fine coal. Int. J. Miner. Process. 2008, 86, 40–49. [Google Scholar] [CrossRef]
- Hacifazlioglu, H. Application of the modified water-only cyclone for cleaning fine coals in a Turkish washery, and comparison of its performance results with those of spiral and flotation. Fuel Process. Technol. 2012, 102, 11–17. [Google Scholar] [CrossRef]
- Vasumathi, N.; Vijaya Kumar, T.V.; Ratchambigai, S.; Subba Rao, S.; Prabhakar, S.; Bhaskar Raju, G. Beneficiation of an Indian non-coking coal by column flotation. Int. J. Coal Sci. Technol. 2016, 3, 206–214. [Google Scholar] [CrossRef] [Green Version]
- Baic, I.; Blaschke, W.; Szafarczyk, J. Dry coal cleaning technology. J. Pol. Miner. Eng. Soc. 2014, 34, 257–262. [Google Scholar]
- Zhao, Y.; Yang, X.; Luo, Z.; Duan, C.; Song, S. Progress in developments of dry coal beneficiation. Int. J. Coal Sci. Technol. 2014, 1, 103–112. [Google Scholar] [CrossRef] [Green Version]
- Mijał, W.; Tora, B. Development of dry coal gravity separation techniques. In IOP Conference Series: Materials Science and Engineering, Proceedings of the Mineral Engineering Conference, Zawiercie, Poland, 2018; IOP Publishing: Bristol, UK, 2018. [Google Scholar] [CrossRef]
- Fan, X.; Zhou, C.; Dong, L.; Zhao, Y.; Duan, C.; Zhang, B. Novel method of air distributor design for enhancing bed stability and reducing impurities in gas–solid fluidized bed system. Part. Sci. Technol. 2019, 37, 656–668. [Google Scholar] [CrossRef]
- Luo, Z.; Zhao, Y.; Lv, B.; Fu, Y.; Xu, X.; Chen, C. Dry coal beneficiation technique in the gas–solid fluidized bed: A review. Int. J. Coal Prep. Util. 2019, 1–29. [Google Scholar] [CrossRef]
- Chen, Q.; Yang, Y. Development of Dry Beneficiation of Coal in China. Coal Prep. 2003, 23, 3–12. [Google Scholar] [CrossRef]
- Gulcan, E.; Gulsoy, O.; Çelik, İ.B.; Olgun, Z.; Karaoğuz, S. Investigation of dry coal beneficiation with optical sorter. In Proceedings of the XVIII International Coal Preparation Congress, Saint Petersburg, Russia, 28 June–1 July 2016. [Google Scholar]
- Iskhakhov, K.A.; Schastlivtsev, E.L.; Kondratenko, T.A. Dry Enrichment of Coal. Coke Chem. 2008, 51, 431–433. [Google Scholar] [CrossRef]
- Fu, Z.; Zhu, J.; Barghi, S.; Zhao, Y.; Luo, Z.; Duan, C. Dry coal beneficiation by the semi-industrial Air Dense Medium Fluidized Bed with binary mixtures of magnetite and fine coal particles. Fuel 2019, 243, 509–518. [Google Scholar] [CrossRef]
- Yang, Y.; Ge, L.; He, Y.; Xie, W.; Ge, Z. Mechanism and Fine Coal Beneficiation of a Pulsating Airflow Classifier. Int. J. Coal Prep. Util. 2019, 39, 20–32. [Google Scholar] [CrossRef]
- Dey, S.; Chaurasia, B.; Sahu, L. Dry processing of high ash Indian coal by air fluidized vibrating deck. Int. J. Coal Prep. Util. 2020, 1–20. [Google Scholar] [CrossRef]
- Całus Moszko, J.; Iwaszenko, S.; Bajerski, A.; Janoszek, T. Novel dry sorter for coal processing and coal recovery from mine originating wastes. In Proceedings of the XVIII International Coal Preparation Congress, Saint Petersburg, Russia, 28 June–1 July 2016. [Google Scholar] [CrossRef]
- Stańczyk, K.; Bajerski, A.; Łączny, M.J. Negative-pressure pneumatic separator: A new solution for hard-coal beneficiation. Int. J. Coal Sci. Technol. 2020. [Google Scholar] [CrossRef]
- Chalavadi, G.; Das, A. Study of the mechanism of fine coal beneficiation in air table. Fuel 2015, 154, 207–216. [Google Scholar] [CrossRef]
- Patil, D.P.; Parekh, B.K. Beneficiation of Fine Coal Using the Air Table. Int. J. Coal Prep. Util. 2011, 31, 203–222. [Google Scholar] [CrossRef]
- Jambal, D.; Kim, B.-G.; Lee, J.-H.; Davaatseren, G.; Bazarragchaa, M. Dry Coal Preparation of Fine Particles by KAT Process. In Proceedings of the XVIII International Coal Preparation Congress, Saint Petersburg, Russia, 28 June–1 July 2016. [Google Scholar] [CrossRef]
- Jambal, D.; Kim, B.G.; Jeon, H.S. Dry beneficiation of coal on KAT air table. Int. J. Coal Prep. Util. 2020, 1–13. [Google Scholar] [CrossRef]
- Gupta, N. Evaluation of pneumatic inclined deck separator for high-ash Indian coals. Int. J. Coal Sci. Technol. 2016, 3, 198–205. [Google Scholar] [CrossRef] [Green Version]
- Honaker, R.Q.; Saracoglu, M.; Thompson, E.; Bratton, R.; Luttrell, G.H.; Richardson, V. Upgrading coal using a pneumatic density-based separator. Int. J. Coal Prep. Util. 2008, 28, 51–67. [Google Scholar] [CrossRef]
- Blaschke, W.S.; Szafarczyk, J.; Baic, I.; Sobko, W. A study of the deshaling of Polish hard coal using an FGX unit type of Air Concentrating Table. In Proceedings of the XVIII International Coal Preparation Congress, Saint Petersburg, Russia, 28 June–1 July 2016. [Google Scholar] [CrossRef]
- Xuliang, Y.; Yuemin, Z.; Gongmin, L.; Zhenfu, L.; Zengqiang, C.; Chuncheng, L. Establishment and Evaluation of a United Dry Coal Beneficiation System. Int. J. Coal Prep. Util. 2012, 32, 95–102. [Google Scholar] [CrossRef]
- Dong, L.; Wang, Z.; Zhou, E.; Wang, X.; Li, G.; Fan, X.; Zhang, B.; Duan, C.; Chen, Z.; Luo, Z.; et al. A novel dry beneficiation process for coal. Int. J. Coal Prep. Util. 2019, 1–21. [Google Scholar] [CrossRef]
- Özbakir, O.; Koltka, S.; Sabah, E. Modeling and optimization of fine coal beneficiation by hydrocyclone and multi-gravity separation to produce fine lignite clean coal. Part. Sci. Technol. 2017, 35, 712–722. [Google Scholar] [CrossRef]
- Majumder, A.K.; Barnwal, J.P. Modelling of enhanced gravity concentrators-present status. Miner. Process. Extr. Metall. Rev. 2006, 27, 61–86. [Google Scholar] [CrossRef]
- Öney, Ö.; Tanriverdi, M. Optimization and modeling of fine coal beneficiation by Knelson concentrator using central composite design (CCD). J. Ore Dressing 2012, 14, 11. [Google Scholar]
- Gupta, N.; Luttrell, G.H.; Bratton, R.C. Statistical optimization of dry deshaling for Indian coals using response surface methodology. Int. J. Coal Prep. Util. 2016, 36, 125–138. [Google Scholar] [CrossRef]
- Wang, Q.; Feng, Y.; Lu, J.; Yin, W.; Yang, H.; Witt, P.J.; Zhang, M. Numerical study of particle segregation in a coal beneficiation fluidized bed by a TFM–DEM hybrid model: Influence of coal particle size and density. Chem. Eng. J. 2015, 260, 240–257. [Google Scholar] [CrossRef]
- Mijał, W.; Niedoba, T.; Polek, D. Mathematical model of dry coal deshaling by using FGX vibrating air table. In IOP Conference Series: Materials Science and Engineering, Proceedings of the Mineral Engineering Conference, Kocierz, Poland, 2019; IOP Publishing: Bristol, UK, 2019. [Google Scholar] [CrossRef]
- Meyer, E.J.; Craig, I.K. Dynamic Modelling for Dense Medium Separation in Coal Beneficiation. IFAC Proc. Vol. 2010, 43, 37–43. [Google Scholar] [CrossRef]
- Zhou, C.; Dong, L.; Zhao, Y.; Fan, X. Studies on Bed Density in a Gas-Vibro Fluidized Bed for Coal Cleaning. ACS Omega 2019, 4, 12817–12826. [Google Scholar] [CrossRef] [Green Version]
- Zhao, Y.; Tang, L.; Luo, Z.; Liang, C.; Xing, H.; Wu, W.; Duan, C. Experimental and numerical simulation studies of the fluidization characteristics of a separating gas–solid fluidized bed. Fuel Process. Technol. 2010, 91, 1819–1825. [Google Scholar] [CrossRef]
- Tang, L. Characteristics of fluidization and dry-beneficiation of a wide-size-range medium-solids fluidized bed. Int. J. Min. Sci. Technol. 2017, 27, 467–471. [Google Scholar] [CrossRef]
- Zhang, Y.; Jia, Y.; Xu, J.; Wang, J.; Duan, C.; Ge, W.; Zhao, Y. CFD intensification of coal beneficiation process in gas-solid fluidized beds. Chem. Eng. Process. Process Intensif. 2020, 148. [Google Scholar] [CrossRef]
- Stańczyk, K.; Bajerski, A.; Łączny, M.J. Negative-Pressure Pneumatic Separator: A New Solution for Hard-Coal Beneficiation; Datasets and Supplementary Materials. Available online: https://data.mendeley.com/datasets/57f28ph87t/1 (accessed on 6 July 2020).
- Joint Committee for Guides in Metrology. Evaluation of measurement data—Guide to the expression of uncertainty in measurement. JCGM 2008, 100, 1–116. [Google Scholar]
- Klonecki, W. Statystyka dla Inżynierów (Statistics for Engineers); Wydawnictwo Naukowe PWN: Warszawa, Poland, 2008. [Google Scholar]
- Wikipedia. Available online: https://en.wikipedia.org/wiki/Z-test (accessed on 27 July 2020).
- Geoff Edwards. Understanding the Basic Fan Laws. Available online: https://www.axair-fans.co.uk/news/applications/understanding-basic-fan-laws/ (accessed on 22 January 2018).
- Rockwell Automation. Energy Savings with Adjustable Frequency Drives for Centrifugal Fans. Rockwell Automation, Milwaukee, USA. 2014. Available online: http://www.infinair.com/product/industrial-centrifugal-fan/?gclid=CjwKCAjw_NX7BRA1EiwA2dpg0qhDTNmkwMlZF4Uk7FLOkhQzrZ8uRfVI2brithaQ6JHLzpuhiwMoFhoCCqUQAvD_BwE (accessed on 7 May 2020).
- Robinson, P.E.; Keith, D. The System Curve, the Fan Curve, and the Operating Point; Plant Engineering Consultants: Colorado Springs, CO, USA, 2018. [Google Scholar]
- Gralec, M. Excerpt from the Article Entitled Fans in Air Exchange Systems. Available online: https://translate.google.com/translate?hl=en&sl=pl&u=https://www.hvacr.pl/dobor-wentylatora-praktyczne-wskazowki-219&prev=search&pto=aue (accessed on 22 March 2020).
- Dwyer, T. Module 34: Matching the Fan to the Ventilation System. Available online: https://www.cibsejournal.com/cpd/modules/2011-11/ (accessed on 17 April 2020).
- Blaschke, W. Przeróbka Węgla Kamiennego—Wzbogacanie Grawitacyjne (Hard Coal Preparation—Gravitational Beneficiation); Instytut Gospodarki Surowcami Mineralnymi i Energią PAN: Józefa Wybickiego, Kraków, Poland, 2009. [Google Scholar]
- Drzymała, J. Podstawy Mineralurgii; Oficyna Wydawnicza Politechniki Wrocławskiej: Wrocław, Poland, 2009. [Google Scholar]
- Cengel, Y.A.; Cimbala, J.M. Fluid Mechanics—Fundamentals and Applications, 4th ed.; McGraw-Hill Education: New York, NY, USA, 2018. [Google Scholar]
- NASA Glenn Research Center. The Drag Equation. Available online: https://www.grc.nasa.gov/WWW/K-12/airplane/drageq.html) (accessed on 13 April 2020).
- ANSYS FLUENT 12.0 Documentation. Available online: https://www.afs.enea.it/project/neptunius/docs/fluent/html/ug/main_pre.htm (accessed on 18 September 2018).
- Haider, A.; Levenspiel, O. Drag coefficient and terminal velocity of spherical and nonspherical particles. Powder Technol. 1989, 58, 63–70. [Google Scholar] [CrossRef]
- Jayanti, S. Computional Fluid Dynamics for Engineers and Scientists; Springer: Dordrecht, The Netherlands, 2018. [Google Scholar]
- Jaworski, Z. Numeryczna mechanika płynów w inżynierii chemicznej i procesowej (Computational Fluid Dynamics in Chemical and Process Engineering); EXIT: Warsaw, Poland, 2005; ISBN 9788387674960. [Google Scholar]
- El Hami, A.; Radi, B. Fluid-Structure Interactions and Uncertainties; ISTE Ltd.: London, UK, 2017. [Google Scholar]
- Markatos, N.C. The mathematical modelling of turbulent flows. Appl. Math. Model. 1986, 10, 190–220. [Google Scholar] [CrossRef]
- Tu, J.; Liu, C.H.; Yeoh, G.H. Computational Fluid Dynamics, 3rd ed.; Elsevier: Oxford, UK, 2019. [Google Scholar]
Figure 1.
Principle of the negative pressure pneumatic separator (NPPS) operation [26].
Figure 1.
Principle of the negative pressure pneumatic separator (NPPS) operation [26].
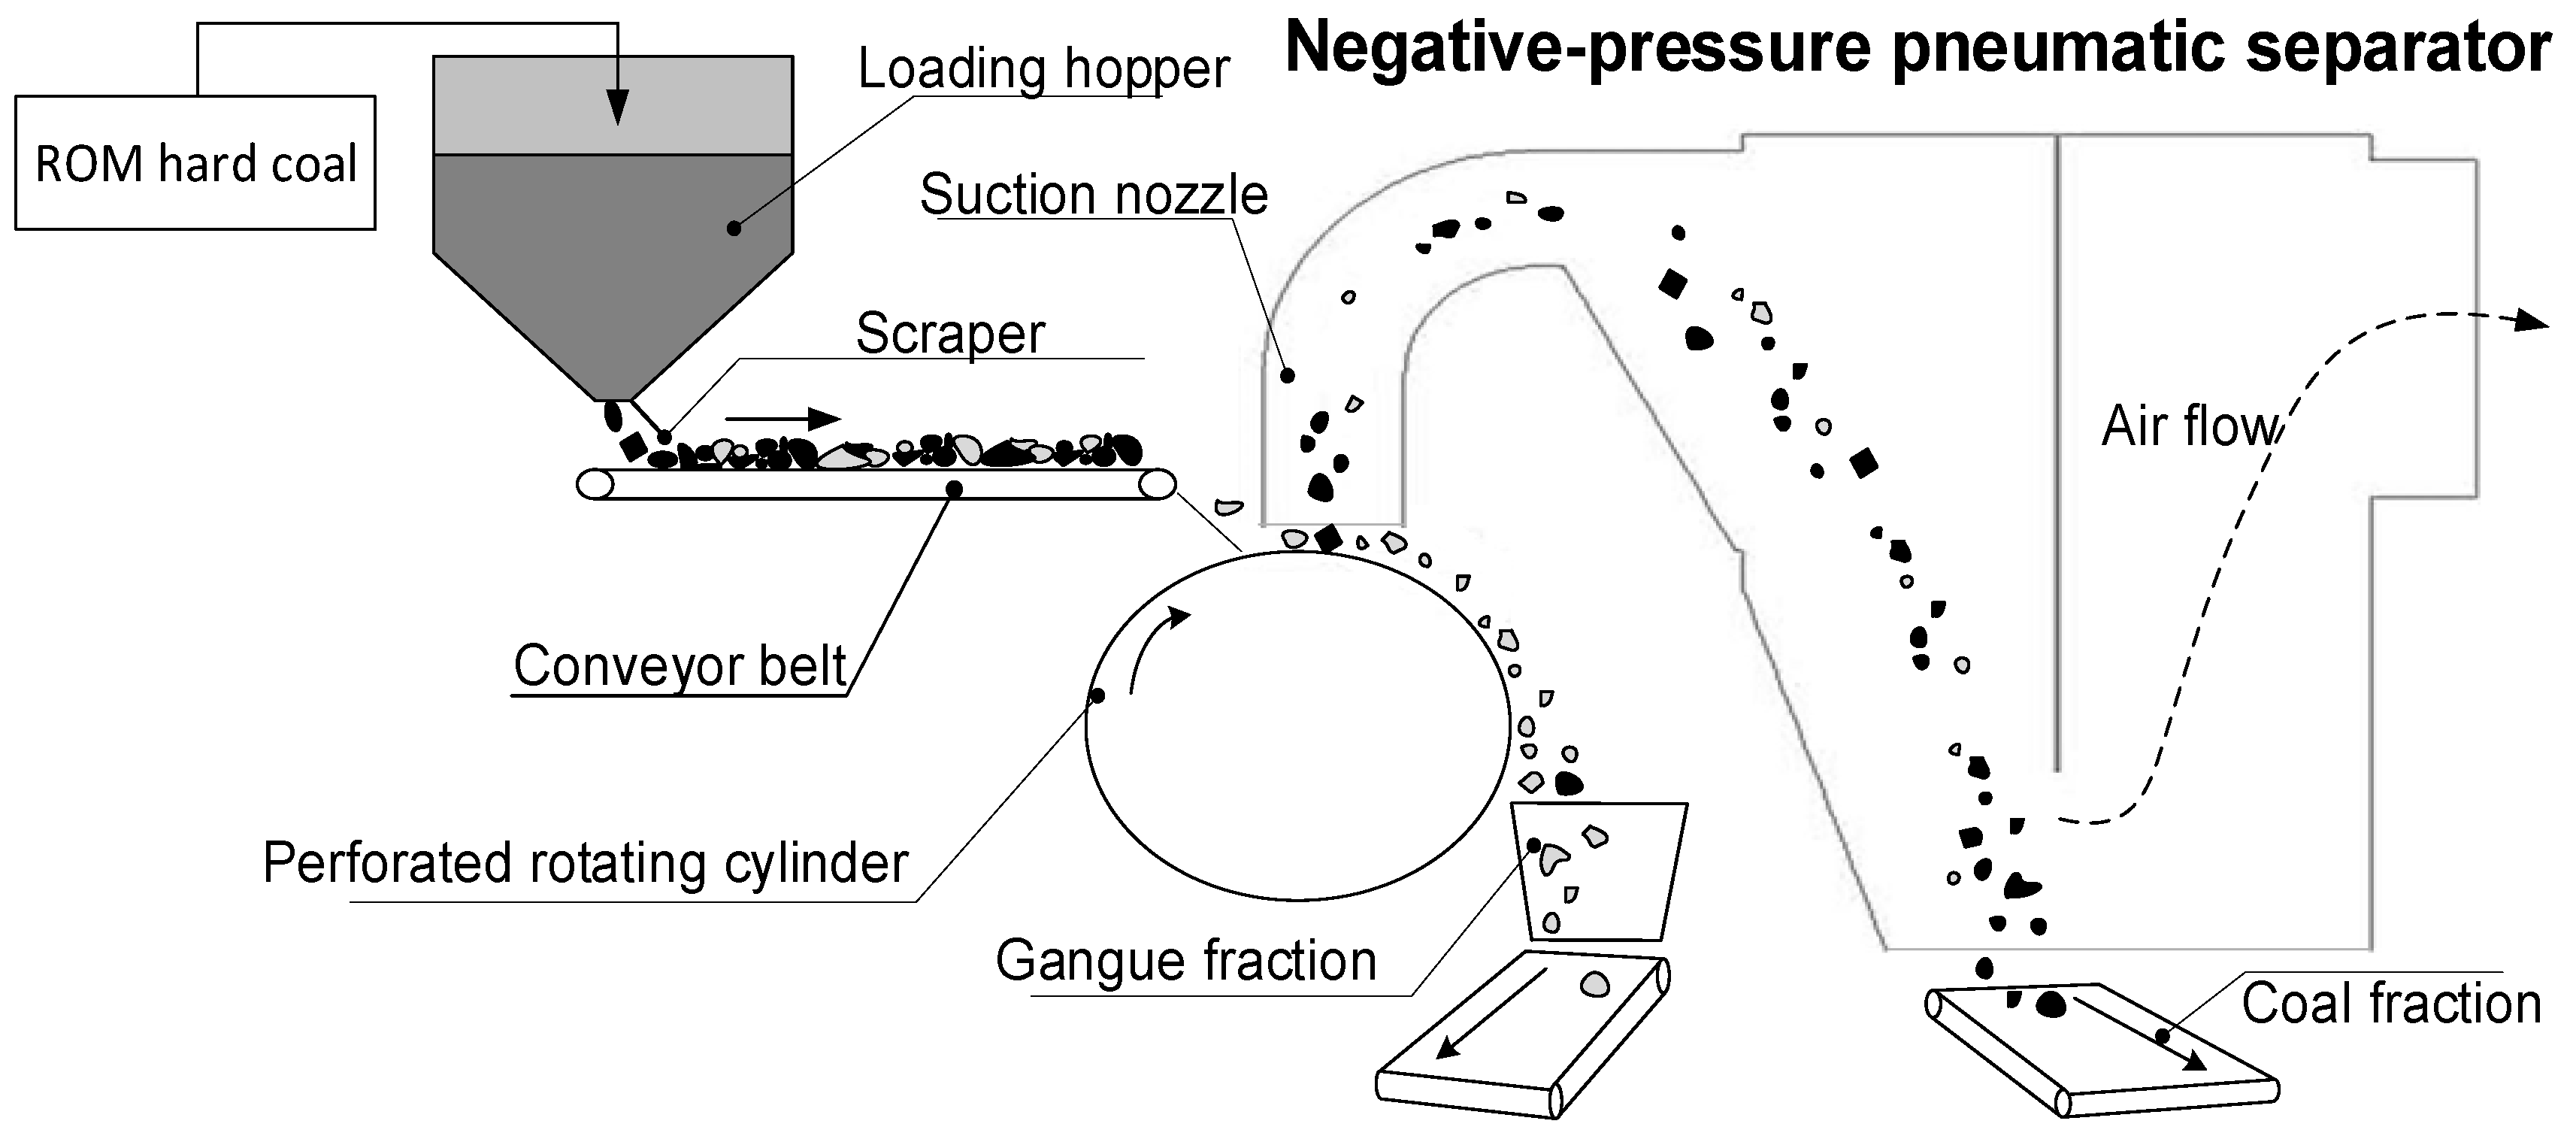
Figure 2.
Variable speed fan providing the operating point at the required flowrate (based on [53,54,55]).
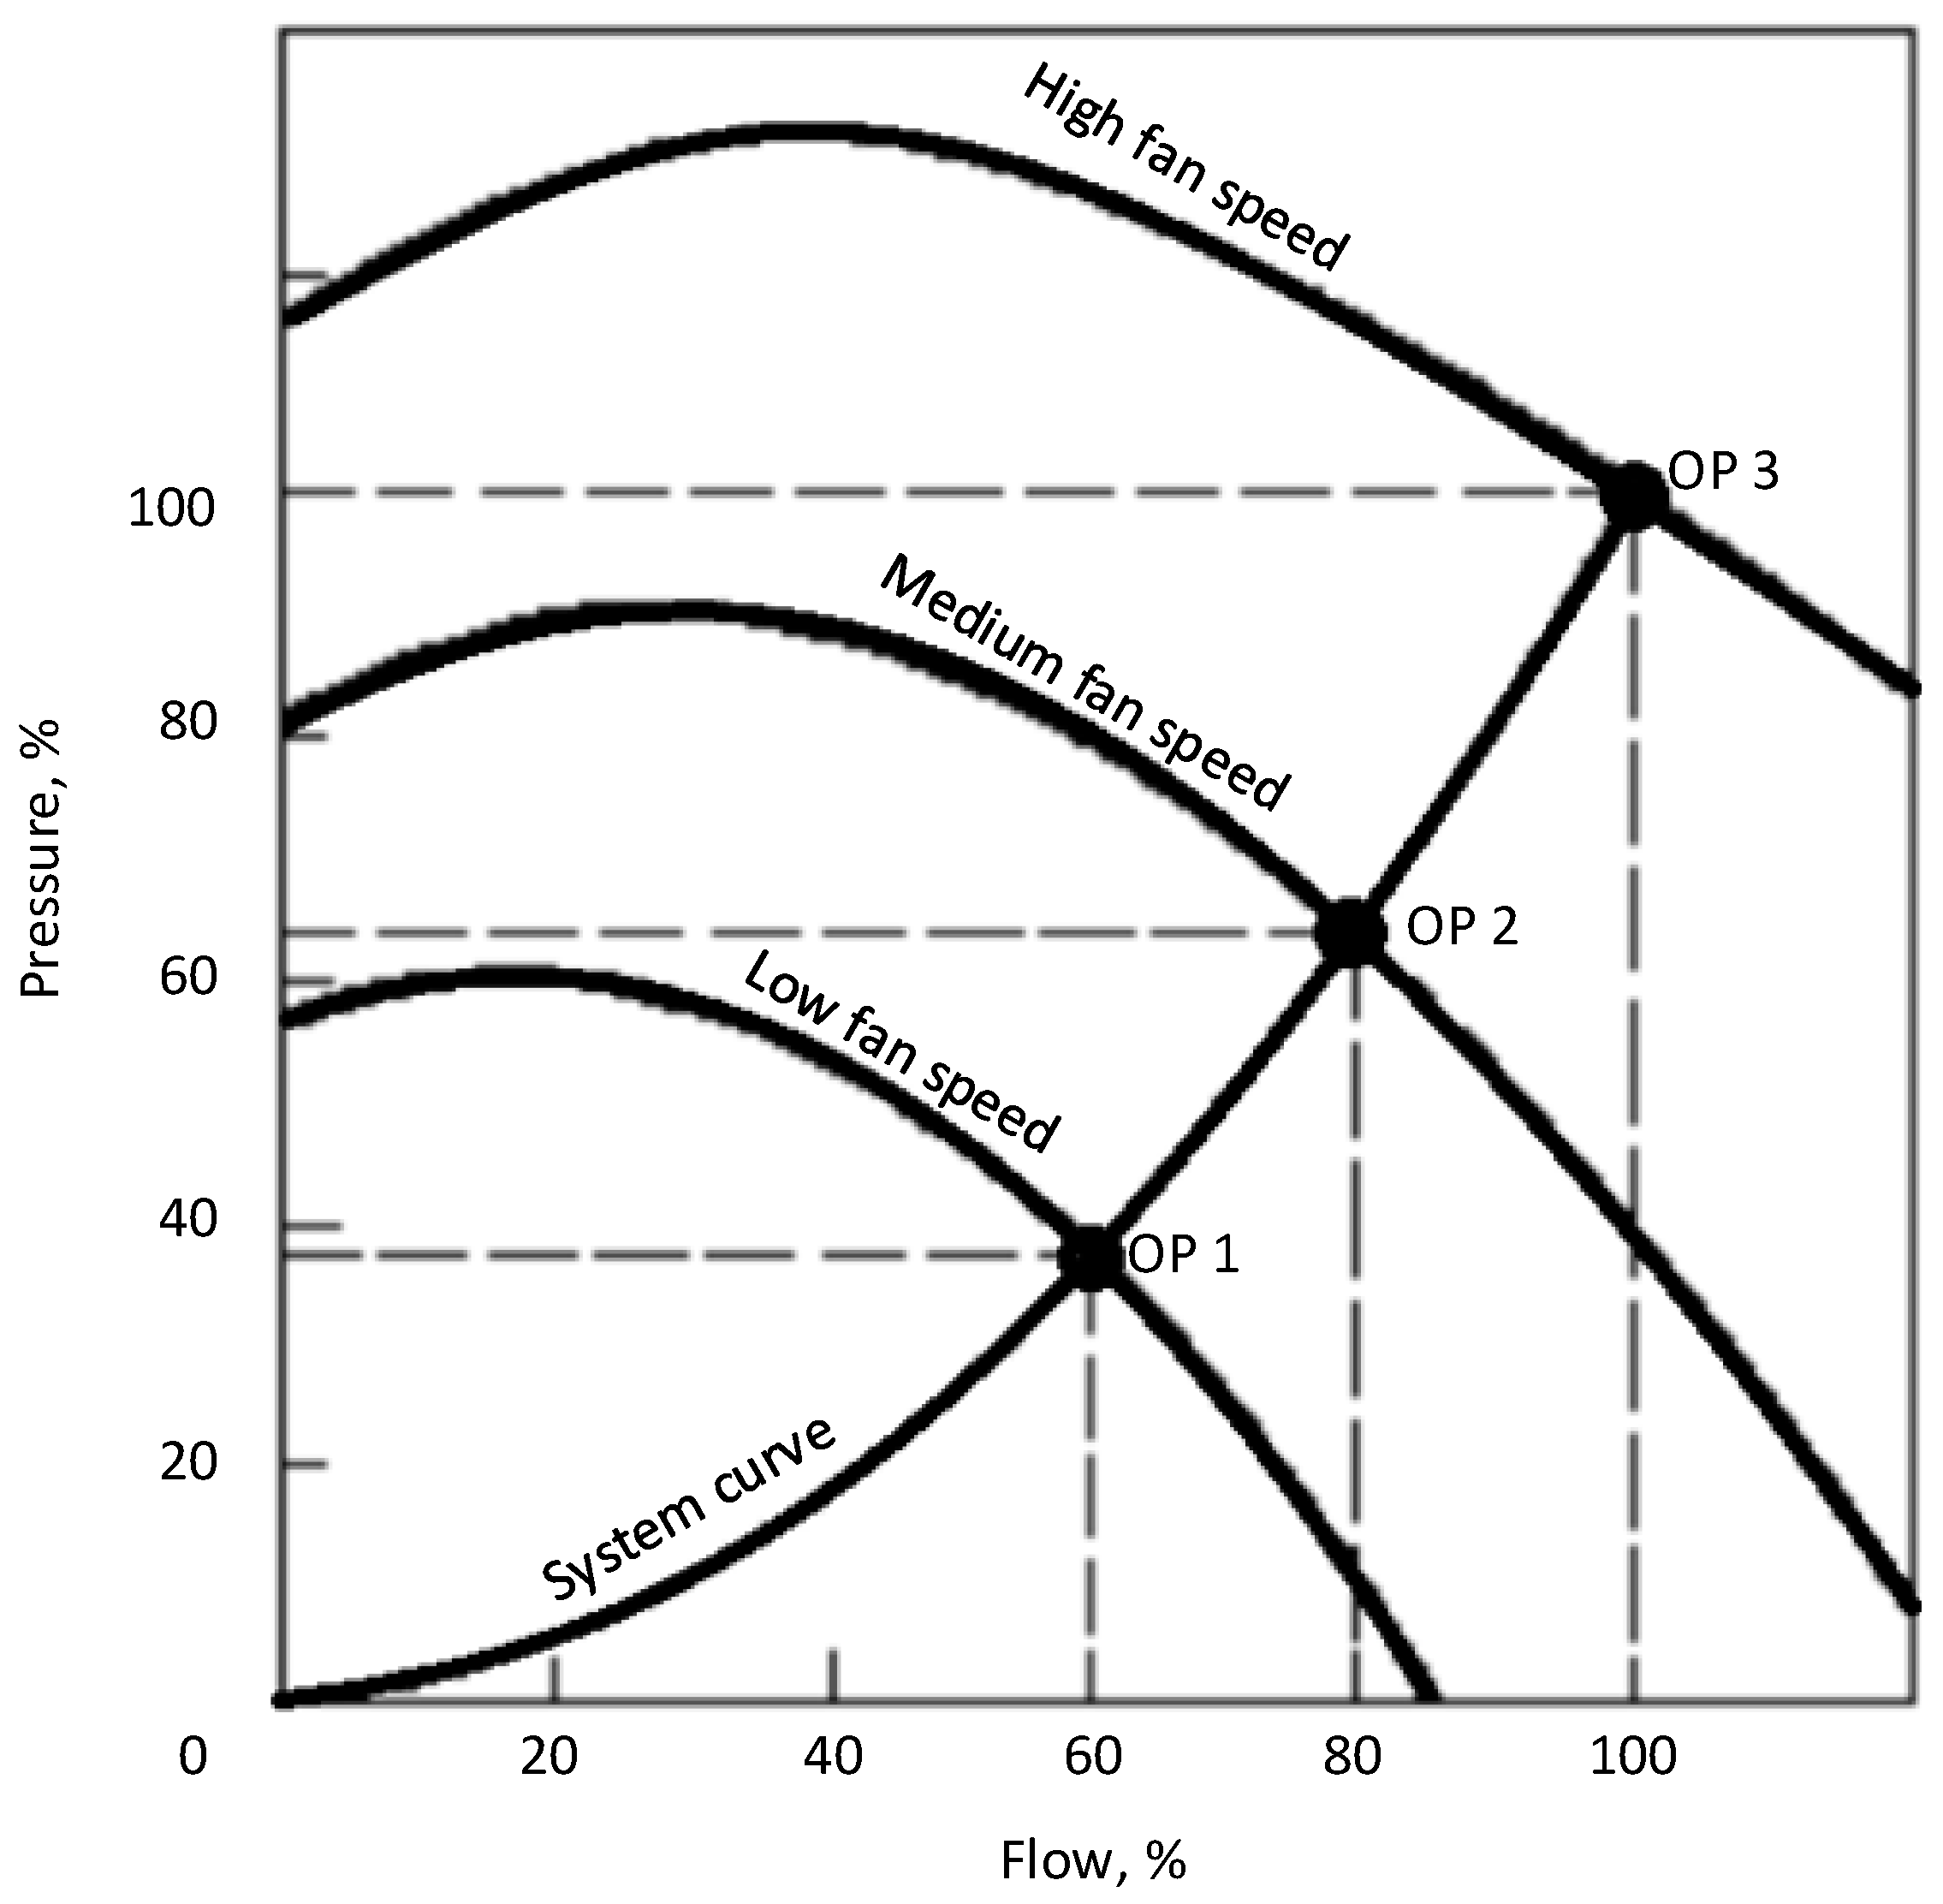
Figure 3.
Mayer graph, presenting ash yield in the relationship to product yield (based on [57]).
Figure 3.
Mayer graph, presenting ash yield in the relationship to product yield (based on [57]).
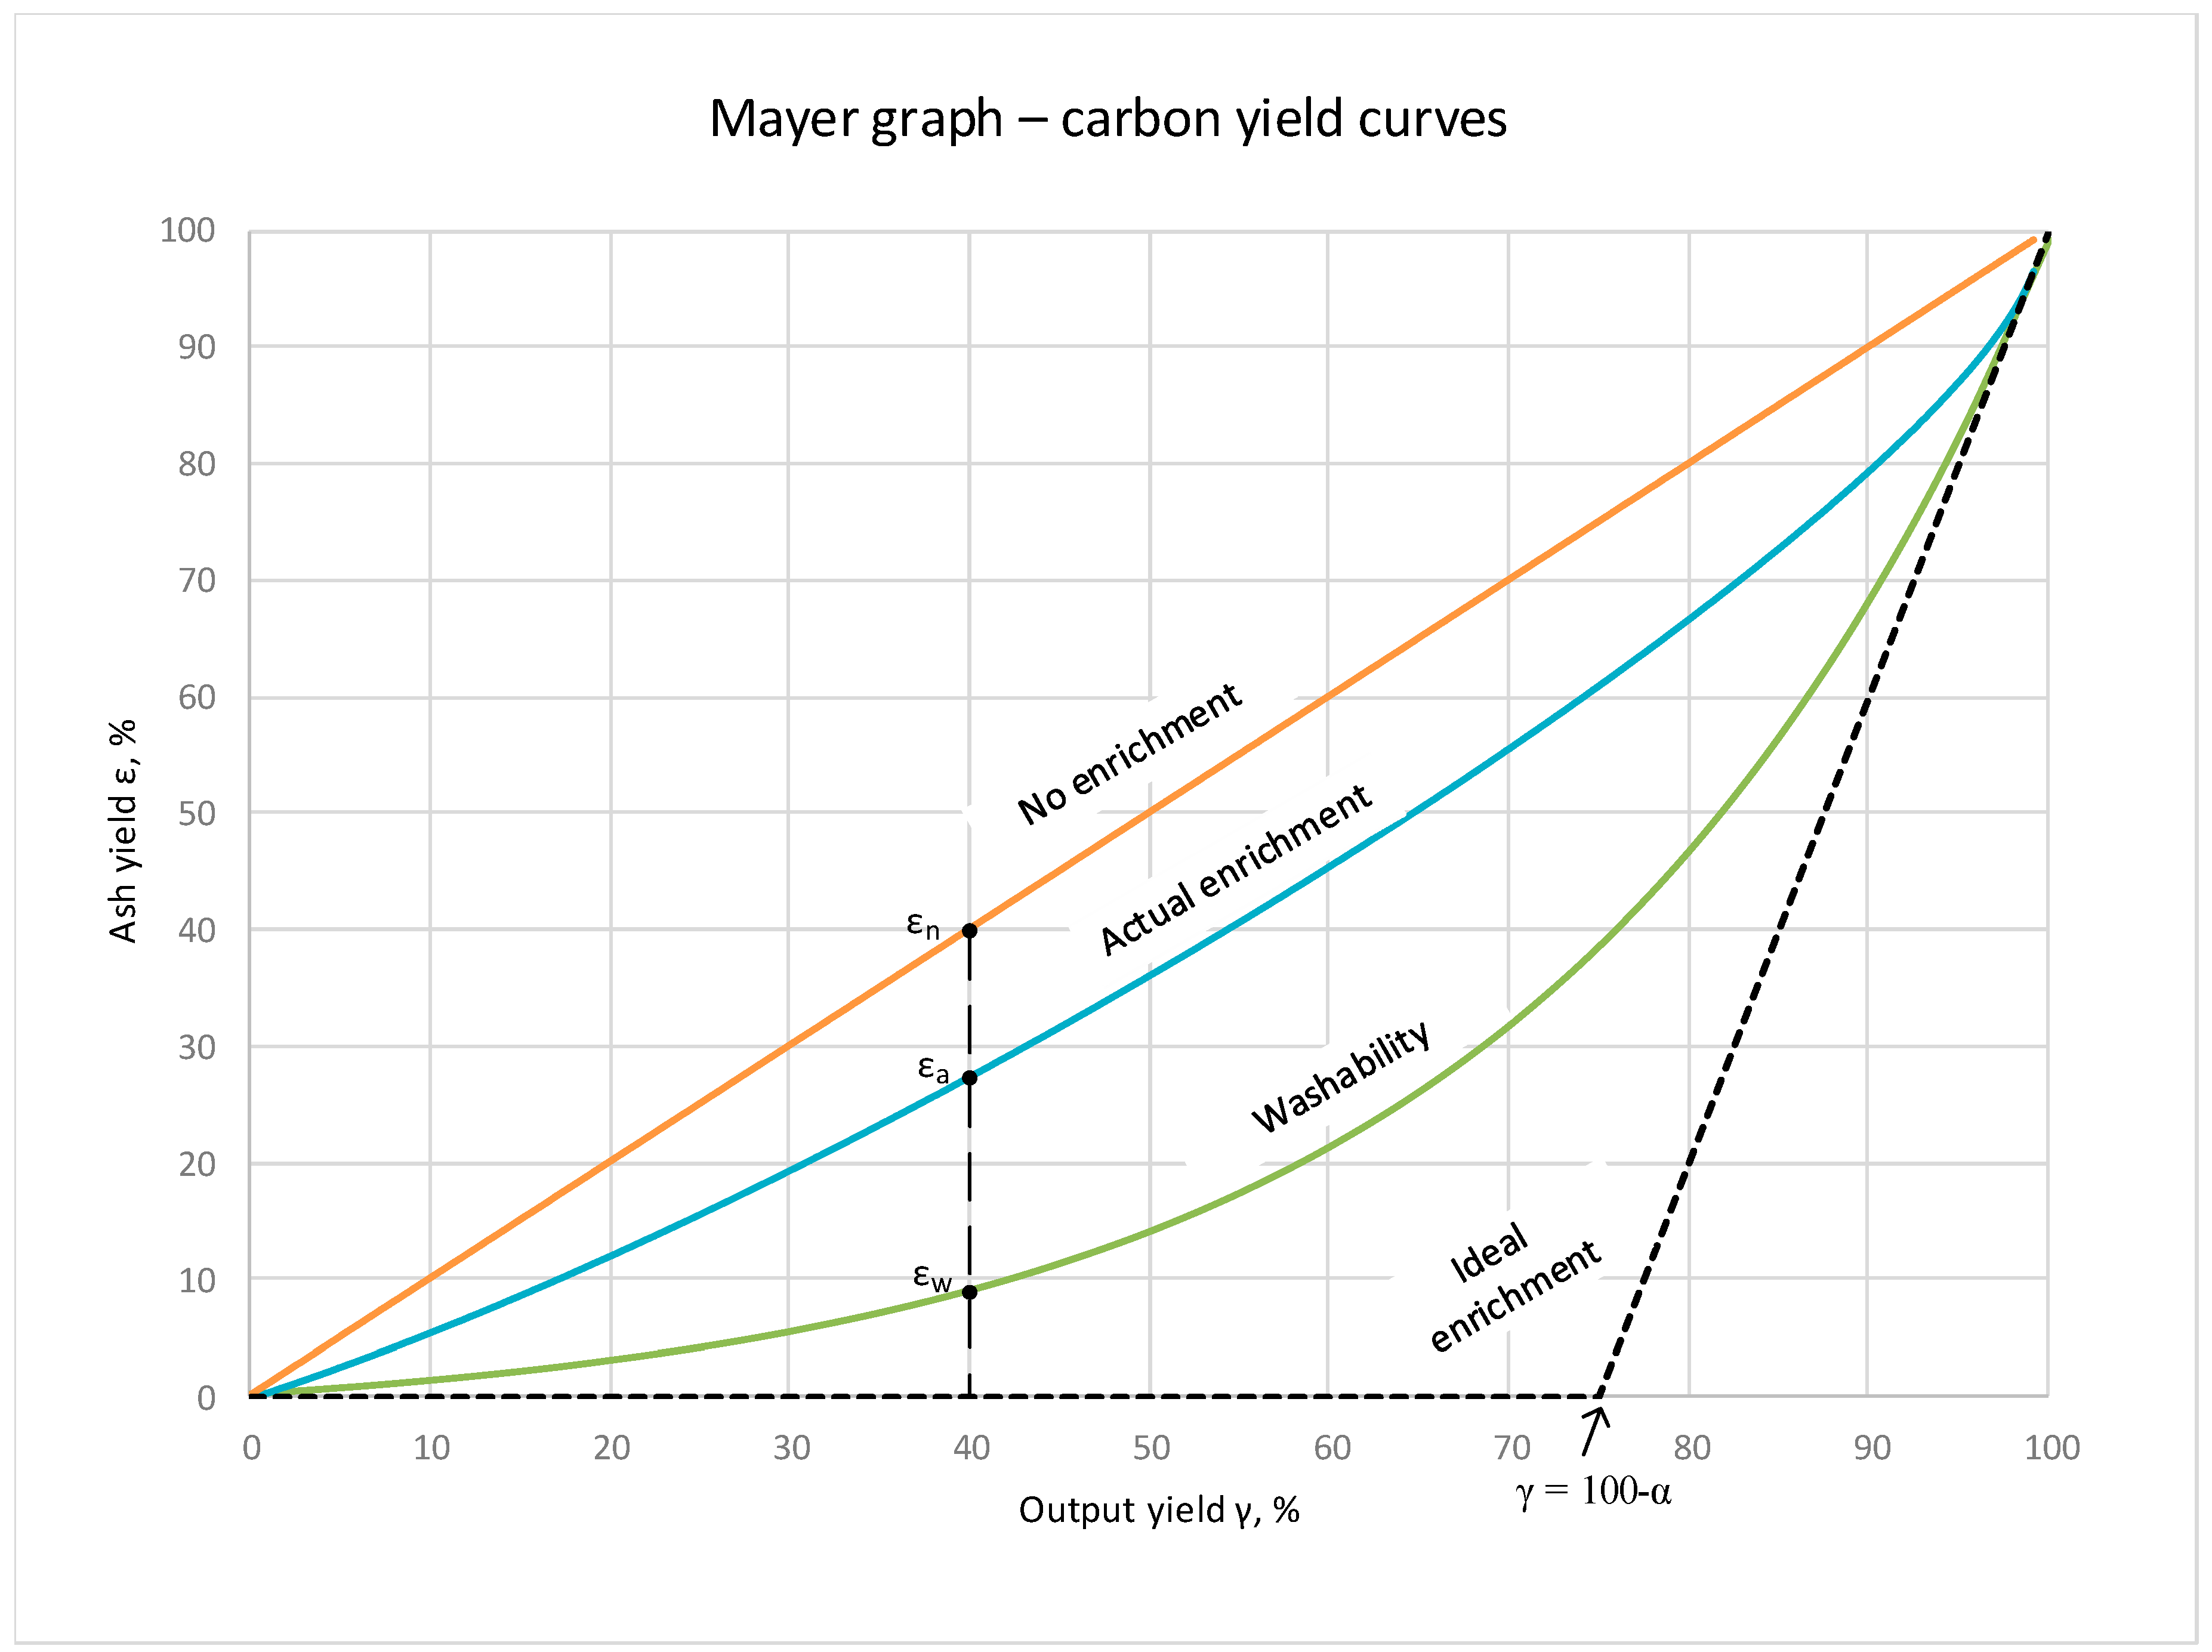
Figure 4.
Forces acting upon the grain in the suction zone: (a) before suction and (b) during suction.
Figure 4.
Forces acting upon the grain in the suction zone: (a) before suction and (b) during suction.

Figure 5.
The grid and boundary conditions of the NPPS numerical model.
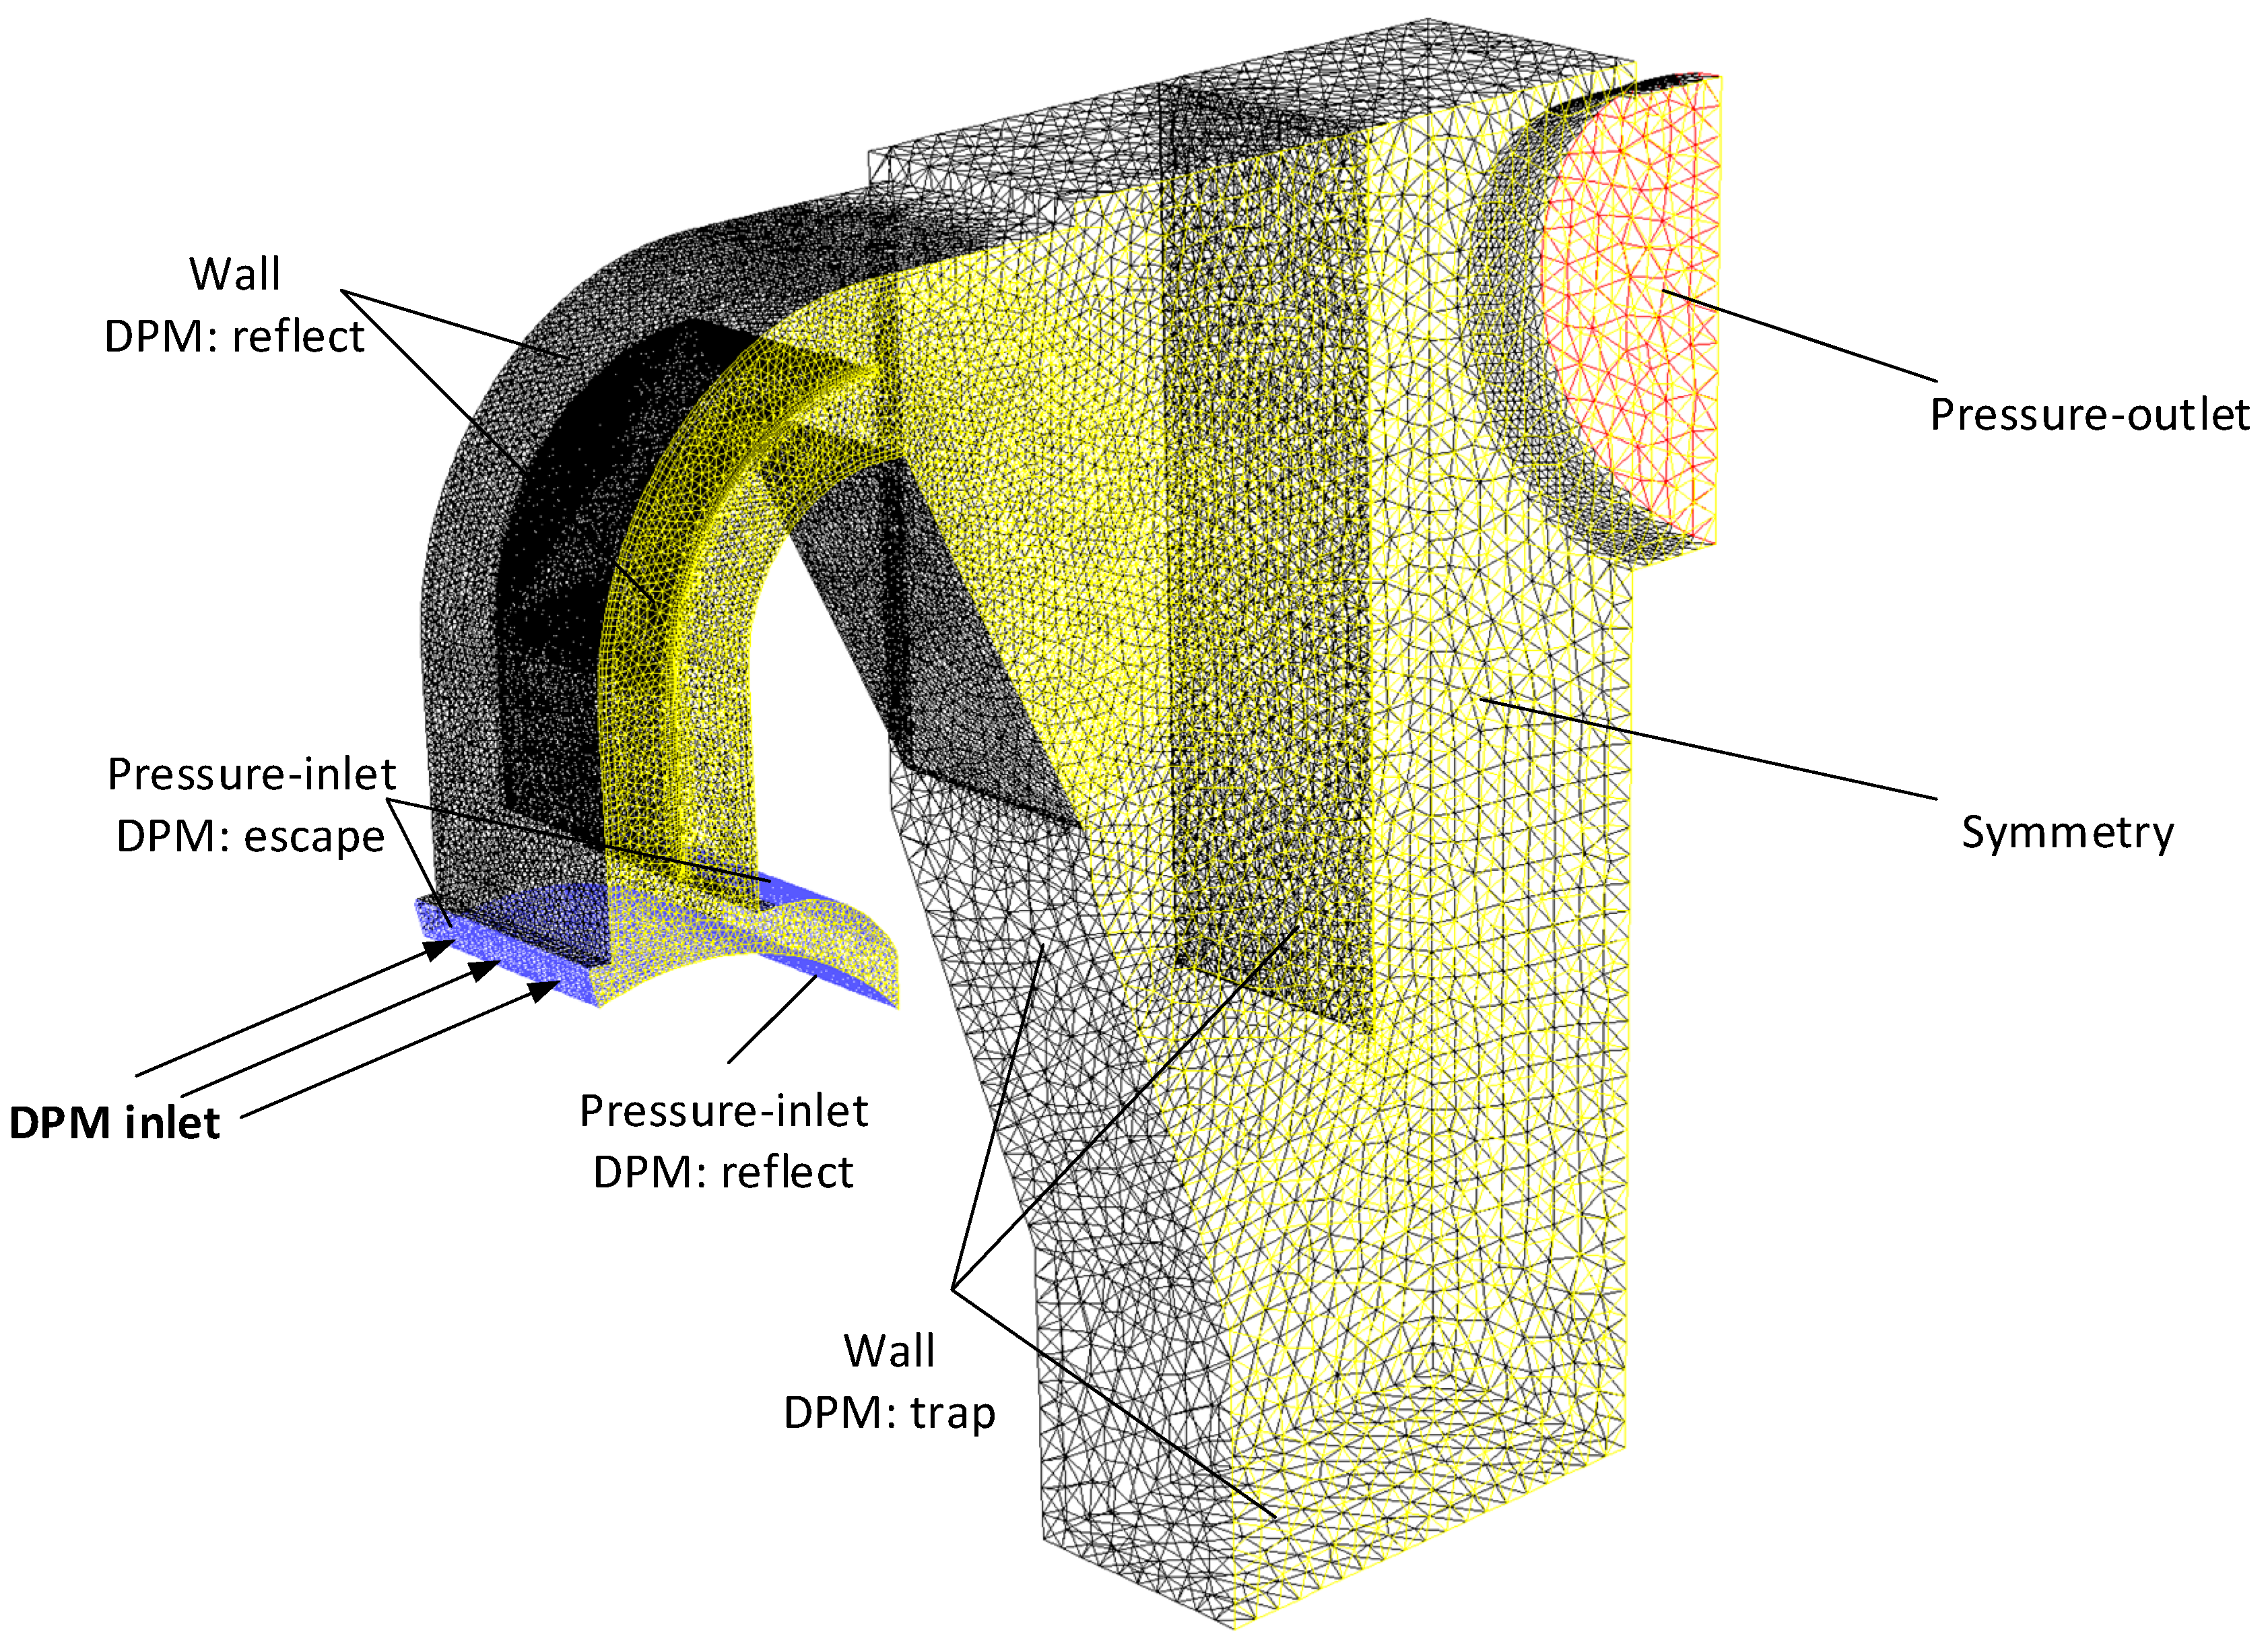
Figure 6.
Negative pressure measurements (Pa) carried out at a main fan frequency of 35 Hz.

Figure 7.
Air flow velocity in the suction zone and vacuum value at the separator outlet as functions of the main fan operating frequency.
Figure 7.
Air flow velocity in the suction zone and vacuum value at the separator outlet as functions of the main fan operating frequency.
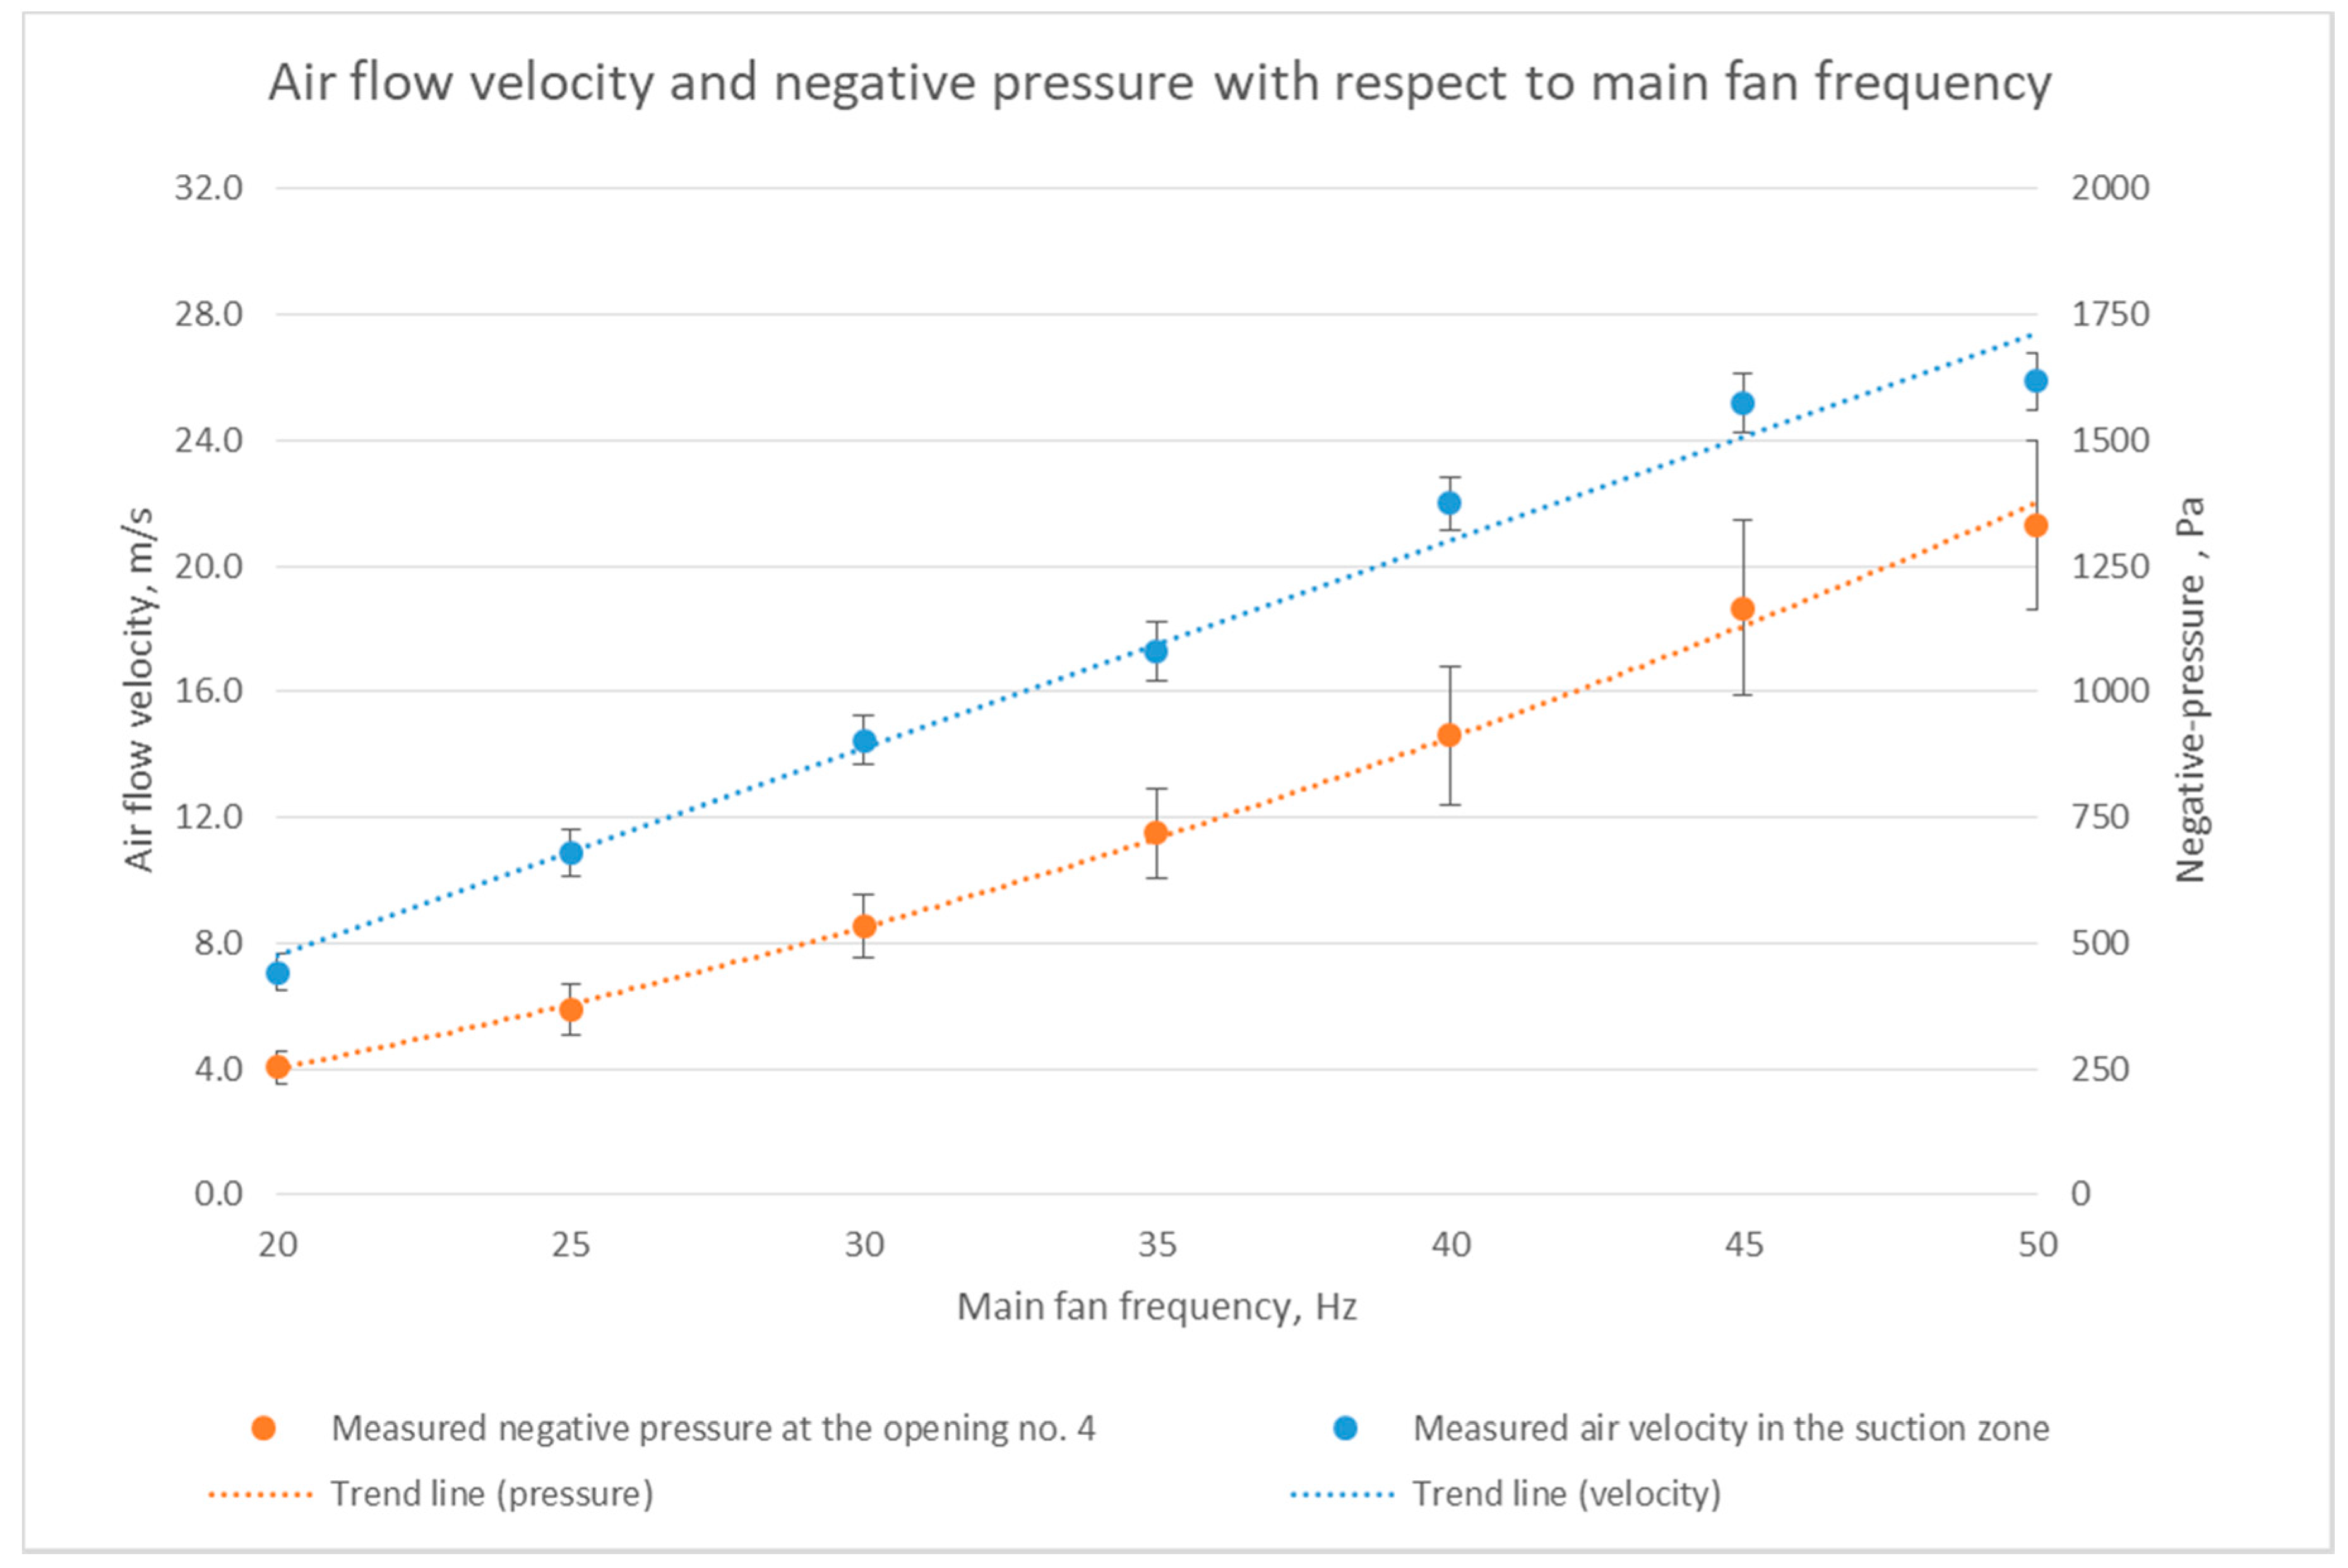
Figure 8.
Determined system curve of the utilised NPPS installation.
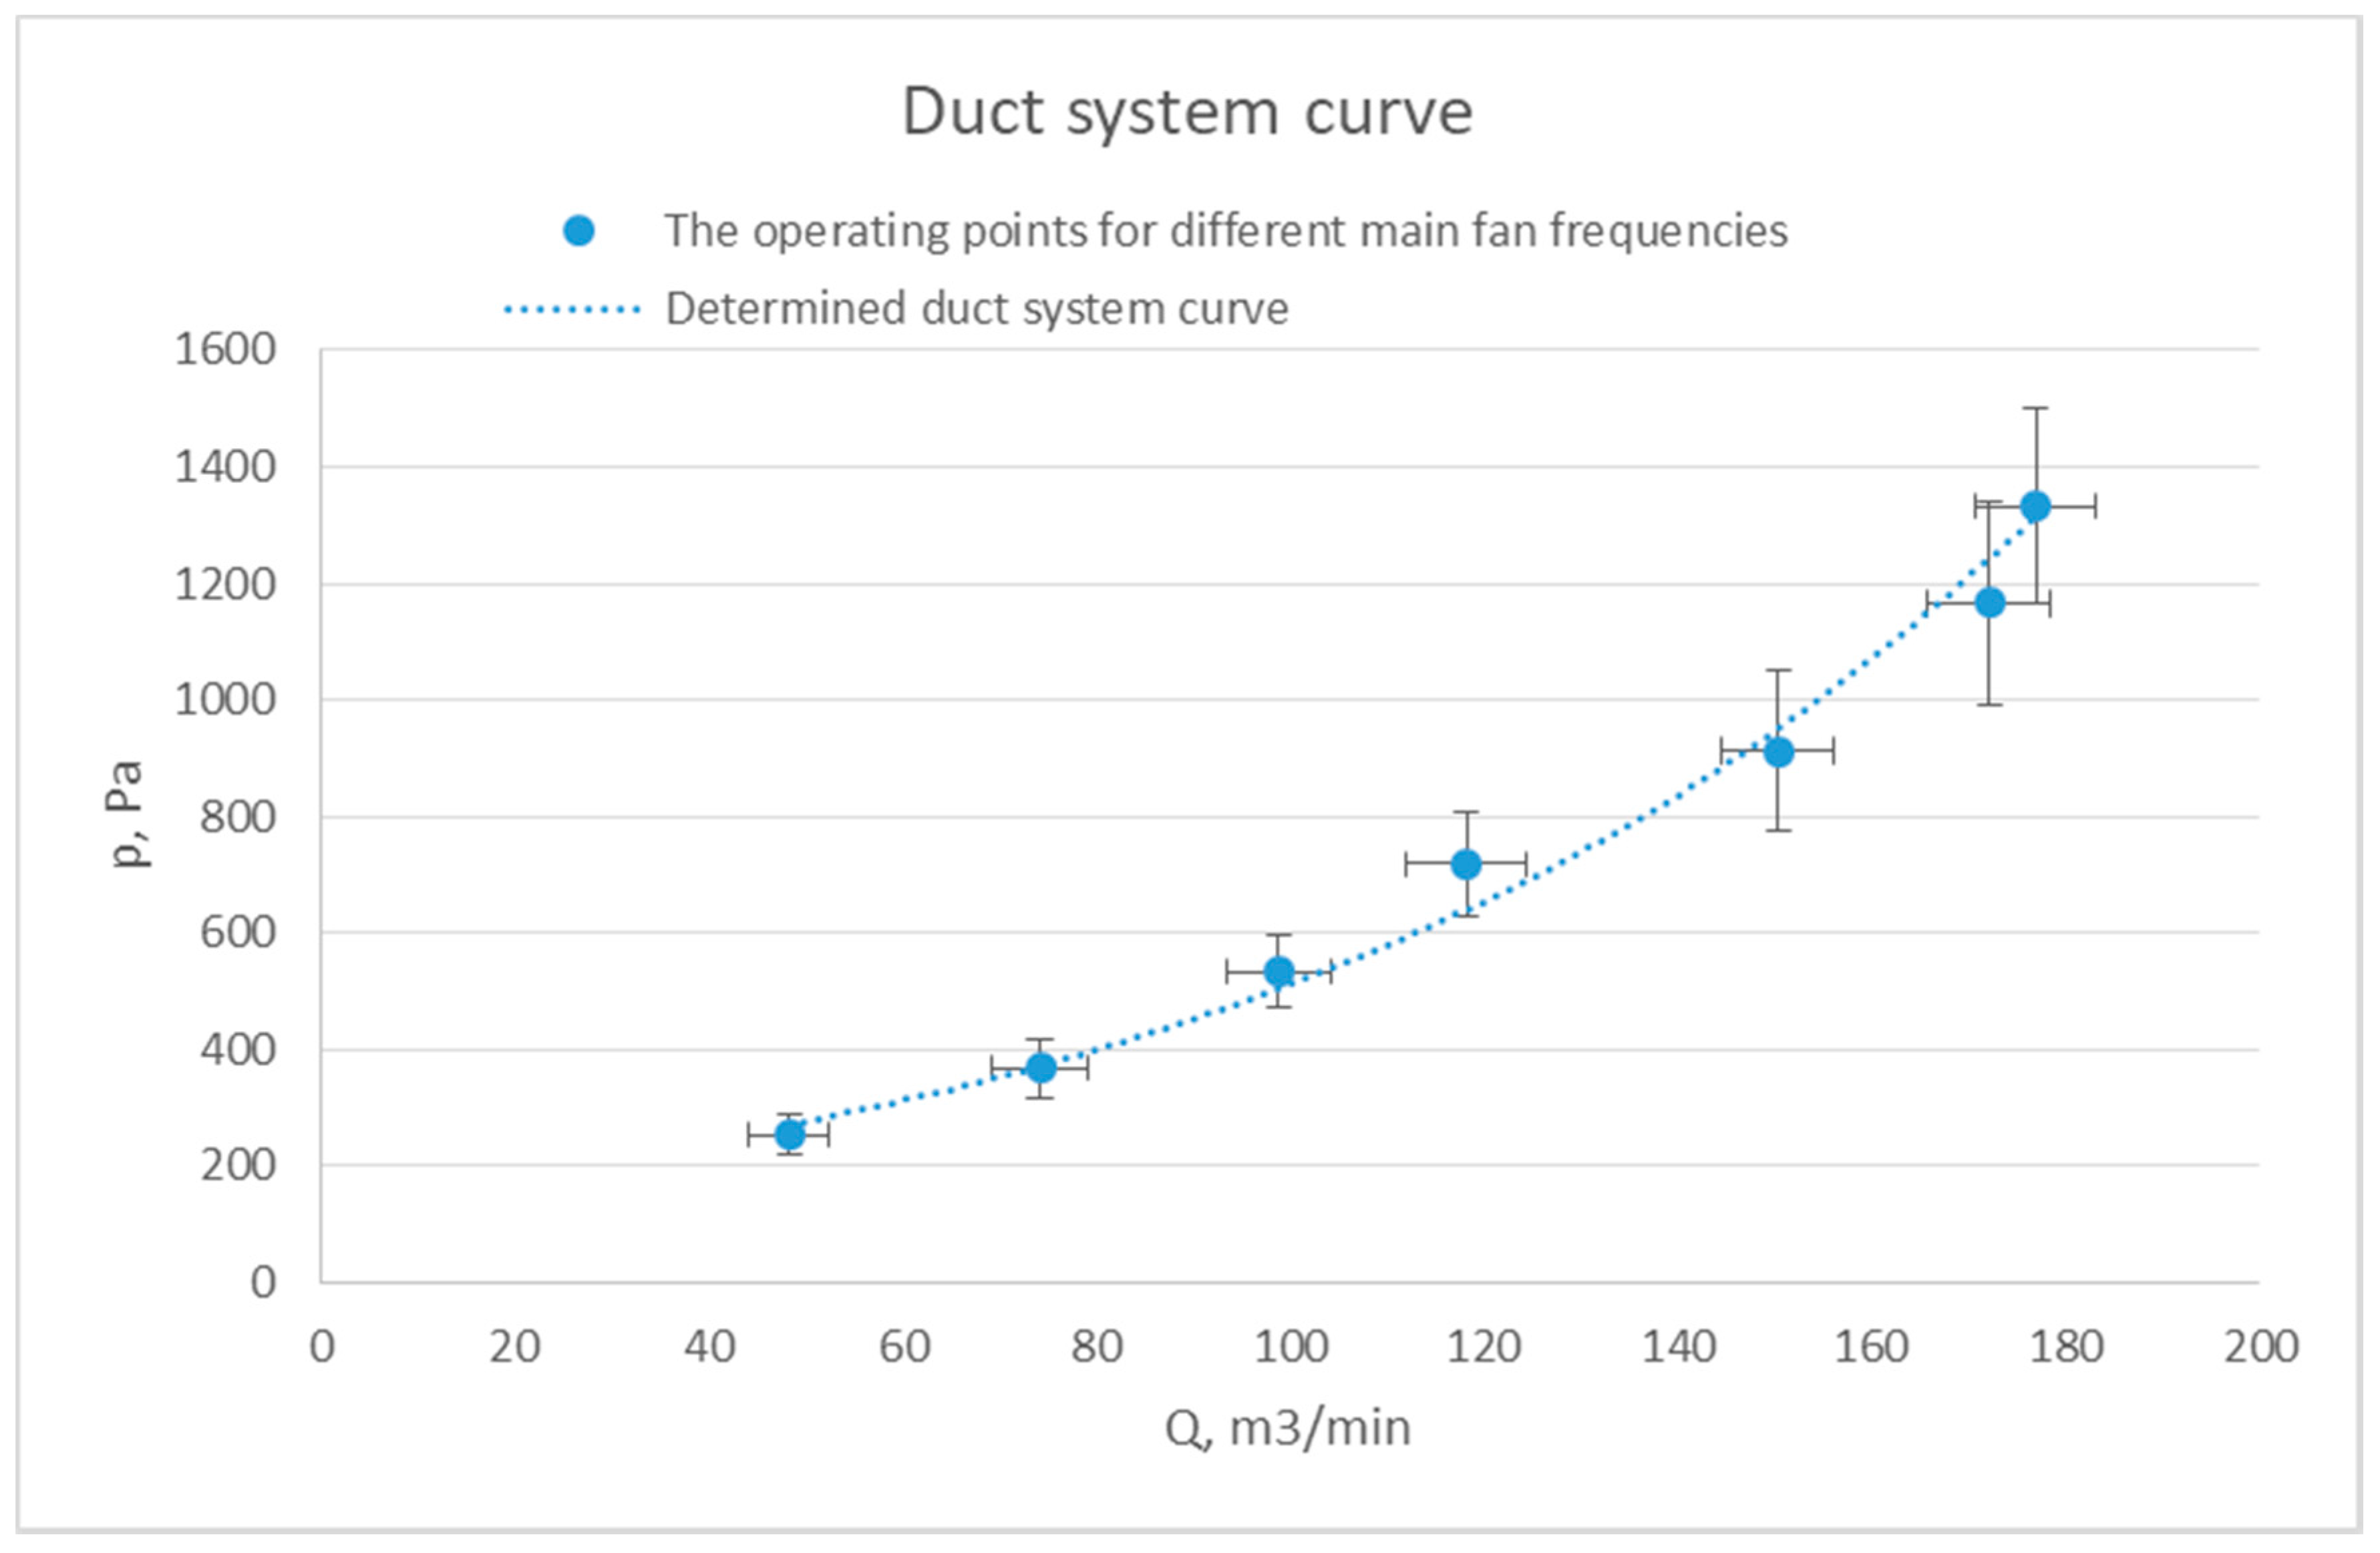
Figure 9.
Comparison of values obtained experimentally and calculated using the developed models—output yield and ash content in relationship to air flow velocity; feed material no. 1 (0–20 mm).
Figure 9.
Comparison of values obtained experimentally and calculated using the developed models—output yield and ash content in relationship to air flow velocity; feed material no. 1 (0–20 mm).
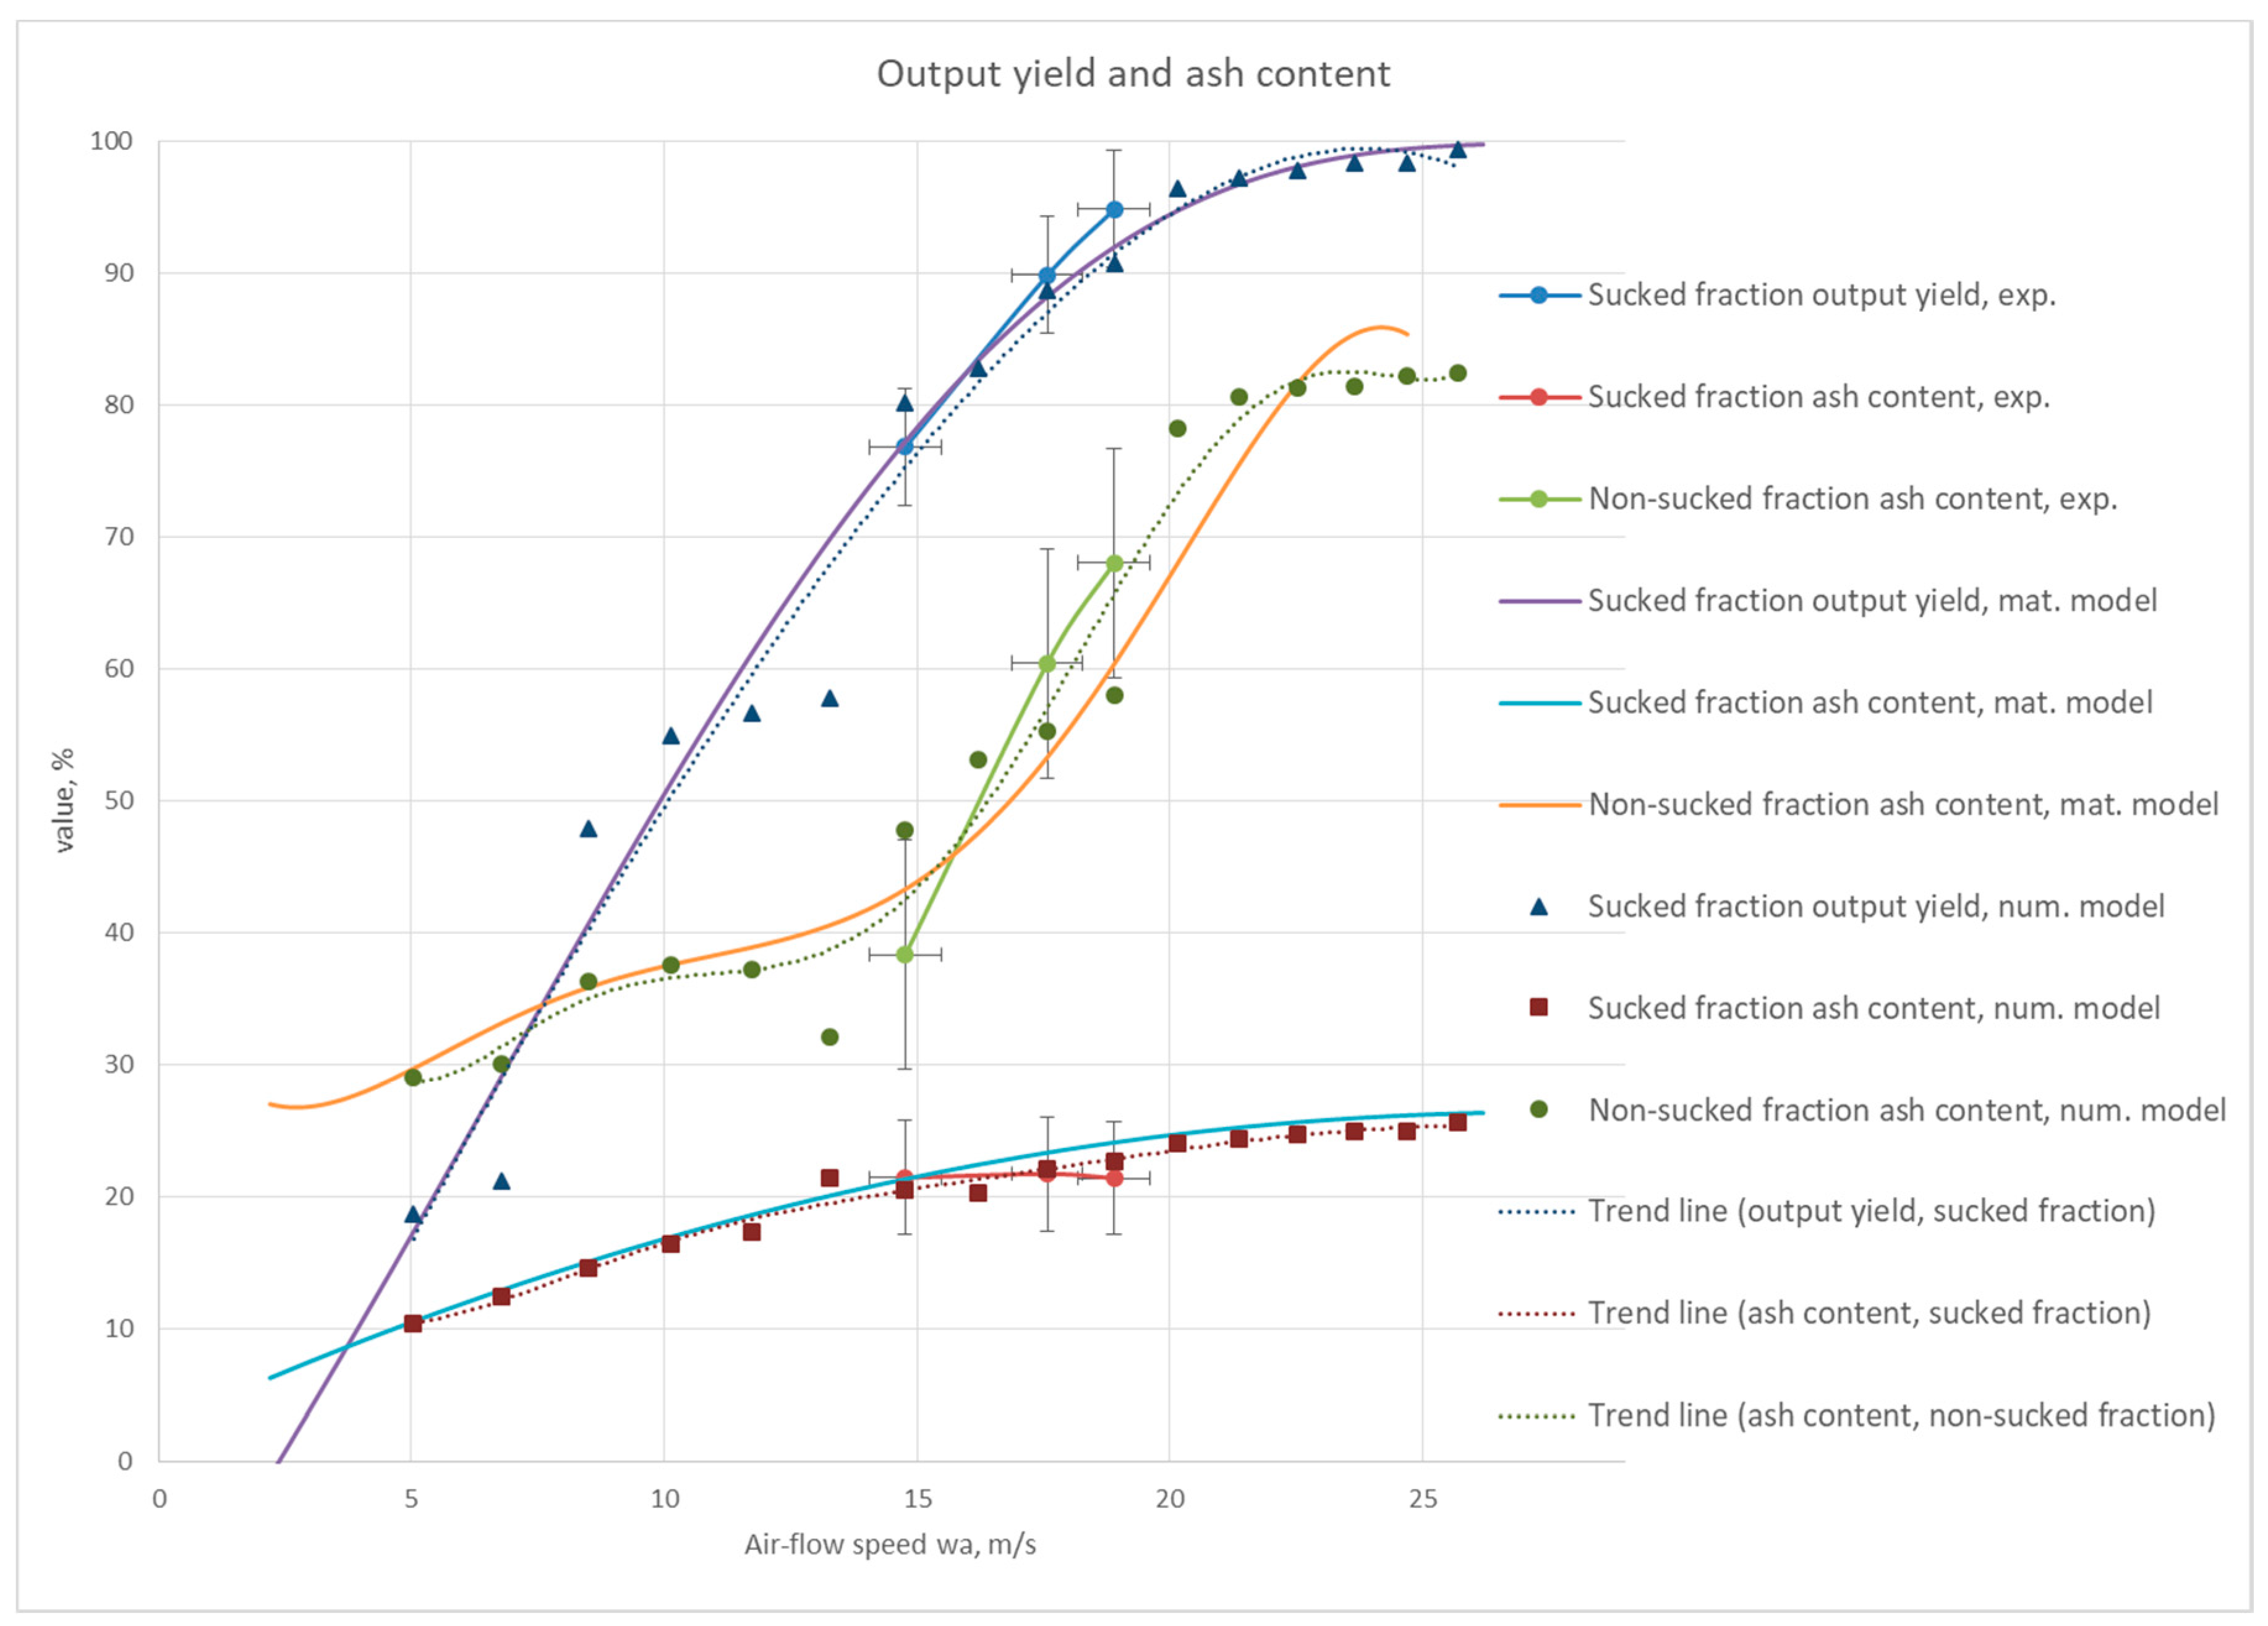
Figure 10.
Vectors of air velocity in the sorter symmetry plane (simulation of the main fan at 35 Hz).
Figure 10.
Vectors of air velocity in the sorter symmetry plane (simulation of the main fan at 35 Hz).

Figure 11.
Pressure profile in the sorter symmetry plane (simulation of the main fan at 35 Hz): (a) numerical model (gauge pressure) and (b) measured (negative pressure).
Figure 11.
Pressure profile in the sorter symmetry plane (simulation of the main fan at 35 Hz): (a) numerical model (gauge pressure) and (b) measured (negative pressure).
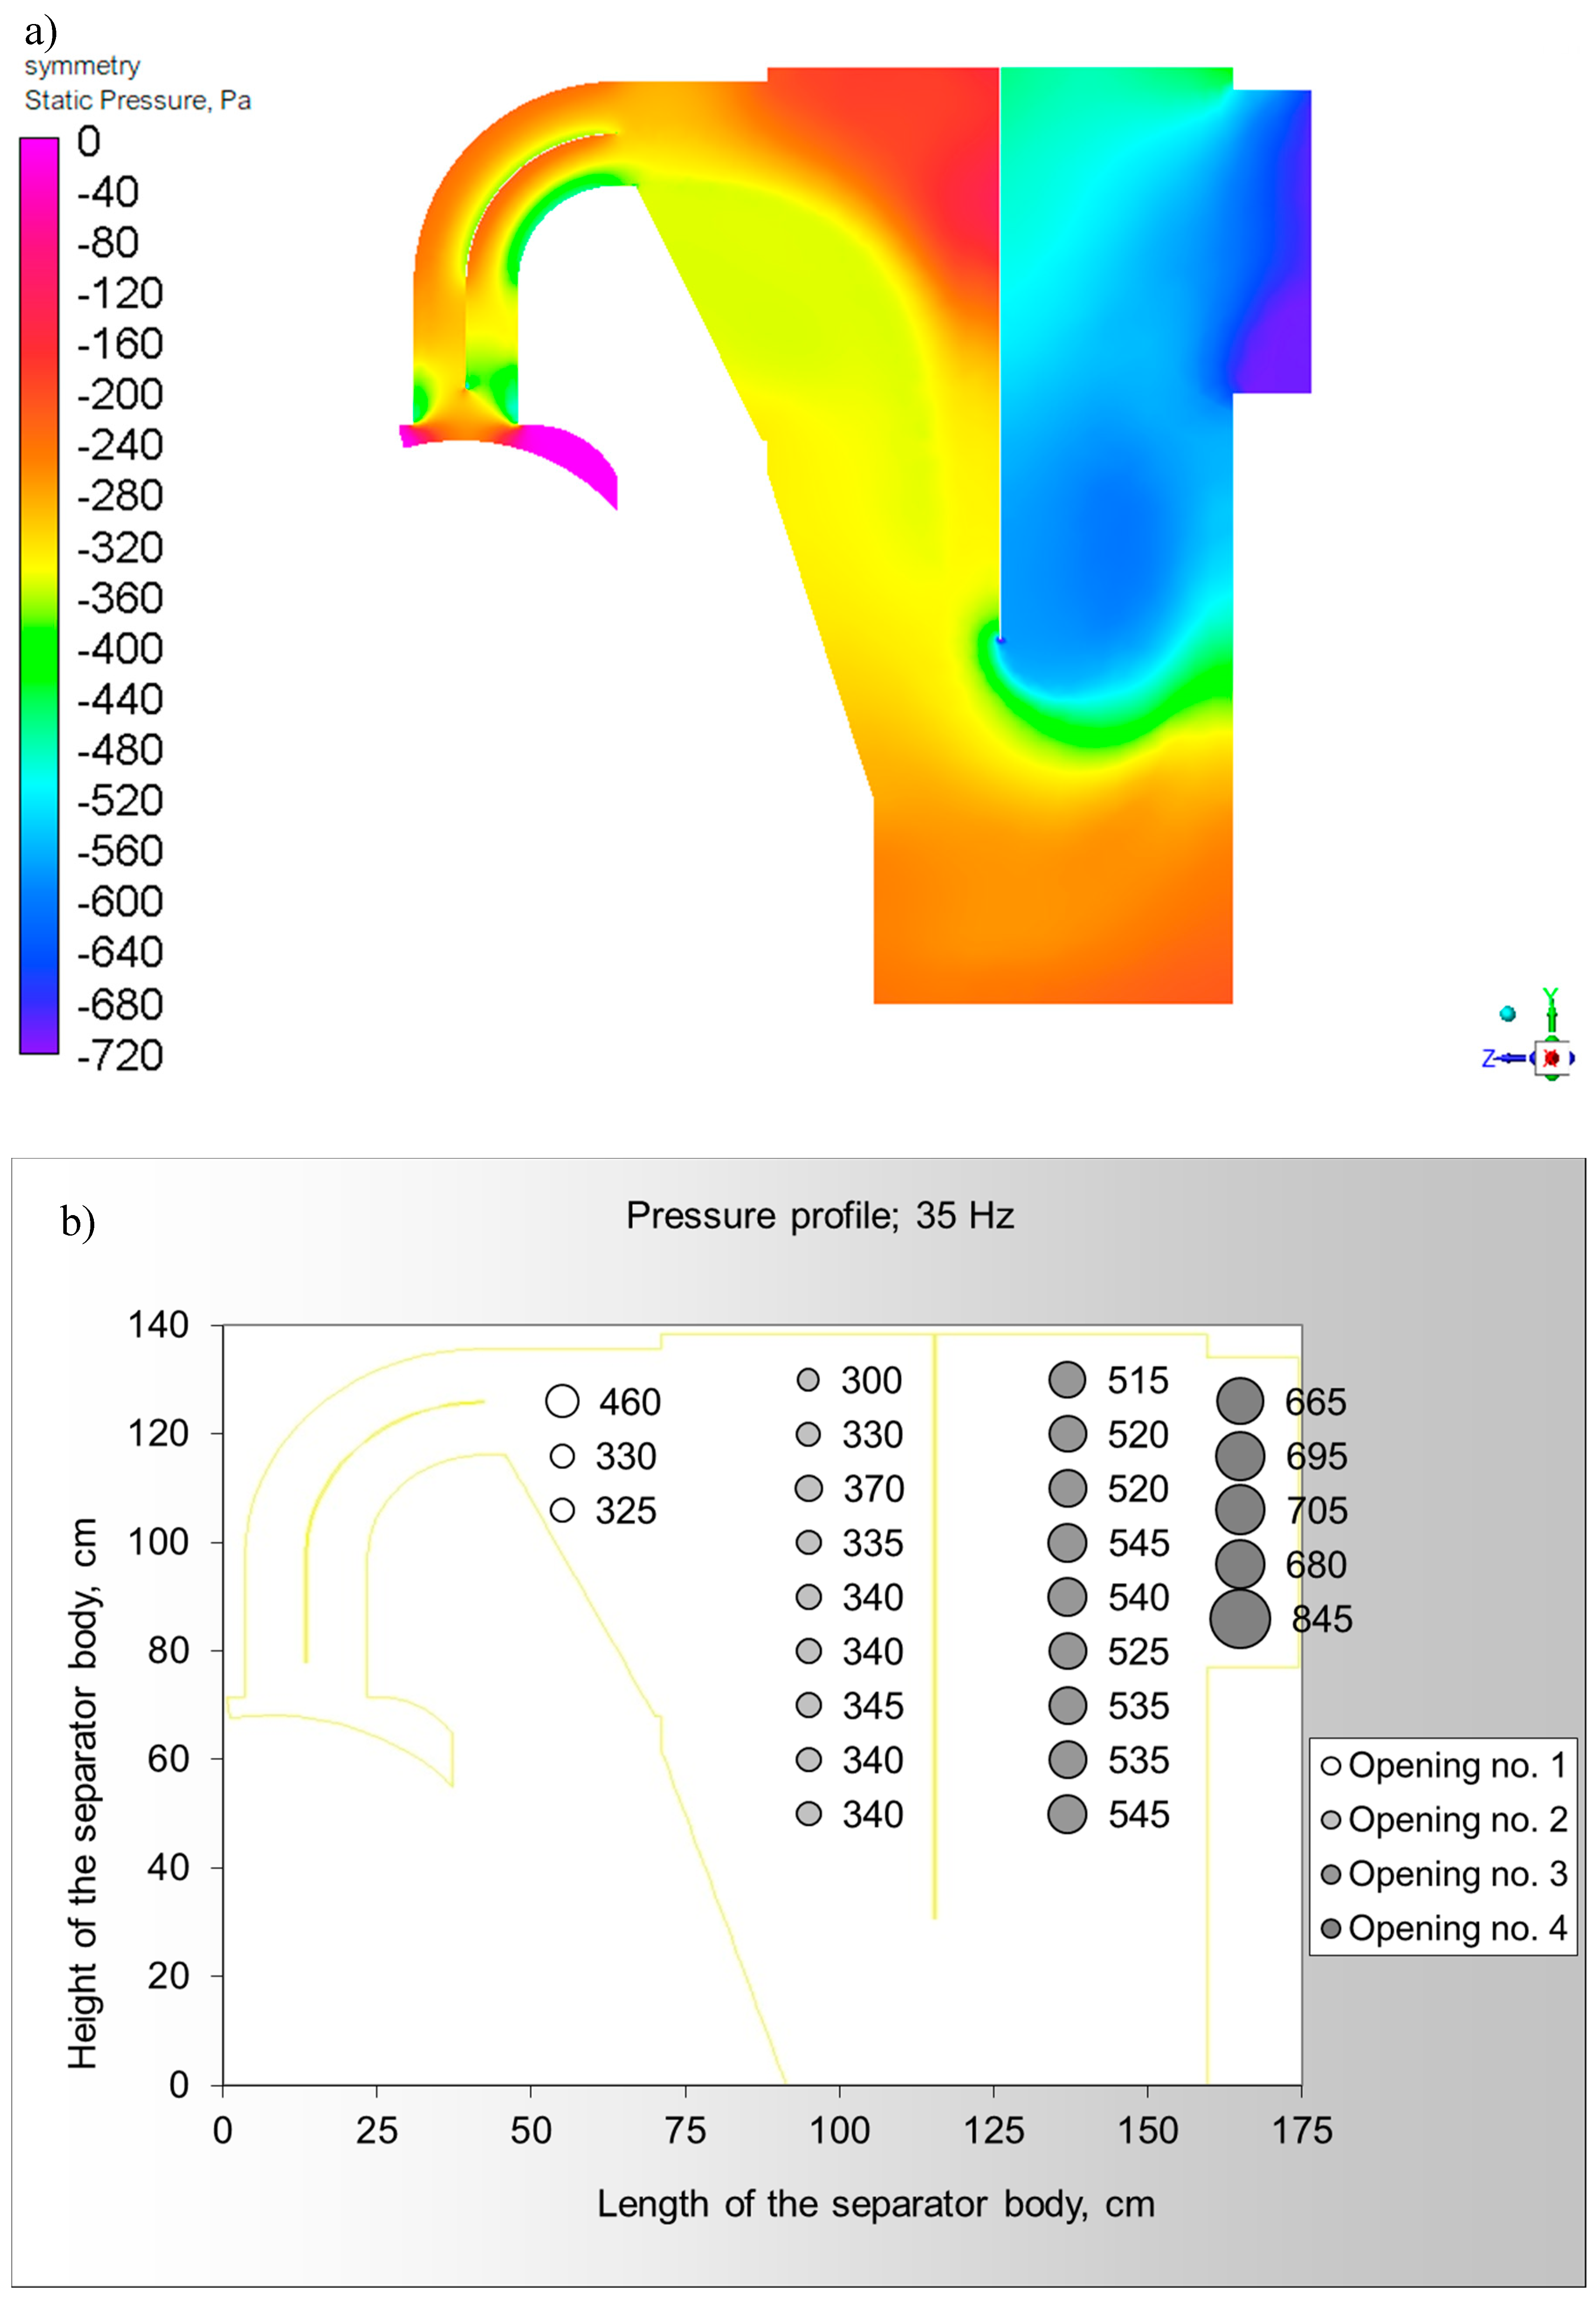
Figure 12.
DPM trajectory (simulation of the main fan at 35 Hz).

Figure 13.
Summary of washability curves, enrichment curves, experimental results and modelling results—feed material no. 1 in grain size class 0–20 mm.
Figure 13.
Summary of washability curves, enrichment curves, experimental results and modelling results—feed material no. 1 in grain size class 0–20 mm.
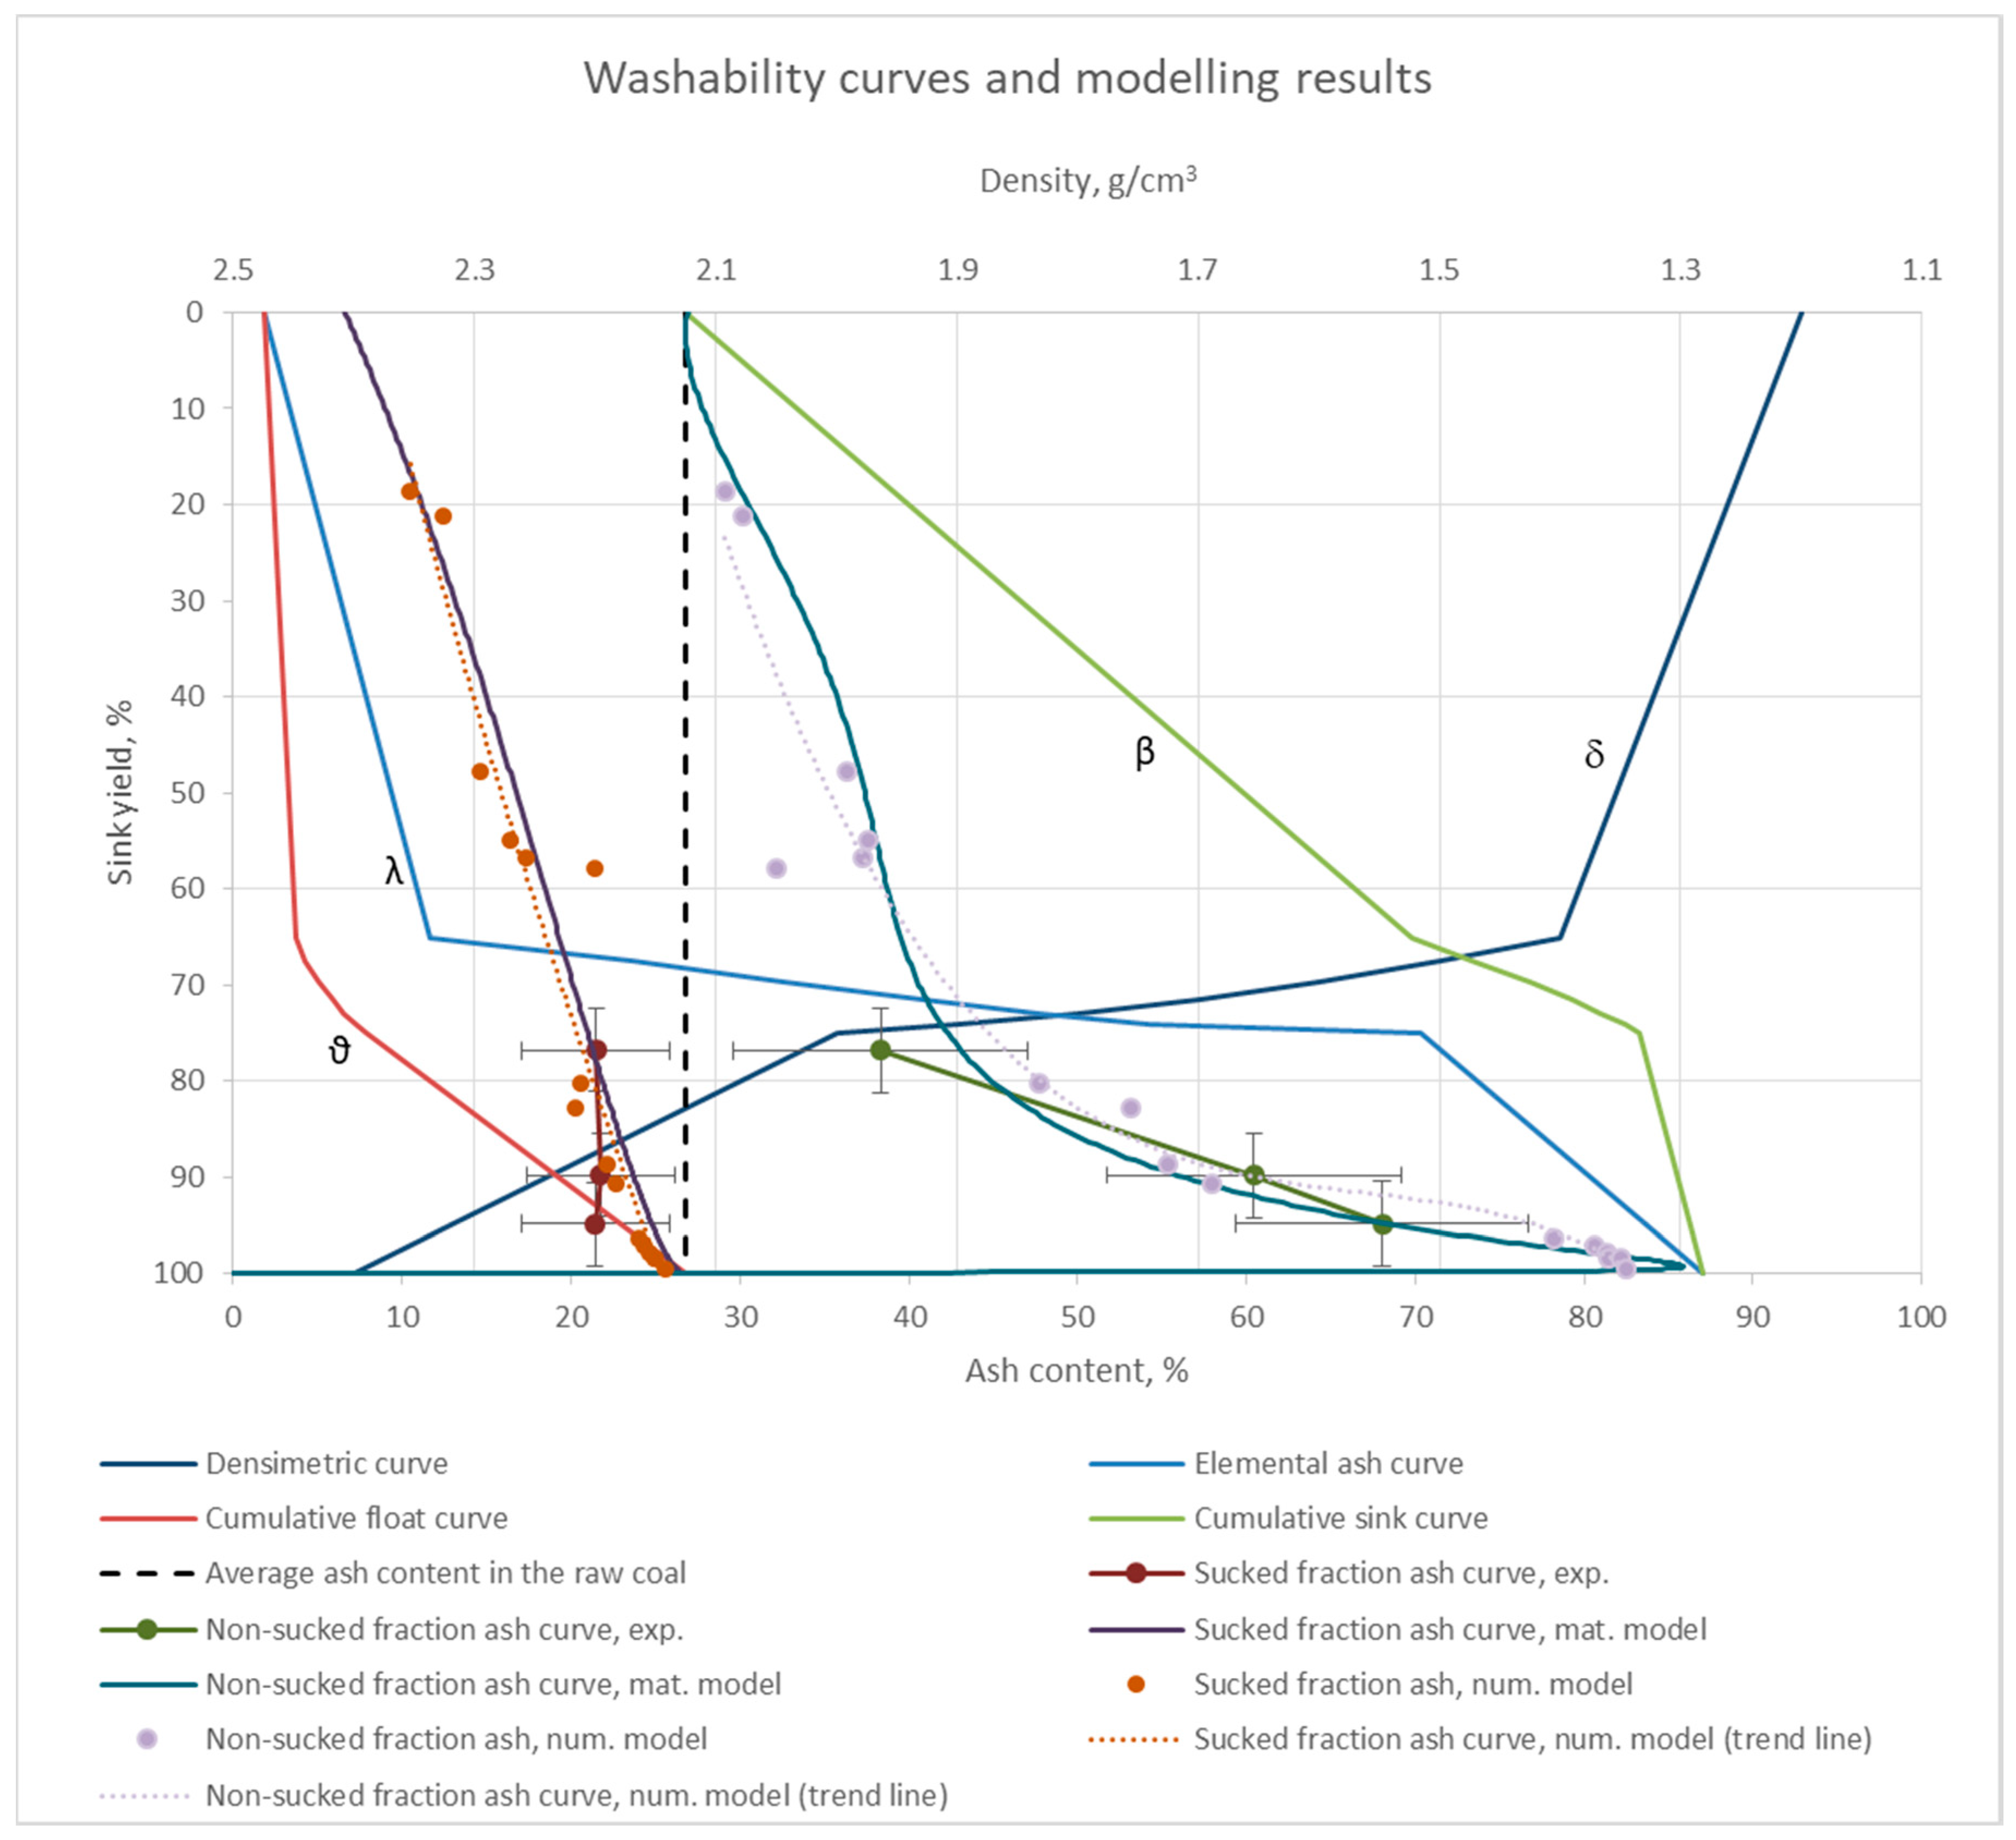
Figure 14.
Assessment of the efficiency of coal separation with use of the NPPS in comparison to wet methods—feed material no. 1 in grain size class 0–20 mm.
Figure 14.
Assessment of the efficiency of coal separation with use of the NPPS in comparison to wet methods—feed material no. 1 in grain size class 0–20 mm.

Table 1.
The washability curves equations [56].
Table 1.
The washability curves equations [56].
| Curve Coordinates | Equations |
|---|---|
| Product yield | |
| Waste yield | |
| Ash content in the product | |
| Ash content in the waste | |
| Average ash content in the raw coal | |
| Ash yield in the product |
Table 2.
Results of the grid-independence study.
| Grid Variant Number | 1 | 2 | 3 | 4 | 5 | 6 | 7 | |
|---|---|---|---|---|---|---|---|---|
| Mesh info | Nodes | 4621 | 37,506 | 56,159 | 175,948 | 483,270 | 1,990,955 | 11,930,172 |
| Elements | 18,091 | 152,444 | 224,117 | 691,329 | 1,951,394 | 8,227,042 | 50,104,709 | |
| Min./Avg. Orth. Quality | 9.1 × 10⁻⁴ / 0.731 | 0.077 / 0.842 | 0.11 / 0.844 | 0.108 / 0.861 | 0.0811 / 0.867 | 0.0789 / 0.871 | 0.0502 / 0.872 | |
| Max./Avg. Skewness | 0.99997 / 0.43 | 0.9998 / 0.27 | 0.98 / 0.26 | 0.89 / 0.24 | 0.92 / 0.23 | 0.92 / 0.23 | 0.95 / 0.22 | |
| Max./Avg. Aspect Ratio | 53,208 / 7.96 | 85.36 / 2.04 | 24.22 / 1.99 | 23.09 / 1.96 | 19.34 / 1.92 | 13.72 / 1.91 | 11.96 / 1.90 | |
| Average facet pressure | Point 1 (left), Pa | NO CONVERGENCE | −335.83 | −349.2 | −409.88 | −422.85 | −403.7 | COMPUTATION TOO EXPENSIVE (memory clogging) |
| Point 2 (middle), Pa | −373.38 | −390.84 | −426.35 | −437.3 | −417.28 | |||
| Point 3 (right), Pa | −639.43 | −651.41 | −655.35 | −652.48 | −652.04 | |||
| Average facet velocity | Point 1 (left), m/s | 23.5 | 24.03 | 26.08 | 26.71 | 25.85 | ||
| DPM results | output yield | 88.9% | 91.9% | 96.4% | 97.1% | 96.1% | ||
| ash of sucked fraction | 22.18% | 22.62% | 24.00% | 24.38% | 23.95% | |||
| ash of non-sucked fraction | 56.07% | 63.67% | 78.17% | 78.25% | 75.37% | |||
 | 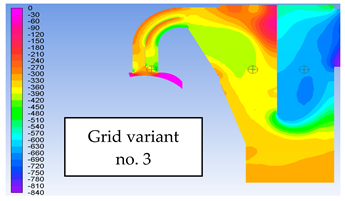 | |||||||
 | 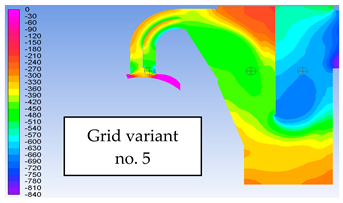 | |||||||
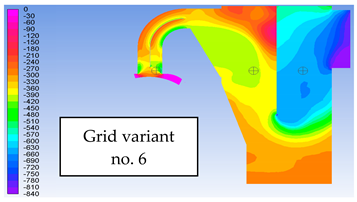 | 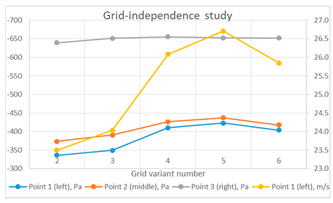 | |||||||
Table 3.
Discrete phase model (DPM) injection details.
| Material Number | 1 | 2 | 4 | 5 |
|---|---|---|---|---|
| Injection type | Group | |||
| Number of streams | 40 | |||
| Diameter distribution | Rosin-Rammler | |||
| Min. diameter, mm | 1.0 | |||
| Max. diameter, mm | 20.0 | |||
| Average diameter, mm | 7.3 | 7.0 | 10.5 | 6.3 |
| Spread parameter | 1.07 | 0.61 | 1.34 | 0.85 |
Table 4.
Measured negative pressure at the outlet of the separator for the assessment of the measurement uncertainty.
Table 4.
Measured negative pressure at the outlet of the separator for the assessment of the measurement uncertainty.
| Main Fan Setting, Hz | Uncertainty Assessment of Pressure Measurement (Opening No. 4) | |||||||||
|---|---|---|---|---|---|---|---|---|---|---|
| Measured Negative Pressure, Pa | Uncertainty Calculation | |||||||||
| 1 | 2 | 3 | 4 | 5 | Mean Value | Stand. dev. ; tα = 0.317,n = 4 = 1.14 | Δdx | Δex | uc(p) | |
| 20 | 235 | 245 | 245 | 240 | 300 | 253 | 30 | 14 | 20 | 33 |
| 25 | 340 | 345 | 365 | 350 | 440 | 368 | 47 | 16 | 30 | 51 |
| 30 | 495 | 530 | 515 | 505 | 620 | 533 | 57 | 18 | 40 | 63 |
| 35 | 665 | 695 | 705 | 680 | 845 | 718 | 83 | 21 | 50 | 88 |
| 40 | 835 | 860 | 880 | 870 | 1120 | 913 | 133 | 24 | 60 | 138 |
| 45 | 1080 | 1100 | 1120 | 1100 | 1430 | 1166 | 169 | 27 | 70 | 175 |
| 50 | 1240 | 1280 | 1325 | 1240 | 1575 | 1332 | 160 | 30 | 80 | 167 |
© 2020 by the author. Licensee MDPI, Basel, Switzerland. This article is an open access article distributed under the terms and conditions of the Creative Commons Attribution (CC BY) license (http://creativecommons.org/licenses/by/4.0/).
Share and Cite
MDPI and ACS Style
Stańczyk, K. Modelling of Hard Coal Beneficiation Process Utilising Negative Pressure Pneumatic Separator. Energies 2020, 13, 5174. https://doi.org/10.3390/en13195174
AMA Style
Stańczyk K. Modelling of Hard Coal Beneficiation Process Utilising Negative Pressure Pneumatic Separator. Energies. 2020; 13(19):5174. https://doi.org/10.3390/en13195174
Chicago/Turabian StyleStańczyk, Kamil. 2020. "Modelling of Hard Coal Beneficiation Process Utilising Negative Pressure Pneumatic Separator" Energies 13, no. 19: 5174. https://doi.org/10.3390/en13195174
Note that from the first issue of 2016, this journal uses article numbers instead of page numbers. See further details here.