Article

Combustion Modeling and Simulation of Recycled Anode-off-Gas from Solid Oxide Fuel Cell

by
Sataish Asghar Kashmiri
1,2,
Muhammad Wasim Tahir
1,* and
Umer Afzal
1
1
Department of Chemical Engineering, University of Engineering and Technology, G.T. Road Lahore 54890, Pakistan
2
Department of Chemical Engineering, Minhaj University, Township Lahore 54770, Pakistan
*
Author to whom correspondence should be addressed.
Energies 2020, 13(19), 5186; https://doi.org/10.3390/en13195186
Submission received: 10 August 2020 / Revised: 8 September 2020 / Accepted: 9 September 2020 / Published: 5 October 2020

Abstract

:
A solid oxide fuel cell (SOFC) is popular amongst other fuel cell technologies due to fuel flexibility, low cost, and stability. Because of difficulties involved in the handling of hydrogen, onsite hydrogen production is considered for many small- and large-scale applications. It involves an integrated setup consisting of a reformer, combustor, and fuel cell stack. Being operated at high temperature, gases leaving SOFC contain a significant amount of thermal energy which can be utilized within the integrated reforming process. In addition, anode-off-gas (AOG) from SOFC contains unreacted hydrogen which can be utilized as fuel in an integrated combustor thereby increasing combustor efficiency. For effective integration of a combustor, reformer, and power generator, modeling and simulation is of great utility. In the present work, a 3D model of an integrated combustor unit is developed and implemented into the computational fluid dynamics (CFD) simulation package ANSYS FLUENT®. Main objective of this work is to prove the concept of enhancement in combustor performance by utilizing AOG from SOFC as a supplementary fuel in the combustor. Simulation results show a significant increase in combustor temperature and heat dissipated to the reformer side with AOG utilization. Up to an 18% saving in fuel (natural gas), used in combustor to supply heat to the reformer, is observed.

Graphical Abstract

1. Introduction

Coal, natural gas, and oil referred commonly to as fossil fuels comprise a major part of the world energy supply. A detrimental rise in global temperature is driven by greenhouse gas (GHG) emissions caused mainly by the burning of fossil-based fuels. Natural gas comprising mainly of methane burns with lower emissions than oil and coal. Quantitatively, natural gas produces 30% less CO2 than oil and 43% less than coal while producing no SO2. Concerns over fossil fuel depletion and environmental deterioration have made the world opt for different new technologies such as carbon capture and storage (CCS), renewables, and nuclear fusion. Renewable energy technology is found to be the most efficient and reliable option amongst these new technologies [1,2]. A major part of fossil fuels is used to produce electricity for industrial and domestic consumers leading to a major environmental hazard due to the release of large amounts of GHG emissions. The transportation sector is another major consumer of fossil fuels and hence contributes significantly to environmental deterioration. Amongst the present renewable energy sources, fuel cells and storage batteries stand atop. For cleaner electric power with almost zero emissions, fuel cells are considered to be the most effective, efficient, and economical option. In fuel cells an electrochemical process is driven in the presence of hydrogen (as a fuel) and oxygen (or air) producing water and heat. Amongst the numerous existing fuel cell technologies, the PEMFC (Polymer Electrolyte Membrane Fuel Cell) and SOFC (Solid Oxide Fuel Cell) are the most promising ones. A major advantage associated with the SOFC is the wider operating temperature range i.e., 700 °C to 1000 °C under both atmospheric and pressurized conditions. Oxygen (oxidizer) can be used in pure state or derived from the air while hydrogen (fuel) can be used from storage as well as produced on the site. Being very light, hydrogen is difficult to transport in tanks or store for extended periods of time. Moreover, being highly combustible, hydrogen poses risk of fire or explosion. Difficulties involved in handling and transportation of hydrogen as well as risks associated with it make the onsite production of hydrogen a favored choice. Onsite hydrogen production involves reforming hydrocarbon fuels, mainly methane or natural gas, which is an endothermic process. Heat required by the endothermic reforming reaction is supplied by a combustor attached to the reformer in which part of the hydrocarbon fuel is burned while the remaining is reformed [3,4].
Due to high temperature associated with SOFC operation, unreacted gases leaving the cell contain a significant amount of thermal energy that can be retrieved by heat exchange. In addition to thermal energy, SOFC exhaust gases contain chemical energy that can be retrieved by combustion. Conventionally, thermal energy is retrieved by direct heat exchange without retrieving chemical energy of the exhaust gases. Chemical energy is dominantly contained in anode off gas (AOG) mainly comprised by hydrogen. Thermal energy contained in stack exhaust gases can be utilized in preheating air and hydrocarbon fuel, water vaporization, and supplying heat to the endothermic reforming process. Chemical energy in the stack exhaust gases can be recovered by combusting the stack gases along with the hydrocarbon fuel in the combustor. In an integrated setup, power generation (fuel cell stack) is combined with reforming (H2 production) and combustion (supply heat to reforming) processes. Thermal energy utilization by direct heat exchange combined with chemical energy recovery through combustion greatly improves thermal efficiency of the integrated setup [5]. In addition to thermal energy utilization, many researchers focused on effective utilization of chemical energy contained in fuel cell exhaust gases [6,7,8,9,10,11,12]. Regarding chemical energy, AOG is of primary importance since it comprises mainly hydrogen having a very high heat value. Numerous efforts have been invested by the researchers in investigating the AOG utilization concept [13,14,15,16]. Combustion of AOG along with natural gas (AOG + NG) have not been studied extensively and quite a few instances are found in the published literature [17,18,19]. The concept of AOG utilization is comparatively new and a lot of innovations are being made to improve the efficiency of the process. Burning unreacted hydrogen (present in AOG) in the combustor in combination with the hydrocarbon fuel can greatly reduce fuel consumption and thus improve efficiency of the process. Reforming reactions are endothermic and large amounts of heat are required to achieve high efficiency. Heat contained in AOG can be used to drive the endothermic reforming reactions. Unreacted hydrogen exhausted with AOG can be used as fuel to supply heat to the endothermic reforming reactions [20,21].
Experimental investigations of integrated combustion-reforming-power (CRP) systems contribute significantly to develop an understanding of such complex systems. However, design and execution of experiments involving such complex systems is often tedious, expensive, and time consuming. Experimental efforts are often dedicated to a single aspect of the CRP system e.g., power generation, reforming, or combustion [5,22,23]. Modeling and simulation are effective tools to investigate complex CRP systems at a significantly lower cost and time. Modeling combustion of NG and hydrogen mixtures is a challenge especially when the model involves implementation into CFD (computational fluid dynamics) on a 3D level. The 3D CFD models involving combustion of hydrogen and NG mixtures are rarely found in the published literature [24]. These models do not specifically focus on combustion modeling of AOG + NG mixtures to recover chemical energy from AOG and improve combustor thermal efficiency. Combustion modeling of AOG + NG mixtures requires a detailed reaction mechanism involving a species comprising NG and AOG along with the kinetic data. Extensive research work has been performed to develop reaction mechanisms involving combustion of NG with air, and so is the case with hydrogen-air combustion. Reaction mechanisms resulting from this extensive work consist of multiple reaction steps usually in hundreds or thousands. Large mechanisms are hard to implement in CFD where Multiphysics phenomena such as fluid flow, heat transfer, and species transport take place simultaneously. These mechanisms should be reduced before being implemented into CFD simulations. Paulina Pianko-Oprych and Zdzisław Jaworski [24] proposed a five-step reaction mechanism to model combustion of NG and hydrogen mixture using CFD. Similarly, N. Stylianidis et al. [25] proposed a 31-step reduced mechanism to model CH4-H2 and syngas mixtures.
In the present work, combustion of natural gas and hydrogen (AOG) to supply heat for the endothermic reforming reaction is investigated using CFD simulations. A 3D CFD combustion model is developed involving combustion of AOG from SOFC stack along with NG in the combustor part of the integrated CRP setup. AOG is composed of H2, CO, CO2, and H2O. H2, being the major combustible component of AOG, is incorporated in the combustion model while other components are ignored except for H2O which is considered in a separate case (case III) in the simulation procedure. an approximated value of 25% for H2O mass fraction in AOG is selected. Approximation is based on the fact that H2O mass fraction in AOG varies between 10% – 30% as recorded in reference [26]. In addition to combustion of NG + H2, preheating of NG + Air using heat from the AOG has been considered in the model. AOG utilization concept is elucidated in schematic diagram presented in Figure 1.
Combustor geometry and operating parameters have been derived from [5] while the reaction mechanism to model NG + H2 mixtures has been adopted from [24]. The difference between the investigations carried out in the present work and that of the references [5] and [24] is that investigations of reference [5] focused on the performance and efficiency optimization of SOFC and combined heat and power systems by multi-stage exhaust gas recycling using a process of modeling combined with experiments. In reference [24], a CFD combustion model of NG and hydrogen was used to investigate performance and combustion efficiency of a concept burner. Meanwhile, the present work is focused on recovering chemical and thermal energy of AOG using a 3D CFD combustion model involving NG and hydrogen combustion. Geometry, operating parameters, mechanisms, and kinetic data are adopted from references [5,24] for a different type of investigation. The CFD combustion model presented in this work incorporates the Multiphysics phenomena taking place in a combustor involving fluid flow, heat transfer, species transport, and reaction kinetics simultaneously.

2. Model Development

Modeling and simulation of multi-component systems, such as CRP or other integrated combined heat and power (CHP) systems, is a challenge due to the involvement of a large number of parameters. This makes the majority of the researchers opt for a component-based modeling approach rather than an integrated modeling approach. This is especially true in case of CFD modeling of such multi-component systems. To simulate individual components, as done in the present work, numerous assumptions and generalization of model parameters have to be made that affect the accuracy of model predictions. In the present work we tried our best to implement the operating conditions and model parameters simulating scenarios close to the real case. In the present CFD model, gas phase kinetics are assumed to model reaction chemistry in order to reduce the complexity of the model. Surface kinetic mechanisms involving the combustion of natural gas and hydrogen mixtures are seldom found in the published literature. Moreover, such mechanisms are very large involving several hundred reaction steps. Implementing surface kinetics in CFD requires reasonable effort and handling simulations is a challenge. In the present investigations, the gas phase reaction kinetic mechanism performed reasonably well regarding the accuracy of predictions.

2.1. Integrated Combustor-Reformer Design

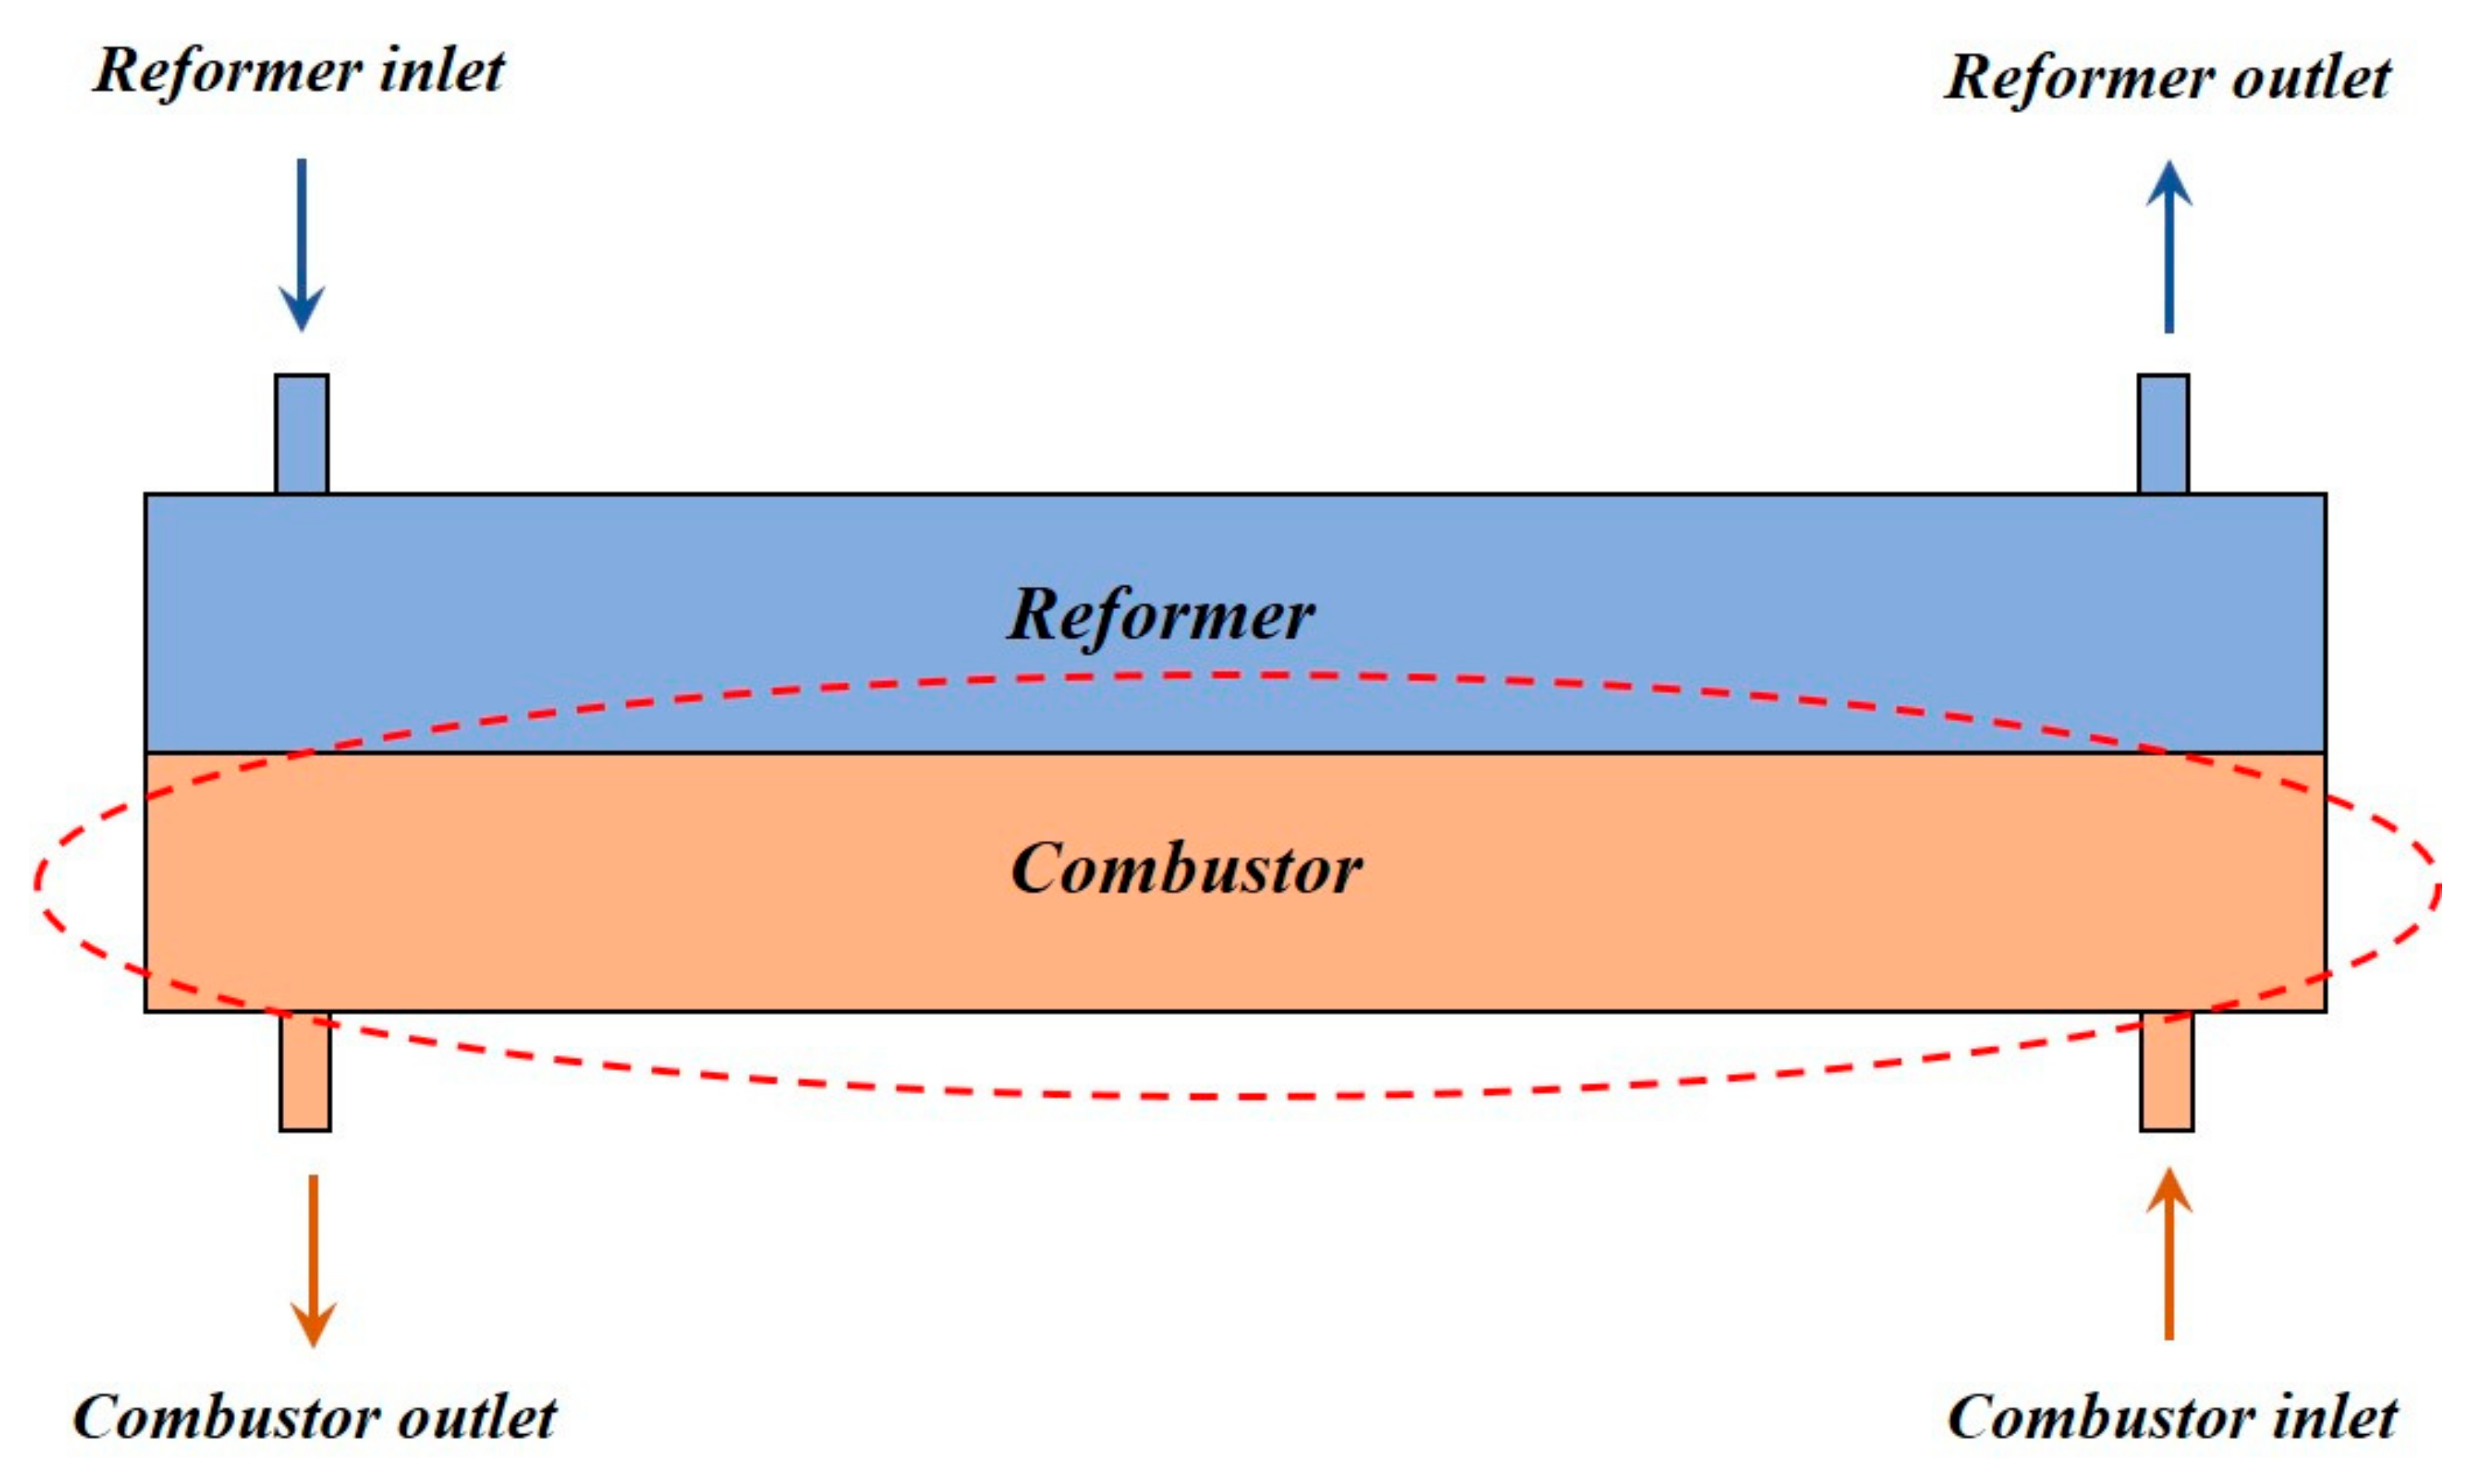
For onsite production of hydrogen an integrated combustor–reformer setup is used where hydrocarbon fuel, i.e., natural gas, is burned in the combustor to provide heat for the endothermic reforming reaction through a shared wall between the combustor and the reformer. Simplified 2D representation of the integrated combustor–reformer setup used in the experimental setup of reference [5] is shown in Figure 2. The combustor is provided with two separate inlets for fuel and the oxidizer, located on right side of the combustor, while the outlet is located on the left side (Figure 2). The proposed design is based on catalytic combustion and catalytic reforming processes in a crossflow configuration. In the present work, the combustor design presented in [5] is modified to incorporate AOG from the integrated SOFC in the natural gas combustion model. In the present model, fuel gases (natural gas and hydrogen) as well as the oxidizer (air) enter from separate inlets at specified flow rates. The proposed model assumes non-catalytic combustion of natural gas and hydrogen in the combustor.

2.2. Geometry Model

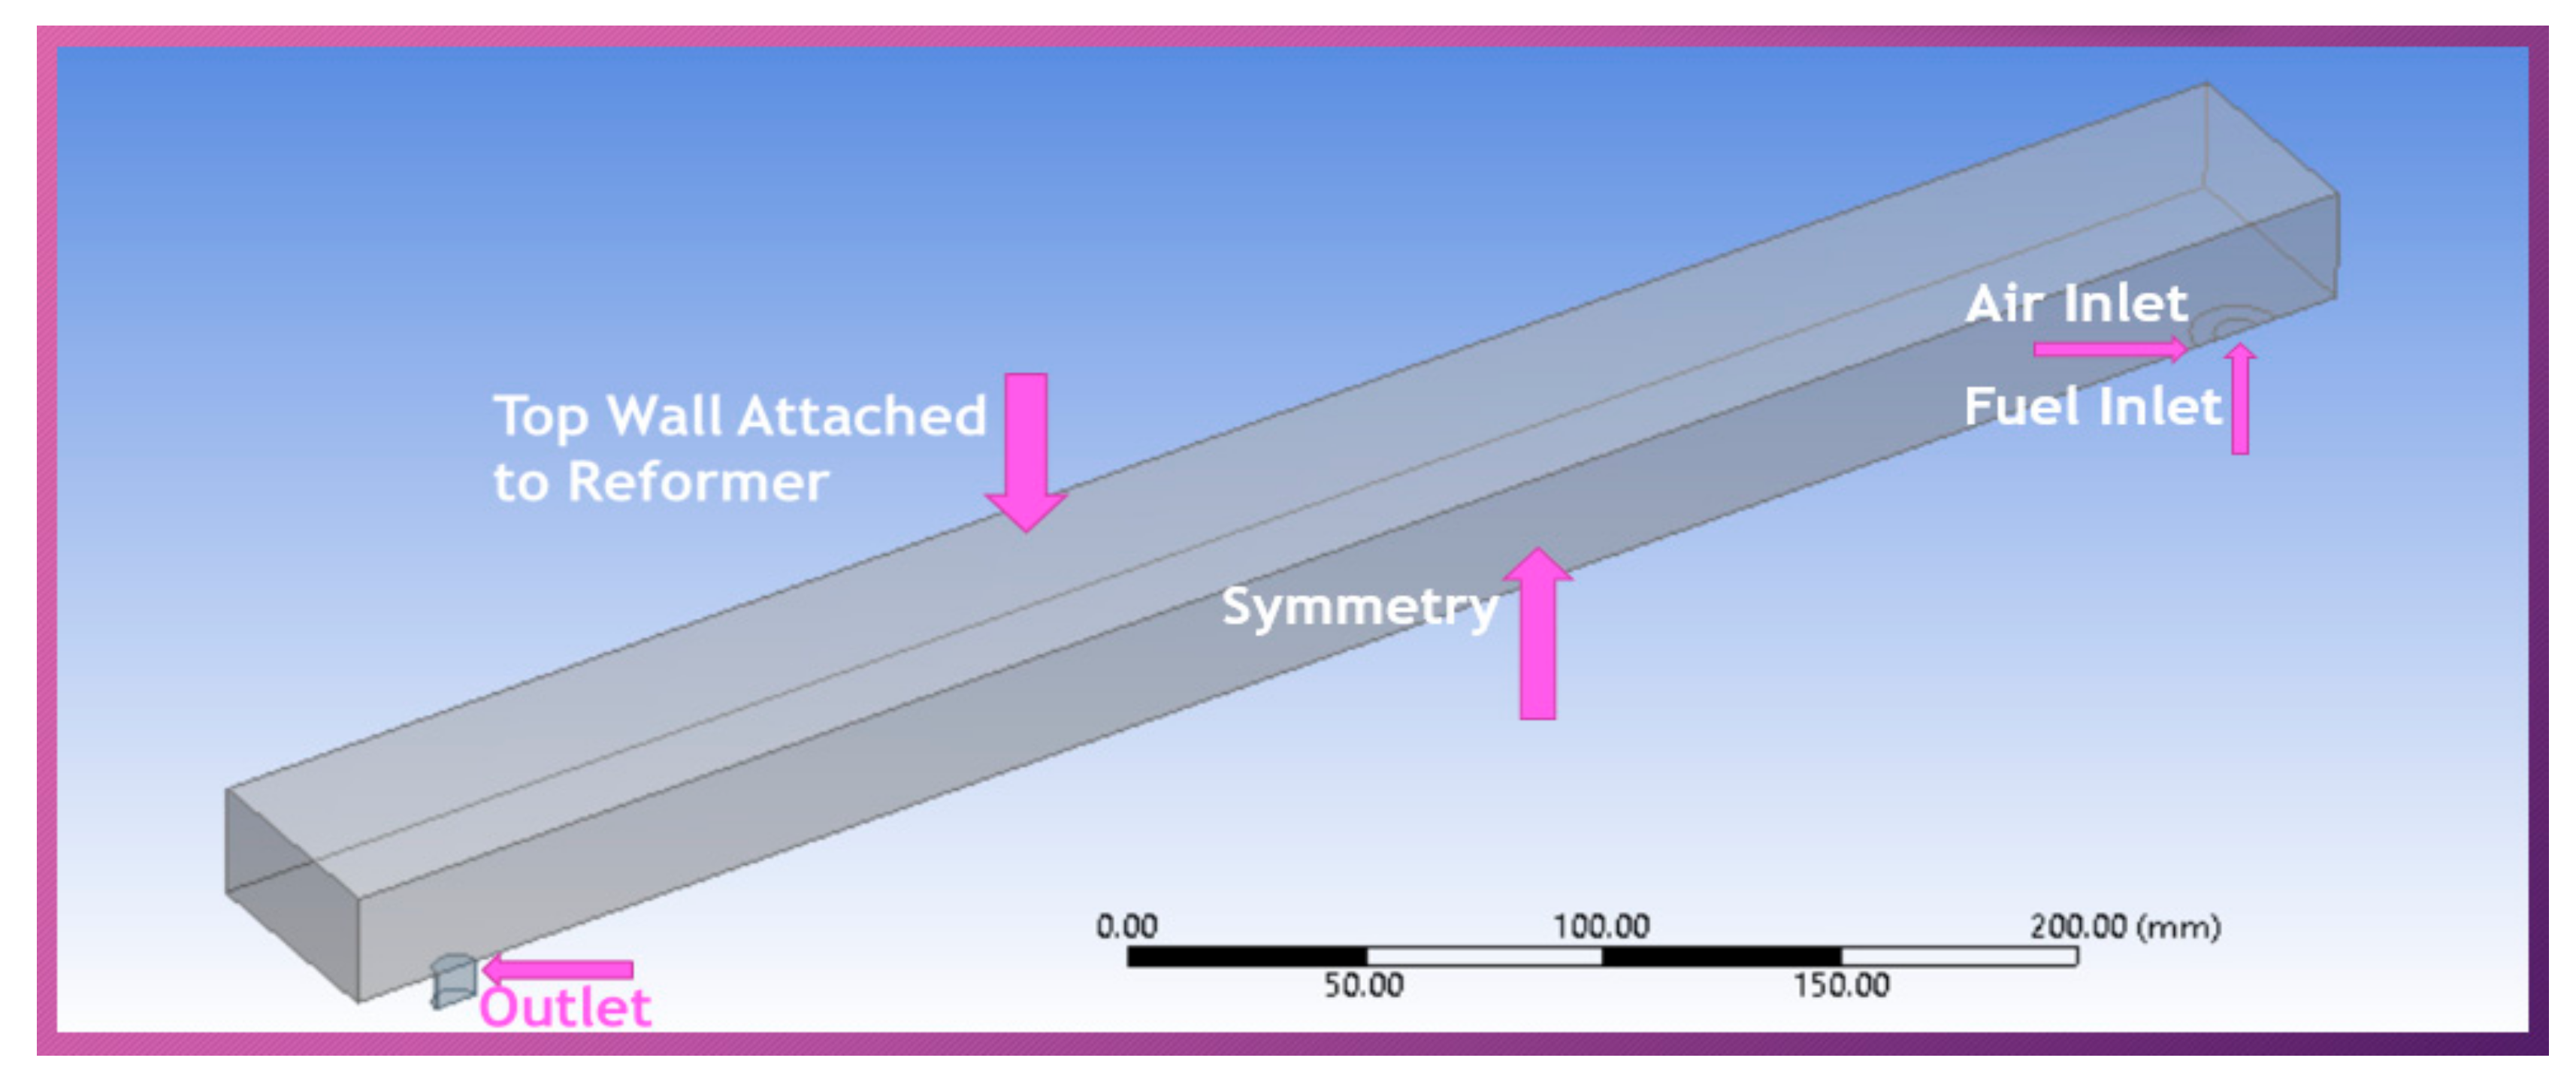
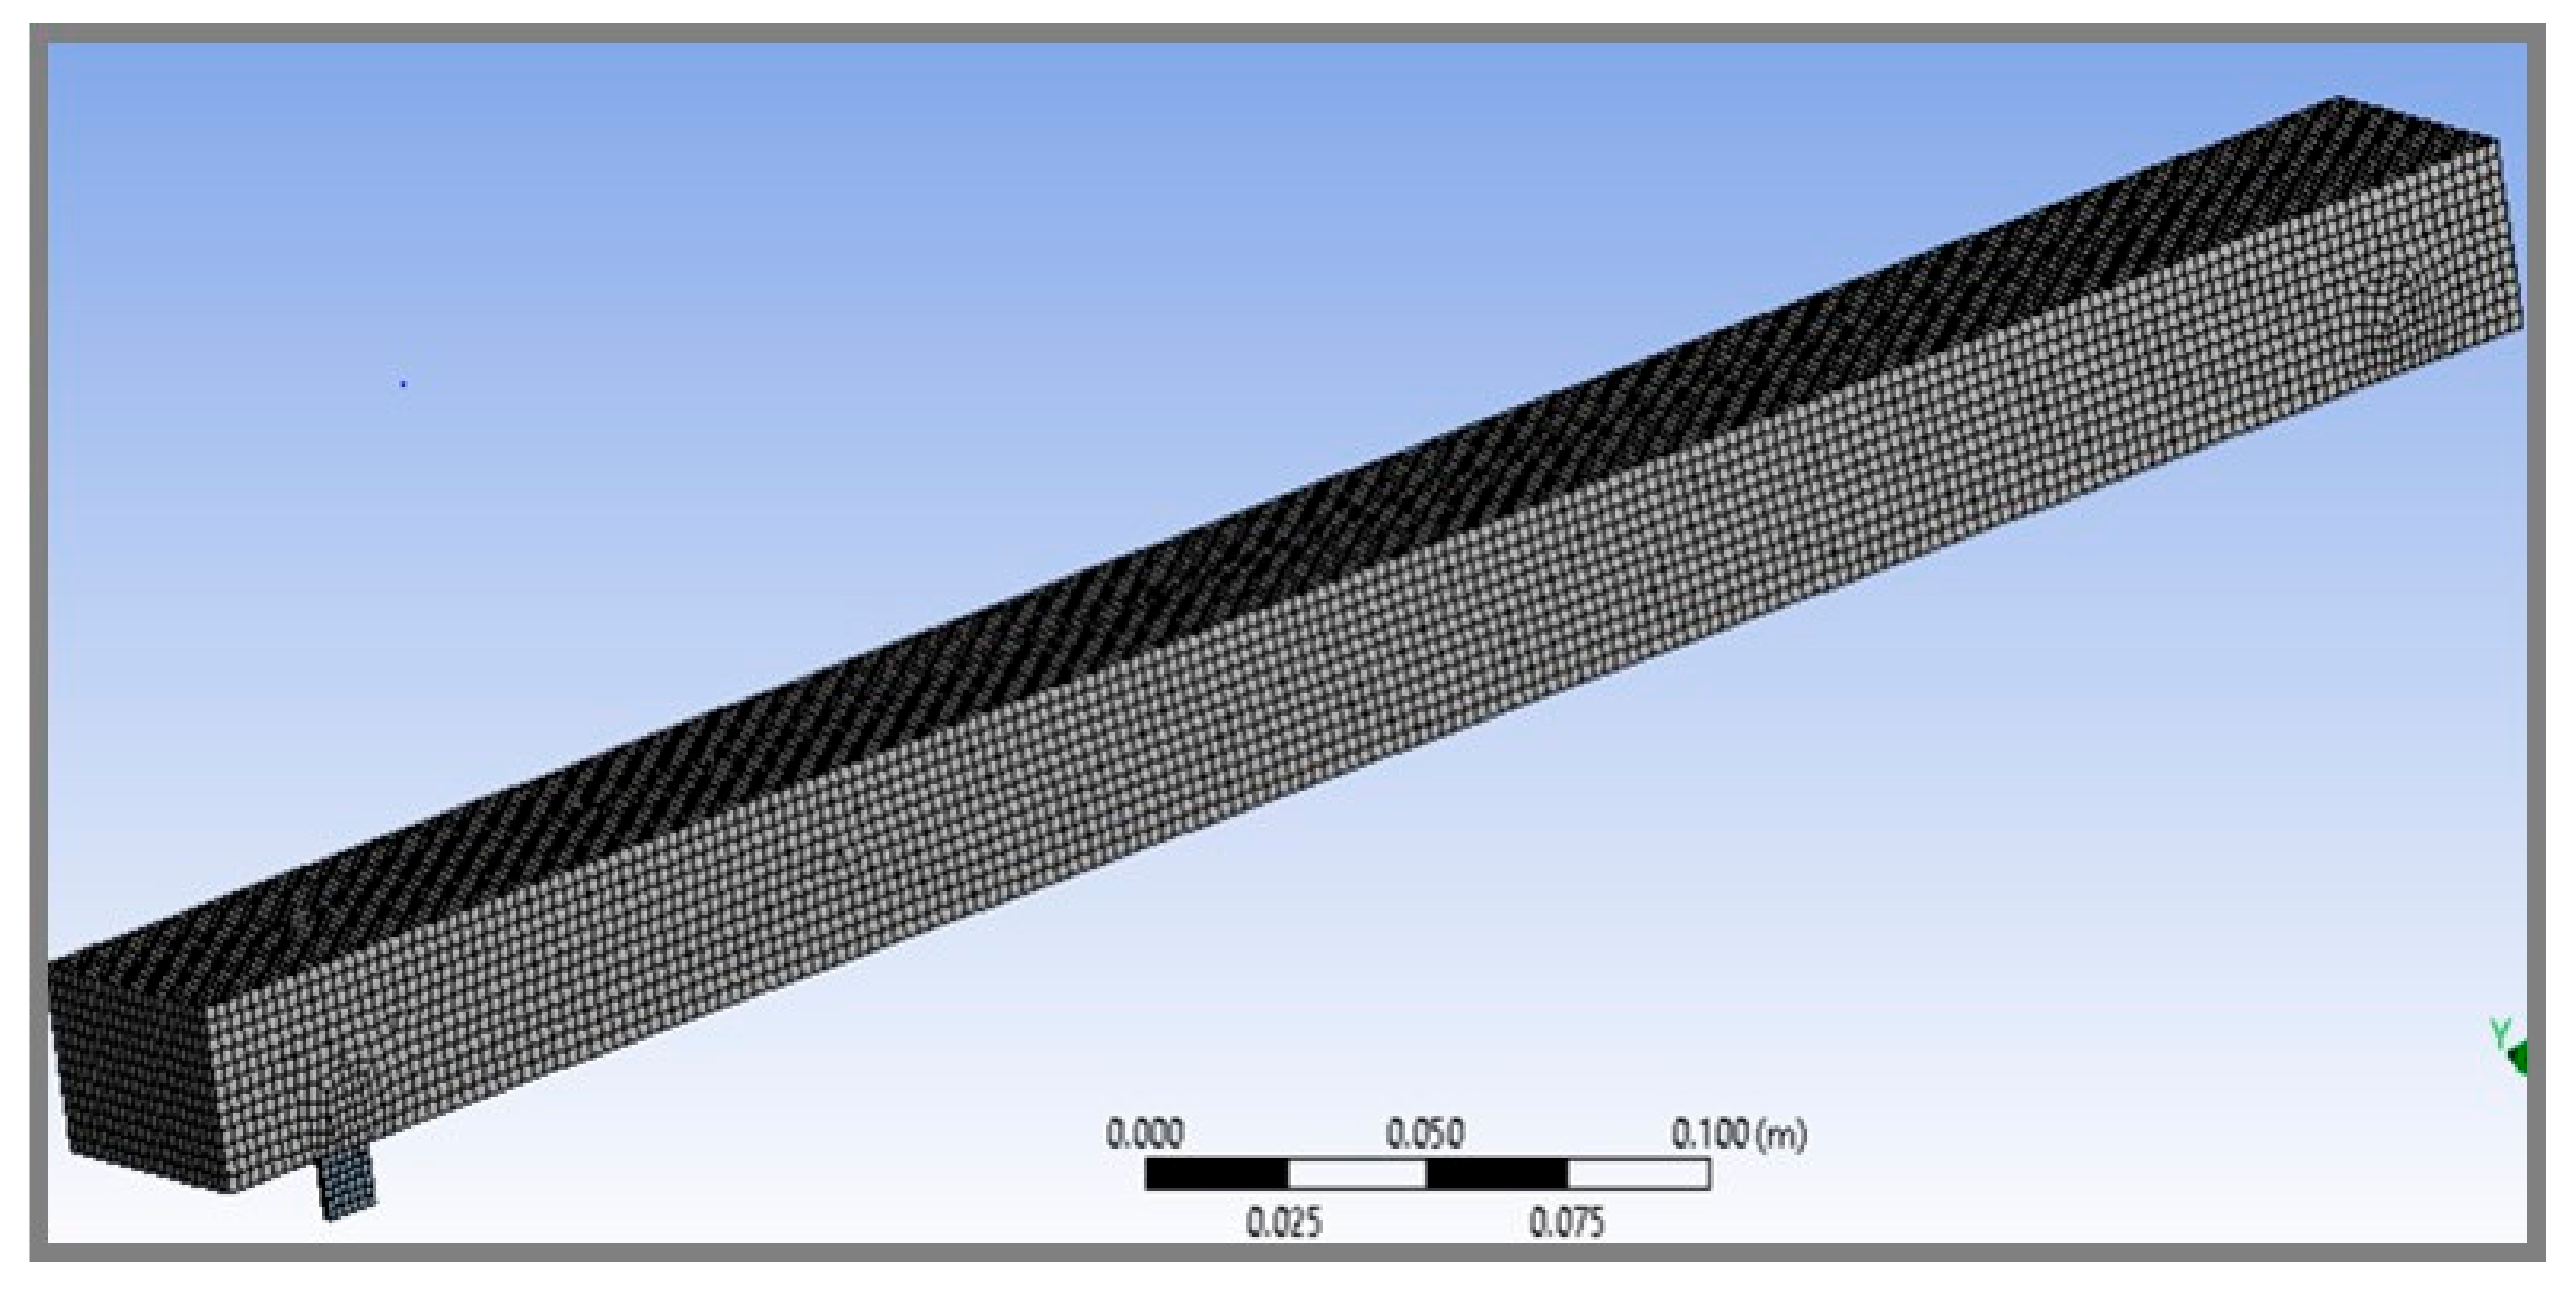
The combustor part of the setup shown in Figure 2 is modeled in the present work on a 3D level. Half symmetry of the computational domain is selected for the model. The 3D geometrical model is developed using ANSYS Design Modeler® and is shown in Figure 3. Most of the finer details of the geometry have been incorporated in the model with minor adjustments. The combustor is 500 mm in length, 50 mm in width, and 30 mm in height. Combustor geometry contains two inlets: an inner inlet referred to as fuel inlet and an outer inlet referred to as air inlet. The outer diameter of the fuel inlet is 10 mm while the inner and outer diameters of the air inlet are 10 mm and 20 mm, respectively. In case of NG combustion without AOG utilization, both the inlets are used to feed NG and air mixture. While in case of AOG utilization, the fuel inlet (inner) is used to feed AOG, whereas NG + Air mixture is fed to the air inlet (outer). The domain is discretized using the finite volume hexahedral dominant mesh implemented in ANSYS FLUENT®. The mesh size is optimized using mesh independency tests. The optimized mesh produced a total of 49,614 elements. Selective mesh sizing and mesh bias are ignored to avoid complexity in the combustion model. Optimized hexa-dominant mesh on 3D computational domain is shown in Figure 4.

2.3. Mathematical Model

Combustion is a complex phenomenon involving numerous processes such as mass, heat, and species transport as well as fluid flow taking place simultaneously. Capturing all these phenomena in the model is a difficult task. In combustion modeling quantification of heat released by the combustion reactions as well as heat flux across various boundaries is important. The ANSYS FLUENT® software package, used in present work, is a powerful simulation tool capable of handling all the above-mentioned processes simultaneously in a robust manner.

2.3.1. Model Assumptions

Assumptions profoundly impact the level of accuracy of the model as well as the computational effort and time required to run the model. In other words, realistic assumptions are used to reduce the complexity of the model with minimal effect on the accuracy of predictions. Therefore, model assumptions have to be carefully chosen after deliberate consideration of the possible impact on the simulation results. The following assumptions are made in the present work:
  • Steady state conditions are assumed ignoring temporal variations.
  • Adiabatic conditions are assumed at all the boundaries of the combustor except for the wall adjacent to the reformer (top wall in the geometry).
  • The heat transfer coefficient is applied to the top wall to draw the heat to an endothermic reforming process. Constant values of heat transfer coefficient and convective fluid temperature are assumed
  • Non- catalytic combustion is assumed.
  • Cathode off-gases are excluded from the analysis.
  • All fluids are assumed to exhibit ideal gas behavior.

2.3.2. Governing Equations

Equations used in the model have been derived using the well-established conservation principles and are presented in Table 1. The equations include mass (Equation (1)), momentum (Equation (2)), and energy balance (Equation (3)) as well as species balance (Equation (4)). Flow model is described by the turbulent kinetic energy (Equation (5)) and dissipation (Equation (6)) equations. Reactions have been implemented through various source terms. Parameters and symbols used in the equations are described in the Nomenclature section on at the end of this document.
Reaction mechanism used to model the combustion of a mixture of hydrogen and natural gas with air as oxidizer is adopted from reference [24]. This mechanism consists of five reactions presented in Table 2 along with kinetic and thermodynamic parameters.

2.3.3. Simulation Procedure

The process of combustion taking place within the combustor was simulated using different operating conditions and feed compositions. AOG was used as the fuel entering through the inner inlet (fuel inlet) while the mixture of natural gas and air (NG + Air) was through the outer inlet (air inlet) (Figure 3). The temperature of AOG leaving the SOFC stack is 1023 K. Thermal energy contained in the exhaust gas is primarily used to preheat NG + Air mixture. Preheating of NG + Air reduces the AOG temperature, hence AOG enters the combustor at 623 K. In the combustor all the chemical energy of AOG is utilized to proceed the combustion of unreacted hydrogen. A fuel (H2) mass fraction of 0.35 was used in simulations selected on the basis of optimum stack fuel utilization factor for SOFC i.e., Uf = 65%. For the oxidizer, the mean species mixture fraction was kept equal to 1.0 based on the air-to-fuel ratio (A/F = 10/1). To solve the pressure term discretization, SIMPLE pressure-velocity coupling was adopted. A hot patch at 2000 K is created next to the inlets to ignite the fuels. Simulations were carried out using three distinct cases:
  • Case I: Pure natural gas and air (NG + Air) were allowed to enter the combustor as a mixture of fuel and oxidizer, through both the inlets (fuel and air inlets) at 300 K with varying velocities of 0.5 m/s−1 and 0.7 m/s−1. Species fractions were selected based on A/F = 10/1. Intermediate or moderate inlet velocities (0.5 m/s−1 and 0.7 m/s−1) have been selected based on the combustor length (0.5 m). Too fast, and the reactants could not get enough time to get mixed and react within the combustor. Too slow, and the chances of flame out increase.
  • Case II: AOG (mainly H2) is fed to the combustor through the fuel inlet while the mixture of NG + Air as an oxidizer through air inlet at 623 K and 573 K, respectively.
  • Case III: In this case AOG containing H2O is allowed to enter the combustor at fuel inlet at 623 K while NG + Air enters through air inlet at 573 K.
The following values for the convection heat transfer coefficient hf and convective fluid (top wall) temperature Tf were used in the simulations for all the three cases:
hf = 30 W∙m−2∙K-1 and Tf = 723 K
All the required input parameters for the three different cases are presented in Table 3 and Table 4. The main objective of this research is to explore the recycling of AOG to utilize the chemical energy of unreacted hydrogen in the reforming process that is starved of energy due to its endothermic nature. Heat transfer from the combustor to the reformer is simulated by applying convective heat flux at the top wall of the combustor being shared with the reformer.

2.3.4. Model Implementation

The model equations presented in Table 2 were solved using ANSYS FLUENT®, a Multiphysics simulation package. ANSYS FLUENT ® uses the finite volume method to discretize the domain of interest. To model the combustion process in the proposed combustor, species transport is coupled with other transport phenomena taking place in the combustor i.e., mass, momentum, and energy transport. The species transport model is used along with the eddy dissipation model coupled with the relax to chemical equilibrium solver. This solver is an extension of the eddy dissipation model where species react to approach chemical equilibrium rather than reaction completion. Furthermore, this model also governs the kε turbulence model to control the overall reaction rate with efficient burning based on standard parameters. A turbulent intensity of 10% for both the inlets is used in the model.

3. Results and Discussion

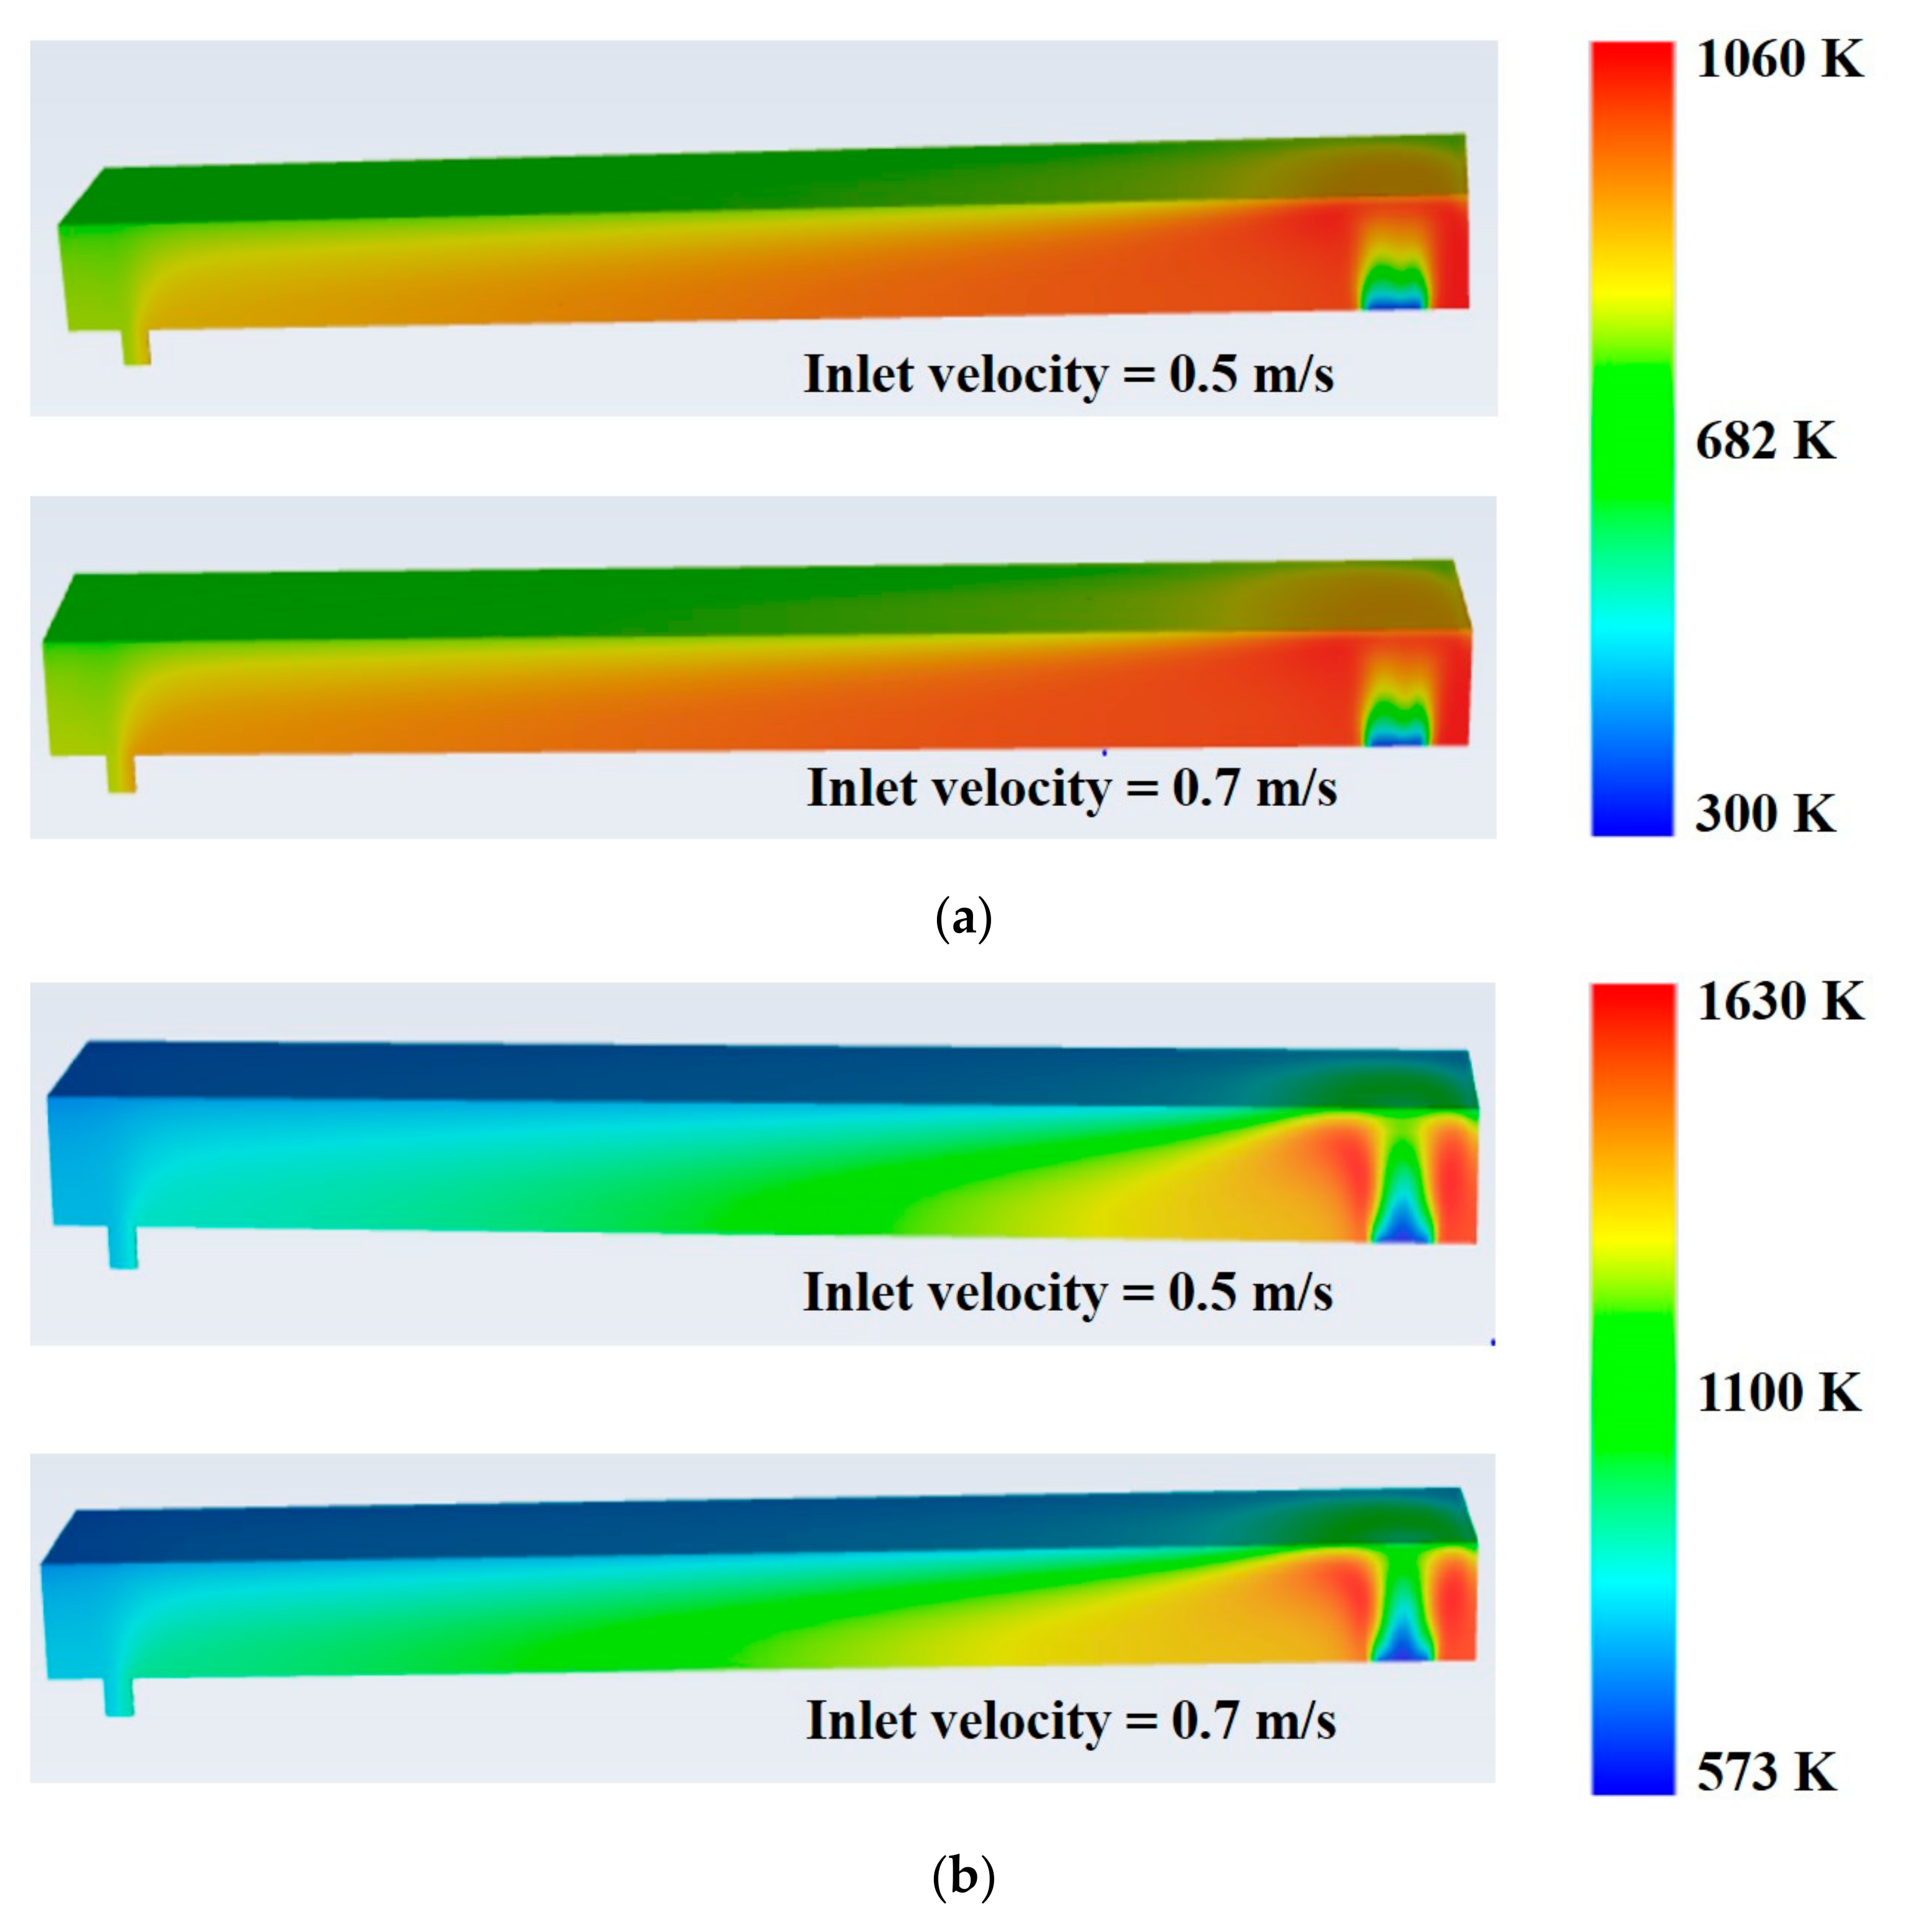
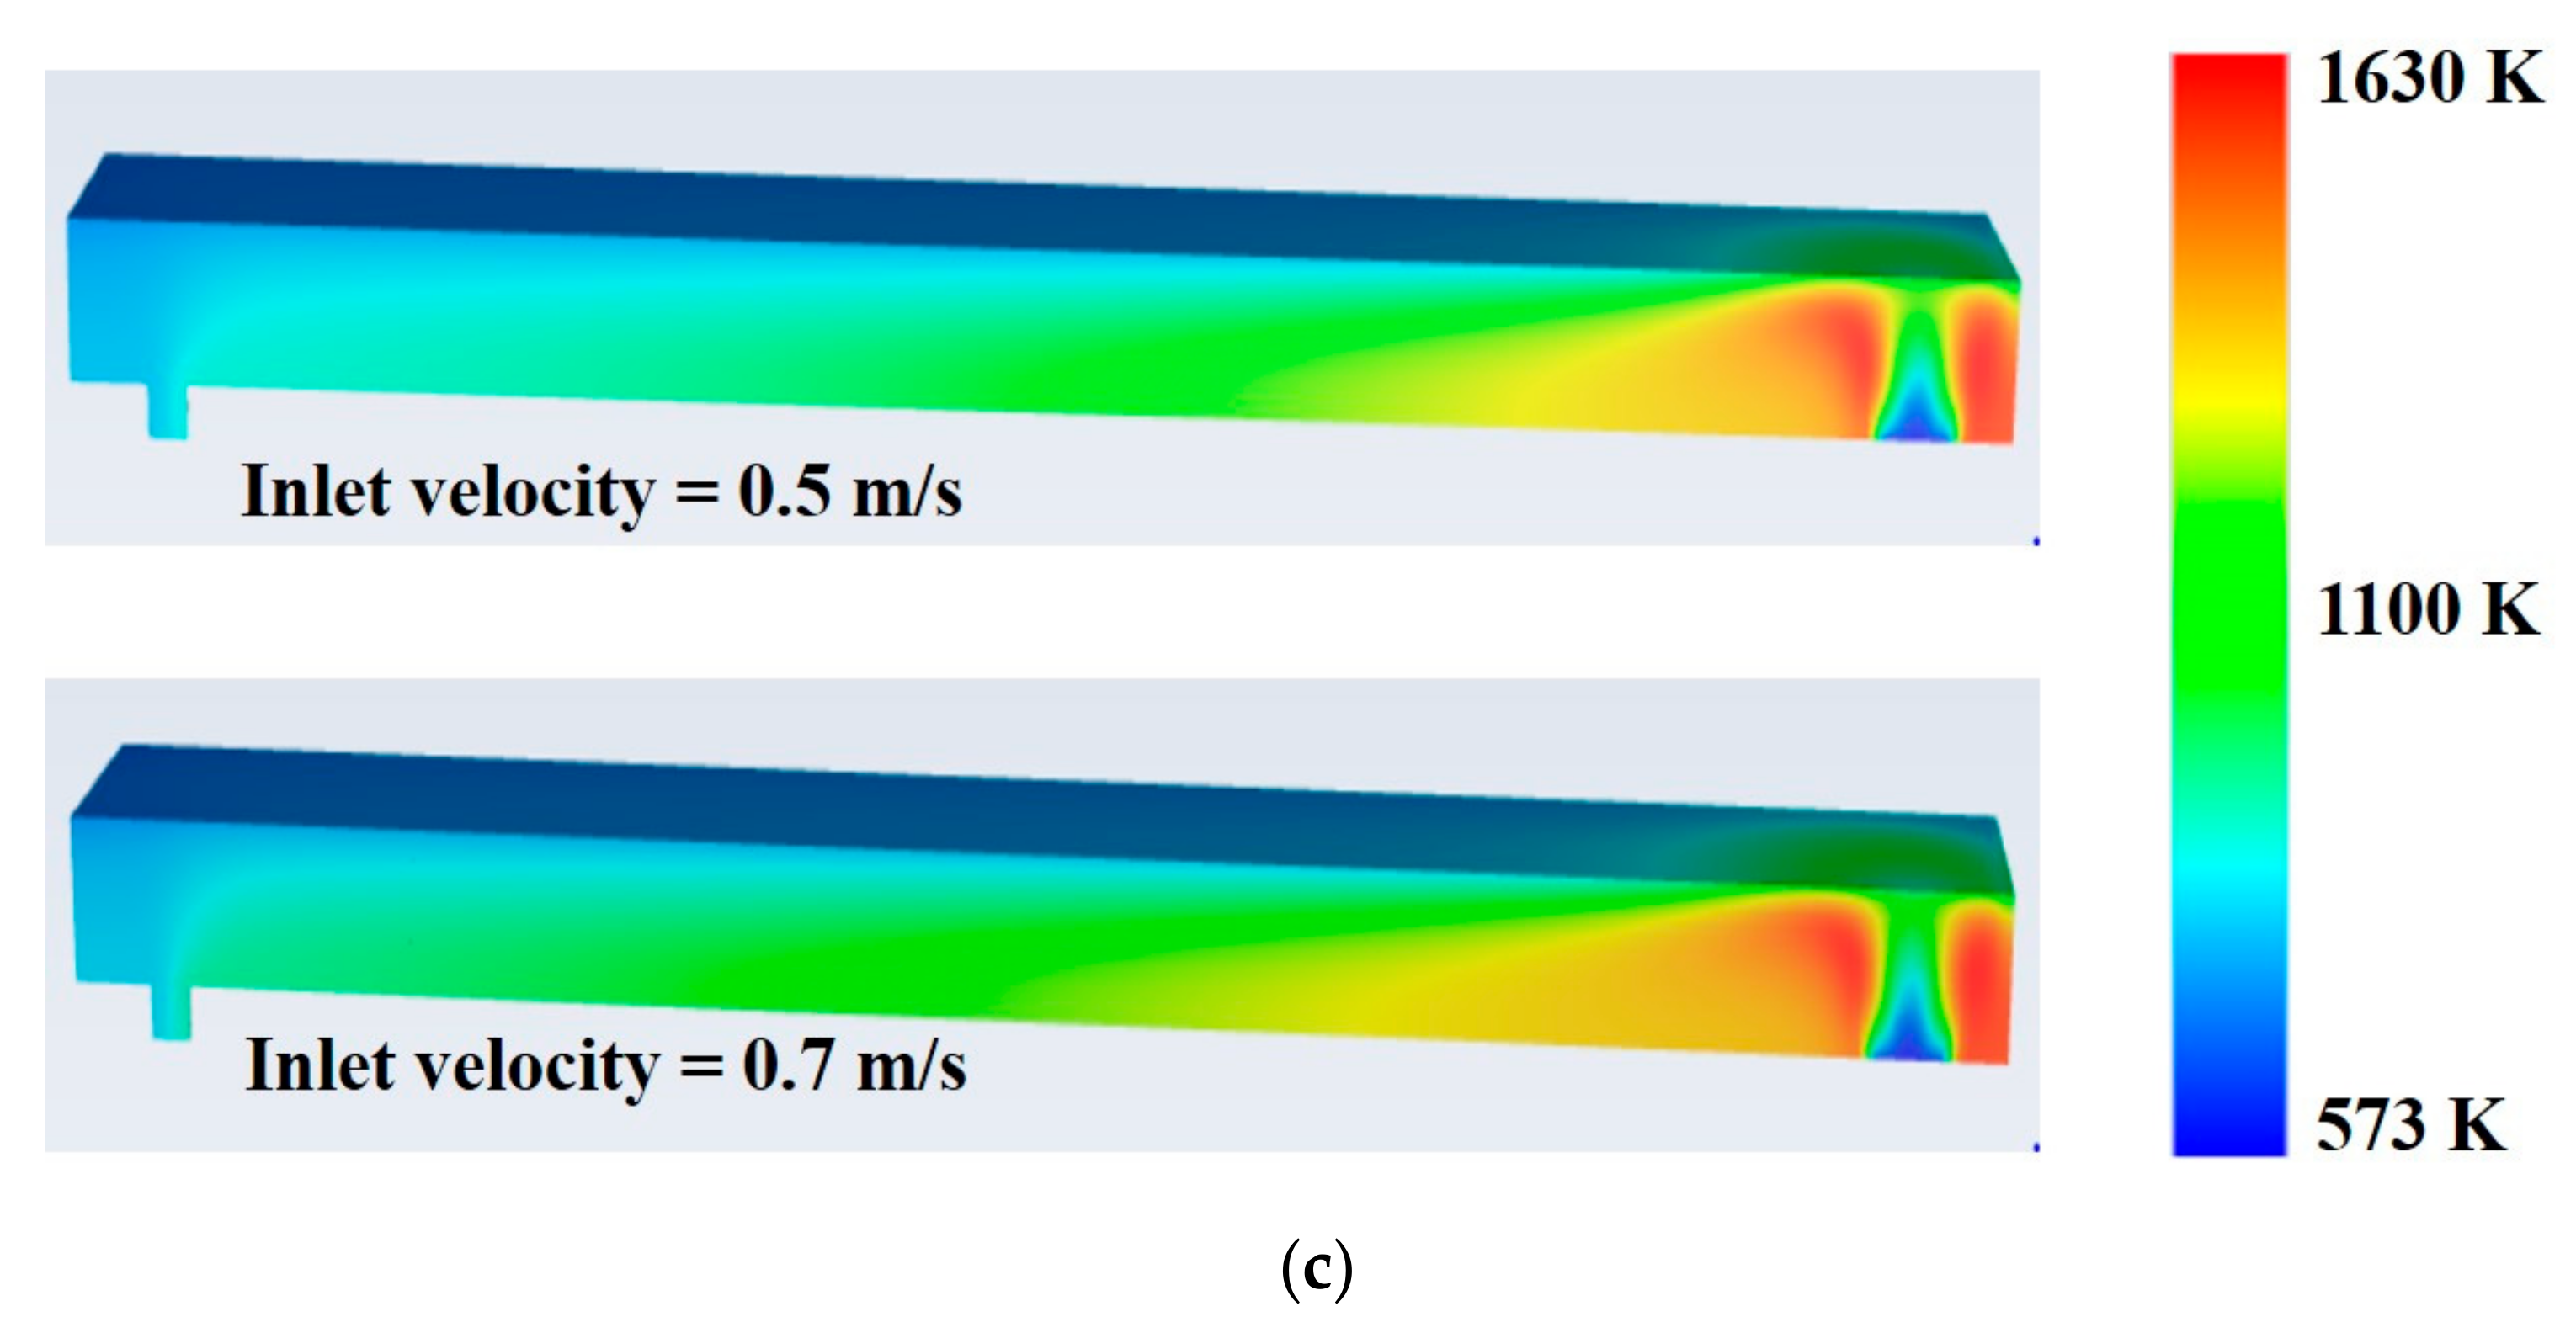
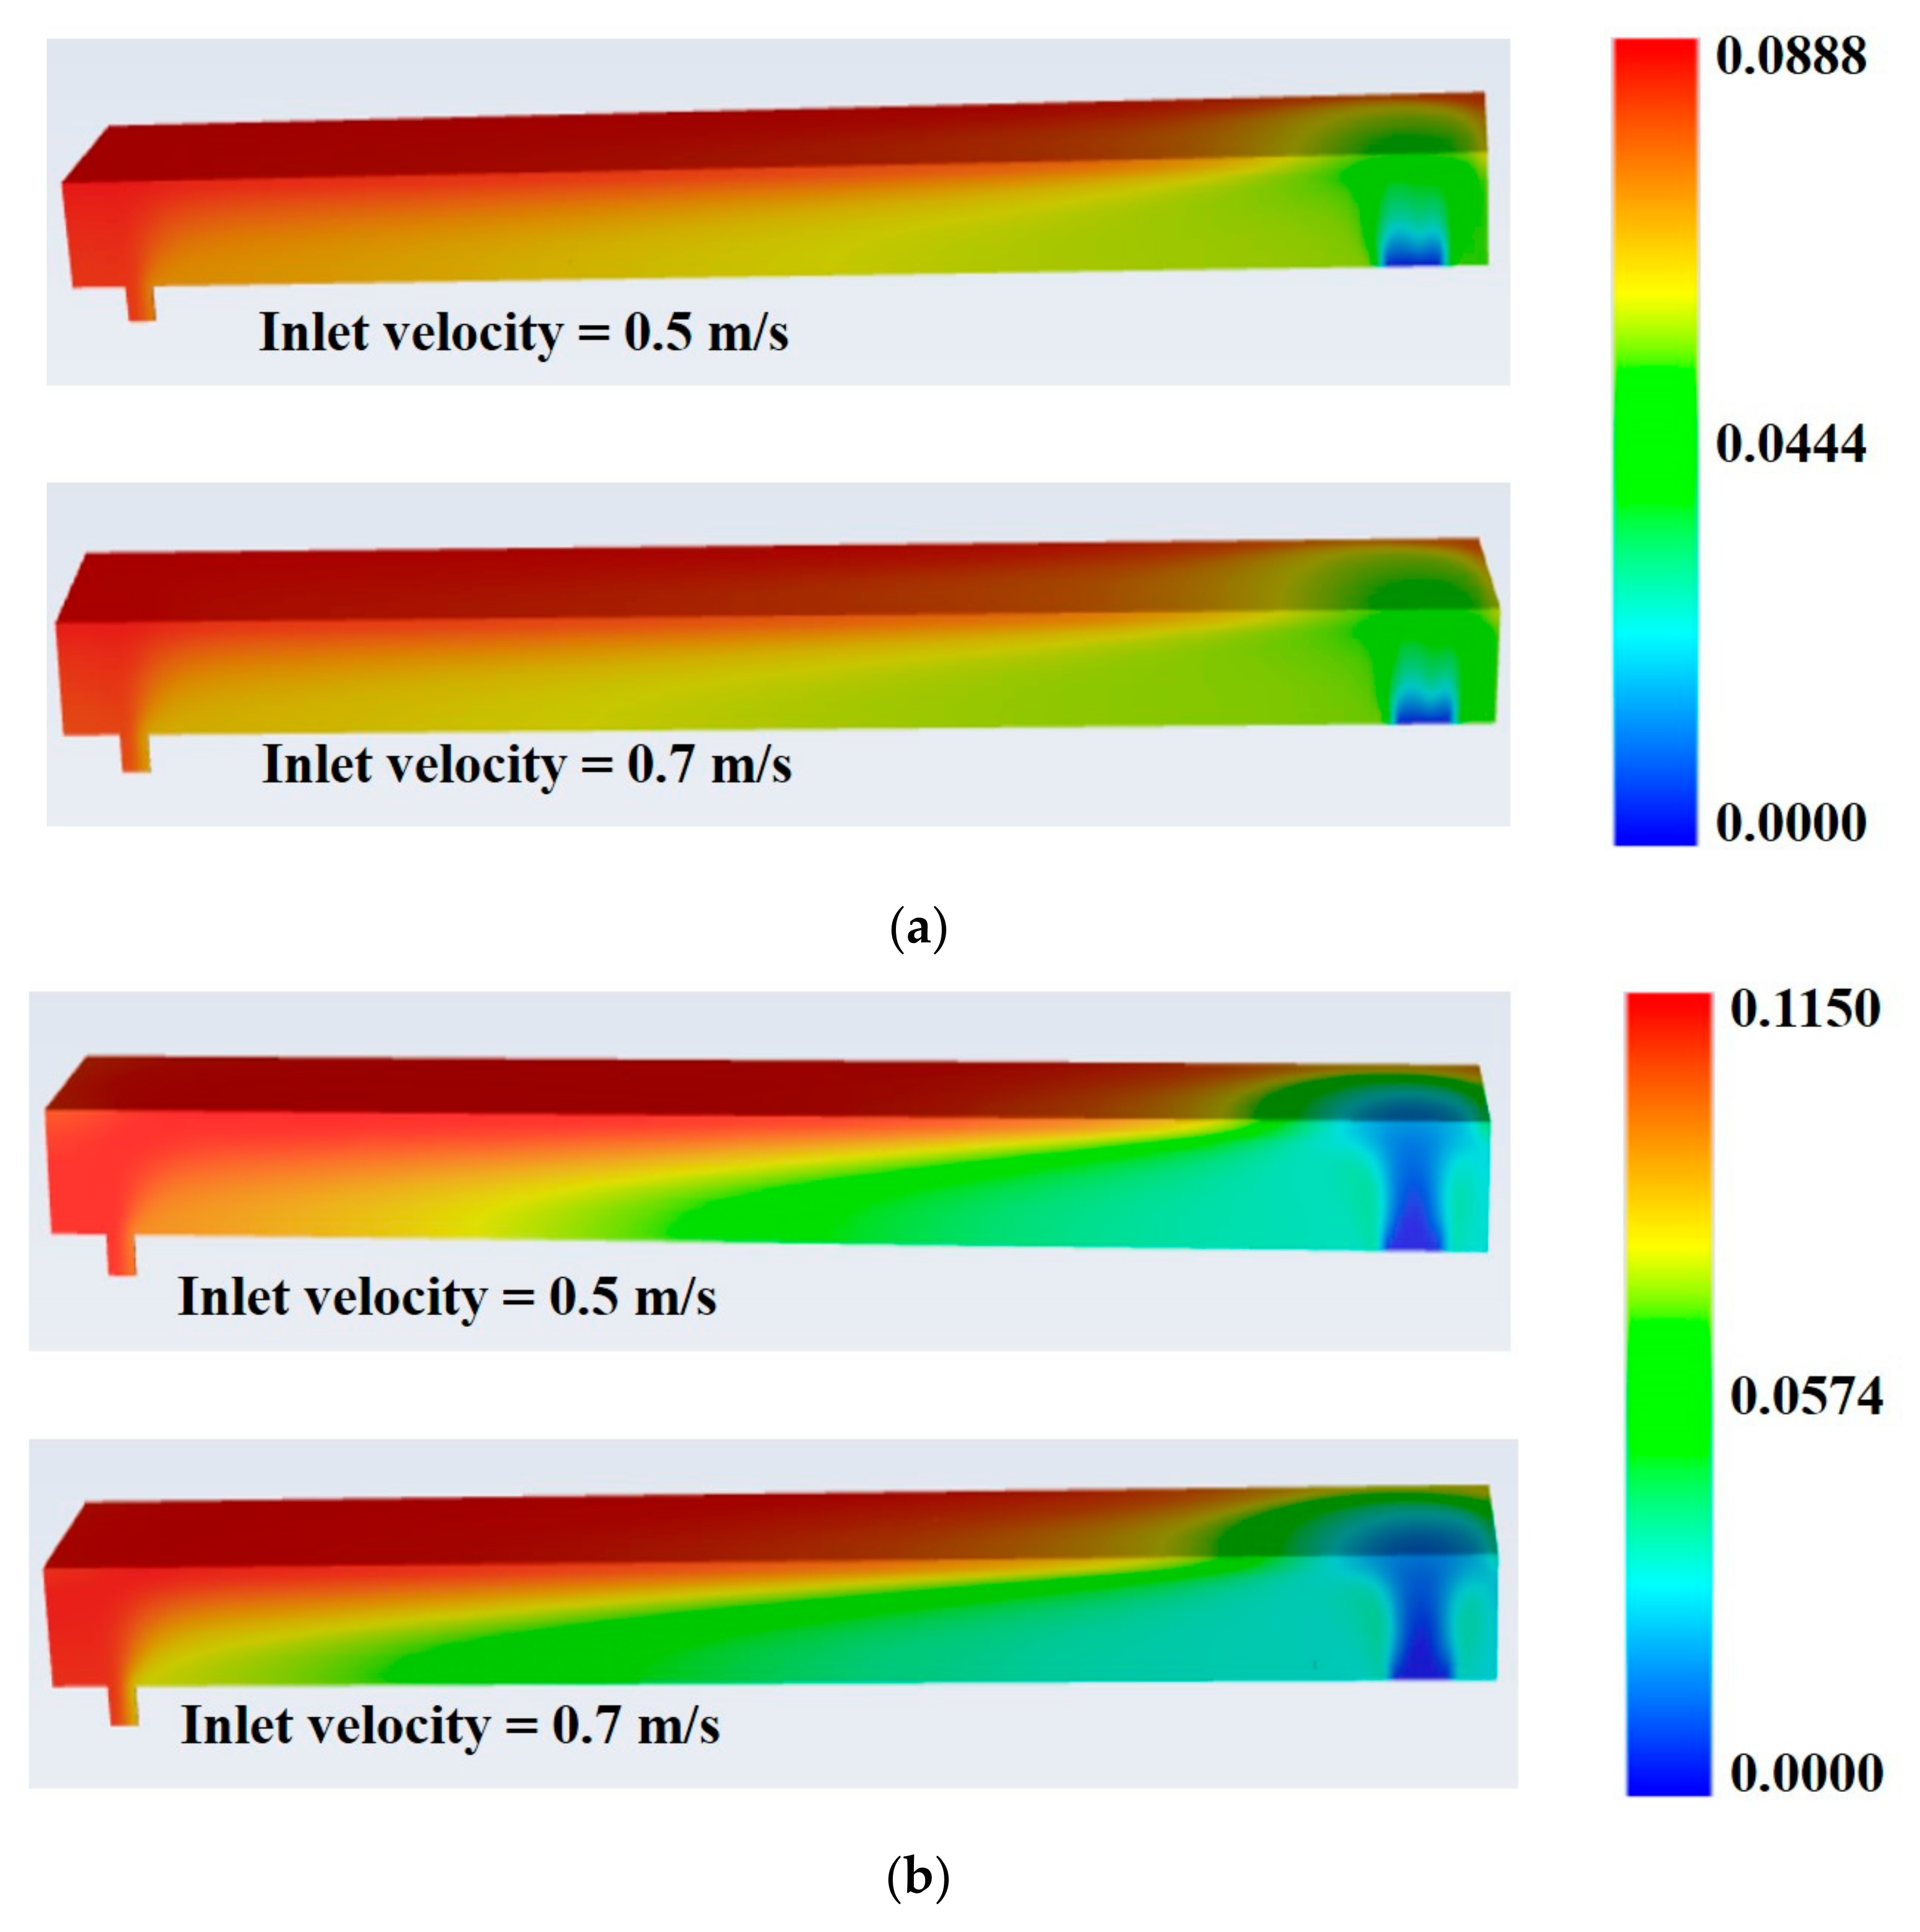
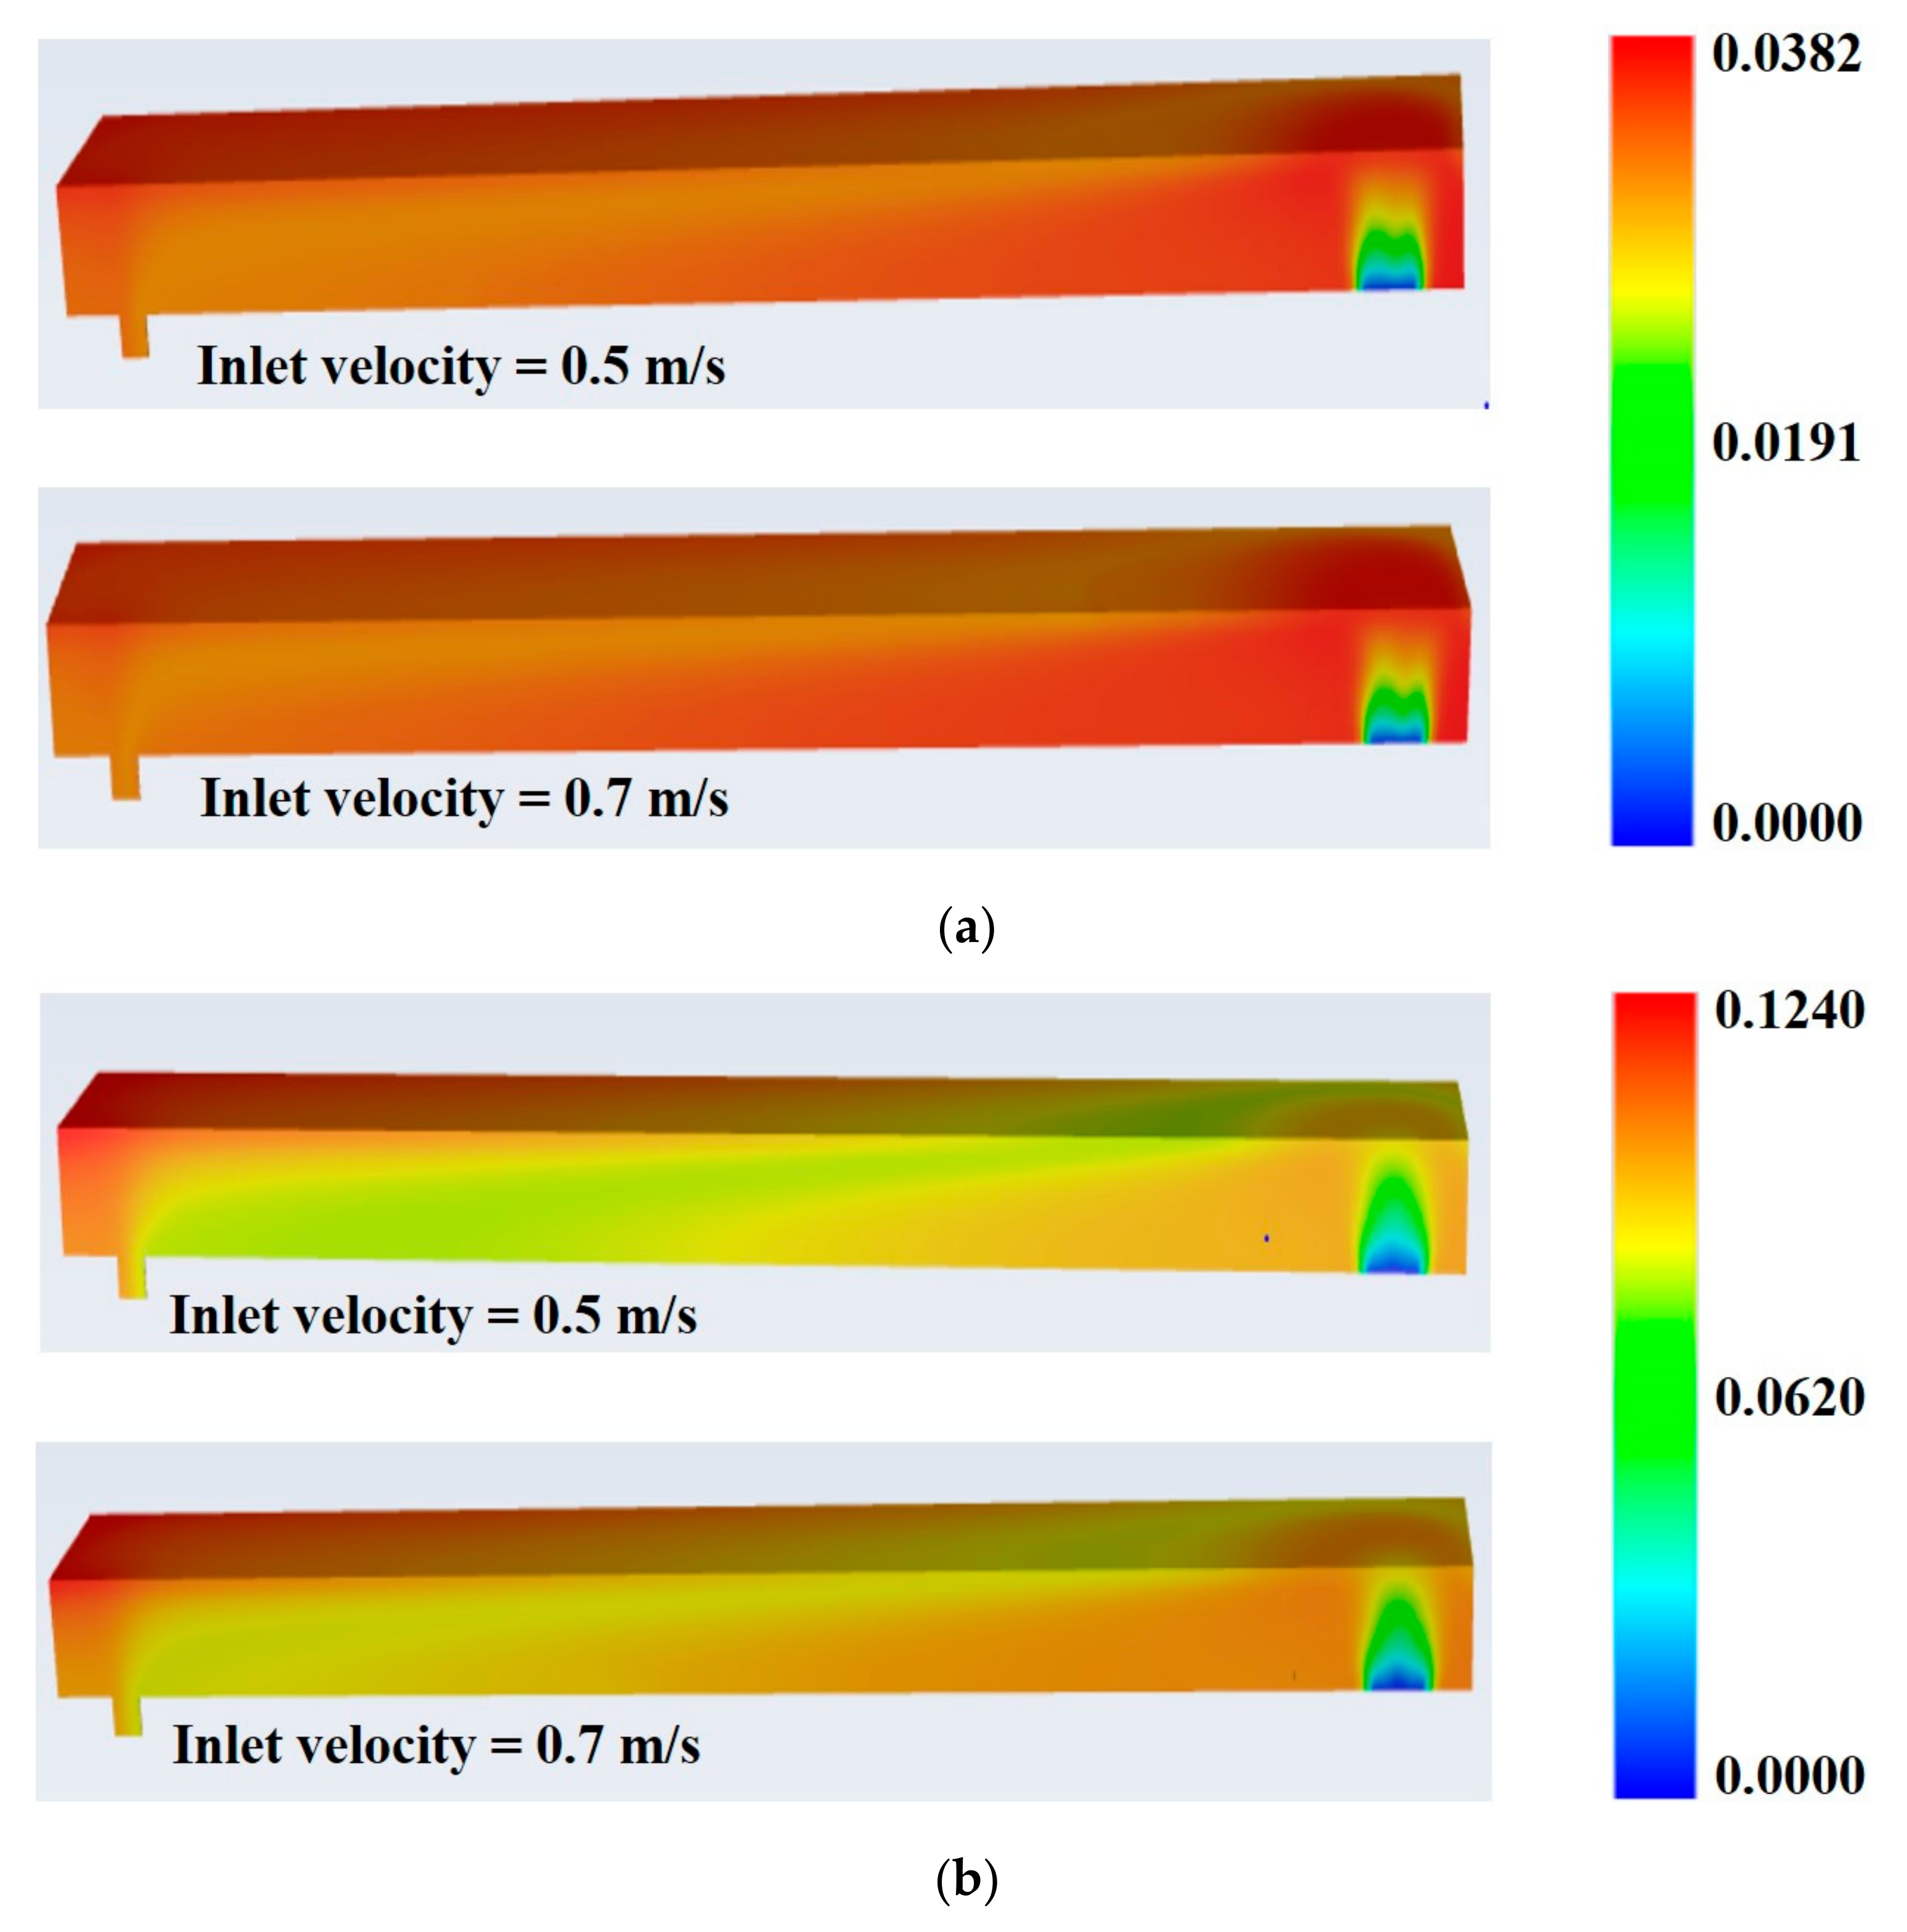
This section includes results obtained from the detailed simulations of the model as well as interpretation of the results with analytical discussion. A description of the three distinct cases based on feed compositions and velocities used in this work is given. Simulation results are discussed with the help of 3D contours and line plots. In the end model results are compared with the data obtained from published literature to authenticate the model predictions and presented in the form of a bar chart. Results obtained from CFD simulations of the proposed combustor design are presented and discussed in this section. As mentioned in the preceding section, for the combustor simulations, three distinct cases were examined. Case I considered pure natural gas as a fuel, entered through air (outer) and fuel (inner) inlets along with air as the oxidizer. Maximum and average temperature within the combustor, reached 1050 K and 884 K, respectively, for 0.5 m/s inlet velocity; whereas, 1060 K and 908 K were reached for 0.7 m/s. Area weighted average of CO2 at the combustor outlet was found to be 8.4% and 8% at 0.5 m/s and 0.7 m/s inlet velocity, respectively. Contours of temperature, CO2 mass fraction, and H2O mass fraction are presented in Figure 5a, Figure 6a and Figure 7a, respectively.
A summary of maximum, average, and outlet temperatures within the combustor as well as the area weighted average of the CO2 mass fraction at the combustor outlet is presented in Table 5. It can be seen that maximum temperature observes a greater increase from case I to case II and III, whereas average and outlet temperatures vary less sharply between case I and case II and III. This can be explained by the fact that in case II and III hydrogen is combusted with NG and being more reactive it gets consumed in the first part of the reactor (near inlet). In case I, NG combustion is less violent than hydrogen due to a slower reaction rate than hydrogen. In the case of NG + H2 (case II and III), combustor temperature observes a maximum increase near the inlet and then drops sharply. Higher temperature near the inlet is attributed to hydrogen combustion whereas a sharp decrease after the mid-length of the combustor is attributed to NG combustion. A slight increase in the combustor maximum, average, and outlet temperature is observed with increasing inlet velocity. This could be explained by the fact that at higher velocity reactant mixing improves due to the increased turbulence, thereby increasing the rate of the combustion reaction. A significant increase in combustor temperature is observed in case II and case III compared to case I. In case I, where no AOG is utilized and only natural gas is used as a fuel, a lower temperature and CO2 at the outlet is observed. Whereas, in case II and case III, where AOG is utilized as pure hydrogen (case II) and hydrogen + water (case III), a higher temperature and CO2 fraction is observed indicating an increased combustor efficiency with AOG utilization. There is negligible difference in temperature and CO2 fraction between case II and case III, indicating the presence of water in AOG does not have significant impact on the combustor efficiency.
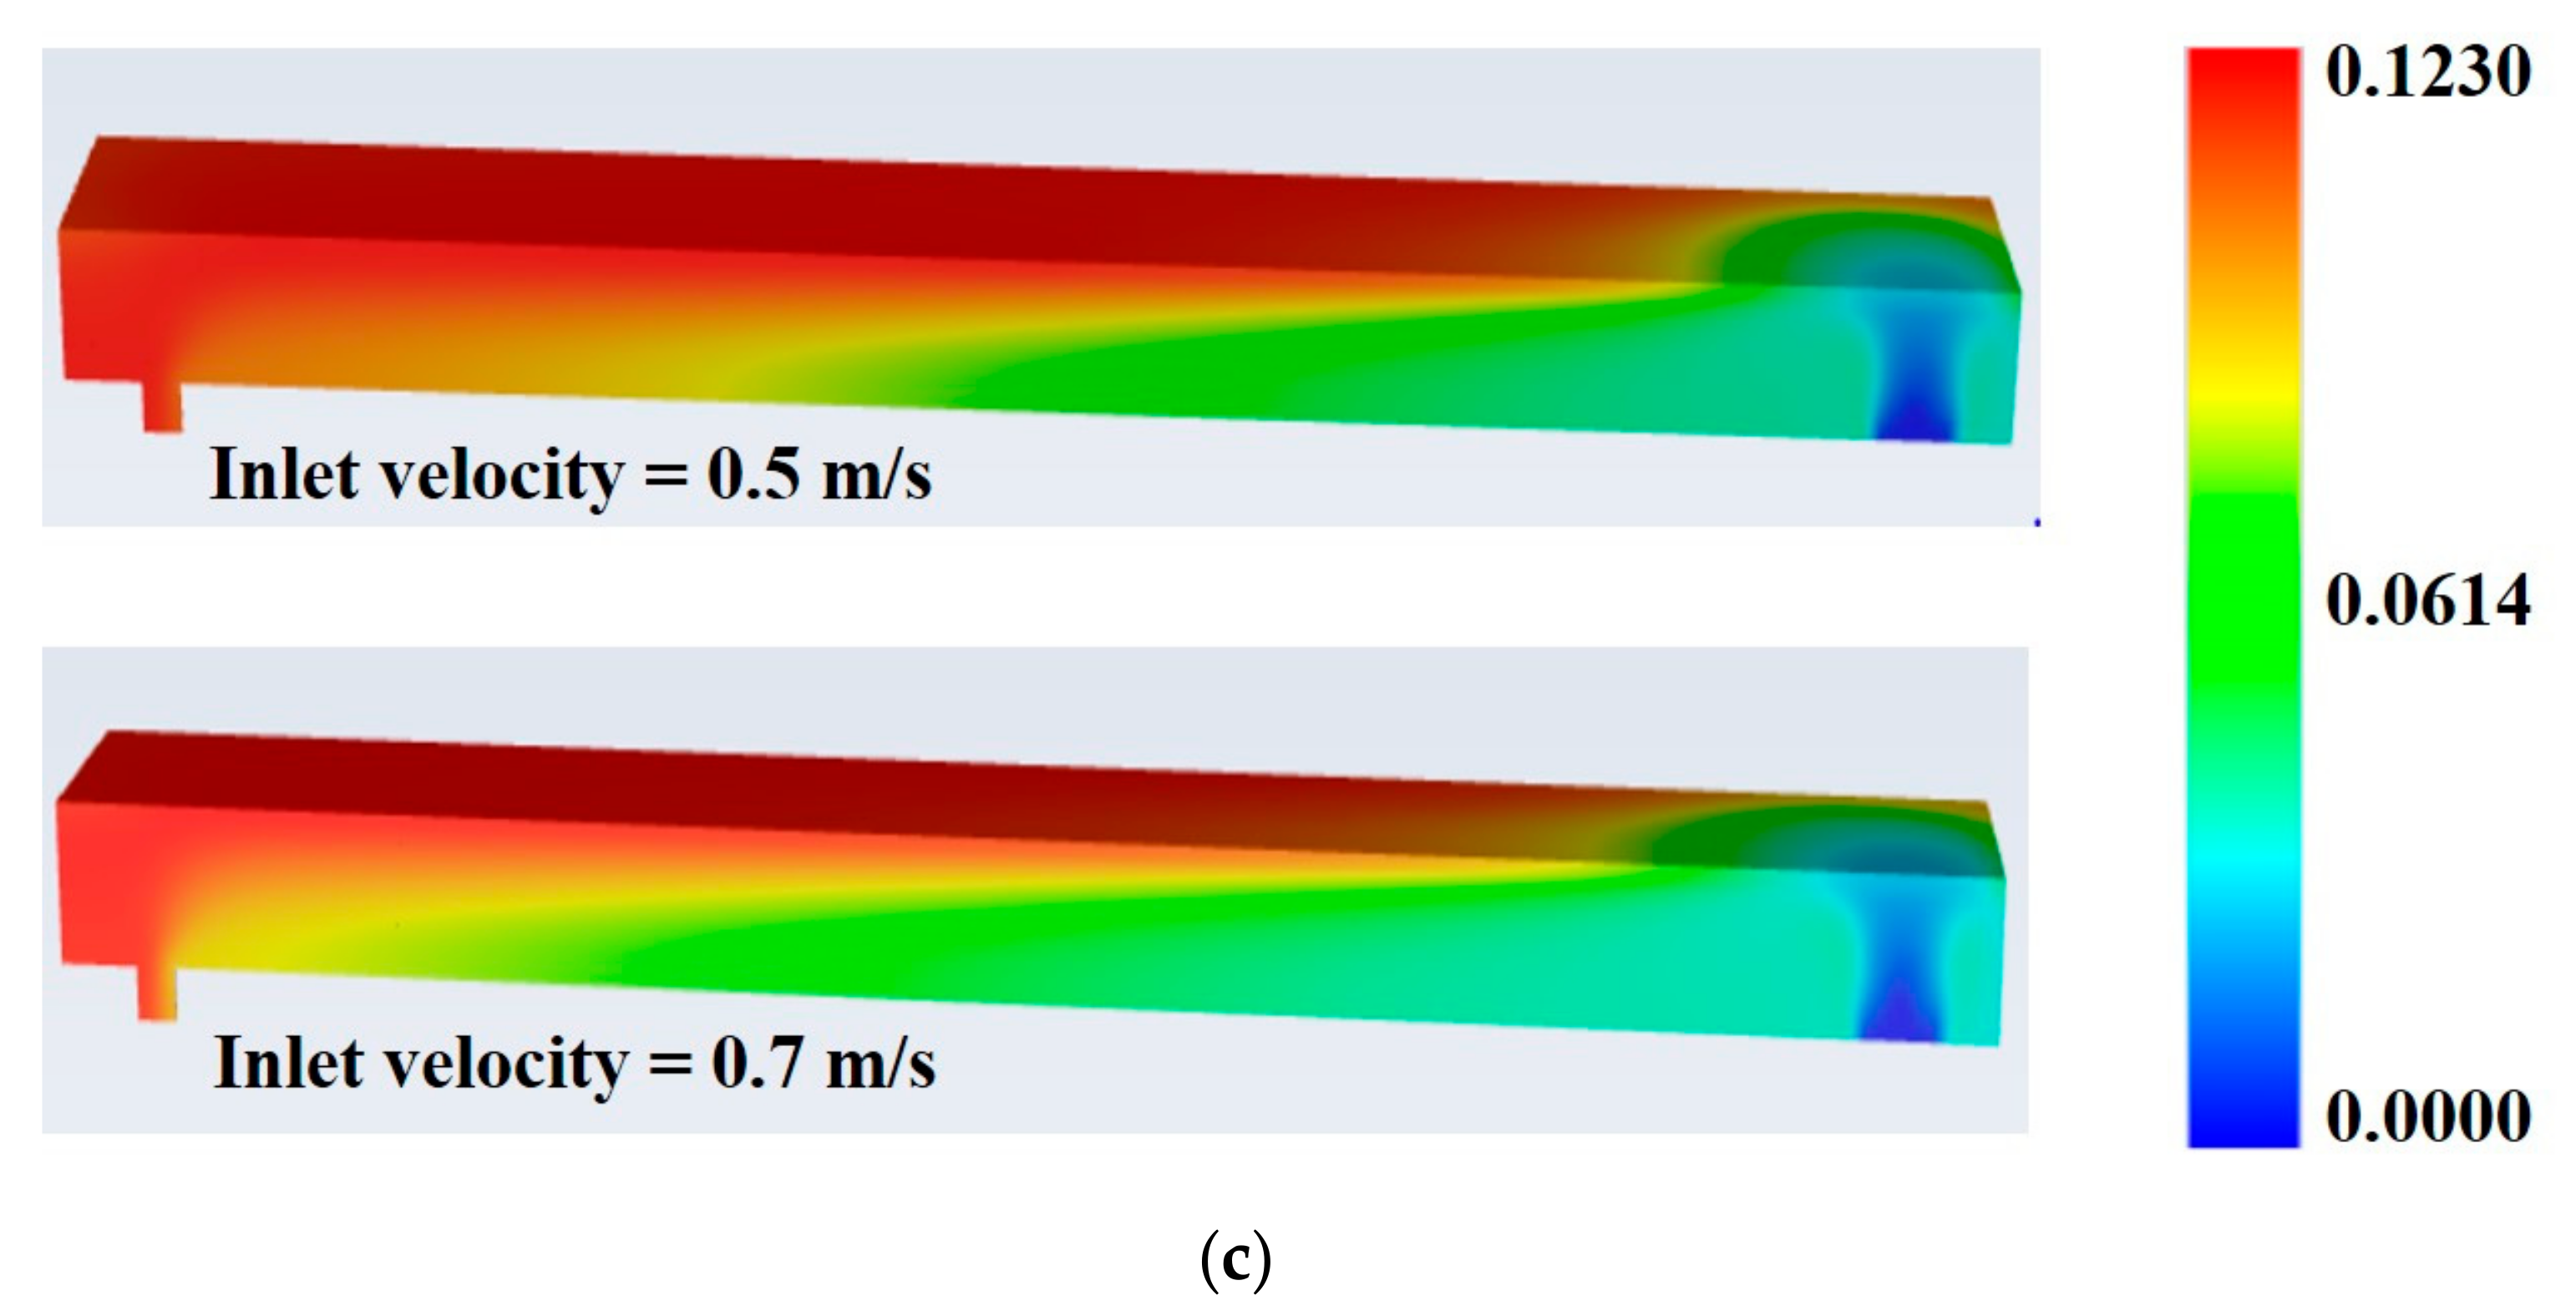
In case II, hydrogen was used as a fuel from the AOG using a mixture of natural gas and air (as oxidizer). The AOG stream containing hydrogen entered through the fuel (inner) inlet (Figure 3). Maximum and average temperature in the combustor approached 1601 K and 1014 K, respectively, with an inlet velocity of 0.5 m/s, while it approached 1636 K and 1072 K, respectively, with an inlet velocity of 0.7 m/s. The area weighted average of CO2 at the combustor outlet reached 11.3% and 10.9% with inlet velocities of 0.5 m/s and 0.7 m/s, respectively. Contours of temperature, CO2 mass fraction, and H2O mass fraction are presented in Figure 5b, Figure 6b and Figure 7b, respectively. In case III, the combustor operation was studied by simulating AOG containing hydrogen and water vapors entering the fuel (inner) inlet (Figure 3) with NG + Air mixture entering the air (outer) inlet (Figure 3). Hydrogen and NG were modeled as fuel while air was an oxidizer. Maximum and average temperatures within combustor turned out to be 1613 K and 1018 K, respectively, at 0.5 m/s inlet velocity and 1647 K and 1078 K, respectively, at 0.7 m/s inlet velocity. The area weighted average of CO2 was found to be 11.6% and 10.6% at 0.5 and 0.7 m/s inlet velocity, respectively. Contour plots of temperature and CO2 mass fraction are presented in Figure 5c and Figure 6c. Since water is present in the feed, its contours are not included in the plots. Inlet velocity in all the three cases was kept the same for inner and outer inlets i.e., for AOG and NG + Air mixtures.
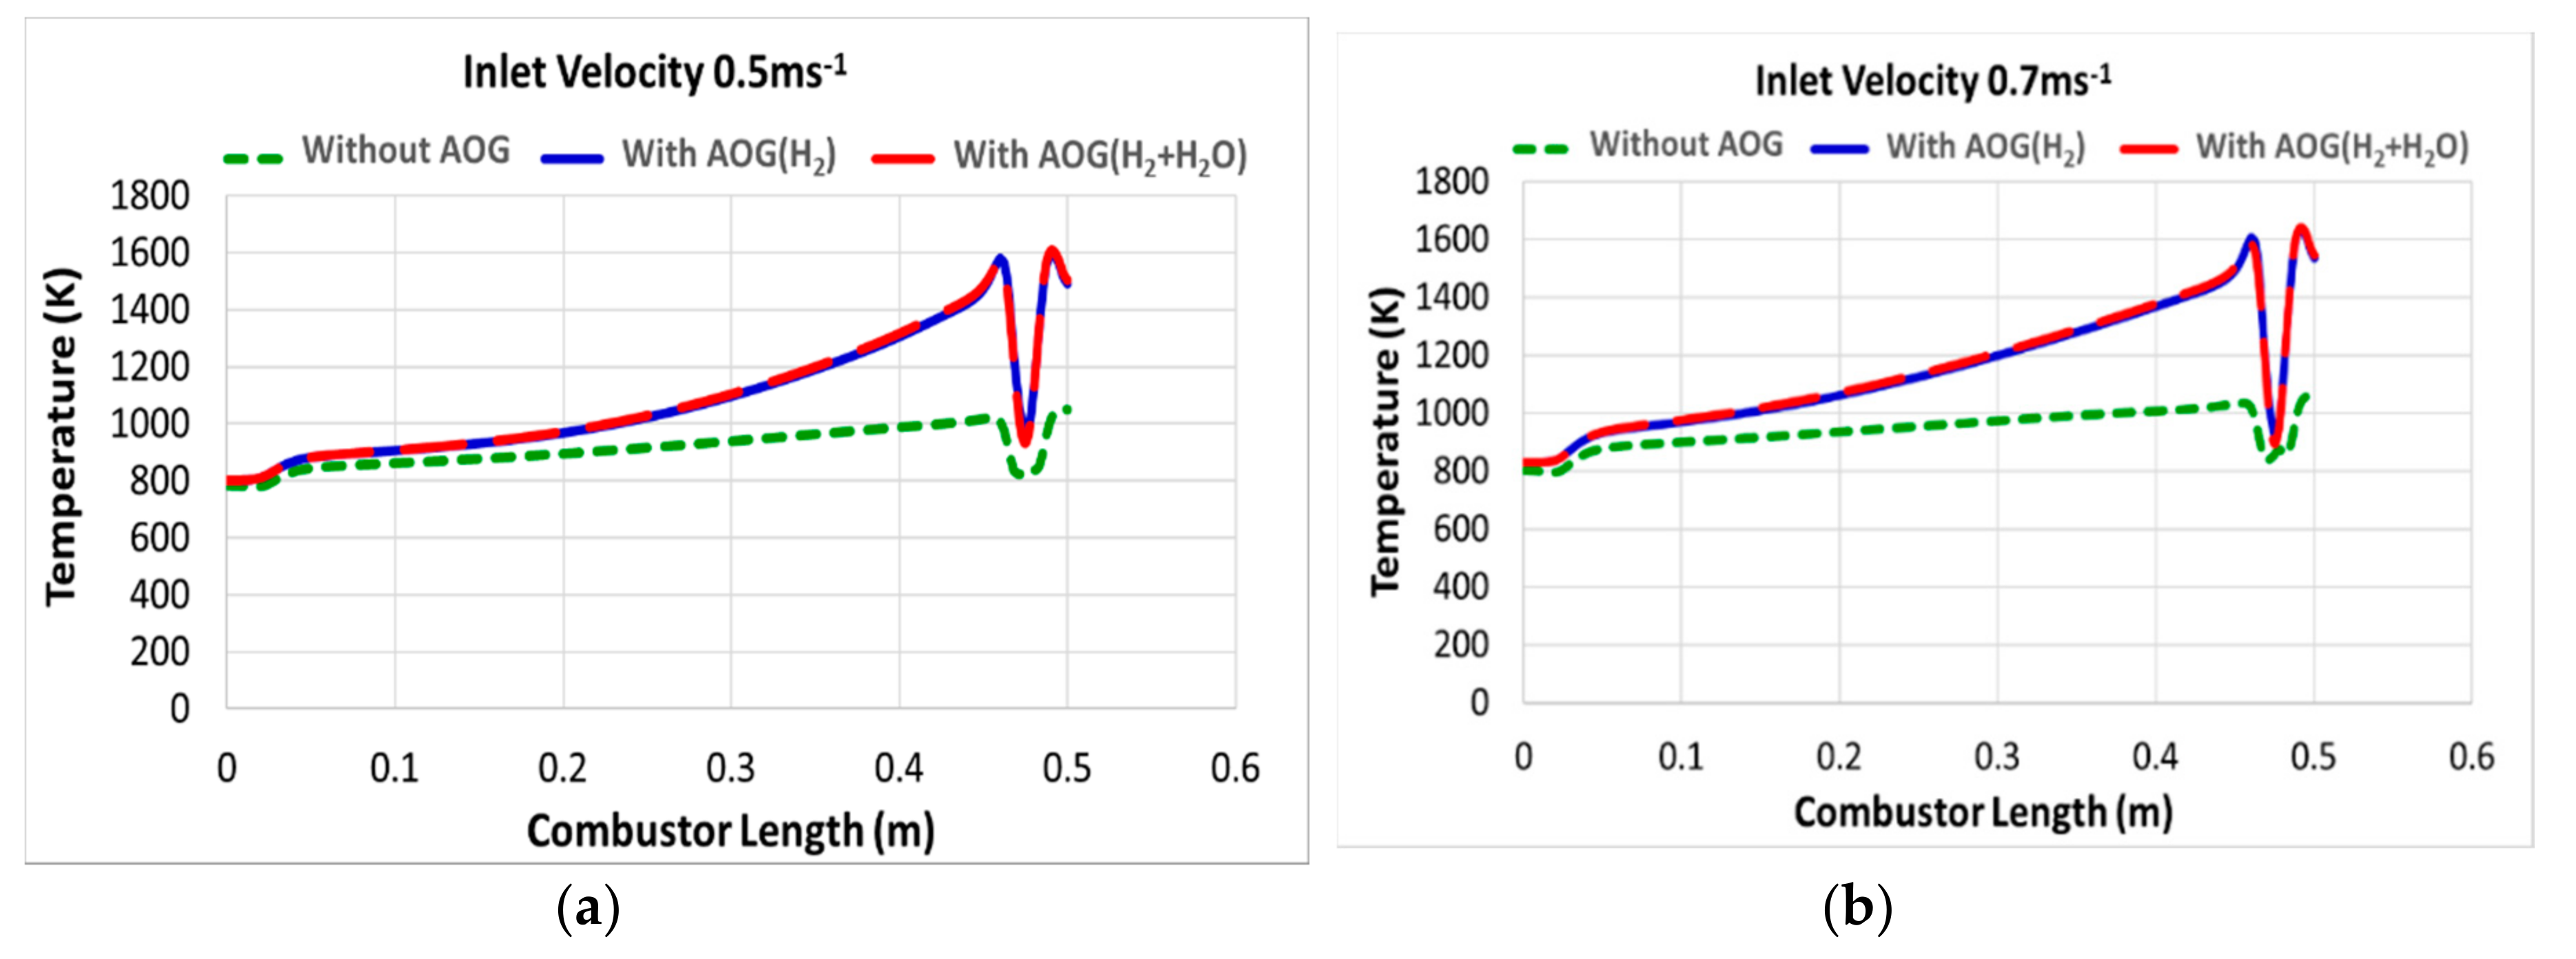
Temperature variation across the combustor length is plotted as line plots and presented in Figure 8a,b for 0.5 m/s and 0.7 m/s inlet velocity, respectively. A clear increase in temperature across the length of the combustor can be seen with AOG utilization (case II and case III) compared to natural gas alone (case I) used as a fuel. Again, the presence of water shows no noticeable influence on the combustor temperature as indicated by the plots in Figure 8.
Figure 9a,b show line plots of CO2 mass fraction along the combustor length for 0.5 m/s and 0.7 m/s inlet velocity, respectively. It can be seen that without AOG utilization (naturel gas fuel), CO2 steadily increases along the length. With AOG utilization (case II and case III) in the beginning (near the inlet), CO2 fraction is low which sharply increases at about half-way along the combustor length. Hydrogen, being more reactive than natural gas, grabs all the oxygen and forms water during combustion indicated by the lower CO2 production in the first half of the combustor length. Once hydrogen is consumed, natural gas starts to react with the remaining oxygen forming CO2 (and water) indicated by a sharp increase in CO2. A slightly higher CO2 production with water present in AOG is explained by the fact that water tends to suppress the hydrogen reactivity causing the natural gas to react with the oxygen forming CO2.
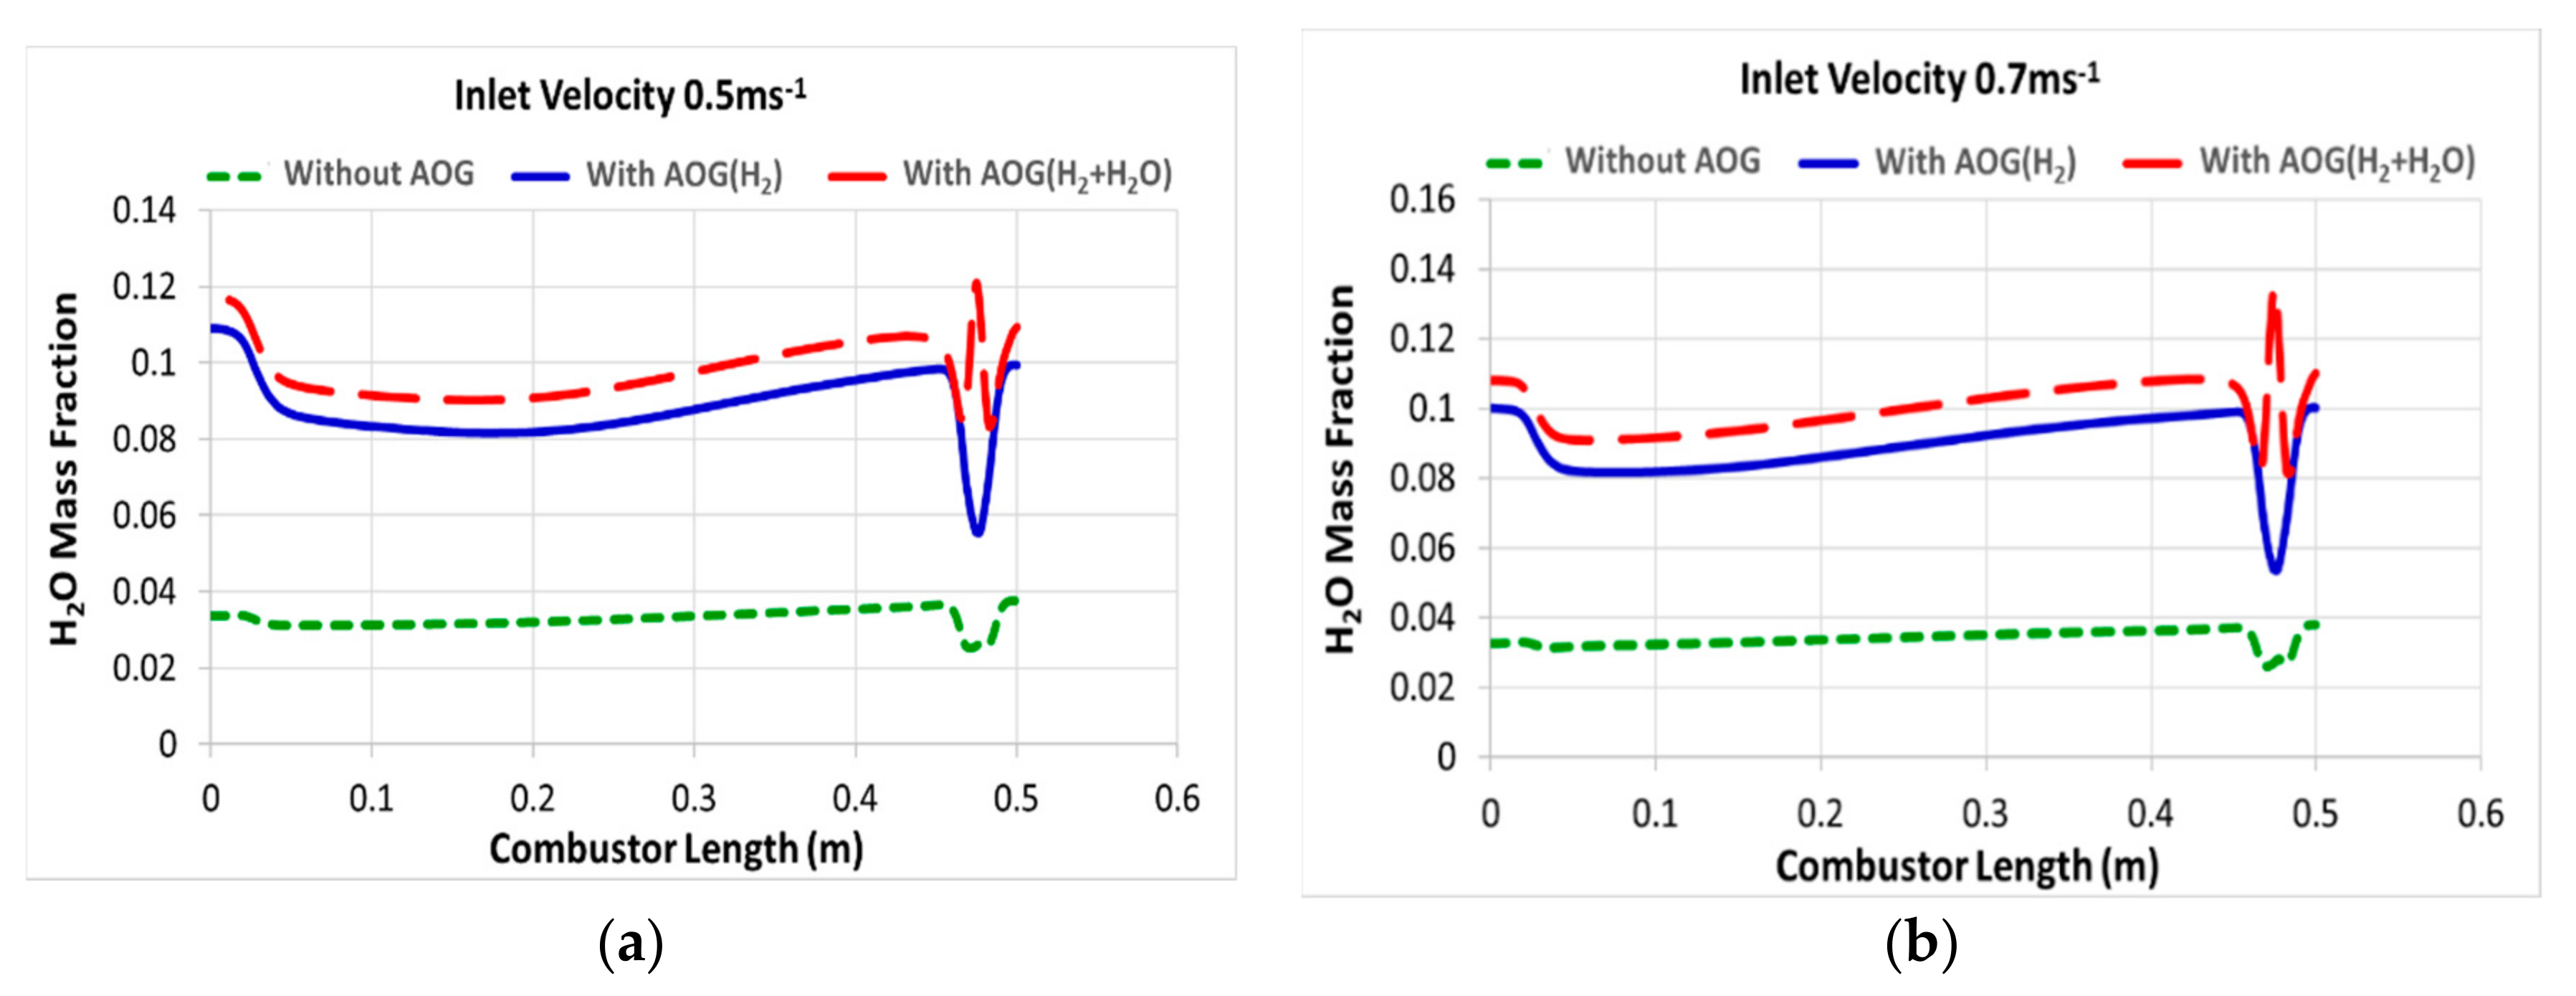
Plots presented in Figure 10a,b show variation of water along the combustor length at 0.5 m/s and 0.7 m/s inlet velocity, respectively. Plots in Figure 10 are self-explanatory i.e., more water is formed with AOG due to hydrogen oxidation (case II) and more water present in feed (case III) gives rise to higher fraction of H2O in the combustor. In case I where only natural gas is used as a fuel, the amount of water formed is low compared to the other two cases. Case II, where AOG is comprised of pure hydrogen, forms higher quantities of water compared to case I. The maximum production of water in case III is due to presence of water in the AOG feed which adds up to the water formed during the combustion of hydrogen.
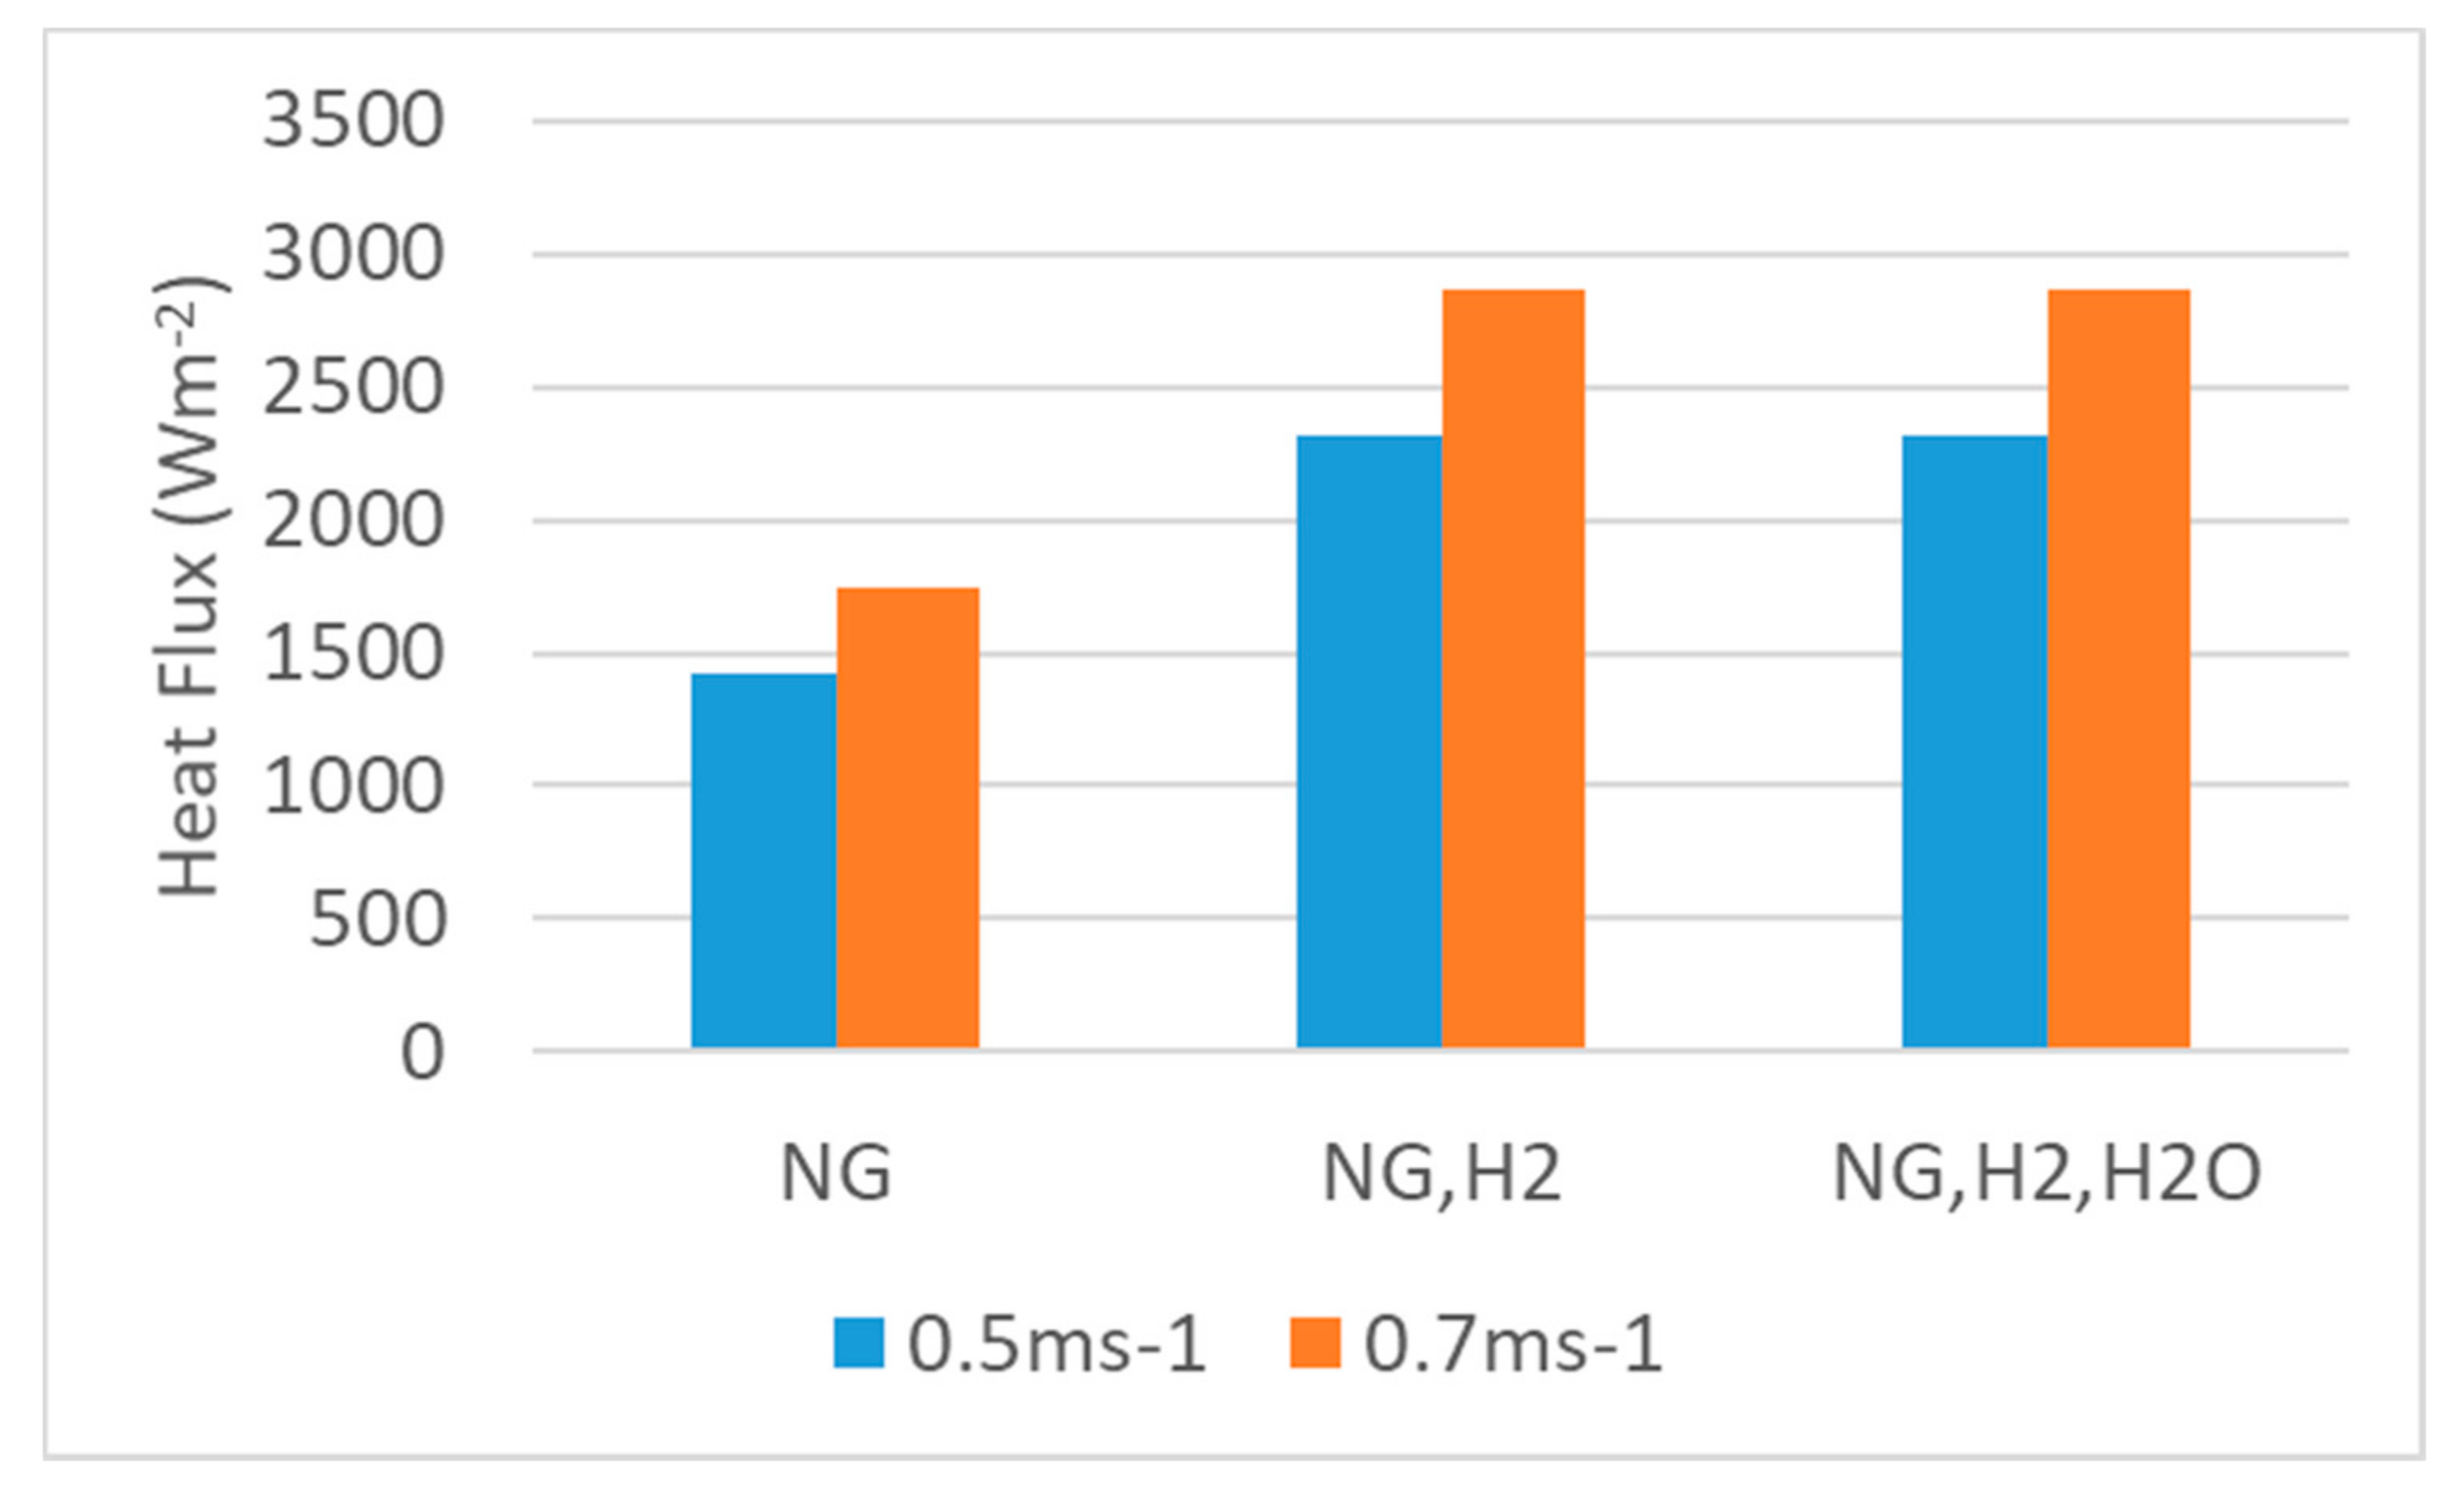
Figure 11a,b show velocity distribution along the length of the combustor for all the three cases at 0.5 m/s and 0.7 m/s inlet velocity, respectively. A lower velocity observed in the case of AOG utilization can be explained by the fact that in the case of AOG, more reactants are present interacting more frequently thereby increasing resistance to flow. This increased resistance to flow gives rise to a decrease in velocity as indicated by the line plots in Figure 11. One of the main objectives of this work is to quantify the amount of heat dissipated through the top wall (shared with the reformer) of the combustor with AOG utilization. This heat from the top wall is utilized by the endothermic reforming process for the online hydrogen generation. Figure 12 shows a comparison between heat fluxes through the top wall (to the reformer) for all the three cases. Bar charts presented in Figure 12 clearly indicate a higher thermal flux in the case of AOG utilization, compared to when only natural gas is used as a fuel. Maximum heat flux with AOG utilization is found to be 2311 W/m2 and 2859 W/m2 at inlet velocities of 0.5 and 0.7 m/s, respectively. This proves that AOG utilization is beneficial in terms of saving fuel (natural gas in this case) and increasing thermal efficiency of the combustor. Results presented in form of contour plots (Figure 5, Figure 6 and Figure 7), line plots (Figure 8, Figure 9, Figure 10 and Figure 11), and a bar chart (Figure 12) clearly indicate the superiority of 0.7 m/s feed inlet velocity over 0.5 m/s regarding improvement in the thermal efficiency of the combustor.
The mathematical model priorly validated with authentic data, obtained either through experiments or previously published research work, is always more reliable. Combustion chemistry is complex and finding data matching the exact conditions assumed in this work is difficult. Carrying out experiments to generate the validation data is beyond the scope of this work. Hence, the model is compared with published data generated with reasonably similar operating conditions (e.g., feed ratio, operating temperature) assumed in the present work. Average and maximum temperature in the combustor were compared with published data derived from [24]. Comparison is presented in terms of bar charts in Figure 13, which shows a very good match between the data obtained through simulations in the present work and those obtained from reference [24].

4. Conclusions and Outlook

In the present research work, combustor performance, within an integrated combustor-reformer-fuel cell setup, is evaluated using anode off-gases from a high temperature solid oxide fuel cell in combination with hydrocarbon fuel (e.g., natural gas). The aim was to prove the superiority of the AOG utilization compared to the conventional fuel utilization in an integrated setup. From the detailed simulation results presented in the previous section (Section 3) some important conclusions were drawn and are presented below:
  • Average temperature of the combustor is found to have increased by 130 K at 0.5 m/s inlet velocity and 164 K at 0.7 m/s inlet velocity with AOG utilization (case II).
  • When increasing the feed temperature, combustion proceeds more efficiently.
  • AOG utilization causes a 3% increase in maximum CO2 production and a 6.8% increase in water content.
  • A saving of up to 18% in combustor fuel (NG) is affected by AOG utilization along with conventional fuel within the integrated combustor.
  • A 38% and 39% increase in the heat flux from the top wall of the combustor attached to the reformer is observed at 0.5 m/s and 0.7 m/s inlet velocity, respectively.
  • Maximum and average combustor temperatures slightly increase with increasing inlet velocity of the feed gases.
  • Feed inlet velocity of 0.7 m/s is found to be superior to 0.5 m/s regarding improvement in thermal efficiency of the combustor.
  • Simulation results are compared with published data and are found to be in good agreement.

Future Work

In the present model a fixed reformer temperature was used in convection boundary conditions which needs to be improved to incorporate variations in combustor–reformer wall temperature and heat transfer coefficient as a function of temperature. Moreover, this work assumes non-catalytic combustion which is not as efficient as catalytic combustion. Hence, it is proposed to update the model to incorporate catalytic combustion by employing a more detailed surface reaction mechanism. To obtain more uniform temperature in the combustor, multiple inlets for AOG could be used. Moreover, the geometrical design of the combustor could also be improved further using configurations other than rectangular e.g., cylindrical configuration. ANSYS FLUENT® has the possibility to customize the simulation procedure using user defined functions (UDFs) which greatly enhance the capabilities of the modeling procedure regarding the accuracy of predictions. Hence, a more elaborate model is proposed in which an ANSYS UDF could be employed to calculate temperature dependent properties and kinetic parameters. In the present work, only the combustor component of the CRP system is simulated which can further be improved by incorporating the reformer part along with the combustor.

Author Contributions

S.A.K.: Data creation, investigation, visualization, formal analysis, writing—original draft; M.W.T.: Conceptualization, methodology, supervision, software, writing—review & editing; U.A.: Conceptualization, supervision, writing—review & editing. All authors have read and agreed to the published version of the manuscript.

Funding

This research received no external funding.

Acknowledgments

Software support from the Department of Mechanical Engineering, University of Engineering and Technology, Lahore is gratefully acknowledged.

Conflicts of Interest

The authors declare no conflict of interest.

List of Symbols

xi, xjdirection vectors, [-]
ui, ujvelocity vector, [m/s]
Ppressure, [Pa]
gigravitational force, [m/s]
Fimass force, [N]
Henthalpy, [J/kg]
ktthermal conductivity, [W/m·K]
cpaverage specific heat, [J/kg.K]
Shheat source term, [W/m]
ftmass fraction
Simass source term, [kg/m2·s]
ρ density, [kg/m3]
Kturbulence kinetic energy, [m2/s2]
Gkgeneration of turbulence kinetic energy, [m2/s2]
Tfreforming temperature, [K]
Ufstack fuel utilization factor, [-]
hfHeat transfer co-efficient, [W/m2.K]
C 1 ε , C 2 ε constant, [-]
Greek symbols
σ ε turbulence Prandtl no. for ε , [-]
σkturbulent Prandtl no. for k,[-]
µviscosity, [Pa·s]
µtturbulent velocity, [Pa·s]
τ i j stress tensor, [Pa]
Εdissipation turbulence kinetic energy, [m2 s−3]
Abbreviations
CCSCarbon Capture and Storage
PEMFCPolymer Electrolyte Membrane Fuel Cell
SOFCSolid Oxide Fuel Cell
GHGGreen House Gases
HT-PEMFCHigh Temperature Polymer Electrolyte Fuel Cell
LTSLow Temperature Water Gas Shift
PLPower Law
LH ModelLangmuir Hinshelwood Model
MSRMultistage Reforming
CHPCombined Heating and Power
MS-EGCMultistage Exhaust Gas Combustion
AOGRAnode Off Gas Recycling
AOGCAnode Off Gas Combustion
CFDComputational Fluid Dynamics
O/COxygen to Carbon Ratio
NGNatural Gas
A/FAir to Fuel Ratio
AOGAnode Off Gas
k−εTurbulence model
MCFCMolten Carbonate Fuel Cell
AFCAlkaline Fuel Cell
PAFCPhosphoric Acid Fuel Cell
H/CHydrogen to Carbon ratio
SMRSteam Methane Reforming
PEMProton Exchange Membrane

References

  1. Fossil Fuels, Environmental and Energy Study Institute (EESI), Washington, DC, USA. Available online: https://www.eesi.org/topics/fossil-fuels/description (accessed on 23 June 2020).
  2. Denchak, M. Fossil Fuels: The Dirty Facts; Natural Resources Defense Council (NRDC): New York, NY, USA, 2018; Available online: https://www.nrdc.org/stories/fossil-fuels-dirty-facts (accessed on 30 June 2020).
  3. Renewable Energy, Environmental and Energy Study Institute (EESI), Washington, DC, USA. Available online: https://www.eesi.org/topics/renewable-energy/description (accessed on 25 June 2020).
  4. Hydrogen Fuel Cells, Renewable Energy, Environmental and Energy Study Institute (EESI), Washington, DC, USA. Available online: https://www.eesi.org/topics/hydrogen-fuel-cells/description (accessed on 25 July 2020).
  5. Zhang, L.; Xing, Y.; Xu, H.; Wang, H.; Zhong, J.; Xuan, J. Comparative study of solid oxide fuel cell combined heat and power system with Multi-Stage Exhaust Chemical Energy Recycling: Modeling, experiment and optimization. Energy Convers. Manag. 2017, 139, 79–88. [Google Scholar] [CrossRef]
  6. Ozcan, H.; Dincer, I. Performance evaluation of an SOFC based trigeneration system using various gaseous fuels from biomass gasification. Int. J. Hydrog. Energy 2015, 40, 7798–7807. [Google Scholar] [CrossRef]
  7. Obara, S. Dynamic-characteristics analysis of an independent microgrid consisting of a SOFC triple combined cycle power generation system and large-scale photovoltaics. Appl. Energy 2015, 141, 19–31. [Google Scholar] [CrossRef]
  8. Kupecki, J. Off-design analysis of a micro-CHP unit with solid oxide fuel cells fed by DME. Int. J. Hydrog. Energy 2015, 40, 12009–12022. [Google Scholar] [CrossRef] [Green Version]
  9. Zhang, L.; Li, X.; Jiang, J.; Li, S.; Yang, J.; Li, J. Dynamic modeling and analysis of a 5-kW solid oxide fuel cell system from the perspectives of cooperative control of thermal safety and high efficiency. Int. J. Hydrog. Energy 2015, 40, 456–476. [Google Scholar] [CrossRef]
  10. Zhang, L.; Jiang, J.; Cheng, H.; Deng, Z.; Li, X. Control strategy for power management, efficiency-optimization and operating-safety of a 5-kW solid oxide fuel cell system. Electrochim. Acta 2015, 177, 237–249. [Google Scholar] [CrossRef]
  11. Gholamian, E.; Zare, V. A comparative thermodynamic investigation with environmental analysis of SOFC waste heat to power conversion employing Kalina and Organic Rankine Cycles. Energy Convers. Manag. 2016, 117, 150–161. [Google Scholar] [CrossRef]
  12. Ebrahimi, M.; Moradpoor, I. Combined solid oxide fuel cell, micro-gas turbine and organic Rankine cycle for power generation (SOFC–MGT–ORC). Energy Convers. Manag. 2016, 116, 120–133. [Google Scholar] [CrossRef]
  13. Lee, K.; Yun, J.; Ahn, K.; Lee, S.; Kang, S.; Yu, S. Operational characteristics of a planar steam reformer thermally coupled with a catalytic burner. Int. J. Hydrog. Energy 2013, 38, 4767–4775. [Google Scholar] [CrossRef]
  14. Powell, M.; Meinhardt, K.; Sprenkle, V.; Chick, L.; McVay, G. Demonstration of a highly efficient solid oxide fuel cell power system using adiabatic steam reforming and anode gas recirculation. J. Power Sources 2012, 205, 377–384. [Google Scholar] [CrossRef]
  15. Peters, R.; Deja, R.; Engelbracht, M.; Frank, M.; Nguyen, V.N.; Blum, L.; Stolten, D. Efficiency analysis of a hydrogen-fueled solid oxide fuel cell system with anode off-gas recirculation. J. Power Sources 2016, 328, 105–113. [Google Scholar] [CrossRef]
  16. Halinen, M.; Thomann, O.; Kiviaho, J. Effect of Anode off-gas Recycling on Reforming of Natural Gas for Solid Oxide Fuel Cell Systems. Fuel Cells 2012, 12, 754–760. [Google Scholar] [CrossRef]
  17. Lee, J.Y.; Lee, P.H.; Park, C.S.; Park, B.I.; Hwang, S.S. Combustion characteristics of mixture of anode off gas and LNG in reformer. Int. J. Hydrog. Energy 2011, 36, 5181–5188. [Google Scholar] [CrossRef]
  18. Ilbas, M.; Yılmaz, İ.; Kaplan, Y. Investigations of hydrogen and hydrogen-hydrocarbon composite fuel combustion and NOx emission characteristics in a model combustor. Int. J. Hydrog. Energy 2015, 30, 1139–1147. [Google Scholar] [CrossRef]
  19. Sarioglan, A.; Korkmaz, Ö.; Kaytaz, A.; Akar, E.; Akgun, F. A 5 kWt catalytic burner for PEM fuel cells: Effect of fuel type, fuel content and fuel loads on the capacity of the catalytic burner. Int. J. Hydrog. Energy 2010, 35, 11855–11860. [Google Scholar] [CrossRef]
  20. Wang, Y.; Chen, K.S.; Mishler, J.; Cho, S.C.; Adroher, X.C. A review of polymer electrolyte membrane fuel cells: Technology, applications, and needs on fundamental research. Appl. Energy 2011, 88, 981–1007. [Google Scholar] [CrossRef] [Green Version]
  21. Minh, N. Solid oxide fuel cell technology? Features and applications. Solid State Ion. 2004, 174, 271–277. [Google Scholar] [CrossRef]
  22. Gardemann, U.; Roes, J.; Heinzel, A. A Pollutant emissions of burners for steam reformers for residential power supply. Int. J. Hydrog. Energy 2011, 36, 5189–5199. [Google Scholar] [CrossRef]
  23. Dwook, K.; Taehyun, J.; Bonchan, K.; Hyunkyoo, S. Combustion characteristics of anoe off-gas on the steam reforming performance. Int. J. Hydrog. Energy 2019, 44, 4688–4697. [Google Scholar]
  24. Pianko-Oprych, P.; Jaworski, Z. Numerical investigation of a novel burner to combust anode exhaust gases of SOFC stacks. Pol. J. Chem. Technol. 2017, 19, 20–26. [Google Scholar] [CrossRef] [Green Version]
  25. Stylianidis, N.; Azimov, U.; Birkett, M. Investigation of the Effect of Hydrogen and Methane on Combustion of Multicomponent Syngas Mixtures using a Constructed Reduced Chemical Kinetics Mechanism. Energies 2019, 12, 2442. [Google Scholar] [CrossRef] [Green Version]
  26. Lingstädt, T.; Grimm, F.; Krummrein, T.; Bücheler, S.; Aigner, M. Experimental investigation of an sofc off-gas combustor for hybrid power plant usage with low heating values realised by natural gas addition. In Proceedings of the GPPS Forum 18, Global Power and Propulsion Society, Montreal, QC, Canada, 7–9 May 2018. [Google Scholar]
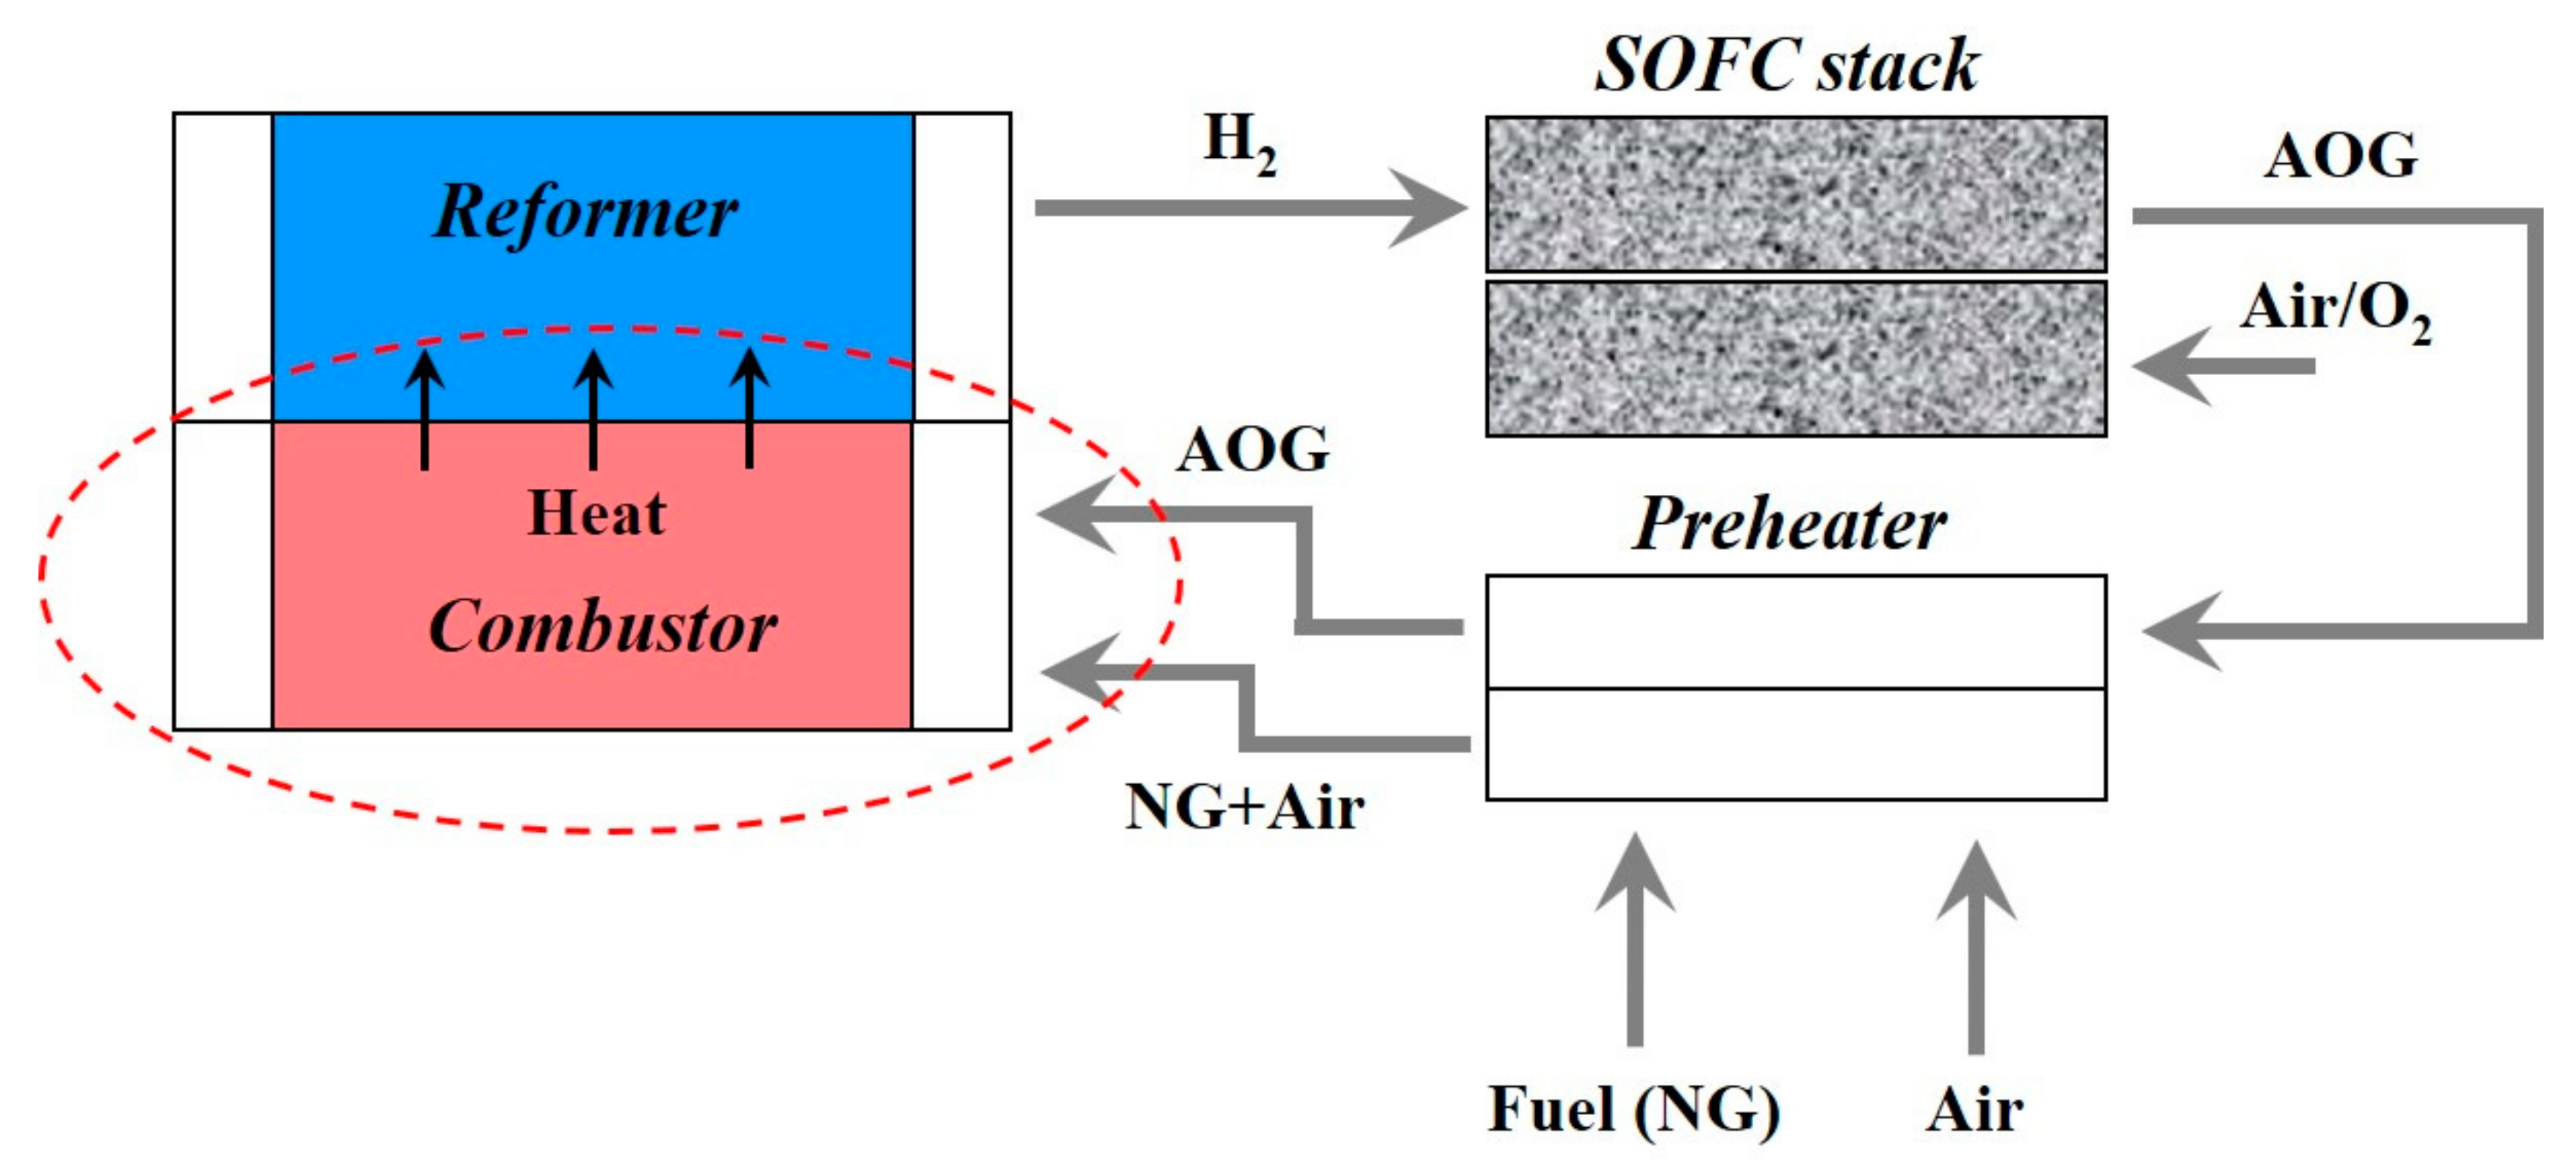
Figure 1. Schematic representation of the anode-off-gas (AOG) utilization concept. Component encircled in red (combustor) is modeled in the present work.
Energies 13 05186 g001
Figure 2. A 2D representation of an integrated combustion–reformer setup used in the experimental setup of reference [5]. The domain selected for the present model is encircled in red.
Energies 13 05186 g002
Figure 3. The 3D geometry model of combustor developed using ANSYS Design Modeler® and half symmetry.
Energies 13 05186 g003
Figure 4. Hexa-dominant finite volume (FV) mesh across the 3D domain; a total of 49,614 elements generated.
Energies 13 05186 g004
Figure 5. Temperature contours: (a) case I; (b) case II; and (c) case III at different inlet velocities.
Energies 13 05186 g005aEnergies 13 05186 g005b
Figure 6. Contours of CO2 mass fraction: (a) case I; (b) case II; and (c) case III at different inlet velocities.
Energies 13 05186 g006aEnergies 13 05186 g006b
Figure 7. Contours of H2O mass fraction: (a) case I; and (b) case II at different inlet velocities.
Energies 13 05186 g007
Figure 8. Line plots of temperature along the combustor length at (a) 0.5 m/s and (b) 0.7 m/s inlet velocity for all the three cases.
Energies 13 05186 g008
Figure 9. Line plots of CO2 mass fraction varying as a function of combustor length at (a) 0.5 m/s and (b) 0.7 m/s inlet velocity for all the three cases.
Energies 13 05186 g009
Figure 10. Line plots of H2O mass fraction varying as a function of combustor length at (a) 0.5 m/s and (b) 0.7 m/s inlet velocity for all the three cases.
Energies 13 05186 g010
Figure 11. Velocity distribution along the combustor length at (a) 0.5 m/s and (b) 0.7 m/s inlet velocities for all the three cases is investigated.
Energies 13 05186 g011
Figure 12. Computed thermal flux across the top-wall of combustor to the reformer.
Energies 13 05186 g012
Figure 13. Comparison between present model (case II) and the data obtained from [24].
Energies 13 05186 g013
Table 1. Model Equations representing various phenomena taking place in the combustor.
TypeGoverning EquationsNo.Source
Mass Balance x i ρ u i = 0 (1)[24]
Momentum Balance ρ u i u j x j = p x i + τ i j x j + ρ g i + F i (2)[24]
Energy Balance   .   ρ u H =   .   k t c P   H + S h (3)[24]
Species Balance x i   ρ u i f 1 = x i u t σ t   f 1 x j + S i (4)[24]
Turbulent K.E. x i ρ k u i = x j μ + μ t σ k k x j + G k ρ ε (5)[24]
Dissipation K.E. x i ρ ε u i = x j μ +   μ t σ ε ε x j +   ε k ( C 1 ε G k + C 2 ε ρ ε ) (6)[24]
Table 2. Species reactions for combustion of NG and H2 along with kinetic and thermodynamic parameters.
ReactionsPre-Exponential Factor (ko)
(kmol∙m−3∙s−1)
Activation Energy (E)
(J∙kmol−1)
Reaction Enthalpy (ΔHr)
(kJ∙mol−1)
No.Source
C H 4 + 0.5 O 2   C O + 2 H 2 4.4 × 10111.255 × 108−36 *(7)[24]
C O + 0.5 O 2   C O 2 2.24 × 10121.703 × 108−283 *(8)[24]
H 2 + 0.5 O 2   H 2 O 5.68 × 10111.46 × 108−241.8 *(9)[24]
C 2 H 6 + 3.5 O 2   2 C O 2 + 3 H 2 O 6.186 × 1091.256 × 108−1427.7 *(10)[24]
C 3 H 8 + 5 O 2   3 C O 2 + 4 H 2 O 6.186 × 1091.256 × 108−2043 *(11)[24]
* Calculated values.
Table 3. Inlet parameters used in the simulations for all the three cases.
CaseInlet Velocity (m/s)Inlet Temperature [K]
AOGNG+ AirAOGNG + Air
Case I-0.5, 0.7-300
Case II0.5, 0.70.5, 0.7623573
Case III0.5, 0.70.5, 0.7623573
Table 4. Species mass fractions at the inlet used in the simulations for all the three cases.
SpeciesMass Fraction (kg/kg)
Case ICase IICase III
AOGNG + AirAOGNG + AirAOGNG + Air
CH4-0.085-0.085-0.085
C2H6-0.01-0.01-0.01
C3H8-0.005-0.005-0.005
O2-0.207-0.207-0.207
H2--0.35-0.35-
H2O----0.25-
Table 5. A summary of Maximum and average combustor temperatures along with area weighted average of CO2 mass fraction at the combustor outlet.
CaseInlet Velocity = 0.5 m/sInlet Velocity = 0.7 m/s
Tmax, KTavg, KTout, KCO2, %Tmax, KTavg, KTout, KCO2, %
Case I10508848268.410609088508.0
Case II1601101486111.31636107230110.9
Case III1613101886011.61647107890110.6