Article

Operation Analysis of a SAG Mill under Different Conditions Based on DEM and Breakage Energy Method

1
School of Electrical & Information Engineering, Changsha University of Science & Technology, Changsha 410114, China
2
School of Energy and Power Engineering, Changsha University of Science & Technology, Changsha 410114, China
3
School of Automation, Central South University, Changsha 410083, China
*
Author to whom correspondence should be addressed.
Energies 2020, 13(20), 5247; https://doi.org/10.3390/en13205247
Submission received: 14 July 2020 / Revised: 31 August 2020 / Accepted: 29 September 2020 / Published: 9 October 2020
(This article belongs to the Section K: State-of-the-Art Energy Related Technologies)

Abstract

:
As one of the machines widely used in mining, a semi-autogenous grinding (SAG) mill can significantly improve the roughing efficiency of rock. But the SAG mill still faces the obstacles of significant energy consumption and empirical operation parameters. In order to obtain the optimal operation parameters of a SAG mill, in this paper, the discrete element method (DEM) is used to simulate the breakage process of the particles by controlling three parameters, i.e., the mill speed ratio, the mill fill level ratio, and the steel ball ratio. This method simulates the particles size, mill power, and qualified particles quality of crushed particle, which reveal the grinding strength and energy consumption of the SAG mill. In this paper, the grinding changes of a SAG mill under different parameter conditions are explored. Firstly, an experiment on the influence of a single parameter change on the mill’s operation is set up, and then the influence of three parameter changes on the mill’s operation is analyzed. These changes are characterized by particle size and mill power. Simulation results under the 5250 × 500 mm mill model show that the mill operates with the optimal effect when the mill is under the condition of 80% critical speed and 15% fill level; the power of the mill does not increase linearly with an increase in the mill speed ratio, but will decrease after 85% of the critical speed, and finally increase again; the optimal steel ball ratio in the SAG mill depends on the simulation time (mill actual working time) and the limitation of the rated power. The mill speed, fill level ratio, and steel ball ratio can significantly affect mill operation, and our conclusions can provide a reference for an actual situation.

Graphical Abstract

1. Introduction

At present, the development and prosperity of modern society are inseparable from mineral resources. The indispensable technical mean in mineral processing, i.e., grinding technology, is widely used in metallurgy, chemical industry, and other industries. In general, a semi-autogenous grinding (SAG) mill and an autogenous mill are used in the grinding process. A SAG mill grinds through the impact of rock and grinding media, while an autogenous mill grinds only through the impact of rock. An autogenous mill is more suitable for smaller particle size requirements, while a SAG mill is more suitable for the roughing process and is a relatively mature process. A SAG mill has advantages, including simple production process, simple equipment, less dust in the production process, and strong adaptability [1]. However, the grinding process requires a lot of energy. The data show that the energy consumption of the grinding process accounts for 30% to 75% of the entire operation process, even up to 85% [2]. Therefore, it is of great practical significance to optimize the operating parameters of the semi-automatic mill to reduce energy consumption, increase economic benefits, and save energy [3].
For the optimization research of a SAG mill, nowadays, there are mainly two categories of optimization strategies. One strategy is to use the discrete element method (DEM), combined with actual production data, to simulate and analyze energy change and particle movement inside a SAG mill. Liu [4] used the discrete element method to study the effect of particle shape difference on binary mixture shear flow. Bai [5] presented a solution to detect and control coal loads that was more accurate and convenient than those currently used. Yang [6] analyzed the structural composition, working principle, and particle movement laws of a SAG mill from multiple angles, and studied the influence of these factors on speed, lining board, fill level ratio, and steel ball diameter of a SAG mill. Li [7] controlled the cone crusher’s eccentric speed and closed side setting (CSS) parameters in the semi-autogenous grinding process by dynamically modeling the SAG mill-pebble crusher loop to improve the SAG mill throughput. Cleary [8,9,10] studied the effect of rock particle shape on the dynamic filling and energy utilization in a SAG mill and analyzed the operation status of a SAG mill under different collision conditions through the collision energy spectrum of a SAG mill. It was found that the fill level ratio, liner height, and steel ball ratio had a greater influence on the energy distribution. Pourghahramani [11] studied the influence of rock characteristics on the shape and fracture mechanism of rock, and found that soft rock was relatively slender and non-smooth, and that wear had a greater impact on rock with higher hardness. Tavares [12] conducted a related study on the particle fracture rate and proposed a mathematical model of grinding, which better considered the stress energy distribution and particle fracture energy distribution of a mill in severe fracture, wear, and repeated wear.
The other optimization strategy is to use a multi-objective intelligent optimization algorithm to optimize a SAG mill. In multi-objective optimization, each suboptimization target direction is often different, and there are cases where multiple targets cannot be optimized at the same time. Therefore, an evaluation function is usually established to evaluate each optimization goal and determine the relationship between each optimization goal. Common optimization problems are solved using the weighting method, the constraint method, and the ideal point method [13,14]. Zhao [15] proposed a soft measurement method based on fuzzy modeling, using a multi-objective hierarchical genetic algorithm to set and optimize the parameters of the fuzzy model for real-time monitoring of important working parameters for the grinding process.
The discrete element method (DEM) was the first proposed by Cundll and applied to the numerical calculation method for solving rock motion [16]. The discrete element method uses Newton’s second law as the basic idea. For each discrete particle in the simulation system, a numerical simulation calculation method is used in a certain time step to iteratively calculate the motion state, dynamic properties of each particle, and produce new particles [17].
In this paper, a 5250 × 500 mm SAG mill is used as the research object of particle fracture in the mill. First, we built a three-dimensional model of the SAG mill. Then, we used the breakage energy method to set up two sets of simulation schemes to simulate the influence of the mill speed, the fill level ratio, and the steel ball ratio on the SAG mill. Finally, through statistics and analysis of particle information and mill power under different conditions, we analyzed the influence of three parameters on the particle fracture effect in the SAG mill and obtained the best operating parameters of the SAG mill.

2. Simulation Principle Characteristics

2.1. Discrete Element Method

The discrete element method regards the material as ideally composed of many discrete independent moving particles, and then uses Newton’s second law to write out the motion state equation of each independent particle, and solves the motion equation of these particles. The deformation of each particle and the change of the whole particle system are described according to the movement and mutual position of each particle [18]. The constitutive equation, equilibrium equation, and deformation compatibility equation must be satisfied when dealing with the related problems of continuum mechanics. For the discrete element numerical calculation, the calculation method of cyclic iteration is usually used to track the movement state of the particles through repeated calculation. The cyclic calculation relationship is shown in Figure 1.
Each cycle includes two main calculation steps as follows: (1) The contact force and relative displacement between particles are determined by the principle of force and reaction force and the contact constitutive relationship between adjacent particles. (2) The new unbalanced force generated by relative displacement between adjacent particles is determined according to Newton’s second law until the required number of cycles or particle movement tends to be stable or the particle is forced, which tends to be balanced. According to the experimental study, the Rayleigh wave consumes 70% of the total energy consumption during particle unit collision, and the critical time step should be determined according to the propagation velocity of Rayleigh wave propagating along the surface of solid particles [19].

2.2. Hertz–Mindlin with Bonding
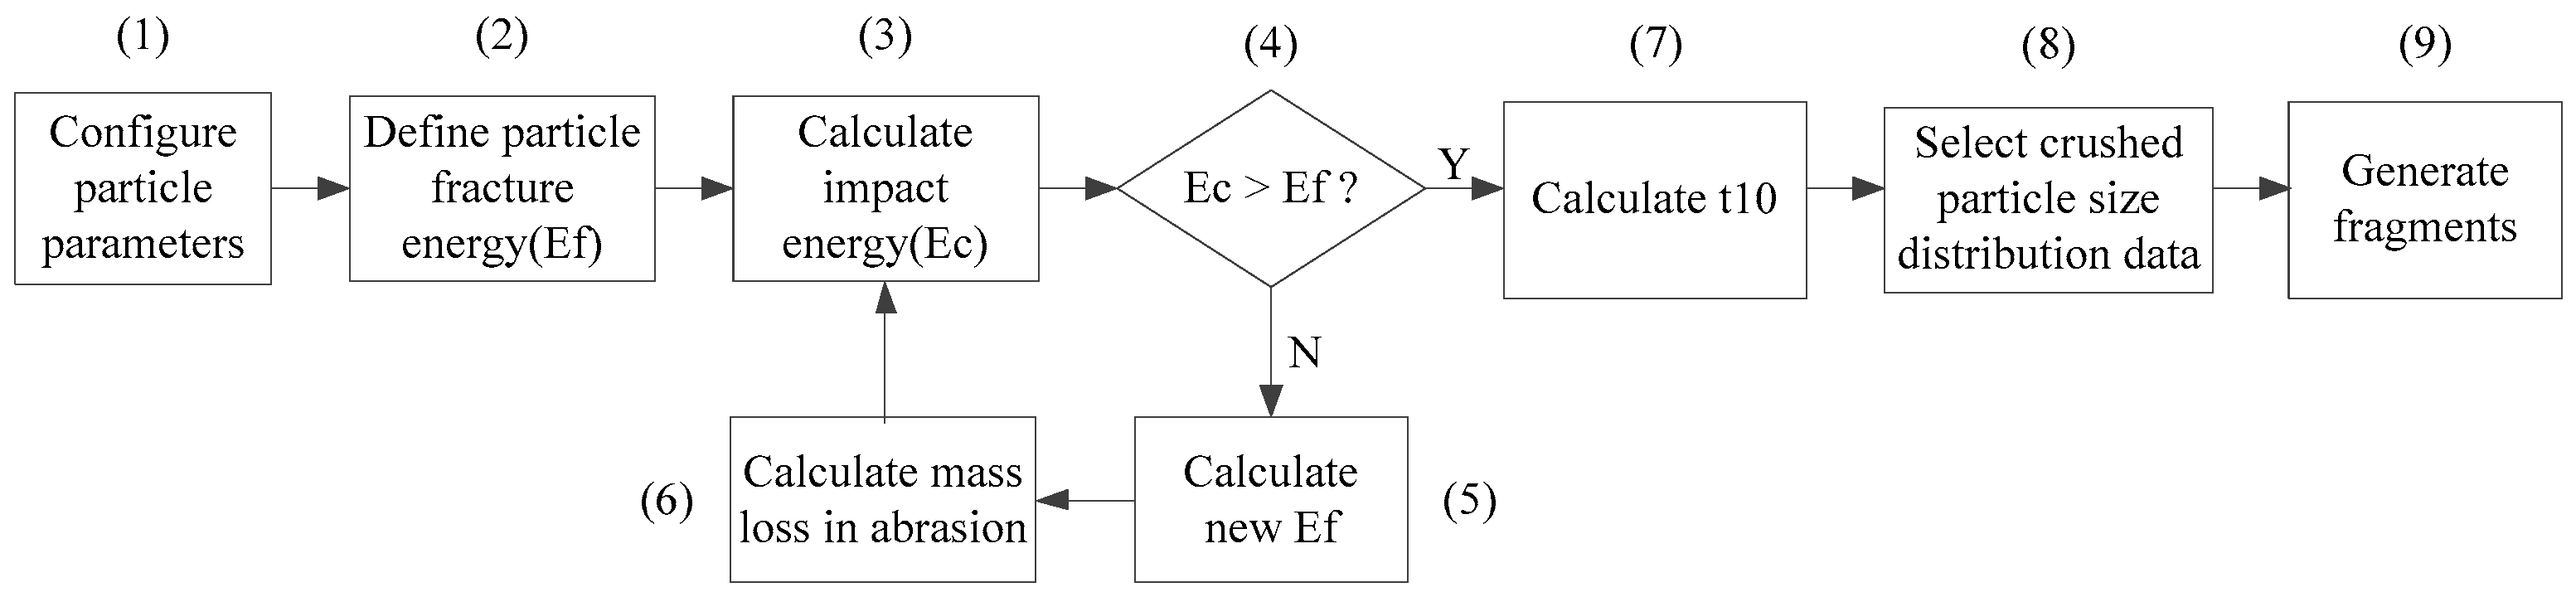
This bonding can prevent the relative movement of the tangential and normal directions, and this combination is destroyed when the maximum normal and tangential stresses are reached. The particle contact model is shown in Figure 2.
The particles are bonded together at a certain time t b o n d . Before that, the particles interact through the default Hertz–Mindlin contact model. Then, the bonding force F n , F t and torque T n , T t increase with the time step, and increase from zero, according to Equation (1):
δ F n = v n S n A δ t δ F t = v t S t A δ t δ T n = ω n S t J δ t δ T t = ω t S n J 2 δ t
In the formula, A represents the area of the contact area,   A = π R B 2 ; J = 1 2 π R B 4 , R B is the bonding radius;   S n and S t are the normal and tangential stiffness; δ t is the time step; v n and v t are the normal and tangential velocity of the particle; ω n and ω t are the normal and tangential angular velocity.
When the normal and tangential stress exceed a certain defined value, the bond is broken. The maximum values of normal and tangential stress are defined as follows:
σ max < F n A + 2 T t J R B τ max < F t A + T n J R B
These bonding forces and torque are increased in addition to the standard Hertz–Mindlin force. The particles are no longer in natural contact, and the contact radius should be set larger than the actual contact radius of these particles.

2.3. Breakage Model

Research has shown that particles are often loaded using insufficient energy to cause breakage inside comminution equipment and are fractured only after repeated low-energy stressing. This is particularly well-known for autogenous and semi-autogenous mills, where rock lumps are broken by a combination of attrition and self-induced impact fracture.
During the operation of a SAG mill, impact energy received by the particles is often lower than the energy required for fracture, but repeated low-energy impact is sufficient to cause internal damage to the particles and cause the particle fracture energy to decrease, and therefore subsequent low-energy impact can also cause particle breakage, a phenomenon known as particle damage accumulation [20]. It has recently been shown that fracture by repeated stressing is also the major mode of breakage for coarse particles. Therefore, damage accumulation caused by each impact should be considered in a simulation of particle breakage, in order to better describe the fracture of particles under repeated loading. Wang [21] used the particle bonding model to conduct a DEM simulation of the crushing mechanism and impact of dynamic characteristics of a large-scale sieving crusher, which resulted in a decrease of simulation accuracy and failed to reflect the fracture mechanism of ore well. This method ignored the effect of low energy on particles. In order to better simulate the fracture of ore particles under actual conditions, we have used a method based on crushing energy for discrete element simulation. The route (3,4,5,6) refers to damaging of the particle, whereas the route (3,4,7,8,9) refers to body breakage and subsequent replacement of the initial particle by its fragments [20,22,23,24,25,26,27]. Breakage model structural flow chart is shownin Figure 3.
In this model, when the rock particles are broken under the energy exceeding the critical fracture pressure, the critical value is called the particle fracture energy, E f ; if the rock particles are subjected to a low-intensity collision process, their internal structure will be destroyed and the produced damage or surface cracks can weaken the particle fracture energy.
Each particle has a unique fracture energy, which is determined according to the particle size, standard deviation, and average value. These parameters can be set by the built-in function in the software. For the calculation of the lognormal distribution of the particles fracture energy, the user needs to provide a set of input parameters. Parameters include the E 50   (median of fracture energy distribution), the σ E   (standard deviation), d p   (diameter of the particle), E , d 0 , and φ .
The lognormal distribution function of the particles fracture energy is given by [23,27]:
P ( E ) = 1 2 [ 1 + e r f ( l n E l n E 50 2 σ E ) ] , E = E max E E max E
where E max , E 50 , and σ E are model parameters.
During the impact, the energy efficiency of the particles is very low, influenced by factors such as loading rate, particle shape, and others. The effective impact energy ( E e f ) needs to be determined through software, which particles absorb during impacts mainly depends on the materials stiffness. Here, γ is the damage accumulation coefficient, which is used to calculate the cumulative damage of particles, E min is the minimum impact energy included, and all impact energy smaller than this value has negligible effect on the particle.
Finally, as the simulation cycle progresses, new damage values are calculated at the individual time steps, resulting in new particles and new fracture energy, and at the same time, the quality of the particles is lost due to wear between the particles. The continuous mass loss is an accumulated value during the simulation. and is a function of the particle’s size given in percentage.
D = [ 2 γ ( 2 γ 5 D + 5 ) e E k , n E f , n 1 ] 2 γ 5
The particle size distribution, after fracture, is calculated according to the parameter t10, which corresponds to the percentage in weight of the original material which passes through a sieve with aperture of 1/10th of the initial size of the particles tested. The t10 is given by:
t 10 = A [ 1 exp ( b E e f E 50 b ) ]
where A and b′ are the model parameters; E e f and E 50 b are the effective impact energy and the median fracture energy of the fractured particles, respectively. E_50b mainly depends on the particle size and effective impact energy. The equation of E 50 b is given by [28]:
E 50 b = E 50 exp [ 2 σ E e r f 1 ( P ( E e f ) 1 ) ]
The symbols and parameter settings of the corresponding breakage model are shown in Table 1 in Section 3.2.

3. SAG Model and Simulation Scheme

3.1. SAG Mill Model

Due to the large volume of the SAG mill, in order to facilitate the simulation and calculation, the SAG mill is simplified to a ring column model of 5250 × 500 mm, which is one tenth of the original model, a total of 25 trapezoidal prism lining plates with a top of 150 mm, a bottom of 250 mm, a height of 170 mm, and a thickness of 500 mm, which are distributed evenly inside the cylinder. After modeling through three-dimensional (3D) drawing software, the model is imported into the DEM software for subsequent simulation. The simplified SAG mill model is shown in Figure 4.

3.2. Parameter Settings

By using the software to set the corresponding particle parameters, a data-based particle system model can be quickly established. The SAG mill simulation parameter settings are shown in Table 2 and Table 3.

3.3. Simulation Scheme Design

The SAG mill operating parameters can be divided into the following three parts: operating parameters, mill structural parameters, and material parameters. Among them, the operating parameters include mill speed, feed rate, etc. The mill structural parameters include the number of lining plates, lining plates height, liner inclination angle, and liner shape, etc. Material parameters include rock to ball ratio (also called steel ball ratio or ball loading), steel ball diameter, mill fill level ratio, etc.
The simulation is divided into two parts. In the first part, a single parameter simulation is carried out on the mill speed ratio, the steel ball ratio, and the fill level ratio of the mill. The trend of each parameter changing independently on the rock fracture effect is obtained, and the corresponding optimal parameter numerical distribution ranges are obtained. The second part selects the corresponding parameter values in the optimal parameter numerical distribution range of the mill speed ratio, steel ball proportion, and mill fill ratio. The optimal combination of the three groups of parameters is obtained by hybrid parameters simulation.

4. Simulation Results Analysis

Semi-autogenous grinding technology is an important part of the grinding process, taking the SABC process as an example. The complete SABC process includes semi-autogenous grinding, ball milling, and pebble crushing. In this paper, the particle size at the feed inlet of the ball mill is defined as the qualified particle size at the discharge port of the semi autogenous mill, and the qualified particle size is defined as no more than 25 mm. The simulation process is shown in Figure 5.

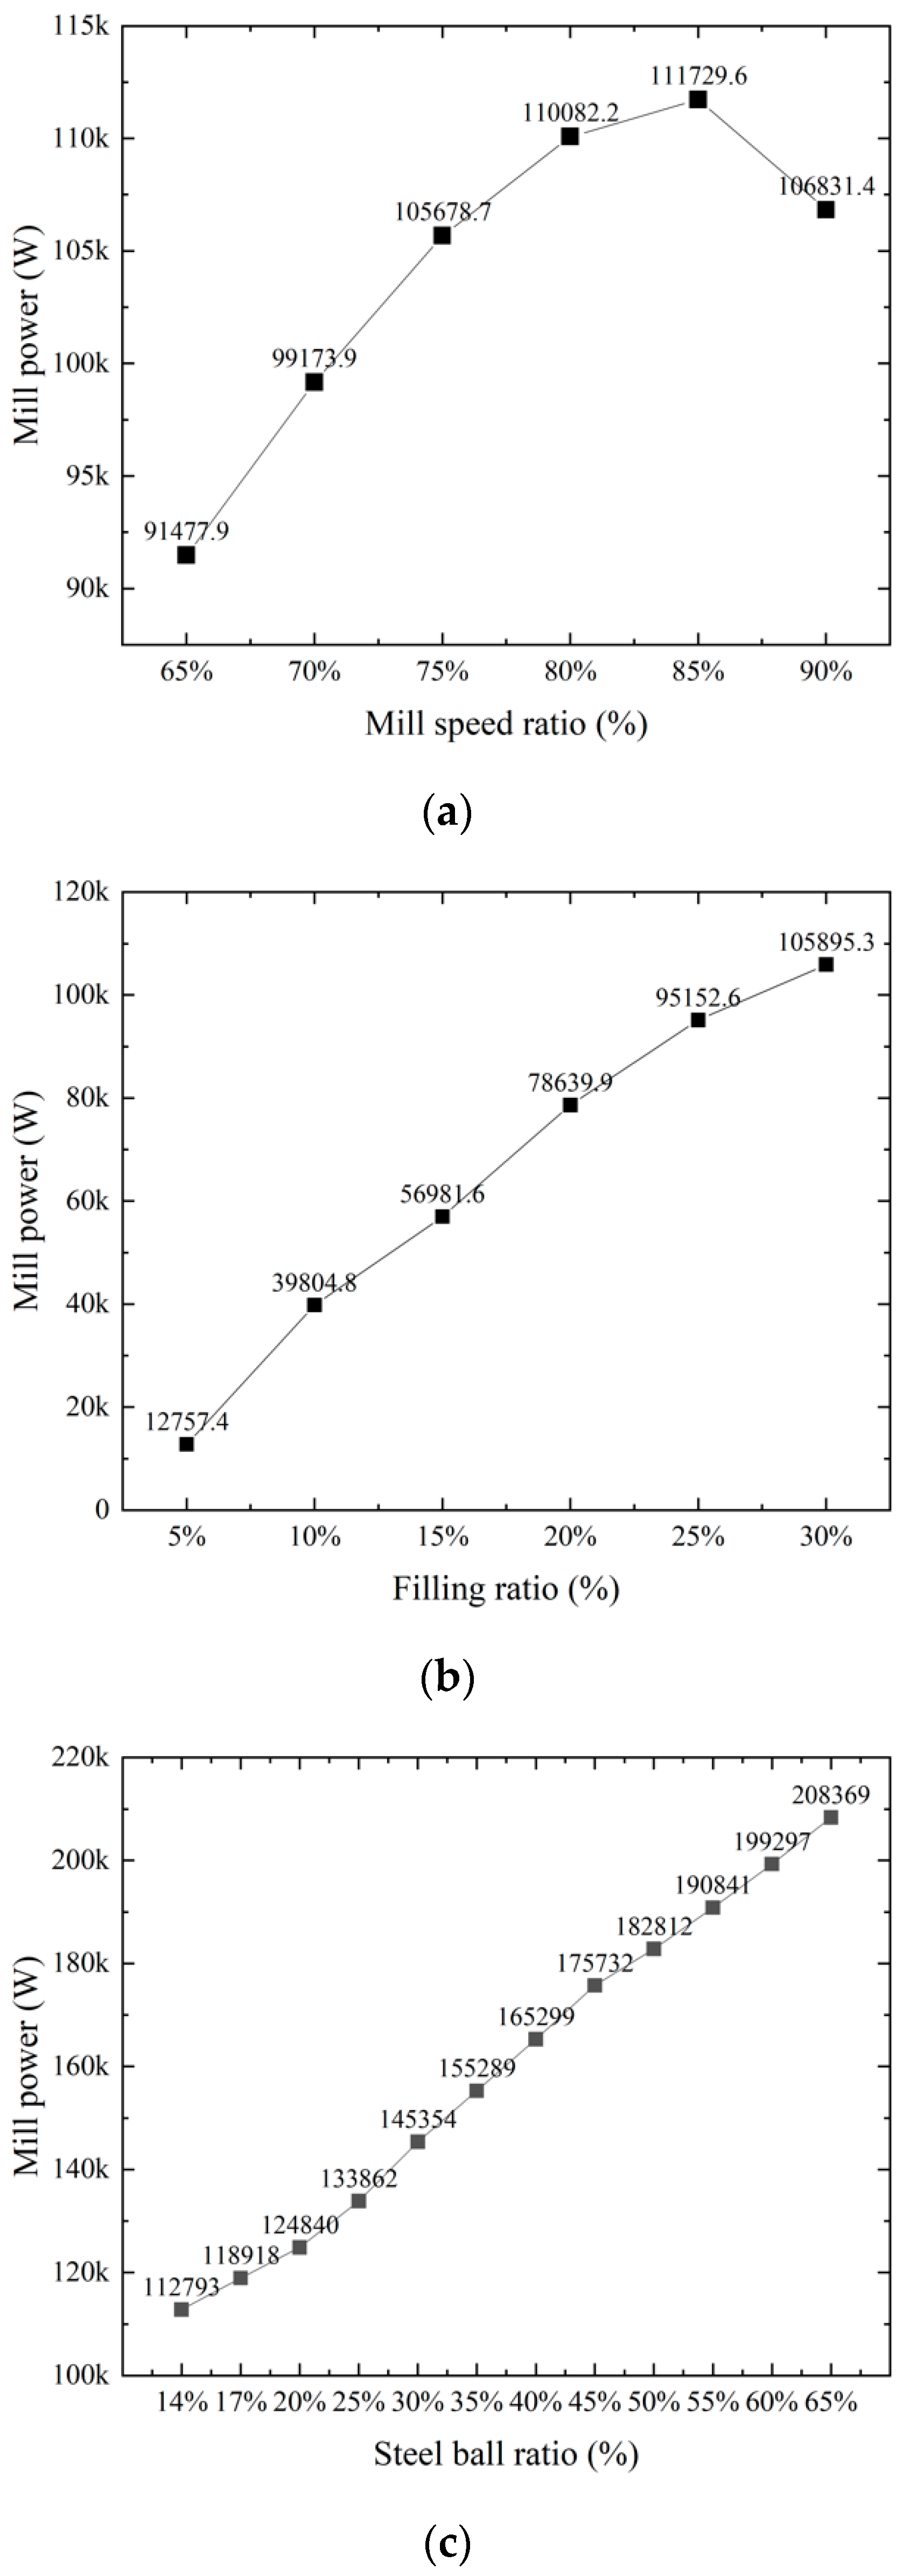
4.1. Single Parameter Case Analysis

According to different mill speed ratios (65%, 70%, 75%, 80%, 85%, and 90%) and mill fill level ratios (5%, 10%, 15%, 20%, 25%, and 30%), six sets of simulation experiments were conducted. Then, 12 sets of simulation experiments on steel ball ratios were carried out (14%, 17%, 20%, 25%, 30%, 35%, 40%, 45%, 50%, 55%, 60%, and 65%). In the experiment, the total quality of qualified rock and the power change curve of the mill after 60 s of simulation are counted, respectively. The parameter settings are shown in Table 4.
In the simulation, to study the effect of mill speed ratio and mill fill level ratio on the fracture effect of the SAG mill, as shown in Figure 6a,b, when the mill speed ratio is between 65% and 90% of the critical speed, the total mass curve of the rock below 25 mm in the mill presents normal distribution. When the speed is 80% of the critical speed, the fracture effect is the best. The total mass of qualified rock in the mill is 22.84 kg. When the fill level ratio of the mill is between 5% and 30% of the mill volume, the total mass curve of the rock below 25 mm in the mill presents normal distribution. When the fill level ratio is 15% of the mill volume, the fracture effect is the best. The total mass of qualified rock in the mill is 35.33 kg. However, in the study of the effect of steel ball ratio on fracture effect, as shown in Figure 6c, the total mass curve of qualified rock in the mill does not show a normal distribution within the prediction interval. When the proportion of steel ball is as high as 60%, the best fracture effect is achieved. In view of this phenomenon, in this paper, we design a series of related cases and, because the steel ball ratio is not a parameter determined by the mill model, we find that for the 12 groups of cases, in Figure 6c, the best fracture value is found within the simulation time of 60 s. The best fracture value of the steel ball ratio decreases with an increase in simulation time.
Figure 6 shows the mill power curve with a single parameter change. As shown in Figure 7b,c, with an increase in the fill level ratio and steel ball ratio, the total mass of material in the mill increases, and eventually the power of the mill increases linearly with the fill level ratio and steel ball ratio. However, as shown in Figure 7a, when the mill speed ratio is greater than 85% of the critical speed, the mill power will decrease. As the mill speed ratio is closer to the critical speed, the internal material is prone to centrifugal movement, and more material is thrown, which will indirectly reduce the total amount of materials, thus, reducing the mill power. If the mill speed continues to increase to exceed the critical speed, the mill power will continue to increase.

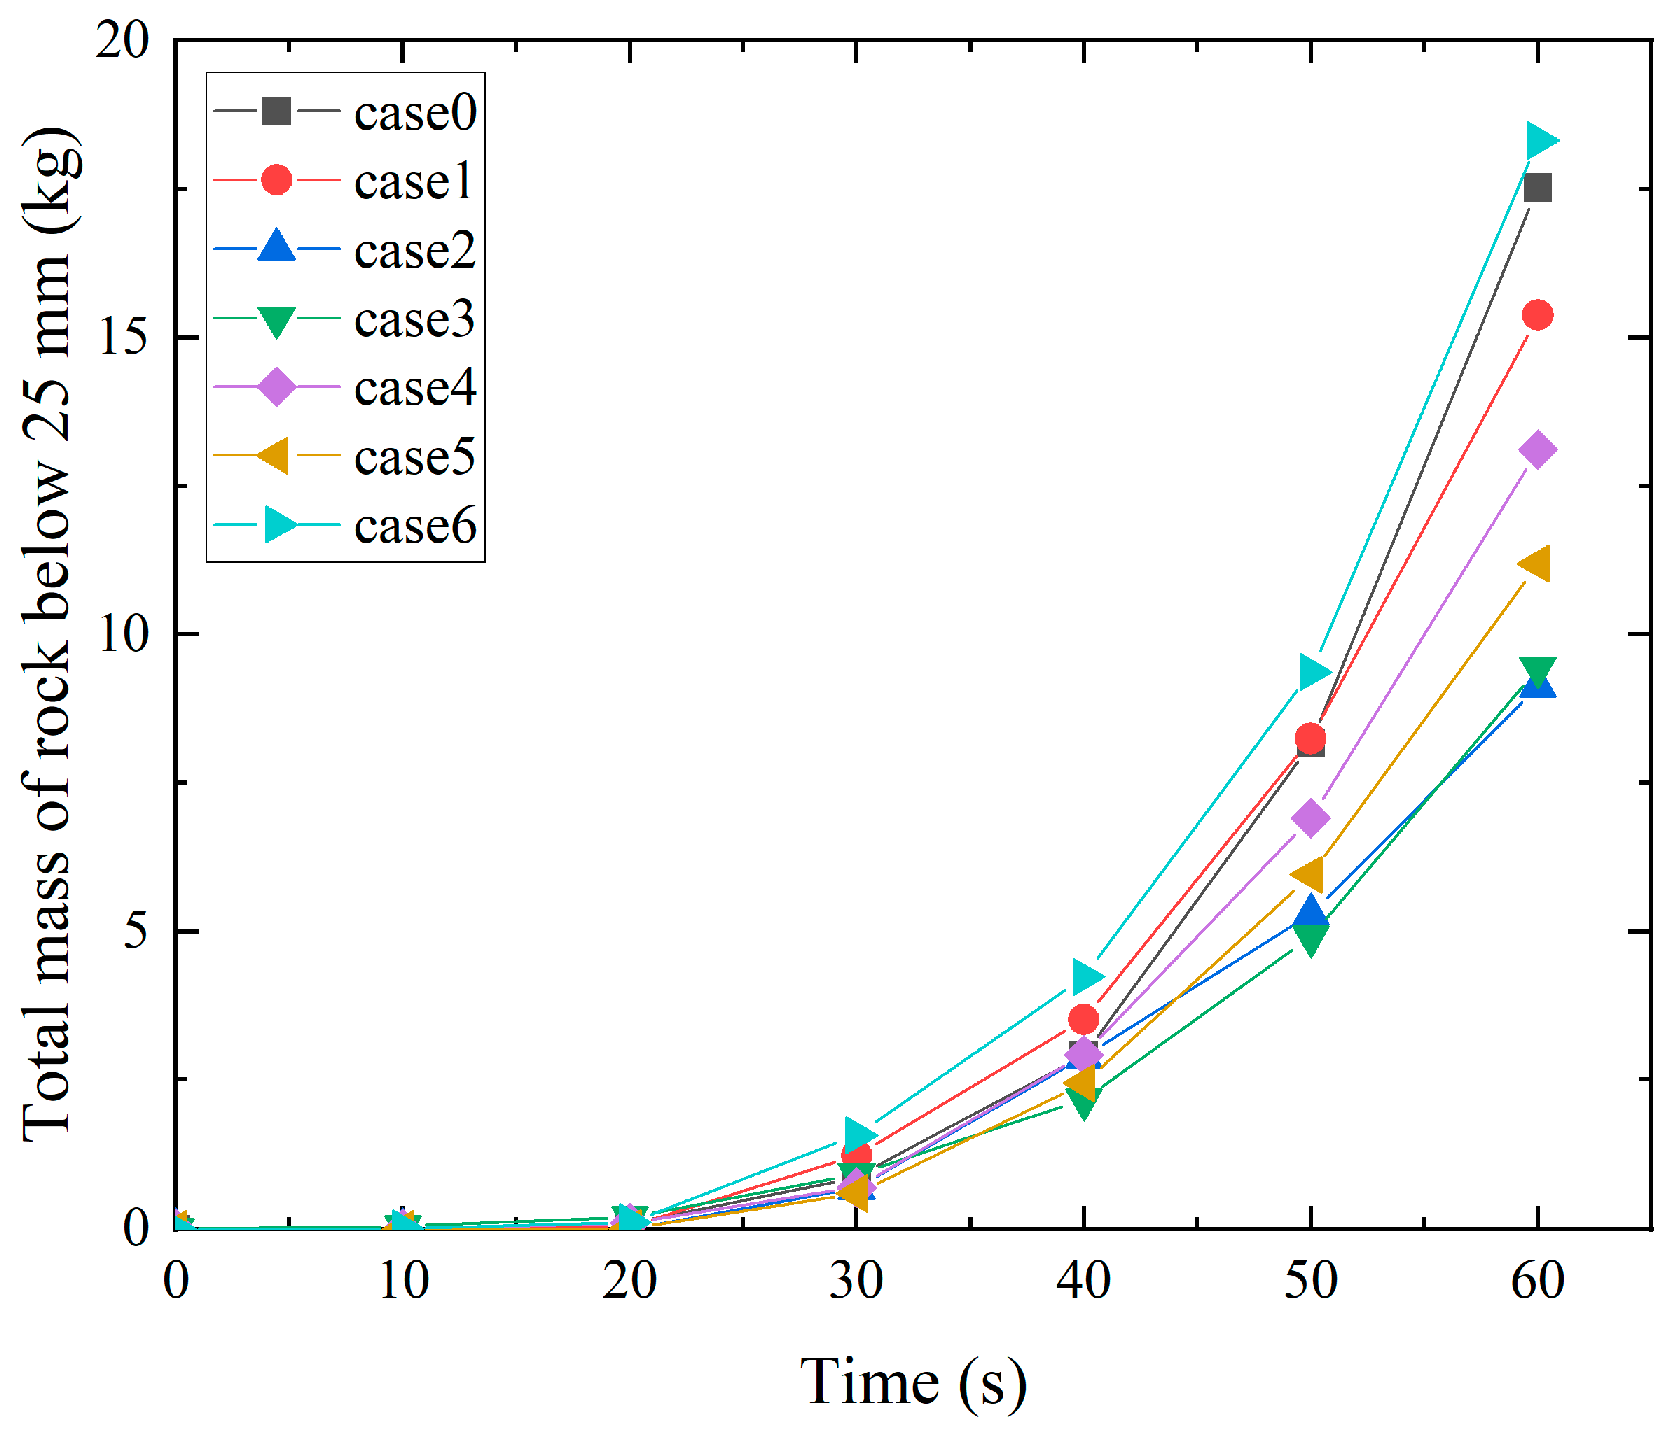
4.2. Mixed Parameter Case Analysis

According to the single parameter study of the SAG mill in Section 3.1, the optimal fracture interval of the mill speed ratio, mill fill level ratio, and steel ball ratio is obtained. The basic case of SAG mill mixed parameter research is composed of the optimal fracture interval of a single parameter. The detailed parameter settings are shown in Table 5.
The fracture effect of mixed parameters is shown in Figure 8. The first three groups with excellent fracture effects are as follows: First, case 6 (the mill speed ratio is 80%, the fill level ratio is 15%, and the steel ball ratio is 14%), the qualified rock quality is 18.3 kg, and the fracture performance is the best; second, case 0 (the mill speed ratio is 80%, the fill level ratio is 15%, and the steel ball ratio is 14%), the qualified rock quality after fracture is 17.5 kg; and finally, case 1 (the mill speed ratio is 75%, the fill level ratio is 15%, and the steel ball ratio is 10%), the qualified rock quality after fracture is 15.4 kg. In this paper, the optimal fracture parameters of the SAG mill are 80% rotation rate, 15% fill level ratio, and 14% steel ball ratio, and through subsequent simulation experiments, the steel ball ratio of the mill depends greatly on the simulation time, as the simulation time increases, the steel ball ratio will gradually decrease and reach the optimal value.
Different operating parameters are one of the main influences that affect mill power. We measure the power of the mill at each moment by extracting the mill torque under different parameters, and then use the average power within the simulation time as the mill power. The power change at different speeds and fill level ratio is shown in the Figure 9.
As shown in Figure 9, the power of the best fracture case 6 is about 70 kW, and the power of the complete SAG mill is about 700 kW, which verifies the energy consumed by the mill is huge, and optimizing the parameters to reduce energy consumption is of great significance. According to multiple sets of case data, the power of the SAG mill does not increase with the increase of the speed of the mill, but when the speed reaches a certain value (about 85% of the critical speed), the power does not increase, but instead there is a decreasing trend. At the same time, when the fill level ratio reaches about 15%, the overall fracture effect of the mill is the best. Continue to increase the fill level ratio will affect the movement of the material inside the mill, not only reducing the fracture effect but also increasing the power of the mill.

5. Conclusions

In this paper, a SAG mill with a size of 5250 × 500 mm is taken as the research object. On the basis of three working parameter directions, i.e., mill speed ratio, fill level ratio, and steel ball ratio, the motion state, fracture effect, particle size distribution, mill power, and other parameters are studied. The main conclusions are as follows:
1. The working performance of the mill is affected by multiple parameters. In the 5250 × 500 mm model, the mill fracture effect is best under the conditions of 80% critical mill speed, 15% fill level, and 14% steel ball ratio.
2. During the working process of the mill, the mill speed is crucial to the breakage effect, followed by the fill level ratio, then the steel ball ratio depends on the simulation time (mill actual working time).
3. The SAG mill power does not increase with an increase in the mill speed ratio, but when the speed reaches about 85% of the critical mill speed, the power decreases and the mill power increases again, while the speed continues to increase.
The best fracture effect case, obtained in this paper, provides a reference for an actual mill that is similar to the research model; it is necessary to consider the working time of the mill when selecting the steel ball ratio. However, there are still some challenges that need to be solved. This paper only analyzes and simulates the standard spherical rock particles rather than the actual shape of the rock, and the porosity between the particles is slightly different from the actual porosity. We hope to deepen and solve this challenge in future research.

Author Contributions

Investigation and Validation, Q.X., C.Z.; Methodology and Software, Q.F., X.W., Z.S.; Formal Analysis, Q.X., C.Z.; Writing—Original draft preparation, C.Z.; Writing—Review & Editing, Q.X., C.Z., D.L.; Funding Acquisition, X.W., D.L. All authors have read and agreed to the published version of the manuscript.

Funding

This work was supported, in part, by the National Natural Science Foundation of China under grant 61673401, grant 51674042 and grant 62073342, in part, by the Scientific Research Fund of Hunan Provincial Education Department under grant 17A005, grant 16C0041, and grant 17C0042, in part, by the Natural Science Foundation of Hunan Province under grant 2018JJ3552, in part, by the Hunan Province 2011 Collaborative Innovation Center of Clean Energy and Smart Grid.

Acknowledgments

The authors would like appreciate the Hegong Simulation Technology Team for their help during the simulation. And the authors thank the three anonymous reviewers for their insights.

Conflicts of Interest

The authors declare no conflict of interest.

References

  1. Chen, G.R.; Fu, H.S. Discussion on design characteristics of copper slag beneficiation technology in Shuikoushan, Hunan Province. Non Ferr. Met. Eng. 2016, 6, 73–77. [Google Scholar]
  2. Ji, J.G.; Pan, J.J.; Wang, C.H.; Zhou, H. Tendency, causes and expectation of large-scale homemade mine-used mills. Min. Process. Equip. 2015, 43, 1–5. [Google Scholar]
  3. Shi, G.M.; Li, X.S.; Yin, Q.H.; Wu, C.B.; Ni, S.N. Wear and grinding of SAG pebble in the laboratory scale mills. Nonferrous Met. Eng. 2017, 7, 64–69. [Google Scholar]
  4. Liu, Y.; Yu, Z.S.; Yang, J.C.; Wassgren, C.; Curtis, J.S.; Guo, Y. Discrete Element Method Investigation of Binary Granular Flows with Different Particle Shapes. Energies 2020, 13, 1841. [Google Scholar] [CrossRef] [Green Version]
  5. Bai, Y.; He, F. Modeling on the Effect of Coal Loads on Kinetic Energy of Balls for Ball Mills. Energies 2015, 8, 6859–6880. [Google Scholar] [CrossRef] [Green Version]
  6. Yang, F.X. Research on Optimization of Working Parameters of SAG Mill. Master’s Thesis, Central South University, Changsha, China, 2013. [Google Scholar]
  7. Li, H.J.; Evertsson, M.; Lindqvist, M.; Hulthén, E.; Asbjörnsson, G. Dynamic modeling and simulation of a SAG mill-pebble crusher circuit by controlling crusher operational parameters. Miner. Eng. 2018, 127, 98–104. [Google Scholar] [CrossRef]
  8. Cleary, P.W. Effect of rock shape representation in DEM on flow and energy utilisation in a pilot SAG mill. Comput. Part. Mech. 2019, 6, 461–477. [Google Scholar] [CrossRef]
  9. Cleary, P.W.; Owen, P. Effect of particle shape on structure of the charge and nature of energy utilisation in a SAG mill. Miner. Eng. 2019, 132, 48–68. [Google Scholar] [CrossRef]
  10. Cleary, P.W.; Owen, P. Effect of operating condition changes on the collisional environment in a SAG mill. Miner. Eng. 2019, 132, 297–315. [Google Scholar] [CrossRef]
  11. Pourghahramani, P. Effects of ore characteristics on product shape properties and breakage mechanisms in industrial SAG mills. Miner. Eng. 2012, 32, 30–37. [Google Scholar] [CrossRef]
  12. Tavares, L.M.; Carvalho, R.M. Modeling breakage rates of coarse particles in ball mills. Miner. Eng. 2009, 22, 650–659. [Google Scholar] [CrossRef]
  13. Tian, Y.; Cheng, R.; Zhang, X.; Jin, Y. PlatEMO: A MATLAB Platform for Evolutionary Multi-Objective Optimization. IEEE Comput. Intell. Mag. 2017, 12, 73–87. [Google Scholar] [CrossRef] [Green Version]
  14. Xu, J.P.; Li, J. Theory and Method of Multi Objective Decision Making; Tsinghua University Press: Beijing, China, 2005. [Google Scholar]
  15. Zhao, J.; Cui, Q.L.; Lin, Y.; Wang, W. Multi-objective hierarchical genetic fuzzy modeling for soft-sensor of overflow particle size in grinding process. Control Decis. 2015, 30, 2187–2192. [Google Scholar]
  16. Owen, D.R.J.; Feng, Y.T. Parallelised finite/discrete element simulation of multi-fracturing solids and discrete systems. Eng. Comput. 2001, 18, 557–576. [Google Scholar] [CrossRef]
  17. Han, K.; Owen, D.R.J.; Peric, D. Combined finite/discrete element and explicit/implicit simulations of peen forming process. Eng. Comput. 2002, 19, 92–118. [Google Scholar] [CrossRef]
  18. Wang, G.Q.; Hao, W.J.; Wang, J.X. Discrete Element Method and Its Application in EDEM; Northwestern Polytechnical University Press: Xi’an, China, 2010. [Google Scholar]
  19. Cundall, P.A. A computer model for simulating progressive large scale movements in blocky rock systems. Proc. Int. Symp. Fract. 1971, 1(ii-b), 11–18. [Google Scholar]
  20. Tavares, L.M. Analysis of particle fracture by repeated stressing as damage accumulation. Powder Technol. 2009, 190, 327–339. [Google Scholar] [CrossRef]
  21. Wang, B.Q. Study on Crushing Mechanism and Impact Dynamic Characteristics of Large-Scale Sieving Crusher. Ph.D. Thesis, China Coal Research Institute, Beijing, China, 2019. [Google Scholar]
  22. Cavalcanti, P.P.; De Carvalho, R.M.; Das Chagas, A.S.; Da Silveira, M.W.; Tavares, L.M. Surface breakage of fired iron ore pellets by impact. Powder Technol. 2019, 342, 735–743. [Google Scholar] [CrossRef]
  23. Barrios, G.K.P.; Pérez-Prim, J.; Tavares, L.M. DEM Simulation of Bed Particle Compression Using the Particle Replacement Model. In Proceedings of the 2nd International Conference on Energy, Sustainability and Climate Change, Crete, Greece, 21–27 June 2015. [Google Scholar]
  24. Tavares, L.M.; das Neves, P.B. Microstructure of quarry rocks and relationships to particle breakage and crushing. Int. J. Miner. Process. 2008, 87, 28–41. [Google Scholar] [CrossRef]
  25. Saeidi, F.; Tavares, L.M.; Yahyaei, M.; Powell, M. Phenomenological model of single particle breakage as a multi-stage process. Miner. Eng. 2016, 98, 90–100. [Google Scholar] [CrossRef]
  26. Tavares, L.M.; King, R.P. Modeling of particle fracture by repeated impacts using continuum damage mechanics. Powder Technol. 2002, 123, 138–146. [Google Scholar] [CrossRef]
  27. Carvalho, R.M.; Tavares, L.M. Predicting the effect of operating and design variables on breakage rates using the mechanistic ball mill model. Miner. Eng. 2013, 43–44, 91–101. [Google Scholar] [CrossRef]
  28. Napier Munn, T.J.; Morrell, S.; Morrison, R.D.; Kojovic, T. Mineral comminution circuits: Their operation and optimisation. J. Exp. Nanosci. 1999, 10, 1–8. [Google Scholar]
Figure 1. Cycle calculation relationship.
Energies 13 05247 g001
Figure 2. Particle contact model.
Energies 13 05247 g002
Figure 3. Calculation cycle of particle destruction and breakage caused by impact.
Energies 13 05247 g003
Figure 4. Semi-autogenous grinding (SAG) mill model.
Energies 13 05247 g004
Figure 5. Mill operation process.
Energies 13 05247 g005
Figure 6. Breakage effect of single parameter. (a) Breakage effect of different mill speed ratio; (b) Breakage effect of different fill level ratio; (c) Breakage effect of different steel ball ratio.
Energies 13 05247 g006
Figure 7. Mill power curve of single parameter. (a) Mill power of different speeds; (b) Mill power of different fill level ratio; (c) Mill power of different steel ball ratio.
Energies 13 05247 g007
Figure 8. Breakage effect of mixed parameter.
Energies 13 05247 g008
Figure 9. Mill power of mixed parameter.
Energies 13 05247 g009
Table 1. Breakage parameters.
SymbolDescriptionValueSymbolDescriptionValue
b Impact breakage parameter used in the calculation of the t100.051 A Impact breakage parameter used in the calculation of the t1060.4
E Maximum particle size fracture energy (J/kg)44.9 d 0 Median particle size (mm)4.3
φ Fitting parameters of fracture energy1.28 d min Minimum particle size for breakage (mm)10−2
σ E Standard deviation of the fracture energy 0.46 E min Minimum collision energy (J)10−4
Γ Damage constant3.0
Table 2. Collision parameters.
Type of AcationCoefficient of RestitutionStatic Friction CoefficientRolling Friction Coefficient
Rock–Rock Collisions0.30.650.05
Rock–Steel Collisions0.50.40.05
Rock–Mill Collisions0.50.40.1
Steel–Steel Collisions0.750.350.1
Steel—Mill Collisions0.750.50.2
Table 3. Material properties parameters.
MaterialDensity (kg/m3)Shear Modulus (Pa)Poisson’s Ratio
Steel ball78007 × 10100.3
Rock26001 × 1070.3
Lining board72006.8 × 10100.3
Table 4. Single parameter experimental design.
CaseOther Parameter SettingsResearch Parameter
130% of mill volume, 10% steel ball ratioMill speed ratio
275% critical speed of mill, 10% steel ball ratioFill level ratio
375% critical speed of mill, 30% of mill volumeSteel ball ratio
Table 5. Mixed parameter experimental design.
CaseMill Speed Ratio (%)Fill Level Ratio (%)Steel Ball Ratio (%)
080%15%10%
175%15%10%
285%15%10%
380%10%10%
480%20%10%
580%15%6%
680%15%14%

