Article

Numerical Study of CO2 Geological Storage in Saline Aquifers without the Risk of Leakage

Department of Resources Engineering, National Cheng Kung University, Tainan 701, Taiwan
*
Author to whom correspondence should be addressed.
Energies 2020, 13(20), 5259; https://doi.org/10.3390/en13205259
Submission received: 31 August 2020 / Revised: 3 October 2020 / Accepted: 8 October 2020 / Published: 10 October 2020
(This article belongs to the Section A: Sustainable Energy)

Abstract

:
The purpose of this study is to reduce the risk of leakage of CO2 geological storage by injecting the dissolved CO2 solution instead of the supercritical CO2 injection. The reservoir simulation method is used in this study to evaluate the contributions of the different trapping mechanisms, and the safety index method is used to evaluate the risk of CO2 leakage. The function of the dissolved CO2 solution injection is performed by a case study of a deep saline aquifer. Two scenarios are designed in this study: the traditional supercritical CO2 injection and the dissolved CO2 solution injection. The contributions of different trapping mechanisms, plume migrations, and the risk of leakage are evaluated and compared. The simulation results show that the risk of leakage via a natural pathway can be decreased by the approach of injecting dissolved CO2 solution instead of supercritical CO2. The amount of the CO2 retained by the safe trapping mechanisms in the dissolved CO2 solution injection scenario is greater than that in the supercritical CO2 scenario. The process of CO2 mineralization in the dissolved CO2 solution injection scenario is also much faster than that in the supercritical CO2 scenario. Changing the injection fluid from supercritical CO2 to a dissolved CO2 solution can significantly increase the safety of the CO2 geological storage. The risk of CO2 leakage from a reservoir can be eliminated because the injected CO2 can be trapped totally by safe trapping mechanisms.

Graphical Abstract

1. Introduction

Since the Industrial Revolution, the consumption of fossil fuels in transportation, industrial, electrical, and other sectors has resulted in a large increase in greenhouse gas emissions, thereby promoting environmental disasters, such as global warming. To promote environmental protection and to halt the consequences of climate change, remediation techniques are required to reduce anthropogenic CO2 emissions to keep the rise in global temperatures below 2 °C above pre-industrial temperatures in the 21st century. Carbon capture and storage (CCS) is one of the solutions. CCS is a practical approach to cut down CO2 emissions by means of a series of technologies, including the capture, transportation, and storage of CO2. Deep saline aquifers have the largest CO2 storage capacity in the geological storage options.
The most important issue for the CO2 geological storage is the risk of leakage. For the storage to be, the risk of any leakage should be controlled to as low as possible. The evaluation of the risk of leakage is essential for public acceptance and public policy [1,2]. The risk of leakage can be reduced by a safe injection strategy with understanding the functions of different trapping mechanisms.
The traditional injection strategy is the supercritical CO2 injection, i.e., CO2 is injected into a reservoir as a mobile supercritical phase. The injected supercritical CO2 is trapped below a non-permeable cap-rock in the beginning; this is structural trapping. The injected supercritical CO2 plume migrates upward due to its buoyancy. The mobility of the supercritical CO2 creates a higher risk of leakage for the CO2 storage because, in this mechanism, it relies on the containment of the storage system. However, in the post-injection period, the residual gas, solubility, and mineralization trapping mechanisms will work to improve the safety of the storage since these trappings make the stored CO2 as an immobile phase to effectively lower the risk of leakage [3,4,5].
An alternative method of CO2 storage to the traditional supercritical CO2 injection has been discussed in recent years. A novel method of CO2 storage based on injecting a dissolved CO2 solution has been proposed. CO2 is dissolved in water, which is extracted from an aquifer at a surface facility before injection [6]. However, the CO2 dissolution procedure at the surface facility requires compressing the water at high pressure and may cause unaffordable energy and costs. An alternative strategy of dissolving CO2 involves the production of brine from the reservoir, followed by a re-injection where the brine mixes with the CO2 in the wellbore of the injection well at a certain depth [7]. Significant advantages are attained by injecting CO2 as a saturated solution with the brine [8].
When the CO2 is dissolved in water, the density of the CO2 solution is greater than that of the formation water. The CO2 solution naturally sinks in the aquifer due to the gravity effect, and this can reduce the risk of leakage because the plume is moving away from the top of the reservoir (moving downward). Recently, research has been conducted concerning the injection of dissolved CO2 solution into igneous rock (e.g., basalt). Instead of supercritical CO2, CO2 the dissolved in geothermal wastewater was injected into and stored in the formation. Because basaltic rocks are rich in calcium, magnesium, and iron (while also being more reactive in formation water than sedimentary rock), the bulk of the CO2 is trapped by mineral trapping within a few years instead of thousands of years [9,10,11]. After the stored CO2 transforms into carbonate minerals, the risk of CO2 leakage can be eliminated, thereby enhancing the storage safety and public acceptance of this solution.
The whole process of transforming the CO2 phase through a different trapping mechanism plays an essential role in evaluating the risk of CO2 leakage, no matter whether it is in the traditional supercritical CO2 injection or the dissolved CO2 solution injection. This is the first paper to discuss the differences in the trapping mechanisms between injecting the dissolved CO2 and injecting supercritical CO2 into a reservoir in sedimentary basins. Because the difference in the process of trapping mechanisms would affect the mobility of stored CO2 and the leakage risk, the differences in injecting different fluid should be discussed. Sedimentary rock is less rich in calcium, magnesium, and iron than igneous rock, but the transformation of the injected dissolved CO2 into carbonate minerals can still be faster than that achieved by the traditional supercritical CO2 injection because the solubility trapping mechanism can occur immediately in the reservoir.
Therefore, the purpose of this research is to study the elimination of the risk of leakage of CO2 geological storage by injecting the dissolved CO2 solution instead of the supercritical CO2 injection. Specifically, the transformation process of trapping mechanisms of the different injected phase CO2 in a sedimentary basin is discussed in this study. The contributions of the different trapping mechanisms are evaluated by the reservoir simulation, and the risk of CO2 leakage is estimated from the safety index method. This study uses a case study to perform the function of the dissolved CO2 solution injection in a deep saline aquifer. The traditional supercritical CO2 injection and the dissolved CO2 solution injection scenarios are designed in this study, and the contributions of different trapping mechanisms, plume migrations, and the risk of leakage are evaluated and compared.

2. Methodology

To effectively assess the leakage risk of CO2 storage, the safety index (SFI) was used in this study. The SFI was estimated by the dynamic number of moles of CO2 retained by the trapping mechanisms after CO2 had been injected into the target reservoir. The safety index was defined as [12]:
S F I = ( n C O 2 ( r e s ) + n C O 2 ( a q ) + n C O 2 ( i o n ) + n C O 2 ( min ) ) / n C O 2 ( i n j )
where n C O 2 ( r e s ) is the number of moles of the CO2 retained by the residual gas mechanism as immobile supercritical phase; n C O 2 ( a q ) is the number of moles of the CO2 retained by the solubility trapping mechanism; n C O 2 ( i o n ) is the moles of the CO2 retained by the ionic trapping mechanism; n C O 2 ( m i n ) is the number of moles of the CO2 retained by the mineral trapping mechanism, and n C O 2 ( i n j ) is the number of moles of injected CO2.
The residual gas trapping mechanism plays an essential role in trapping supercritical CO2 in a saline aquifer. In the porous media, supercritical CO2 can be trapped by capillary and wettability effects as an immobile phase [13,14]. When the imbibition curve is different from the drainage curve for the relative permeability of the gas (krg), the residual gas exists. In this study, the imbibition and drainage curves of the relative permeability of the gas were designed using Land’s model [15]. For the solubility trapping mechanism, the solubility of gas in the water is important because a large amount of CO2 is able to be dissolved in the saline. Because the dissolution rate of the gas phase in the aqueous phase is rapid, the aqueous and gas phase are able to be assumed to be in thermodynamic equilibrium. The solubility trapping mechanism in a saline aquifer can be modeled by the phase equilibrium controlled by the equivalent fugacities between the aqueous (fmaq) and gas phases (fmg):
f m g = f m a q , m = 1 , , N c
The Peng–Robinson equation of state (PR-EOS) was adopted to compute the gas fugacity, fmg, of component m [16]. The fugacity of component m in the aqueous phase, fmaq, can be computed by Henry’s law:
f m a q = y m a q H m
where Hm is Henry’s law constant (atm·L/mol) for component m at a given p and T.
Henry’s constant, which is affected by the temperature, pressure, and salinity of the saline, can be normally expressed as follows at a constant temperature:
ln H m = ln H m * + v m ¯ ( p p * ) R T )
where Hm* is the Henry’s law constant (atm·L /mol) of component m at p* and T; R is the gas constant; and v m ¯ is the partial molar volume of component m in solution.
The chemical reactions that take place between components in the aqueous phase and between carbonate minerals and aqueous CO2 are crucial in this study. The components in the aqueous phase were composed of soluble gas components, Nc, and components that only exist in the aqueous phase, Na. It may be assumed that Nm is the number of mineral components, Naq is the number of components in the aqueous phase (Naq = Nc + Na), and Nct is the total number of components (Nct = Naq + Nm). The chemical reaction in the aqueous phase between species has the stoichiometry of [14]:
k = 1 N a q v k α a A k = 0 , α = 1 , , R a q
where Raq is defined as the number of chemical reactions between aqueous components, vk is the stoichiometric coefficient of component k in the chemical reaction, and Ak is the chemical symbol for the k aqueous species.
The precipitation/dissolution chemical reactions for minerals have the stoichiometry [14]:
k = 1 N c t v k β m A k = 0 , β = 1 , , R m n
where Rmm is the number of reactions between the minerals and aqueous components.
The chemical reactions in the aqueous phase would be expressed by chemical equilibrium reactions because the chemical reactions that occurred in the components in the aqueous phase are usually relatively faster than the mineral precipitation/dissolution reactions. The dissolution or precipitation chemical reactions for minerals can then be described as rate-dependent reactions.
The chemical equilibrium reactions can be computed using chemical equilibrium constants [14,17], and the governing equations are
Q α K e q , α = 0 , α = 1 , , R a q
Q α = k = 1 n A q α k v k α
where Qα is the activity product, Keq,α is the chemical equilibrium constant for the aqueous reaction α, αk is the activity of component k, and vka are the stoichiometry coefficients.
The activities ak are associated with the molality mk (moles per kg of H2O):
a k = γ k m k , k = 1 , , N a q
where γk is the activity coefficient and equals 1 for an ideal solution.
Nevertheless, for most cases, the B-dot model is used to describe the non-ideal and preferred model for ionic activity coefficients [14,17]:
log γ i = A γ z i 2 I 1 + a ˙ i B r I + B ˙ I
where Ar, Br and B ˙ are temperature dependent parameters, a ˙ i is the ion size parameter, and I is the ionic strength, which can be expressed by:
I = 1 2 k = 1 n a q m k z k 2
where zk is the charge of the k-th ion.
As for the dissolution/precipitation reaction of mineral, the rate law is as follows [14,17]:
r β = Â β k β ( 1 Q β K e q , β )
where r β is the rate of the mineral reaction, Â β is the reactive surface area for mineral β, k β is the rate constant of the mineral reaction, and the activity product, Q β , is analogous to the activity product for the aqueous chemical equilibrium reactions:
Q β = k = 1 n A q α k v k β
The rate of formation/consumption of the different aqueous species is expressed by:
r k β = v k β r β
The rate constant of the mineral reaction can be calculated at a different temperature, T, using the reference temperature, T0:
k β = k 0 β exp [ E a β R ( 1 T 1 T 0 ) ]  
where E a β is the activation energy for reaction β (J/mol) and k 0 β is the reaction rate constant for reaction β at T0 (mol/m2s).
To compute the reactive surface area of the mineral reaction, the change in the moles of minerals via dissolution/precipitation is involved:
 β =  β N β N β
where  β is the initial reactive surface, Nβ is the number of mineral β moles per unit gridblock of the volume at a given time, and N β is the number of mineral β moles per unit gridblock of the initial bulk volume.

3. Geological Description

The case study was based on a potential target site, the Y-field in Northwestern Taiwan, for CO2 geological storage. The target formation for this study is the Yutengping (YTP) sandstone formation, which is a deep saline aquifer in the Y-field. The YTP sandstone formation is overlain by the Chinshiu (CS) Shale, which is a thick shale formation regionally distributed in Northwestern Taiwan. The thickness of the CS Shale is about 200 m. Due to the thickness and the extremely low permeability, the CS Shale is considered to be a caprock with great integrity that can prevent the leakage of the injected CO2 stored in the reservoir. The Shihliufen (SLF) Shale, which is the formation under the YTP sandstone, is the impermeable underburden for the CO2 geological storage in the storage system.
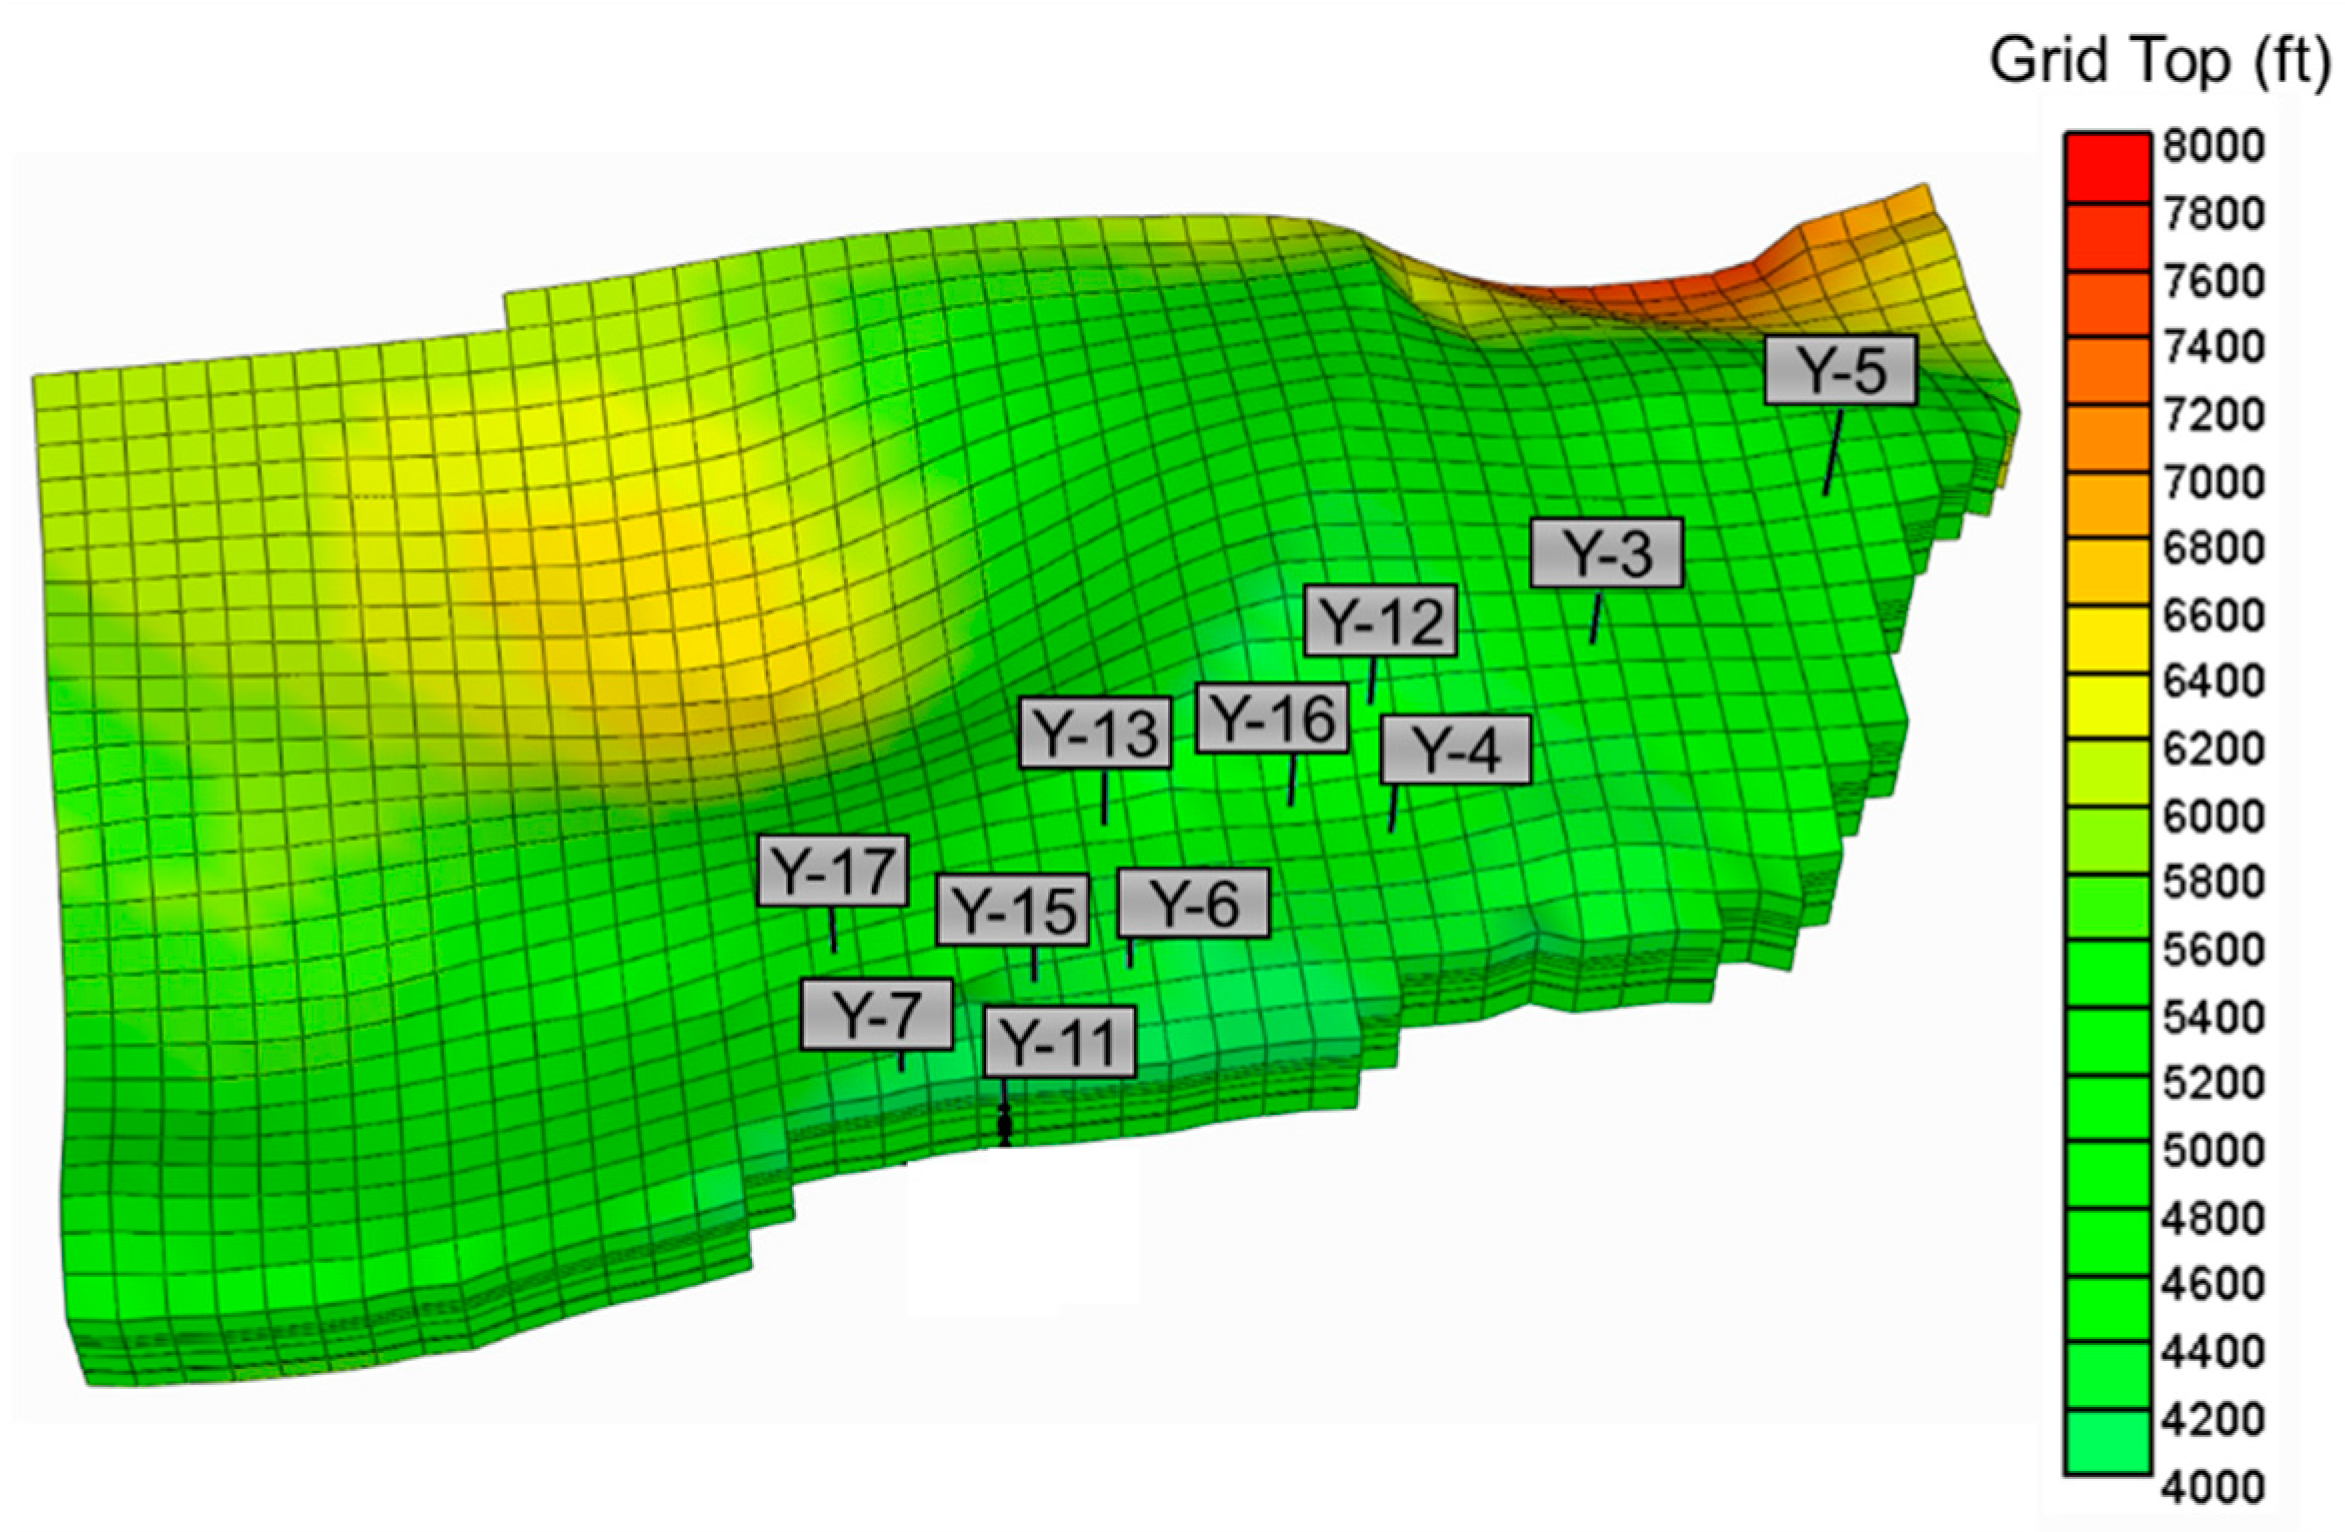
The structural map of the YTP sandstone formation is shown in Figure 1. The YTP sandstone formation in the Y-field is an anticline structure sealed by two faults. The strike of the anticline axis is NE to SW. The formation top of the YTP sandstone is about 1240–1500 m. There are 11 pre-existing wells that were used to produce gas from the deeper formation, and they were the geological investigation wells for the CO2 storage in the Y-field.
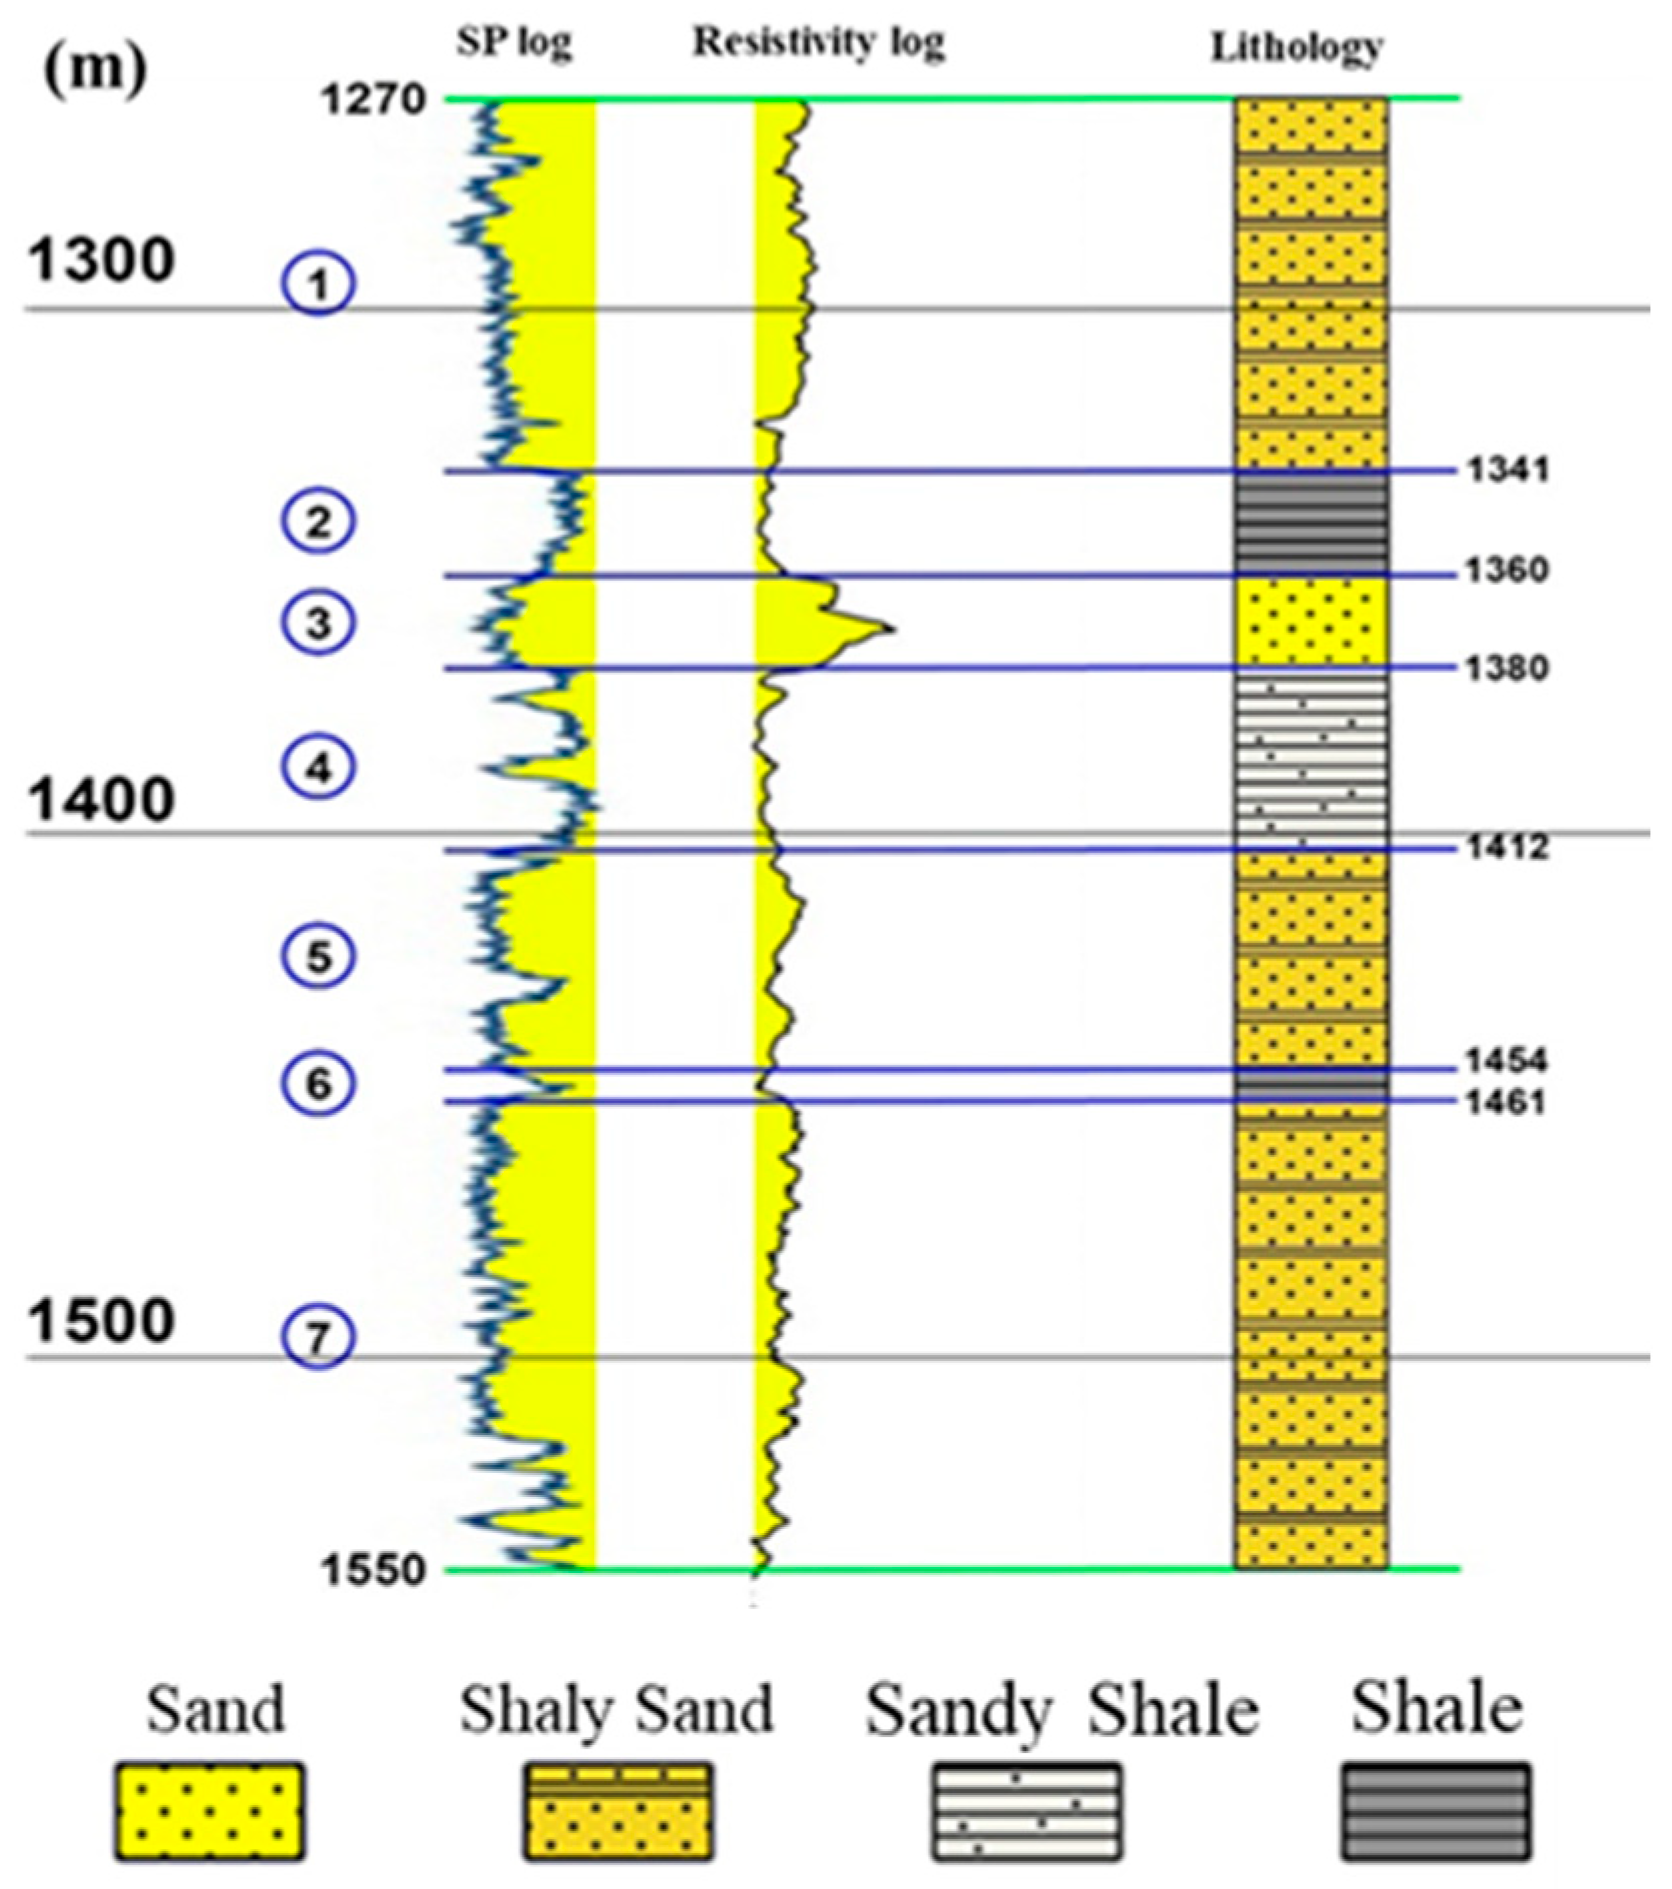
Based on the analysis of the core and the well logging interpretation of the wells, the YTP sandstone formation, with a thickness of about 250–300 m, can be divided into 7 sub-formations, including thick sandstone layers and inter-layer thin-shale layers. An example of the lithology of the sublayers from the well logging interpretation is shown in Figure 2. The structural map was digitized and then used to construct the geological grid system for the reservoir simulation. The thickness of each sub-formation was calculated by the Ordinary Kriging method from the results of the well logging interpretation of each pre-existing well. The top view of the three-dimensional model of the YTP sandstone formation is shown in Figure 3.

4. Simulation Model Design

The General Equation of state Model simulator (GEM simulator) (GEM 2015.10, Computer Modelling Group LTD., Calgary, AB, Canada) developed by the Computer Modelling Group (CMG) was used in this study to simulate the complex processes of CO2 storage by coupling the multiphase fluid flow and geochemical mechanisms. The GEM simulator is a commercial compositional simulator based on the Equation of State (EOS). The greenhouse gas module (GHG module) of the GEM simulator, which was used to simulate the complex process of trapping mechanism, included the convective and dispersive transportations of the components, the thermodynamic equilibrium between the gas/aqueous phases, the chemical reactions that occurred in the formation water, and the mineral reactions reacted with the mineral in the porous media [13,14,18].
The formation in the study area was discretized into 45 × 29 × 7 grid blocks. The x and y dimensions of each grid block were 580 × 570 ft. The reservoir parameters, such as porosity and permeability, were assigned differently between lithologies, as shown in Table 1. The sand and shaly sand layers act as a reservoir in the YTP sandstone formation, while the sandy shale and shale layers act as a barrier inter-layer in the YTP sandstone formation. For the relative permeability curves this study used, the irreducible water saturation was set at 0.2, and the maximum residual gas saturation was assigned to be 0.4 for the residual gas trapping mechanism modeling. The formation temperature of the YTP sandstone formation was 162 °F, and the initial pressure was 2445 psi at a reference depth of 5400 ft. In this study, the Luchukeng (LCK), Touhuanping (THP), and Lungkang (LK) faults were designed as no-flow boundaries, and there is an open boundary at the west of the study area.
The parameters of the EOS for CO2 and saline were based on the database of the library component in CMG’s Winprop simulator (Winprop 2015.10, Computer Modelling Group LTD., Calgary, AB, Canada). To compute the component properties of the CO2-brine binary mixtures, the PR-EOS were used to model the behavioral calculations. Henry’s law [19] was adopted to compute the fugacities of CO2 between the gas and aqueous phases.
The GEM simulator is based on the fully-coupled approach to solving the compositional multiphase fluid flow and the geochemical reactions. The approach was used to solve all parameters through the simultaneous convergence of all equations associated with fluid flow and chemical reaction by Newton’s method. The main equations involved the equation(s) of volume constraint, component material balance, phase equilibrium, chemical equilibrium, and mineral balance. The Jacobian matrix in Newton’s method was solved by Incomplete lower–upper factorization with the generalized minimal residual iterative method [14].
The molality of primary components in the saline of the target formation was analyzed in the laboratory using a water sample that was collected from the YTP formation in the near field. To convert the results of the molality of primary components of the saline from the laboratory condition to the reservoir condition, the Solmineq.88, which is a geochemical aqueous equilibrium model, was adopted [20]. The rock samples collected from drilling in the YTP formation and CS shale were used to analyze the chemical and mineralogical compositions through X-ray fluorescence and X-ray diffraction. The analyzed results presented that the primary minerals in the YTP sandstone formation include quartz, anorthite, muscovite, and kaolinite.
To compute the chemical reaction in the aqueous phase and the mineral reaction paths of the rock–brine–CO2 occurred in the target formation, GAMSPath, which is the geochemical reaction path model, was adopted in this study [21]. From the results of the geochemical reaction paths, the mineral trapping mechanisms in the target formation can be simplified to 5 chemical reactions in the aqueous phase and 4 geochemical mineral reactions, as shown in Table 2. The molality of the primary aqueous components of the saline and the volume percentages of the minerals in the formation are shown in Table 3.
A schematic diagram of the injection process used in this study is shown in Figure 4. Using the up-dip of the anticline in the Y-formation, an up-dip injection well was designed to prevent the injected free-moved supercritical CO2 splitting from the target anticline. The perforated intervals of the injection well were assumed to be the sandstone layer and the three shaly sand layers. A scenario analysis was performed for two injection fluids: traditional supercritical CO2 and dissolved CO2 solution. This case study was designed by injecting 0.2 million tons of CO2 per year for 10 years via the one injection well. The simulation period was designed for 1000 years to observe the transformation process of trapping mechanisms after the injection period. For the dissolved CO2 injection scenario, the CO2 concentration of the injected solution was 1.005 (mole/kg·H2O), considering the CO2 solubility at the initial static bottom-hole pressure (1980 psi) and formation temperature (162 °F). The injection rate of the injected solution was 68,460 bbl/day. Because a large volume of water was required in the dissolved CO2 injection scenario, one pre-existing well was assigned as the production well from which water in the YTP formation was produced at the rate required for the water supply.

5. Results and Discussion

5.1. Supercritical CO2 Scenario

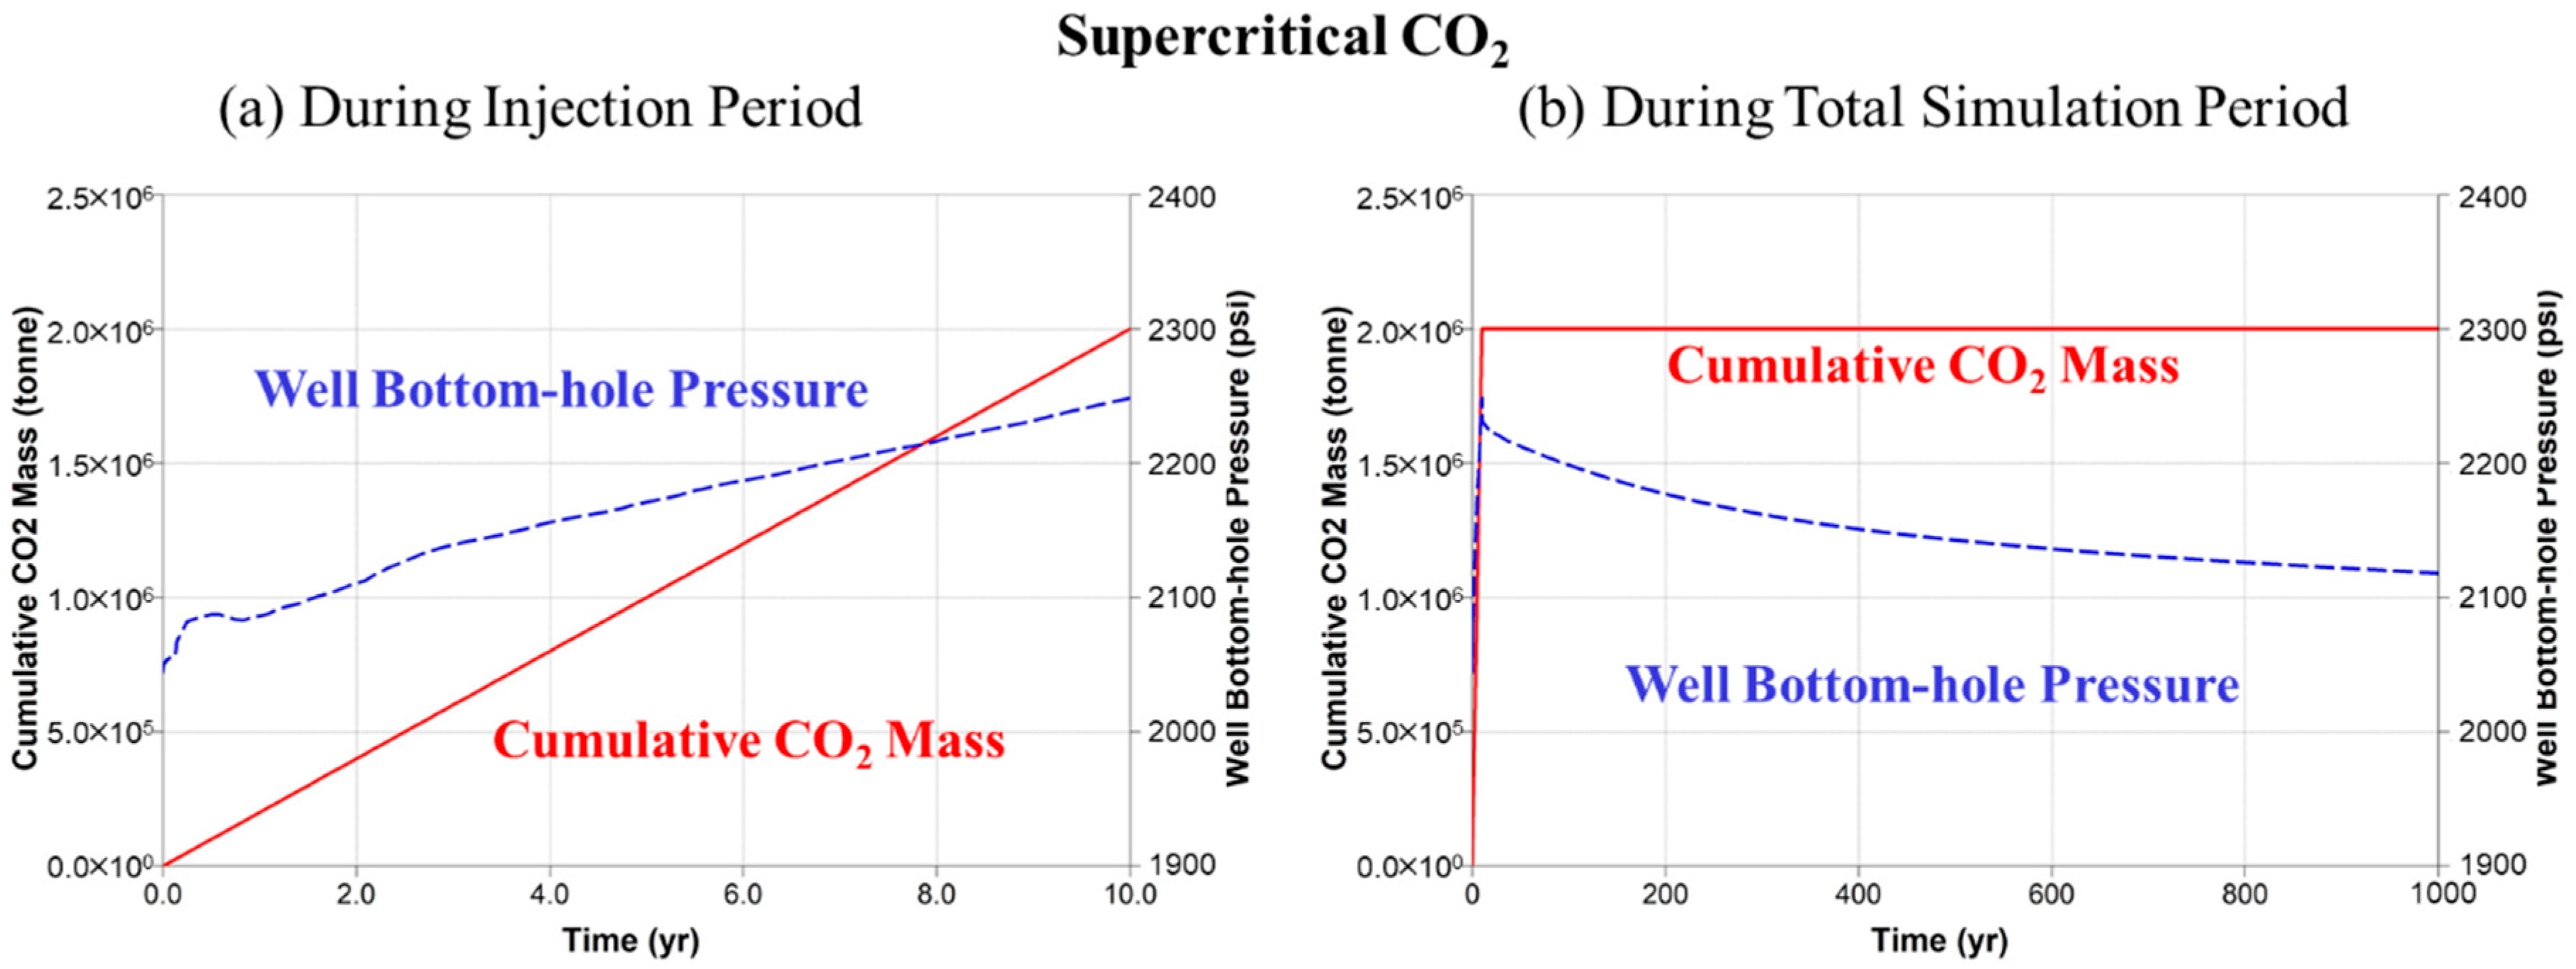
The injection profile of the supercritical CO2 scenario is shown in Figure 5. The initial bottom-hole pressure was about 2000 psi. With the continuous injection of supercritical CO2, the bottom-hole pressure rose to about 2250 psi after 10 years of injection. Based on the evaluation result of the maximum sustainable pressure in the YTP formation in this target site, the smallest evaluated value of the maximum sustainable pressure was about 1100 psi [23]. In the supercritical CO2 scenario, the pressure increment induced by CO2 injection was just about 250 psi, so it would not lead to a geomechanical failure occurring in the target reservoir. After the well shut-in, since the supercritical CO2 is accumulated at the top of the anticline, the well bottom-hole pressure would decrease slowly. At the end of the simulation, the bottom-hole pressure was about 2120 psi, which was higher than the initial bottom-hole pressure. Because the increment of the bottom-hole pressure was not very great, the buildup of the bottom hole pressure was considered safe over this injection period and post-injection period.
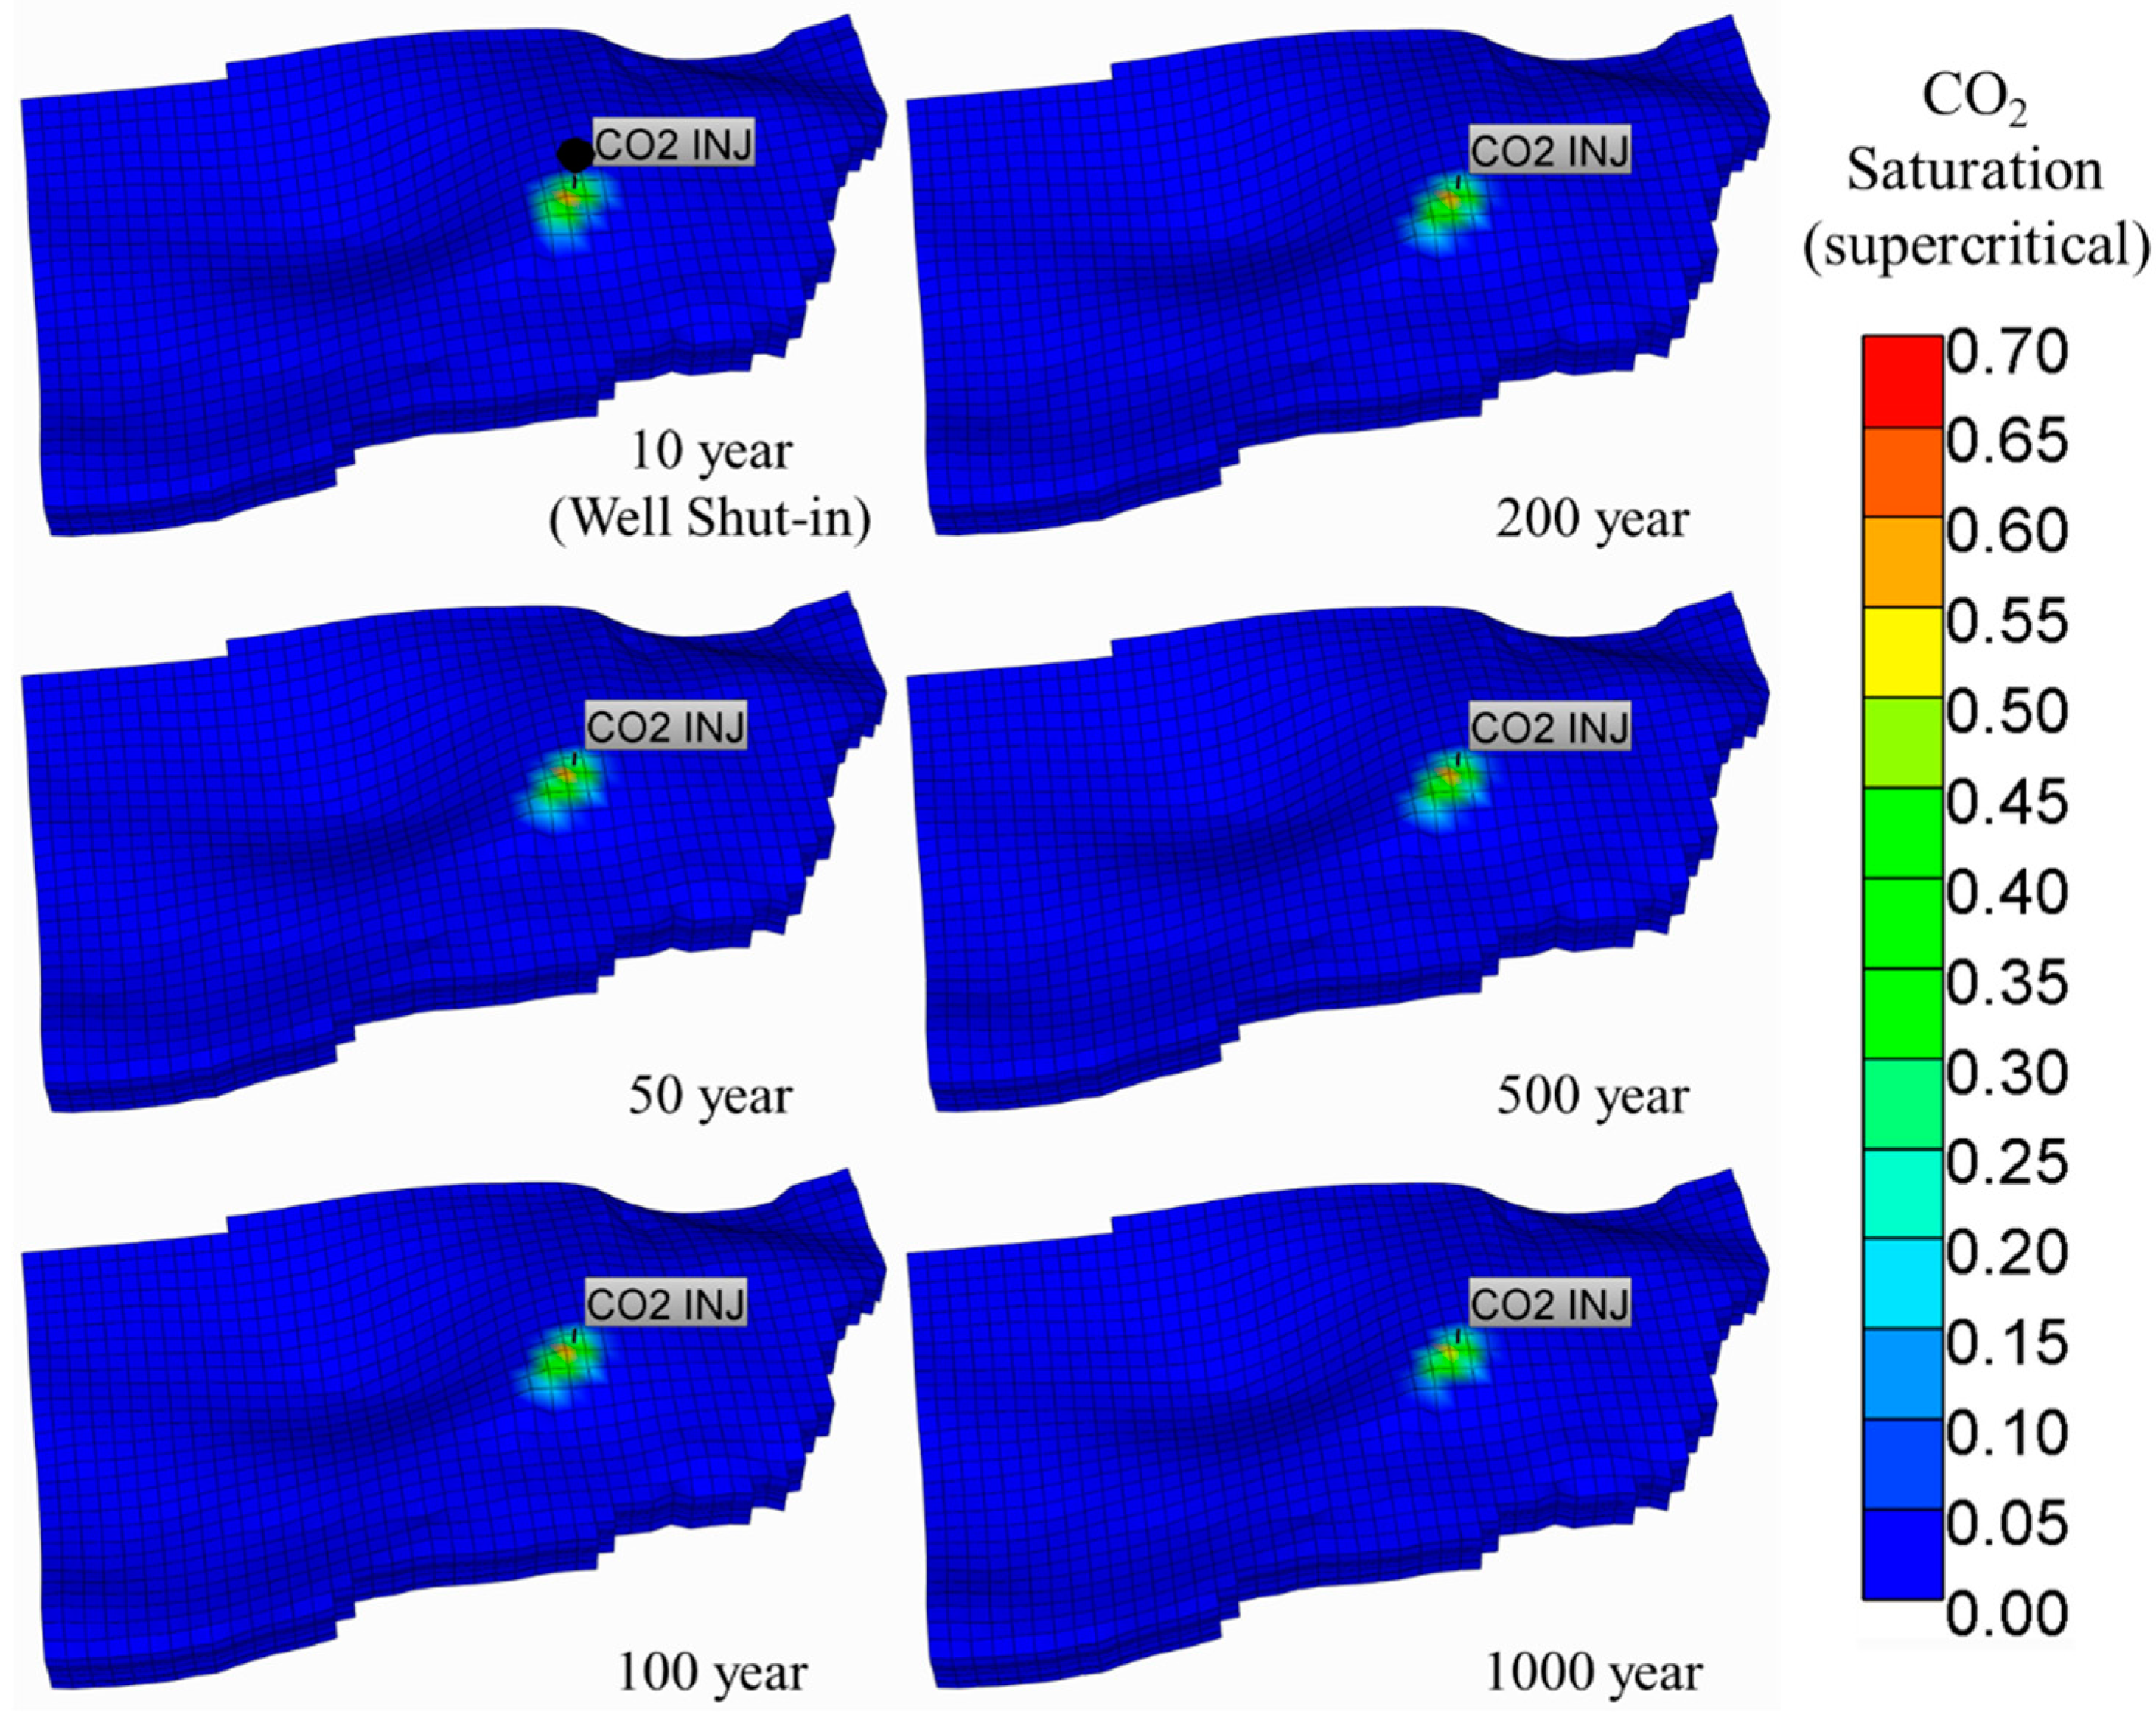
Based on the simulation results of the spatial distribution of CO2 saturation (Figure 6), the CO2 plume expanded to its largest size when the injection well was shut-in (10 years). After that, the plume gradually shrank due to the contribution of the solubility trapping mechanism. At the end of the simulation period (1000 years), the CO2 plume area was smaller than the largest size due to the contributions of the solubility, ionic, and mineral trapping mechanisms. Since the density of supercritical CO2 was smaller than that of the formation water and the trapping mechanisms associated with geochemical reactions occur slowly, the CO2 plume was still located at the top of the anticline in the YTP formation at the end of the simulation.
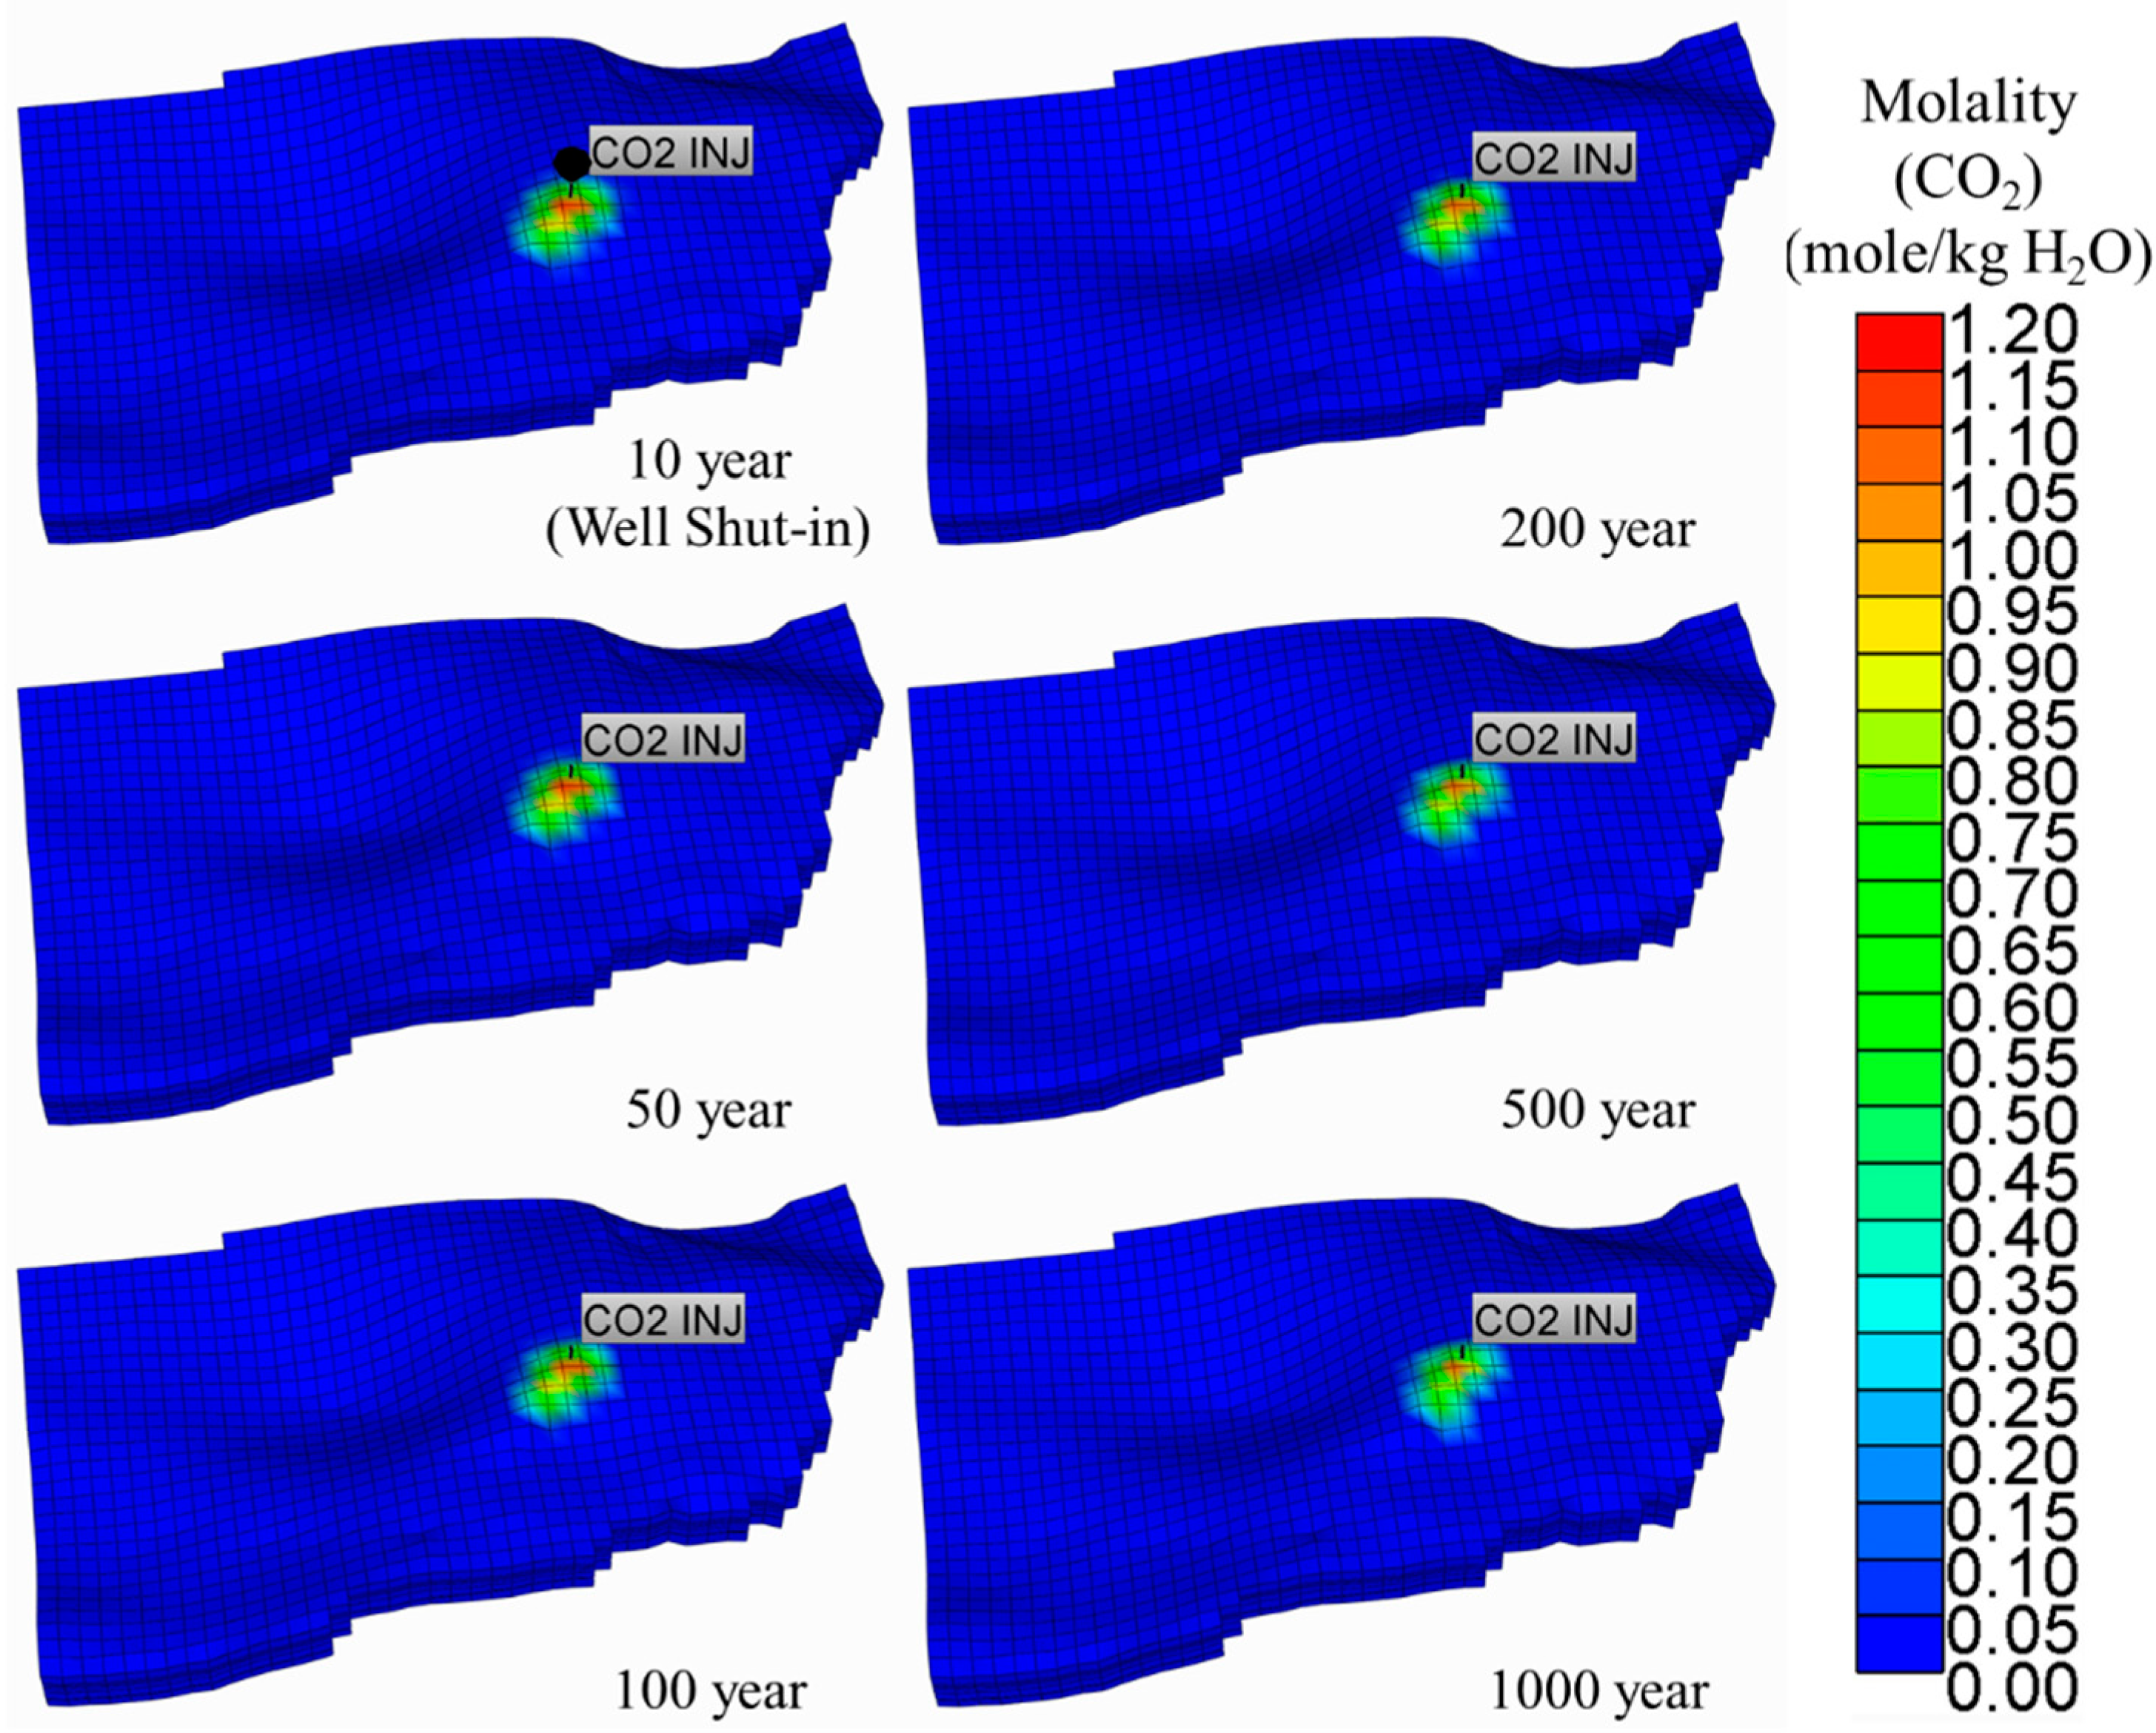
The spatial distribution of the CO2 molality is shown in Figure 7. The plume of the CO2 dissolved in the saline of the formation was similar to that of the supercritical CO2. The plume of the CO2 molality expanded slightly in the early stages after the injection well was shut-in because of the downward migration of the CO2-saturated water with a high density caused by CO2 dissolution. In the later stages, the plume of the CO2 molality shrank due to the contributions of the ionic and mineral trapping mechanism. However, the plume of the CO2 molality was still located at the top of the anticline in the YTP formation at the end of the simulation.
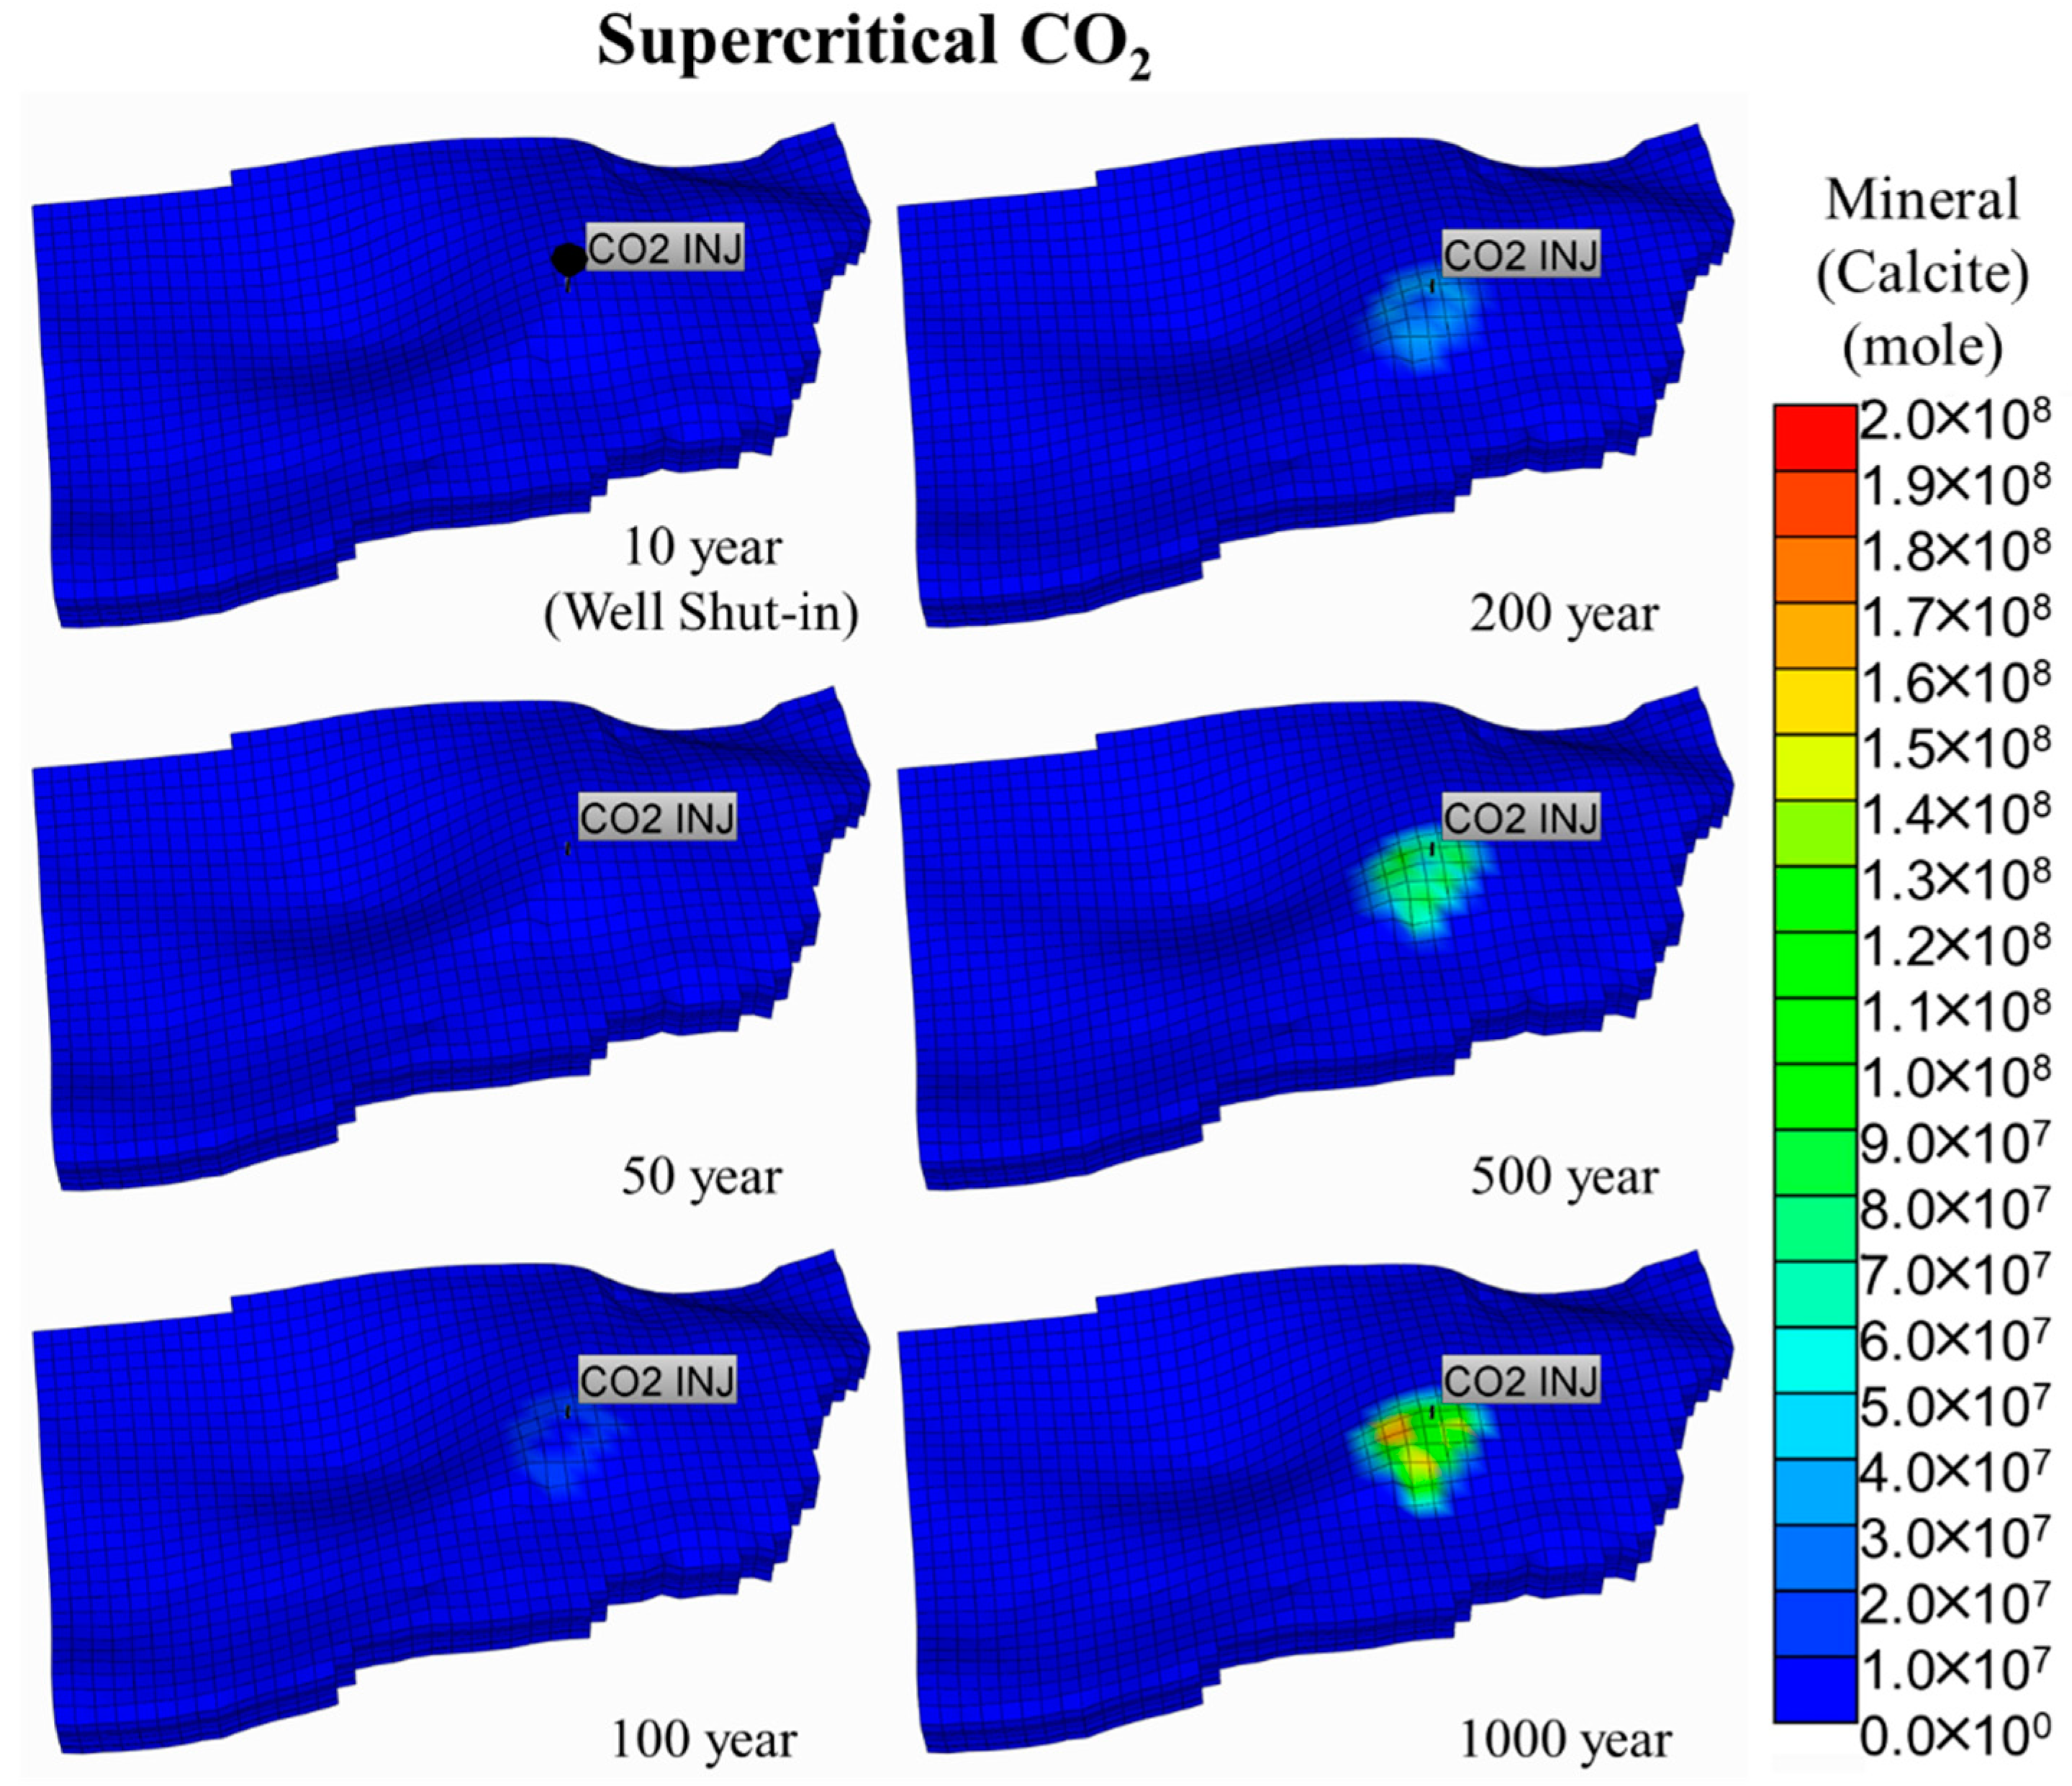
The spatial distribution of the change in the moles of calcite is shown in Figure 8. At the end of the injection, there was no significant mineral precipitation. The contribution of the mineral trapping mechanism becomes significant after hundreds of years. CO2 in the HCO3- and CO32- forms achieved via ionization and dissociation results in the precipitation of calcite. At the end of the simulation, the calcite precipitated in the region near the plume of the CO2 molarity.
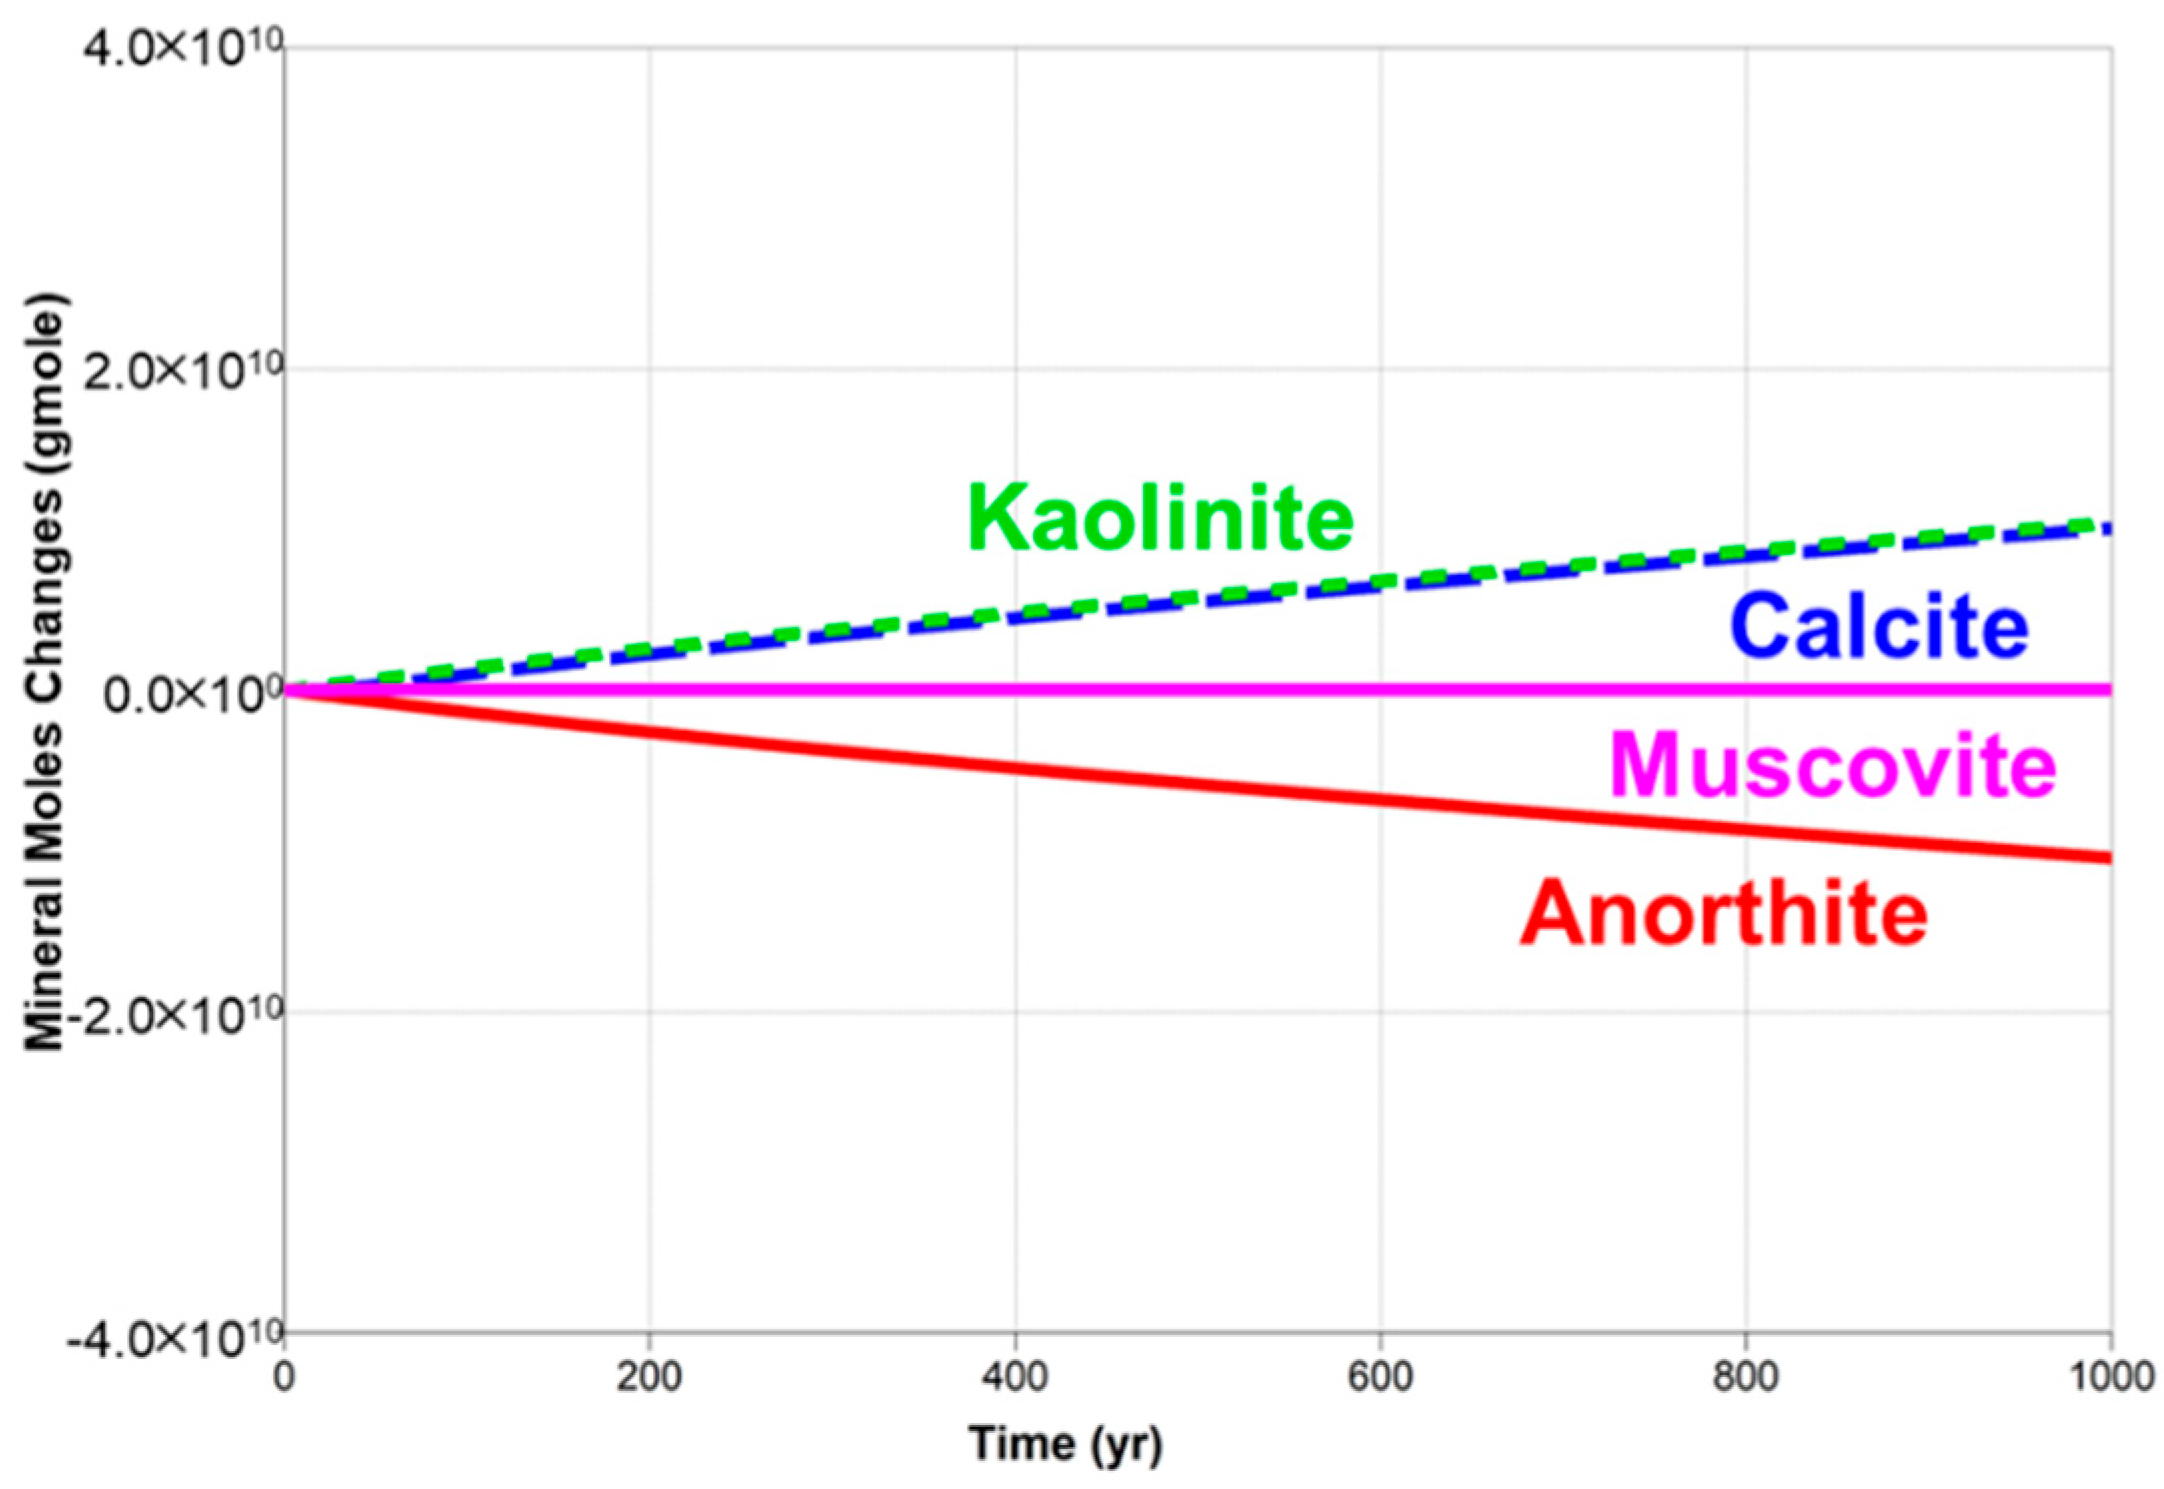
The evolution profiles of kaolinite, calcite, muscovite, and anorthite are shown in Figure 9. Anorthite, which is a calcium-rich mineral which is non-carbonate in the formation, dissolves to provide calcium to the formation water caused by formed carbonic acid in the formation water. Calcite and kaolinite precipitate resulting from the calcium ions, which are from the dissolution of anorthite. In regions with a decrease in pH due to CO2 dissolution, the dissociation of muscovite releases potassium ions into the formation water and leads to the precipitation of kaolinite. The geochemical reactions of the minerals did not achieve a balance between dissolution and precipitation at the end of the simulation. The trend of the dissolution of anorthite and trend of the precipitation of calcite and kaolinite showed that the amount of CO2 trapped by the mineral trapping mechanism would be greater if the simulation time were increased.

5.2. Dissolved CO2 Scenario

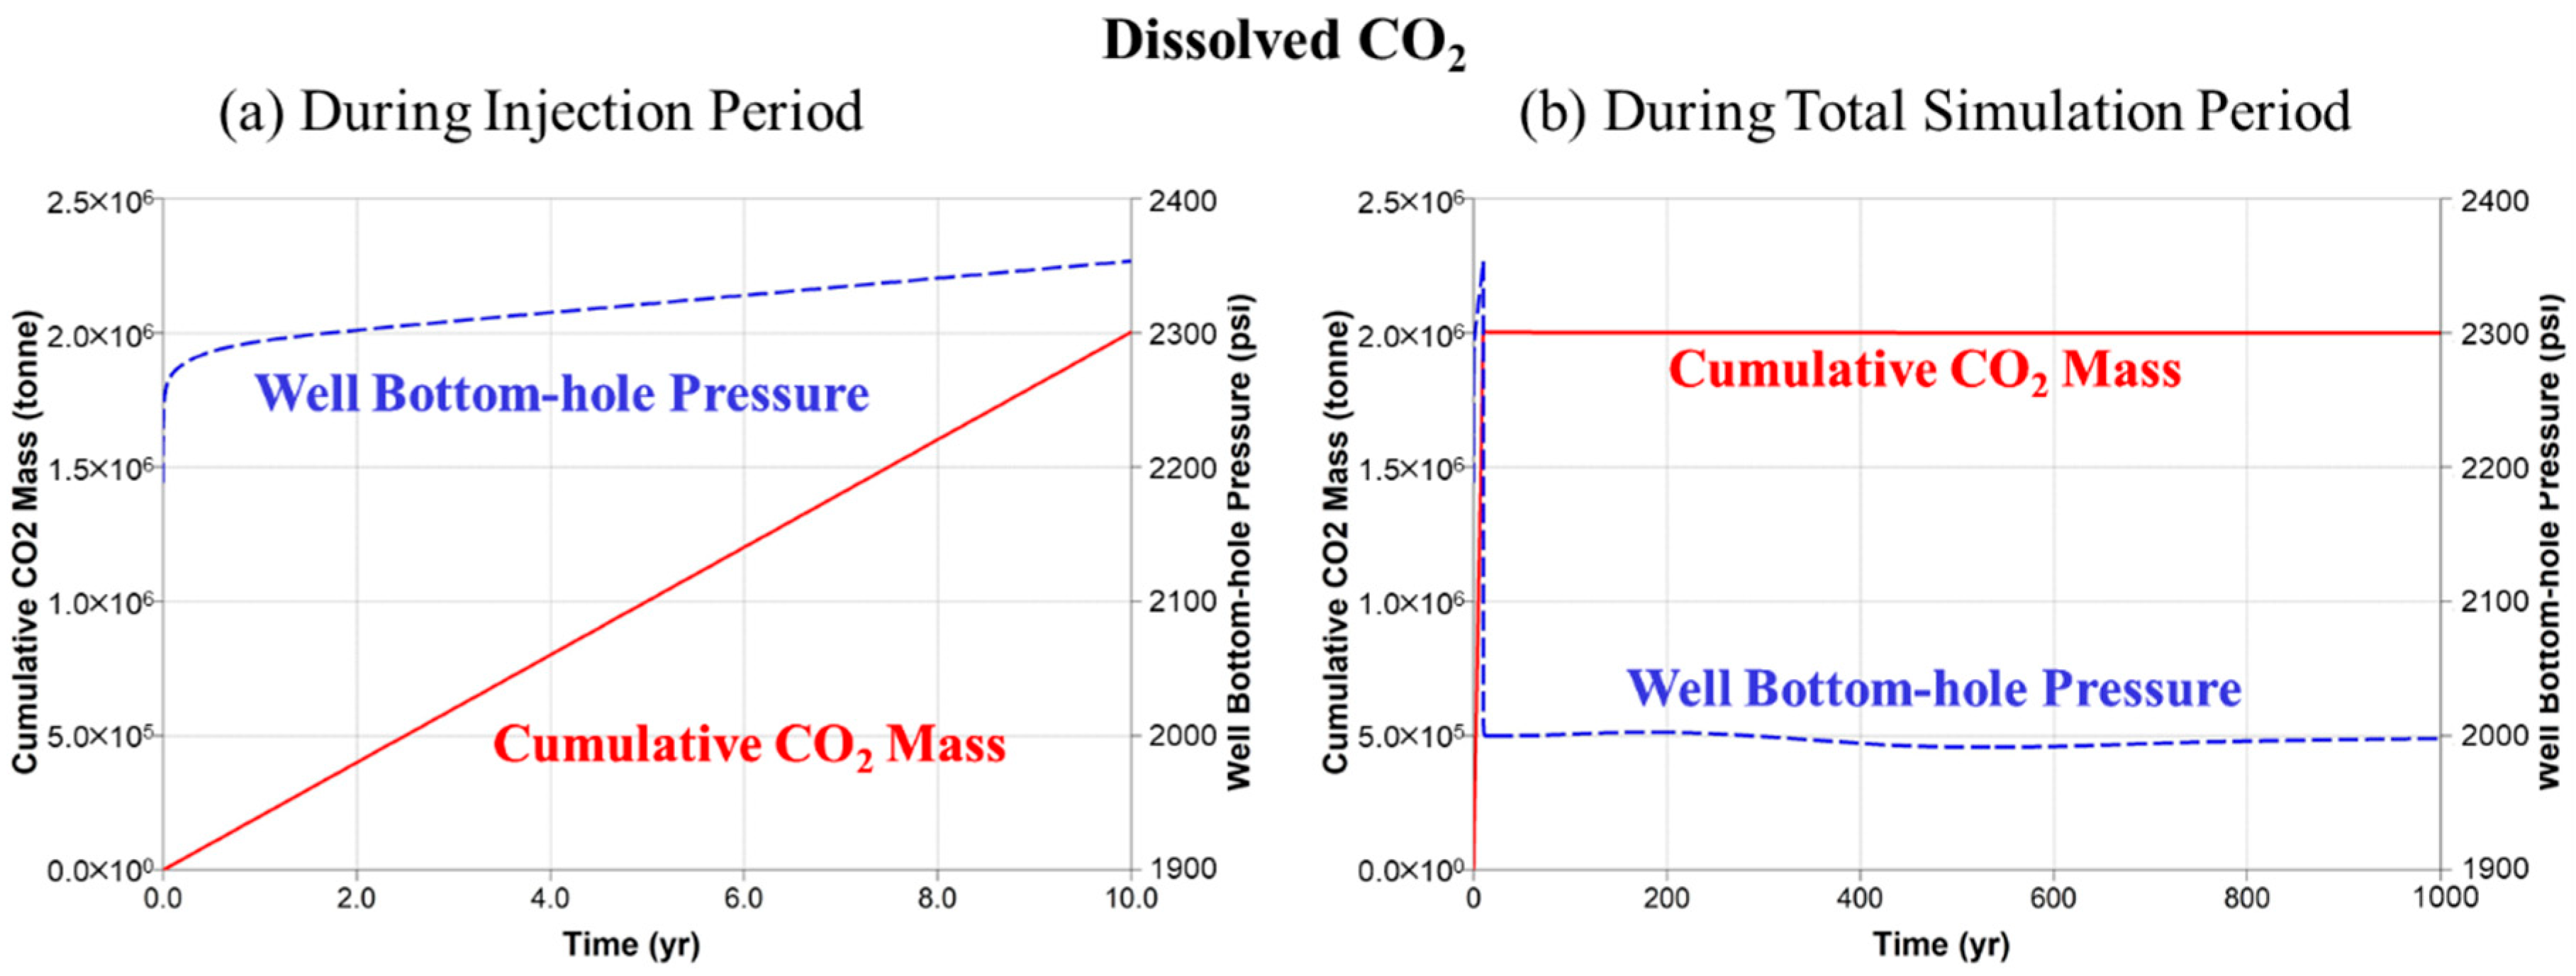
The injection profile of the dissolved CO2 scenario is shown in Figure 10. With the continuous injection of the CO2 solution, the bottom-hole pressure rose to about 2350 psi after the 10-year injection period. In the dissolved CO2 scenario, the pressure increment induced by injecting the CO2 solution was about 350 psi. Although the pressure increment in the dissolved CO2 scenario was higher than that in the supercritical CO2 scenario, it was still less than the sustainable pressure constraint of 1100 psi, and geomechanical failure will not happen in the target reservoir. After the well shut-in, the pressure decreased quickly because of the balance of the formation pressure in the aquifer is fast due to the convection. At the end of the simulation, the bottom-hole pressure was close to the initial bottom-hole pressure.
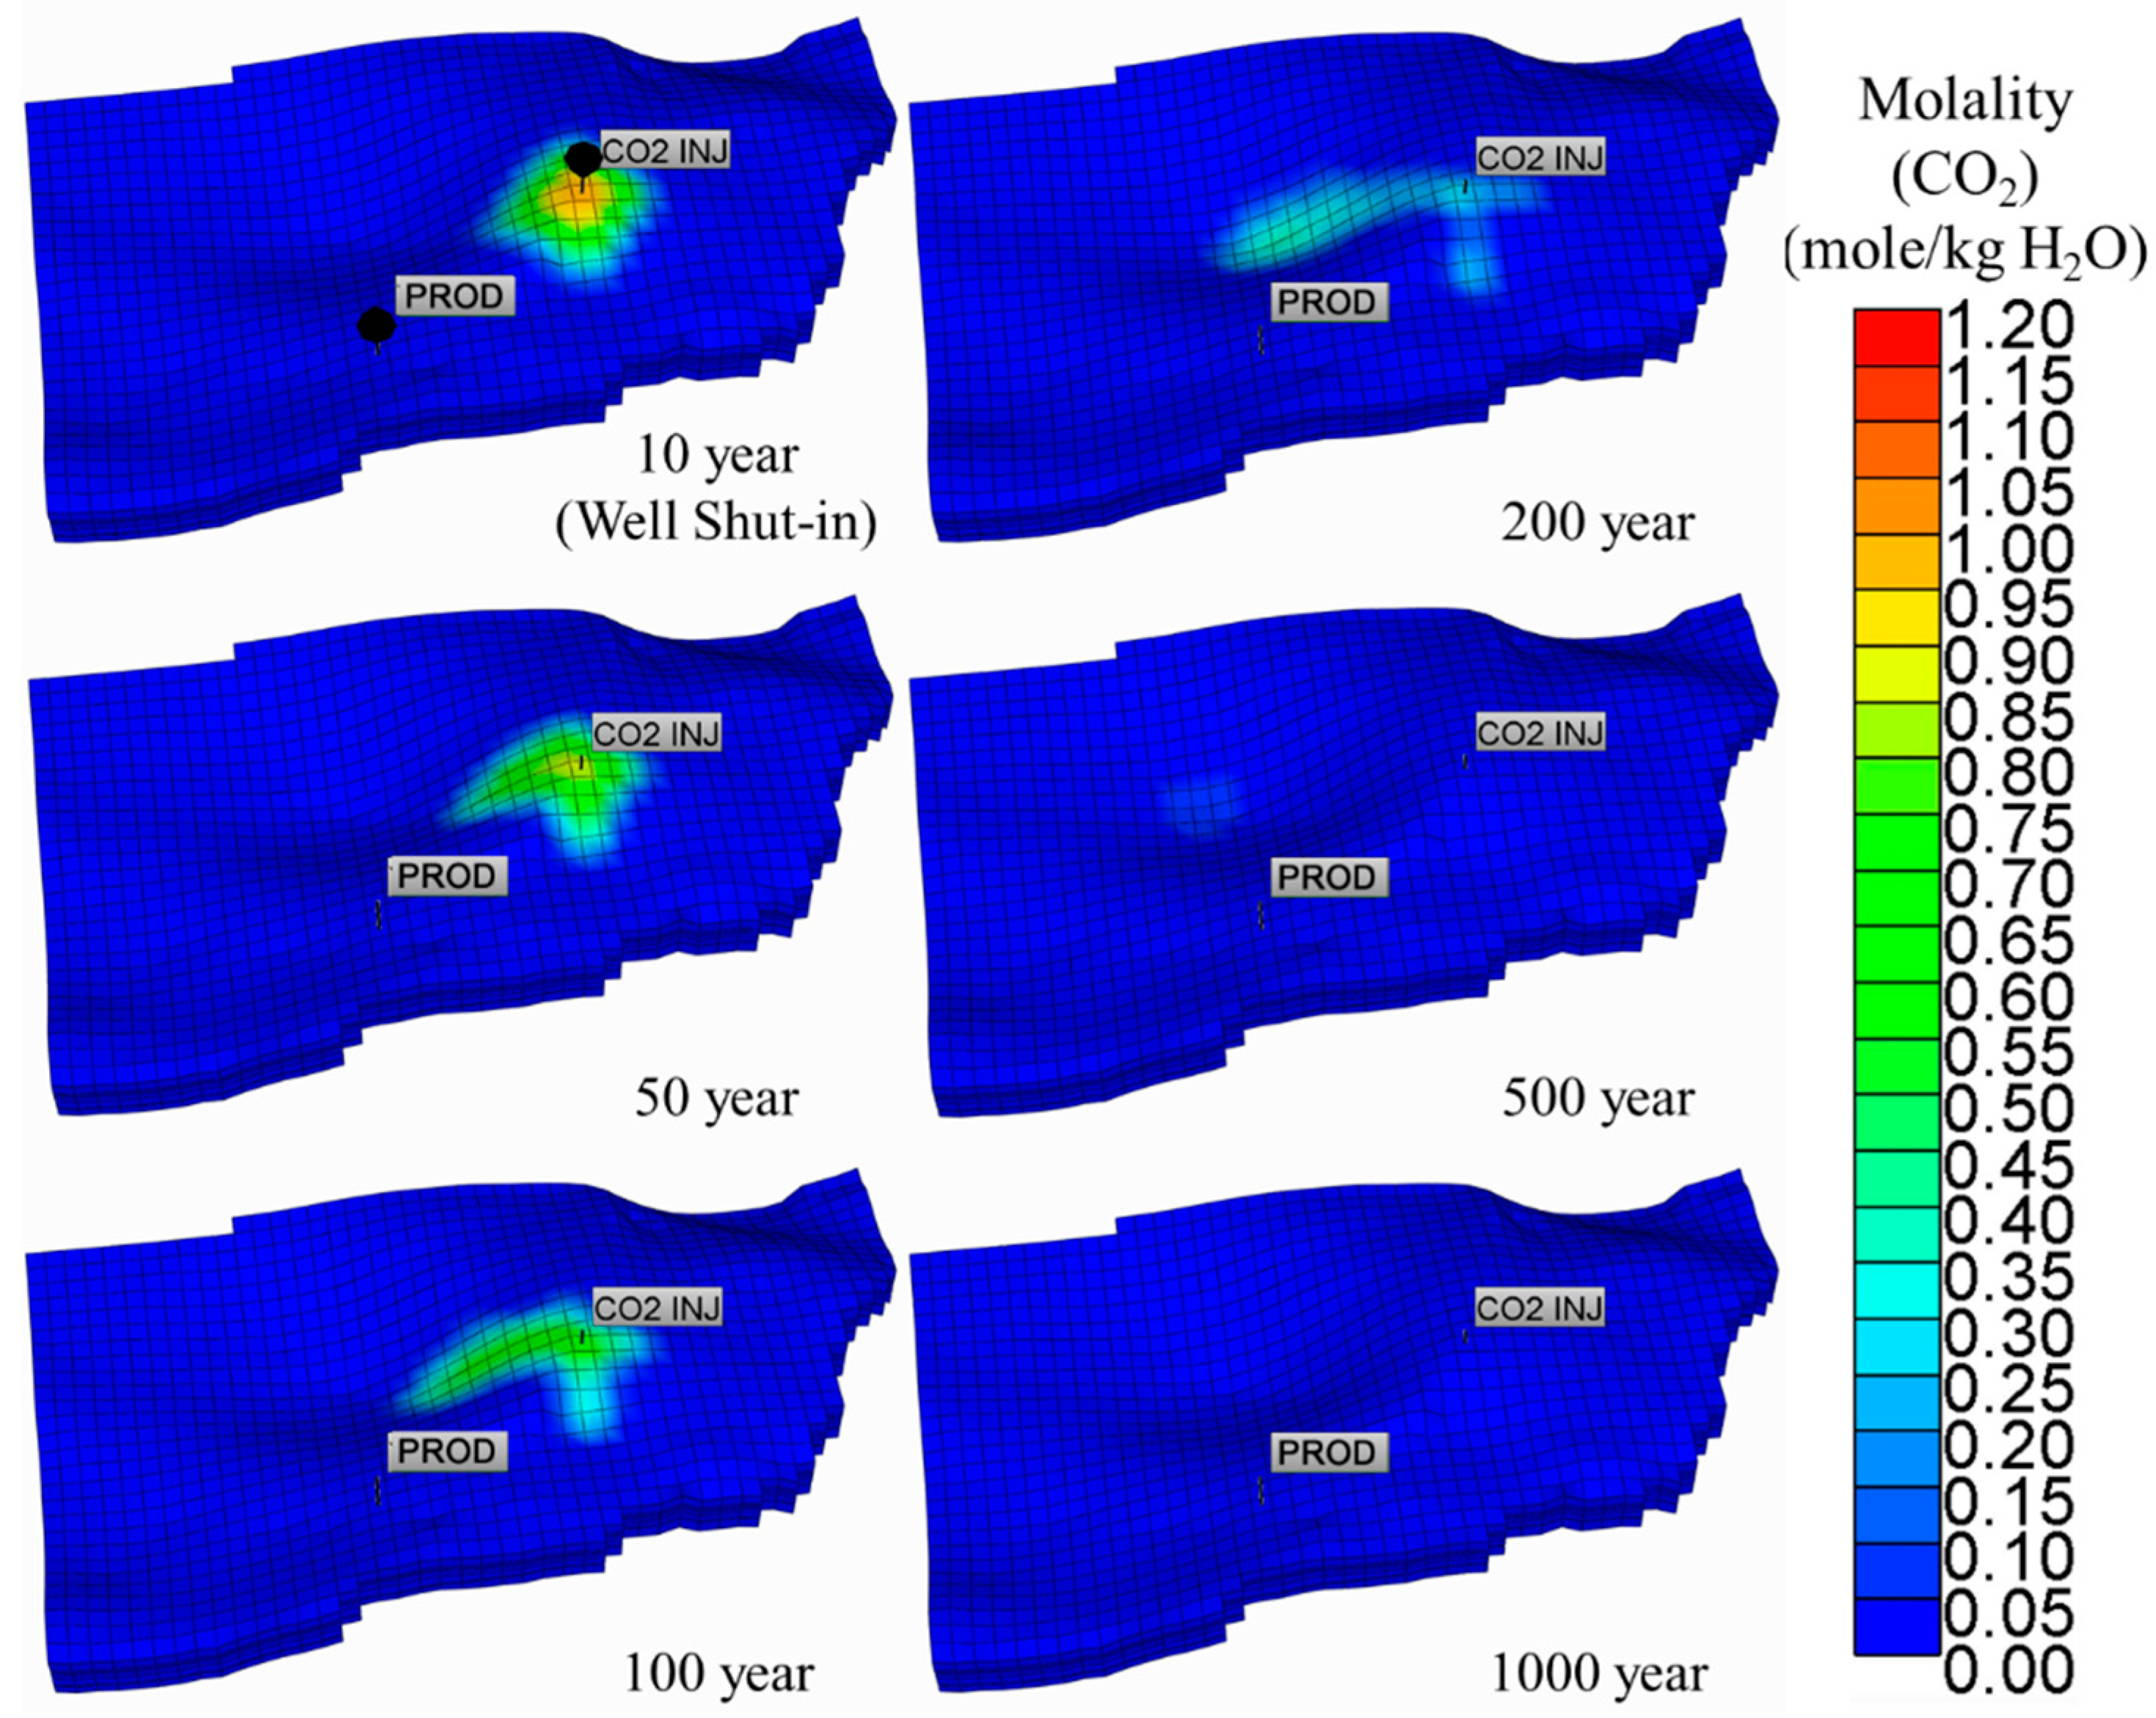
The spatial distribution of the CO2 molality is shown in Figure 11. The plume of the CO2 dissolved in the saline in the formation was located at the top of the anticline in the YTP formation at the end of the injection process. Because of the effect of the production well, during the injection period, the direction of the migration of the CO2 plume was slightly toward the production well. After the shut-in of the injection well, the area of the plume of the CO2 molarity expanded because of the downward migration of the higher-density CO2 solution in comparison to the formation water. The shape of the plume of the CO2 molarity changed due to the structure of the YTP formation in the Y-field. After 500 years, the majority of the plume of high CO2 concentration had disappeared as the result of the contributions of the geochemical reactions (i.e., ionic and mineral trapping mechanisms).
The spatial distribution of the change in moles of calcite is shown in Figure 12. At the end of the injection, there was no significant mineral precipitation. The contribution of the mineral trapping mechanism appeared after 100 years. In the early stages, the calcite precipitated near the top of the anticline, where the plume of the CO2 molarity was. Because the plume of the CO2 molarity migrated downward, the calcite precipitated at the bottom of the YTP formation in the later stages. The calcite precipitated both at the top of the anticline and the bottom of the YTP formation in the Y-field at the end of the simulation period (1000 years).
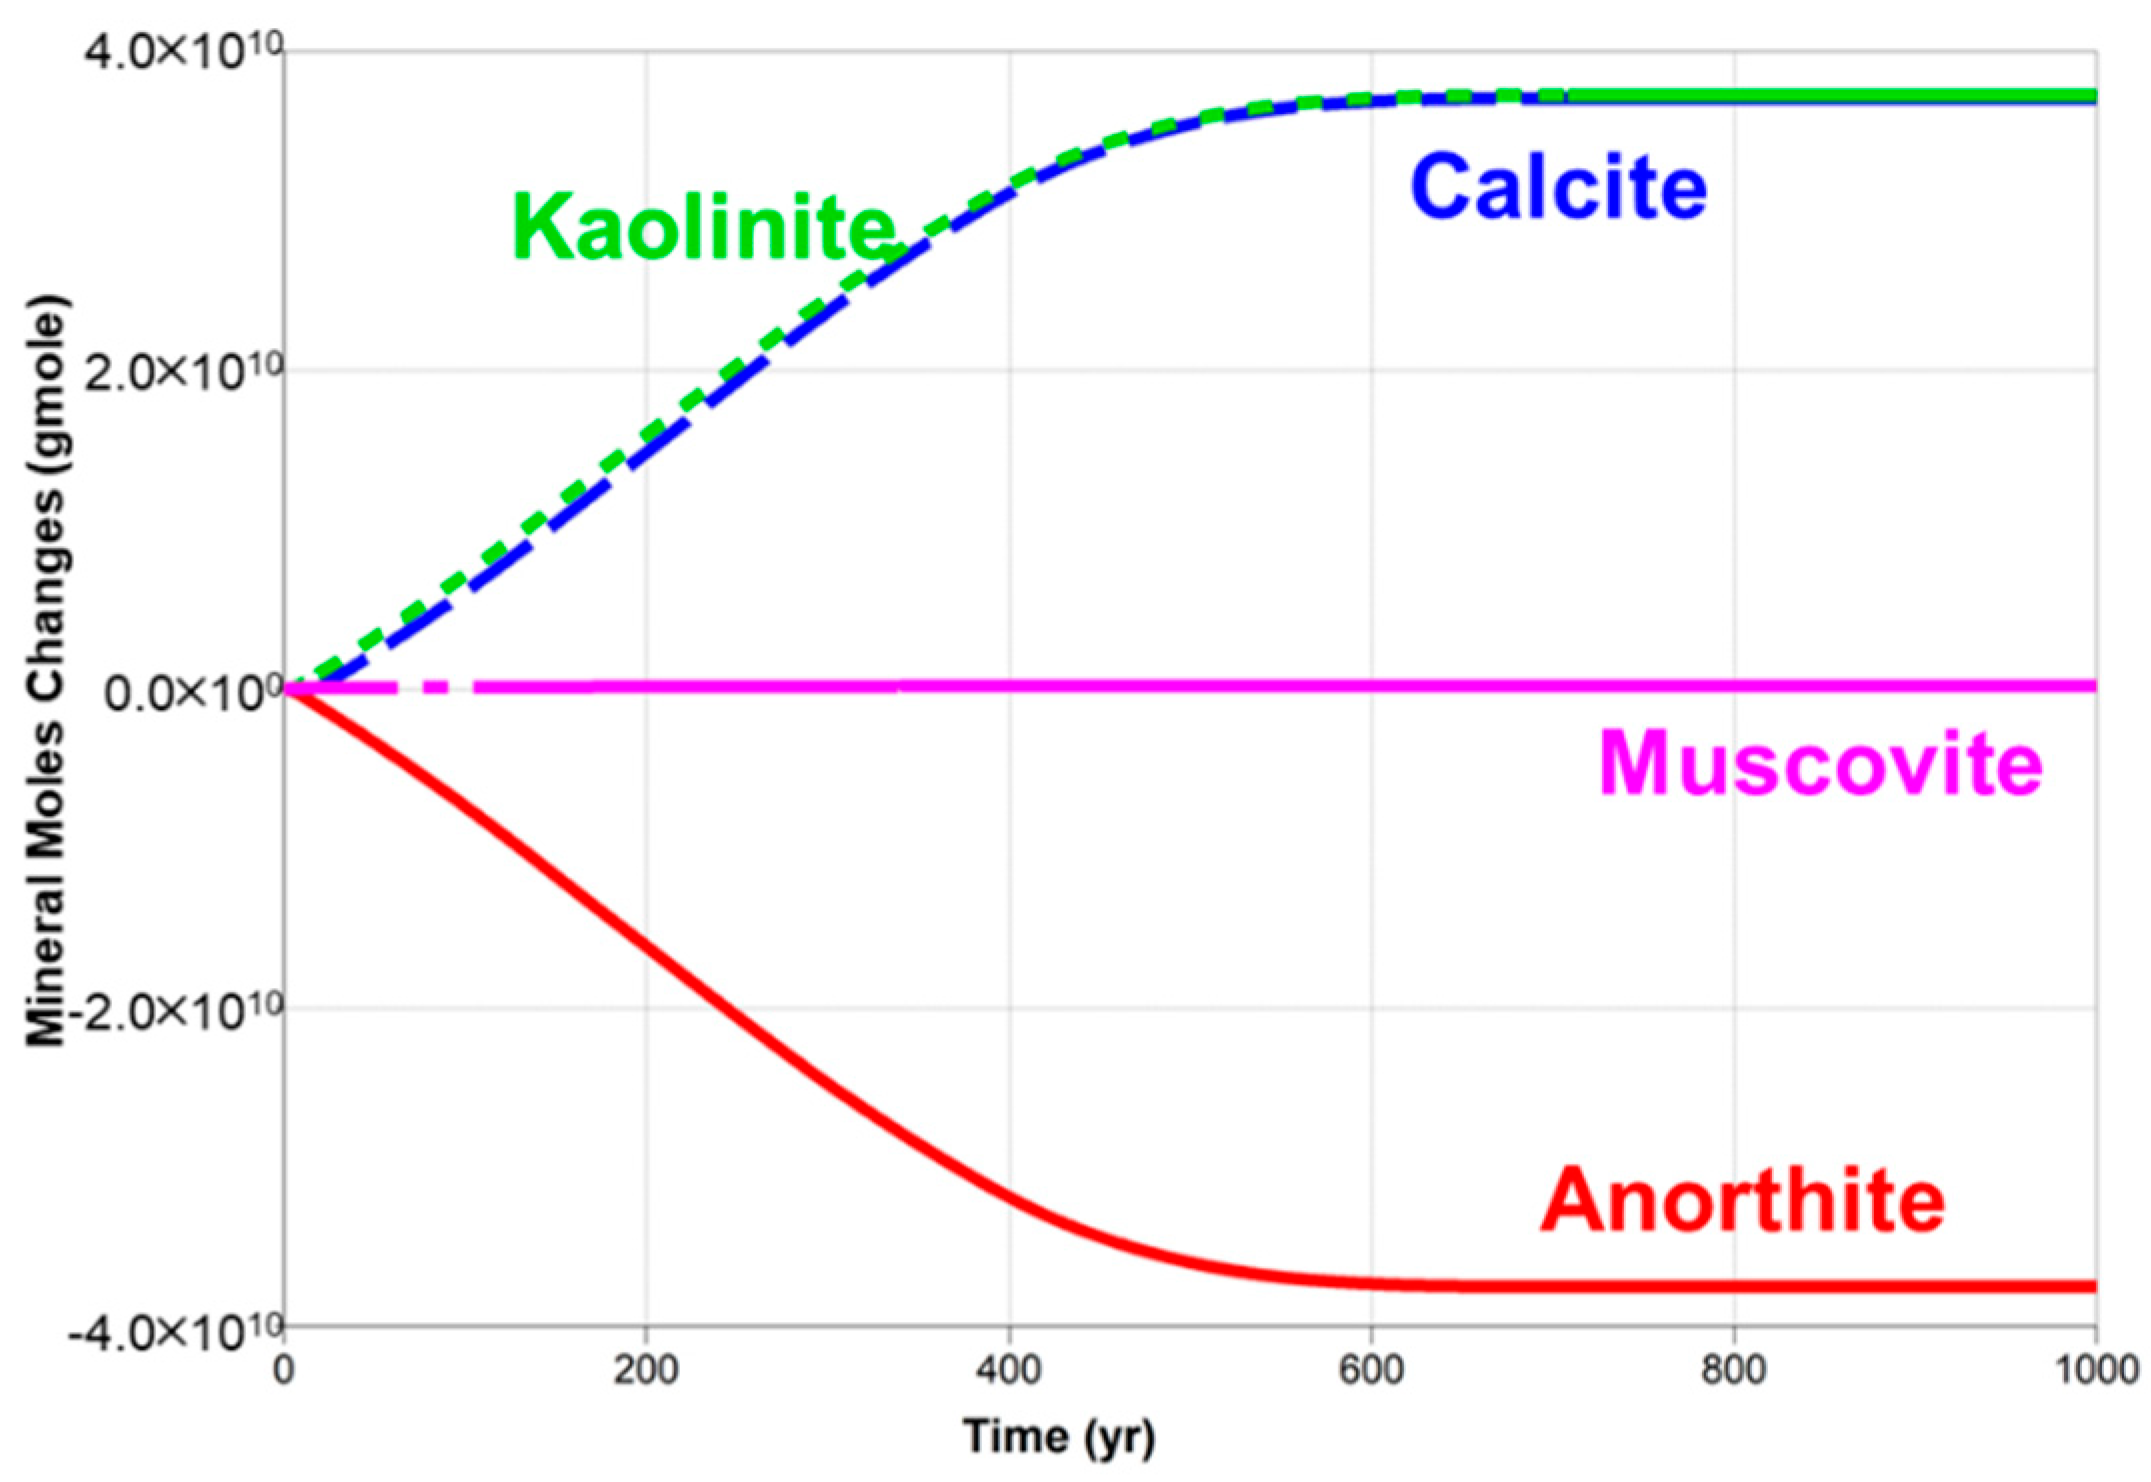
The evolution profiles of kaolinite, calcite, muscovite, and anorthite are shown in Figure 13. The geochemical reactions of the minerals occurred at a fast rate in the dissolved-CO2 injection scenario. The majority of the injected CO2 was transformed into carbonate minerals after 400 years. The rate of the geochemical reactions thereby decreased. The balance between the dissolution and precipitation geochemical reactions of the minerals was achieved after about 600 years.

5.3. Comparison of the Supercritical CO2 and Dissolved CO2 Scenarios

Based on the simulation results of the spatial distribution of the CO2 molality in these two scenarios described above (Figure 14), the plume area of the supercritical CO2 scenario was smaller than that of the dissolved CO2 scenario when the injection well was shut-in (10 years). In the supercritical CO2 scenario, the highest molality of CO2 in the aqueous phase was located near the wellbore. At the end of the simulation period (1000 years), the plume area of the supercritical CO2 scenario decreased due to the contributions of the ionic and mineral trapping mechanisms. However, the plume area of the dissolved CO2 scenario disappeared because of the fast rate at which the geochemical reaction occurred to form carbonate.
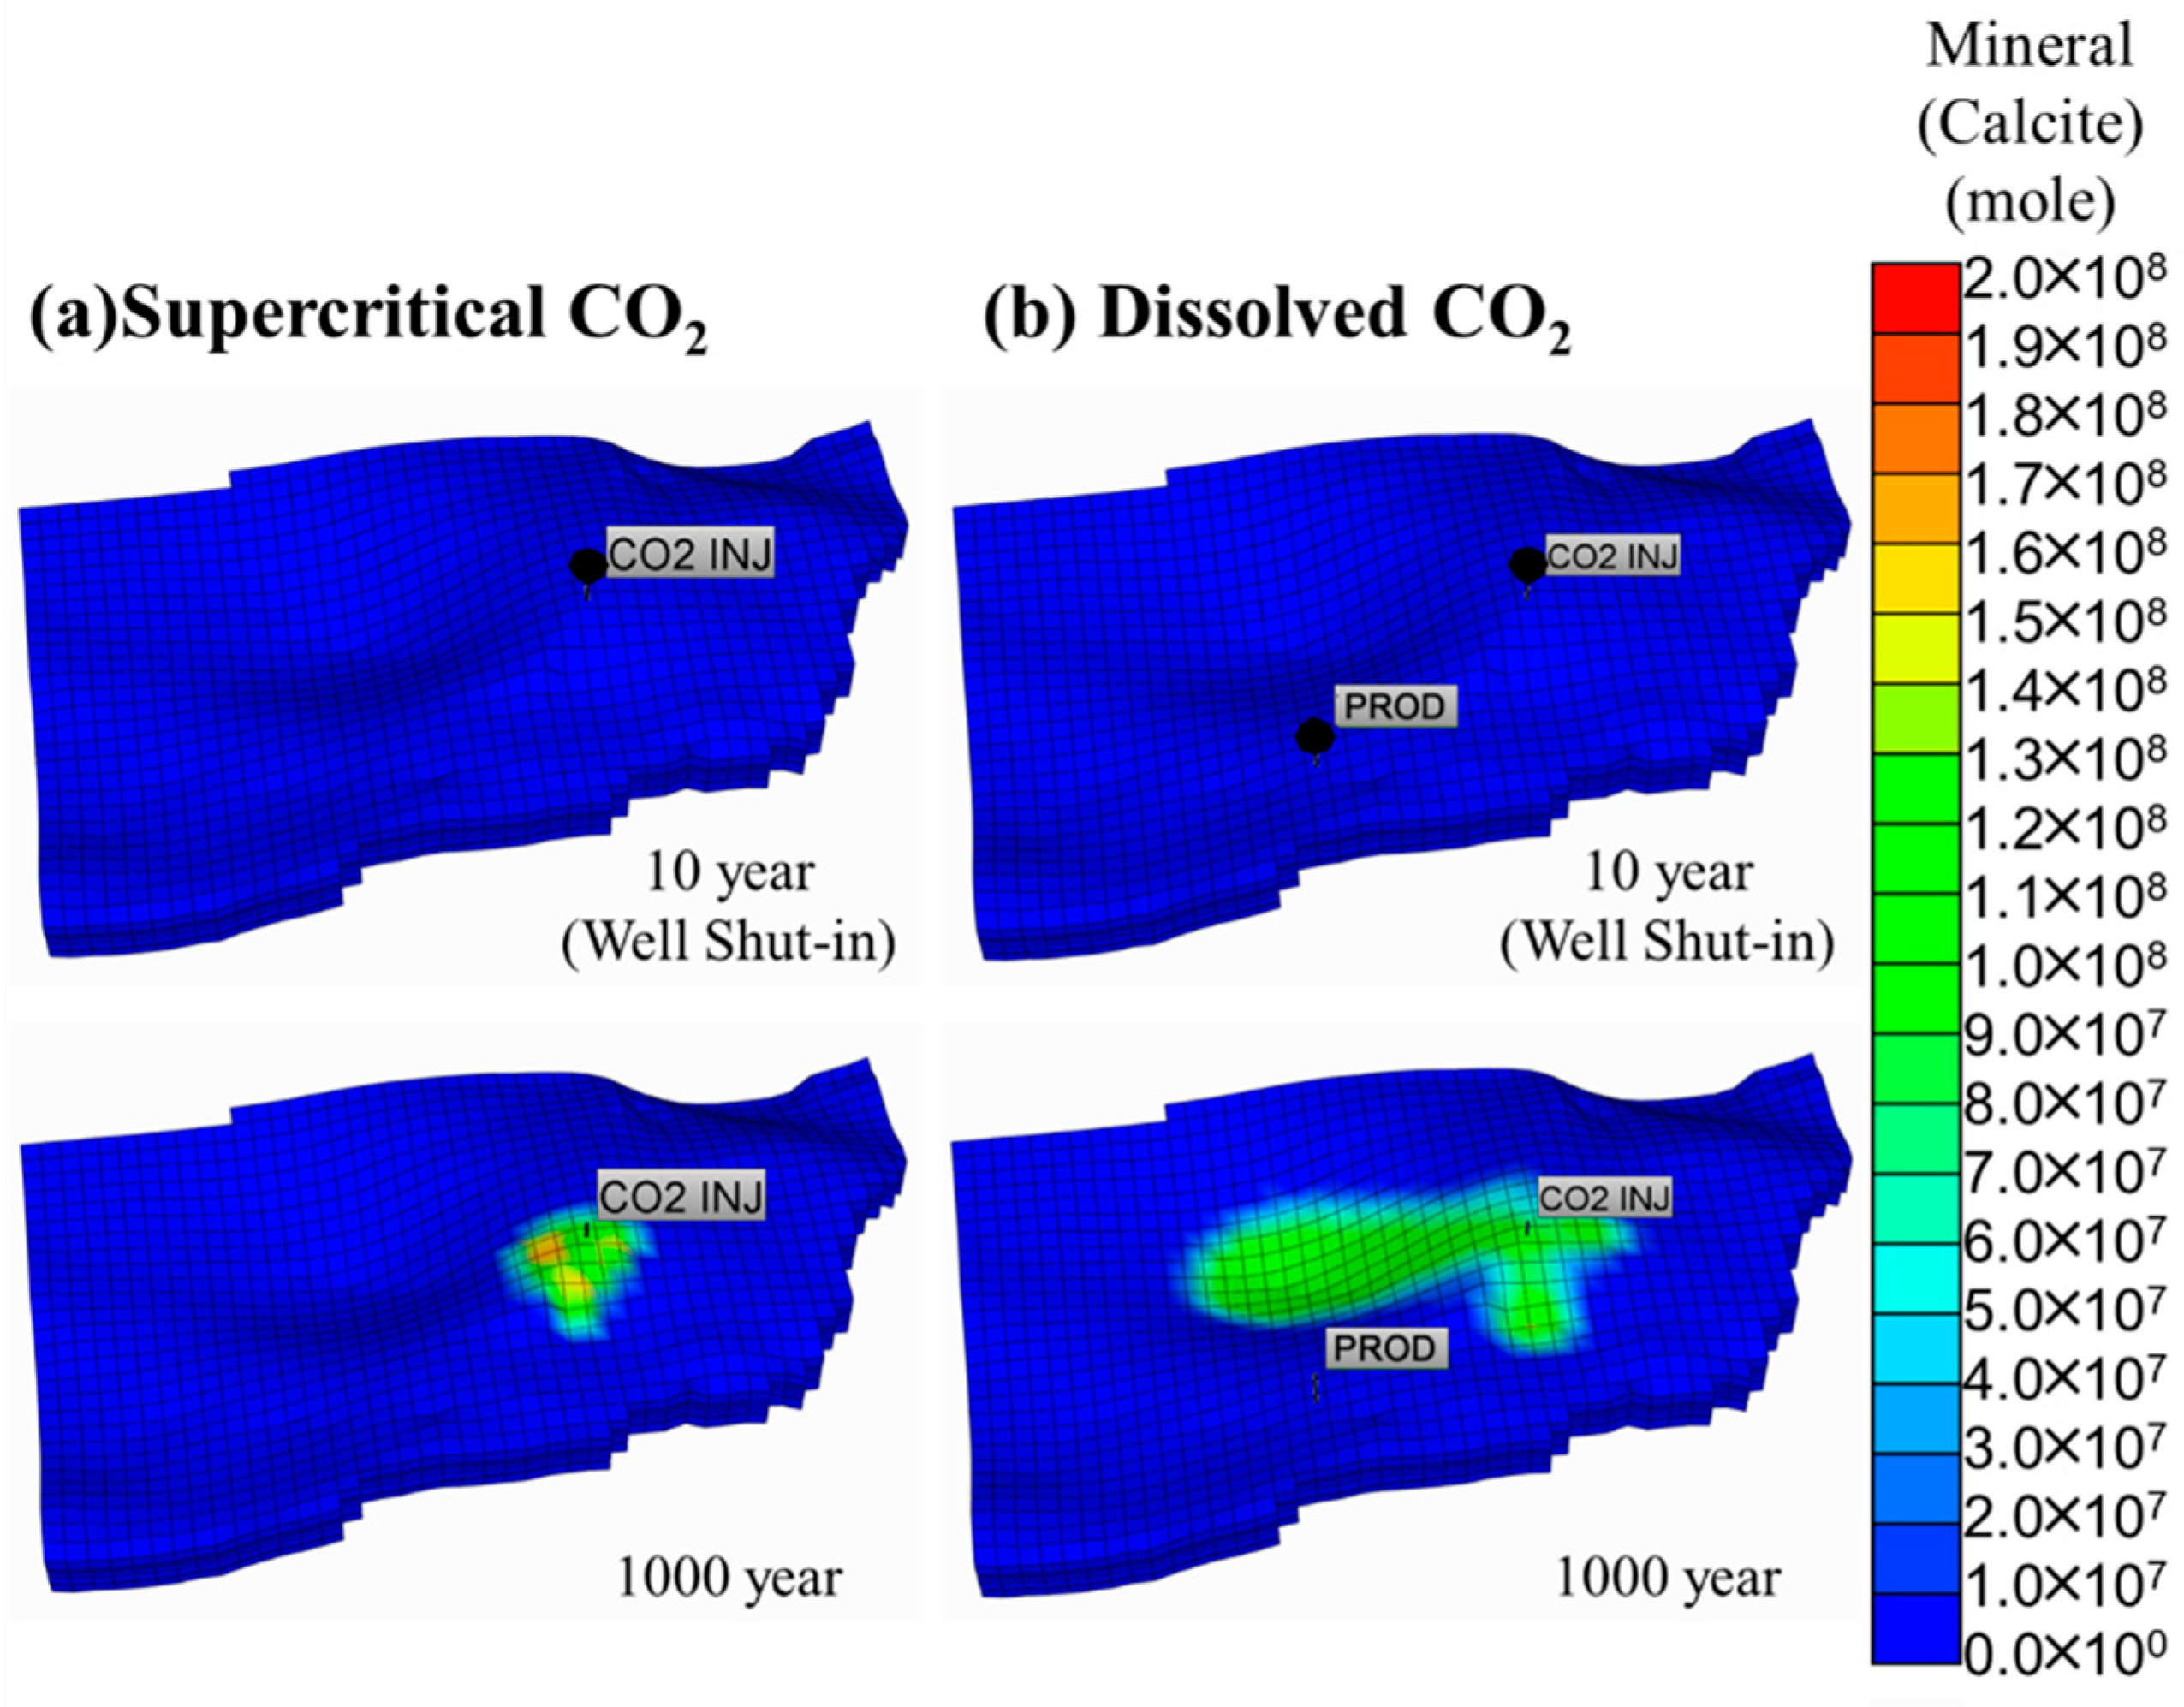
The spatial distributions of the change in moles of calcite in these two scenarios are shown in Figure 15. When the injection well was shut-in (10 years), in both scenarios, there was no significant mineral precipitation. The contribution of the mineral trapping mechanism became significant after hundreds of years. At the end of the simulation period, the calcite precipitated at the top of the anticline in the supercritical CO2 scenario. This occurred because the majority of the injected CO2 was still located at the top of the anticline in the YTP formation as a result of the low density of supercritical CO2. In the dissolved CO2 scenario, at the end of the simulation period (1000 years), the calcite mostly precipitated at the bottom of the YTP formation because the plume of the CO2 solution moved downward. The area of the calcite distribution in the dissolved CO2 scenario was much larger than that of the supercritical CO2 scenario. This occurred because the process of transforming the CO2 in an aqueous phase into a mineral phase is shorter than the process of transforming CO2 in a supercritical phase into a mineral phase.
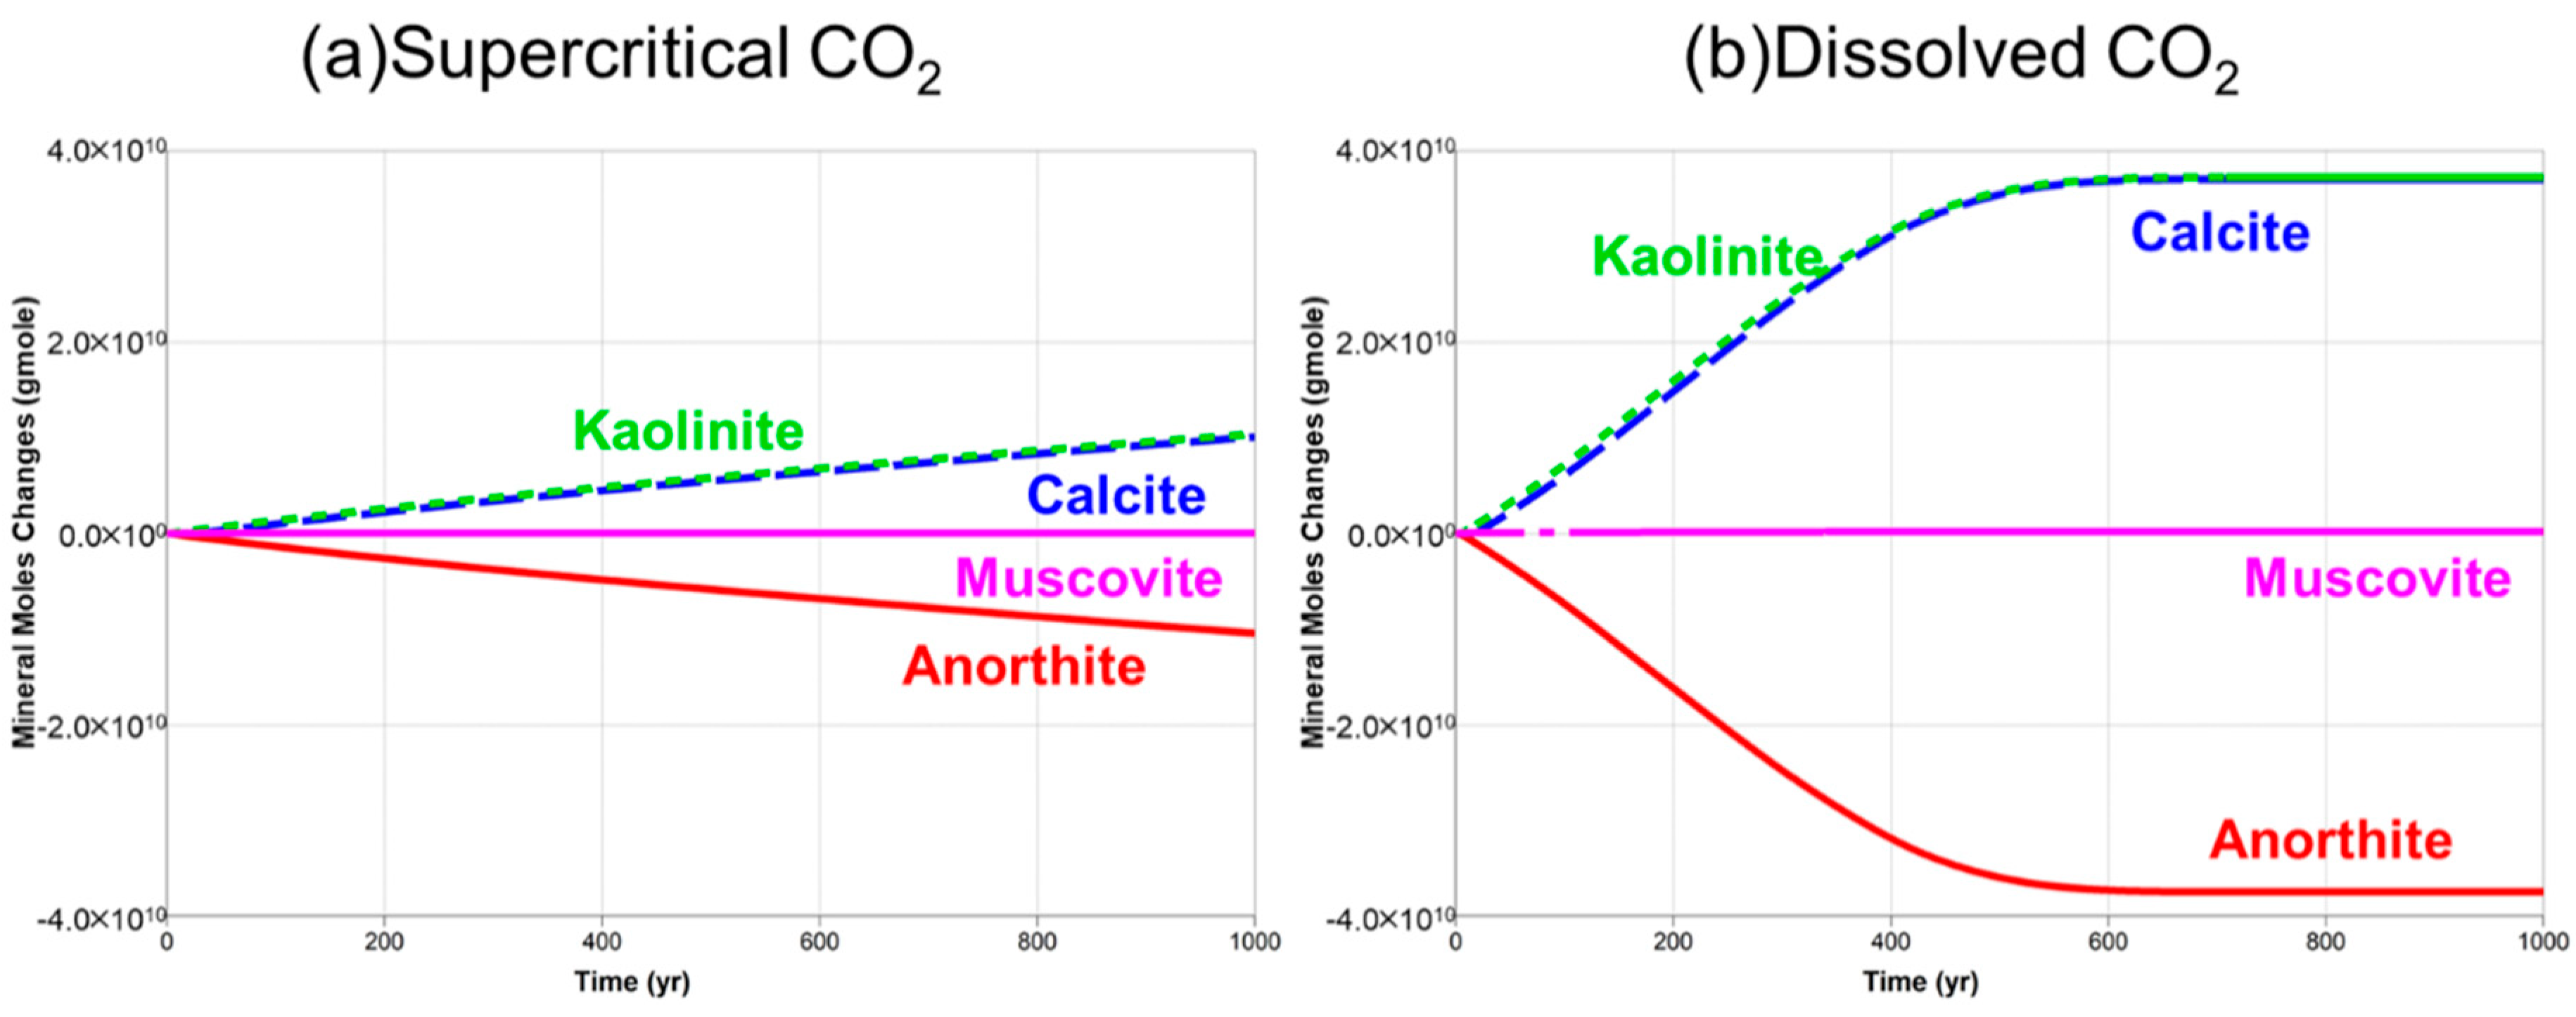
The evolution profiles of kaolinite, calcite, muscovite, and anorthite in these two scenarios are shown in Figure 16. Calcite, kaolinite, and muscovite are precipitation-phase minerals that occur when CO2 was injected into the YTP formation. Anorthite is a dissolution-phase mineral that provides a source of calcium in the formation water. The rate of the geochemical reactions of the minerals was much faster in the dissolved CO2 scenario than that in the supercritical CO2 scenario. In the dissolved CO2 scenario, the majority of the injected CO2 was transformed into the carbonate minerals after 400 years, and the balance between dissolution and precipitation reactions of the minerals was achieved after about 600 years. Compared to the dissolved CO2 scenario, the geochemical reactions of the minerals did not achieve such a balance after 1000 years in the supercritical CO2 scenario in the YTP formation.
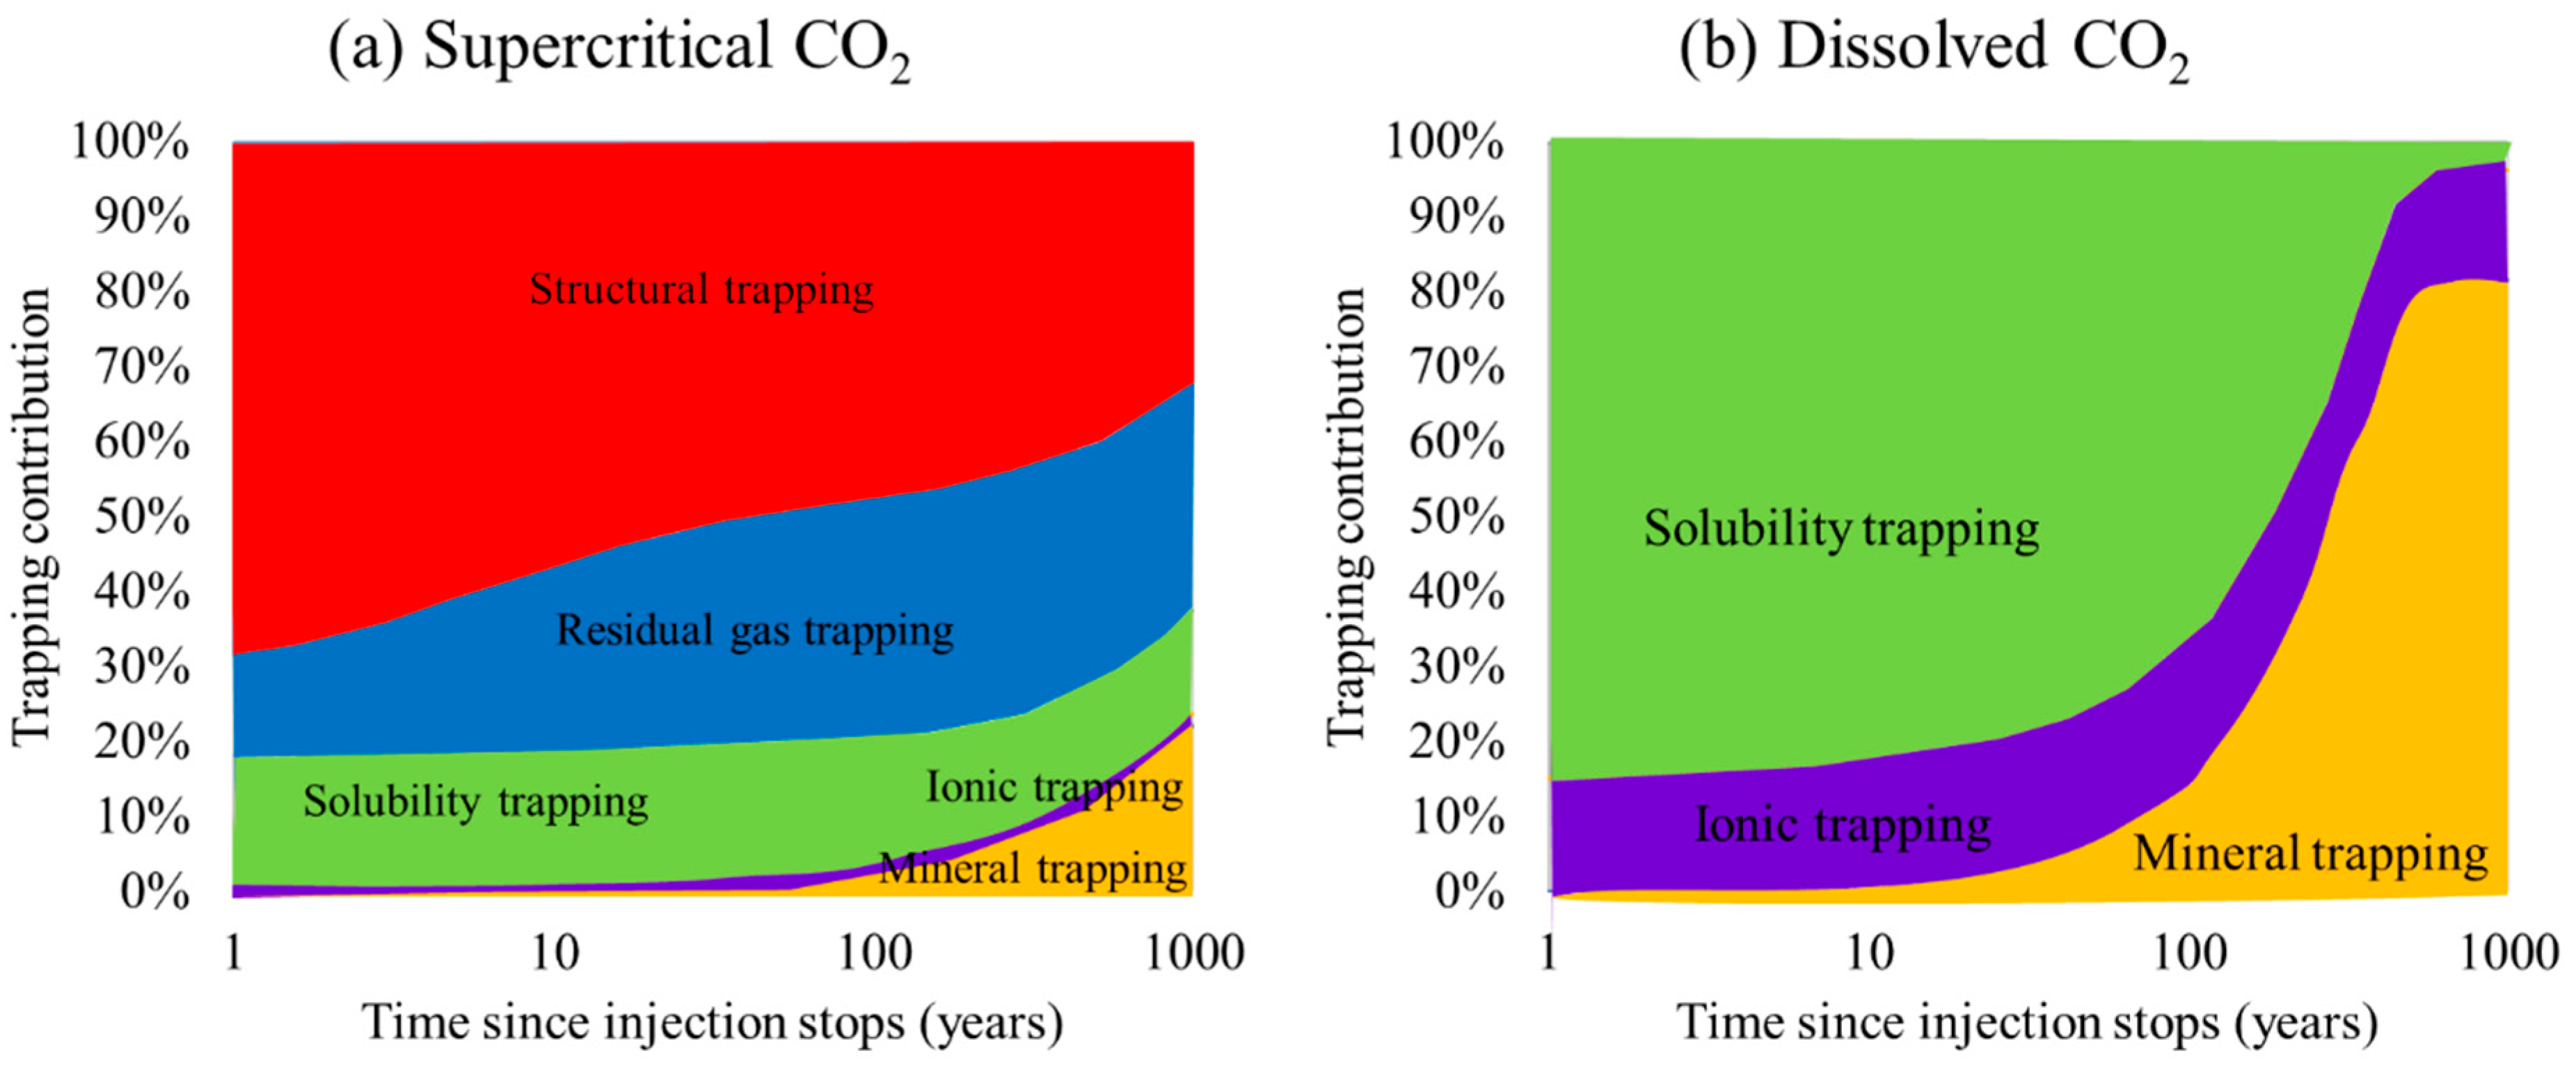
The contributions of the different trapping mechanisms in these two scenarios are shown in Figure 17. In the supercritical CO2 scenario, when the injection well was shut-in (10 years), 71.93% of the total 2-million tons of injected CO2 was trapped by structural trapping, and 9.88%, 17.70%, 0.48%, and 0.01% of the injected CO2 was stored by residual gas, solubility, ionic, and mineral trapping, respectively. Ten years after the injection well was shut-in (i.e., 20 years of simulation time), 56.81%, 24.41%, 17.67%, 1.03%, and 0.08% of injected CO2 was stored by structural, residual gas, solubility, ionic, and mineral trapping, respectively. One-hundred years after the injection well was shut-in (110 years of simulation time), 47.68%, 31.58%, 16.63%, 1.69%, and 2.42% of the injected CO2 was stored by structural, residual gas, solubility, ionic, and mineral trapping, respectively. At the end of the simulation (1000 years of simulation time), 32.26%, 30.16%, 13.89%, 1.54%, and 22.15% of the injected CO2 was stored by structural, residual gas, solubility, ionic, and mineral trapping, respectively.
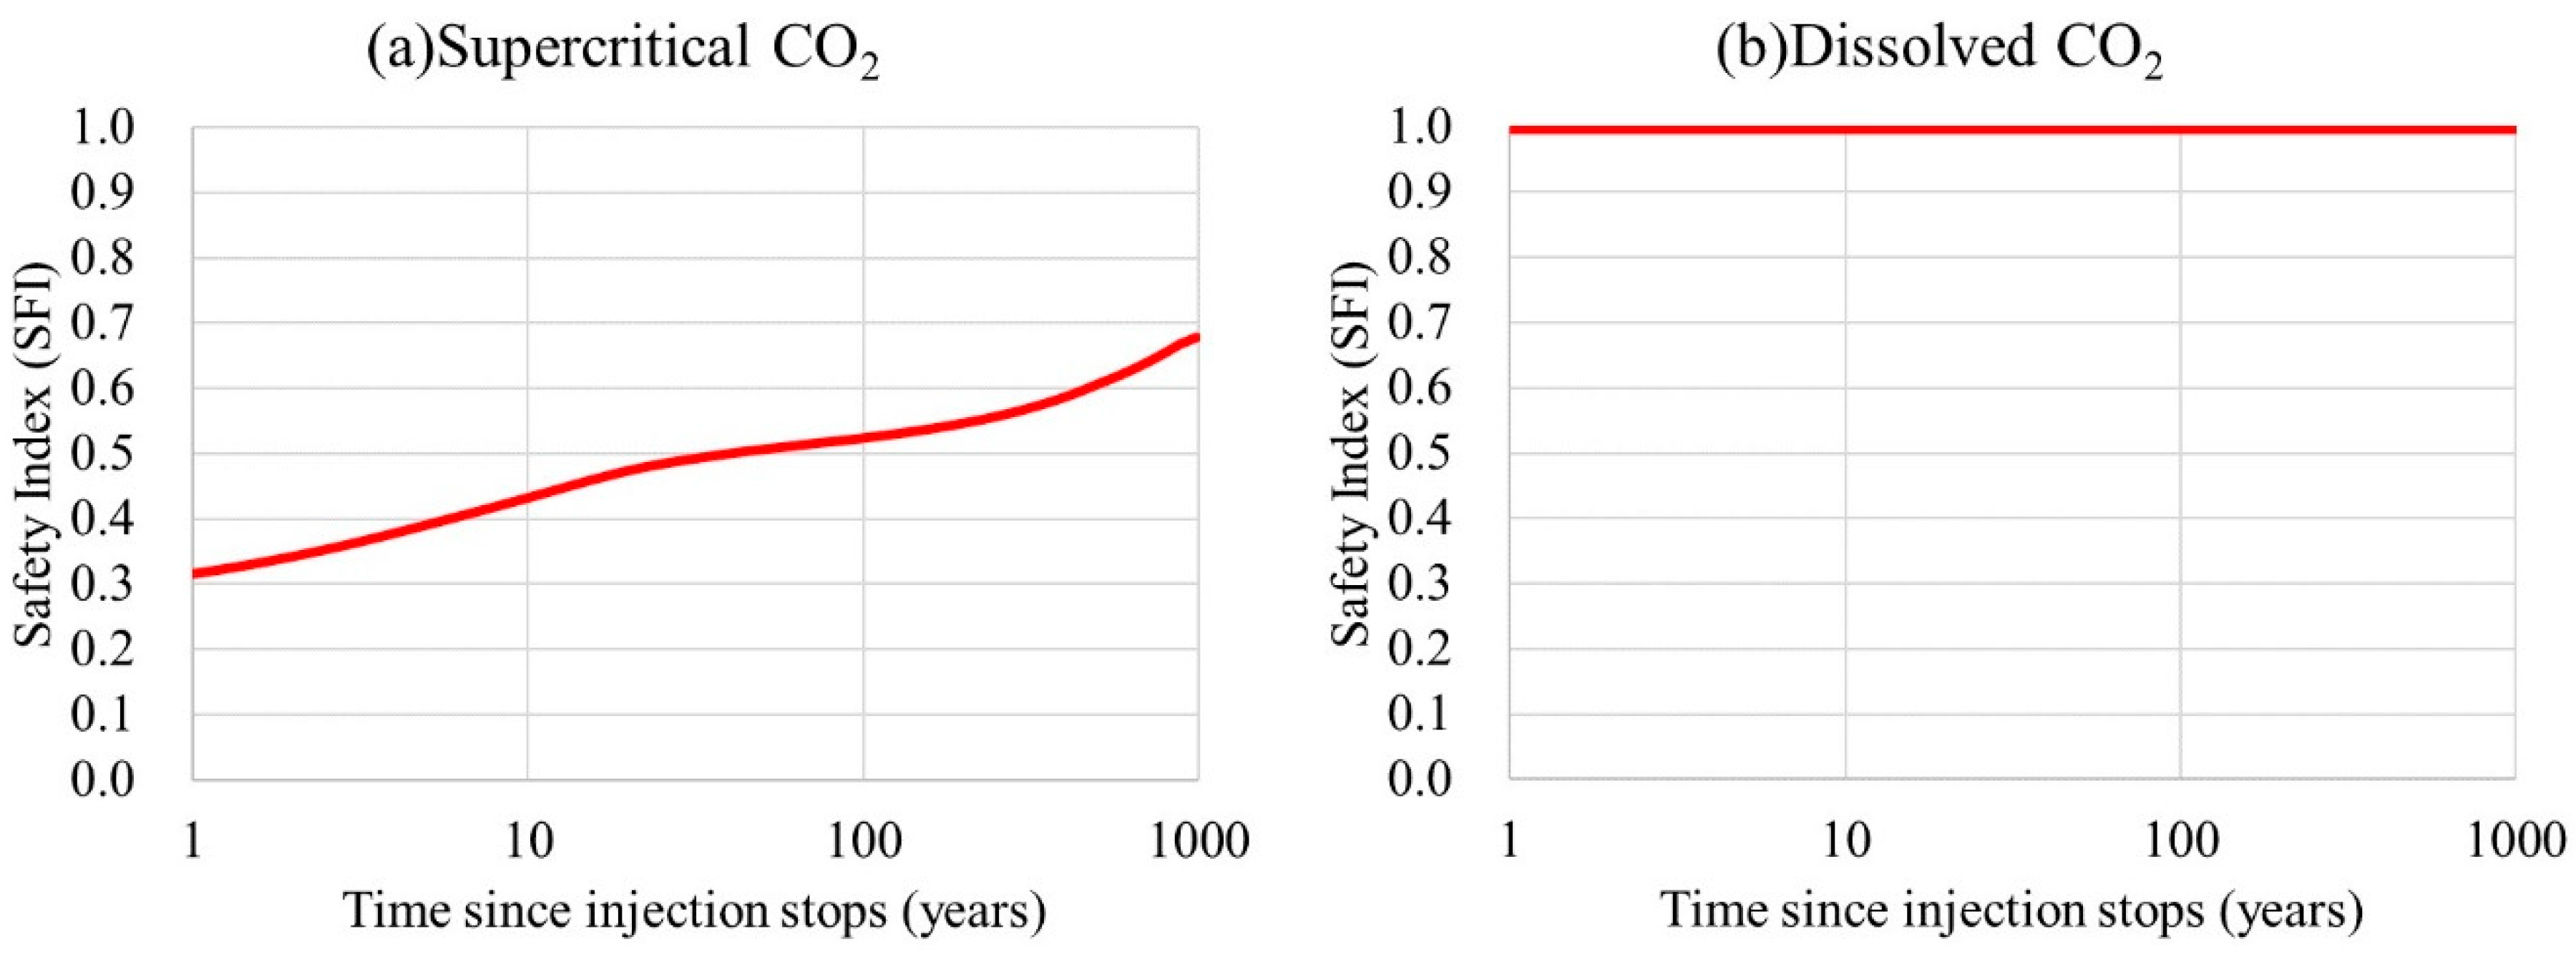
If the risk of CO2 leakage is defined by the amount of CO2 stored by secure trapping mechanisms, the safety index (SFI) can be evaluated by the number of the moles of CO2 retained by the safe trapping mechanisms (i.e., residual gas, solubility, ionic, and mineral trapping) [12]. The SFI for the supercritical CO2 scenario was 0.2807 at the end of injection (10 years). In the post-injection period, the SFIs were 0.4319, 0.5232, 0.6774 at the simulation times of 20, 110, and 1000 years (Figure 18).
In the dissolved CO2 scenario, when the injection well was shut-in (10 years), 0.15% of a total of 2 million tons of the injected CO2 was stored by residual gas trapping, and 84.95%, 14.86%, and 0.04% of the injected CO2 was stored by solubility, ionic, and mineral trapping, respectively. It is worth noting that there was a very small amount of CO2 trapped by the residual gas trapping mechanism indicating that there was a small amount of supercritical CO2 released from the CO2 solution during the injection period because of the slightly high molarity of CO2 in the aqueous phase near the wellbore of the injection well. The released supercritical CO2 would be restricted by the hysteresis effect as the residual gas that is immobilized and trapped in the pore spaces of the rock. Therefore, all of the injected CO2 was trapped by safe and low-risk trapping mechanisms, and the SFI for the dissolved CO2 scenario was 1 at the end of injection (10 years).
Ten years after the injection well was shut-in (20 years of simulation time), 0.14%, 82.10%, 17.41%, and 0.35% of the injected CO2 was stored by residual gas, solubility, ionic, and mineral trapping, respectively. One hundred years after the injection well was shut-in (110 years of simulation time), 0.05%, 66.15%, 18.51%, and 15.29% of the injected CO2 was stored by residual gas, solubility, ionic, and mineral trapping, respectively. At the end of the simulation (1000 years of simulation time), 3.70%, 14.81%, and 81.49% of the injected CO2 were stored by solubility, ionic, and mineral, respectively.
Compared to the supercritical CO2 scenario, the SFI during both the injection period and during the total simulation period remained at 1, indicating that all the injected CO2 was trapped by safe trapping mechanisms (Figure 18). The solubility trapping mechanism can occur immediately after CO2 is injected into the reservoir. The transformation of CO2 into solid carbonate is, therefore, faster. The majority of the injected CO2 can be transformed into solid carbonate within hundreds of years. The rest of the injected CO2 was trapped by the ionic trapping mechanism because a balance between the dissolution and precipitation of the minerals was reached, and the transformations from ionic phases into mineral phases stopped after about 600 years.
In conclusion, changing the injection fluid from supercritical CO2 to dissolved CO2 can increase the safety of the CO2 storage significantly and eliminate the risk of CO2 leakage from the reservoir due to the injected CO2 being stored by secure trapping mechanisms. The simulation results showed that the geochemical reactions occurred more rapidly, consequently accelerating the rate of mineralization by means of the dissolved CO2 injection. The plume of the CO2 molarity was observed to disappear by the end of the simulation. The majority of the injected CO2 was transformed into solid carbonate, which is chemically stable and environmentally benign.

6. Conclusions

The risk of leakage and the plume migration between the scenarios involving the injection of supercritical CO2 and dissolved CO2 into a reservoir were studied and discussed in this study. In the supercritical CO2 injection scenario, the majority of the injected CO2 was retained by the structural trapping. The supercritical CO2 plume was still located at the top of the anticline after 1000 years. At this point, the contribution of the mineral trapping mechanism was about 22%, and the contribution of the structural trapping mechanism, which indicated the presence of mobile supercritical CO2 that might migrate upward in the reservoir, was about 32%.
In the dissolved CO2 solution injection scenario, the plume of the injected CO2 migrated downward because of the higher density of the CO2 solution than that of the formation water. The majority of the plume of CO2 in the aqueous phase had disappeared after a few hundred years caused by the contributions of the ionic and mineral trapping mechanisms. The majority of the injected CO2 was transformed into solid carbonate within hundreds of years.
The risk of acute CO2 leakage related to mechanical or geomechanical failures can be controlled and reduced through well-regulated management of the injection rate and injection pressure. The risk of chronic leakage via a natural pathway can be decreased by the approach of injecting CO2 solution instead of supercritical CO2. The amount of the CO2 retained by the safe trapping mechanisms in the dissolved CO2 scenario was greater than that in the supercritical CO2 scenario. In addition, the process of CO2 mineralization was much faster than that in the supercritical CO2 scenario. Changing the injection fluid from supercritical CO2 to a dissolved CO2 solution can significantly increase the safety of the CO2 geological storage. It can also eliminate the risk of CO2 leakage from the reservoir because the injected CO2 can be trapped totally by safe trapping mechanisms. Therefore, the potential environmental impact of CO2 storage can be reduced.

Author Contributions

Data curation, Y.-H.L.; Funding acquisition, B.-Z.H.; Supervision, B.-Z.H.; Validation, C.-H.S.; Writing—original draft, Y.-H.L.; Writing—review and editing, C.-Y.W. and B.-Z.H. All authors have read and agreed to the published version of the manuscript.

Funding

This research was funded by the Ministry of Science and Technology, Taiwan (R.O.C.): MOST 106-2221-E-006-186.

Acknowledgments

The work presented in this paper was supported by the Ministry of Science and Technology, Taiwan (R.O.C.). We thank the CPC Corporation, Taiwan, for offering practical suggestions of the setting of the geological and reservoir properties.

Conflicts of Interest

The authors declare no conflict of interest.

References

  1. Bachu, S. Legal and regulatory challenges in the implementation of CO2 geological storage: An Alberta and Canadian perspective. Int. J. Greenh. Gas Control 2008, 2, 259–273. [Google Scholar] [CrossRef]
  2. Yanagi, K.; Nakamura, A. Towards a low/zero carbon society for the Asia-Pacific Region: Policy and legal development for carbon capture and storage (CCS) in Japan. In Sustainability and Law; Springer: Cham, Switzerland, 2020; pp. 585–605. [Google Scholar]
  3. Bachu, S.; Gunter, W.; Perkins, E. Aquifer disposal of CO2: Hydrodynamic and mineral trapping. Energy Convers. Manag. 1994, 35, 269–279. [Google Scholar] [CrossRef]
  4. Emami-Meybodi, H.; Hassanzadeh, H.; Green, C.P.; Ennis-King, J. Convective dissolution of CO2 in saline aquifers: Progress in modeling and experiments. Int. J. Greenh. Gas Control 2015, 40, 238–266. [Google Scholar] [CrossRef]
  5. IPCC. IPCC Special Report on Carbon Dioxide Capture and Storage. In Prepared by Working Group III of the Intergovernmental Panel on Climate Change; Metz, B., Davidson, H., de Coninck, C., Loos, M., Meyer, L.A., Eds.; Cambridge University Press: Cambridge, UK; New York, NY, USA, 2005; p. 442. [Google Scholar]
  6. Burton, M.; Bryant, S.L. Surface dissolution: Minimizing groundwater impact and leakage risk simultaneously. Energy Procedia 2009, 1, 3707–3714. [Google Scholar] [CrossRef] [Green Version]
  7. Pool, M.; Carrera, J.; Vilarrasa, V.; Silva, O.; Ayora, C. Dynamics and design of systems for geological storage of dissolved CO2. Adv. Water Resour. 2013, 62, 533–542. [Google Scholar] [CrossRef]
  8. Ganjdanesh, R.; Bryant, S.; Orbach, R.; Pope, G.; Sepehrnoori, K. Coupled carbon dioxide sequestration and energy production from geopressured/geothermal aquifers. SPE J. 2014, 19, 239–248. [Google Scholar] [CrossRef]
  9. Matter, J.; Takahashi, T.; Goldberg, D. Experimental evaluation of in situ CO2-water-rock reactions during CO2 injection in basaltic rocks: Implications for geological CO2 sequestration. Geochem. Geophys. Geosystems 2007, 8. [Google Scholar] [CrossRef]
  10. Matter, J.; Stute, M.; Snæbjörnsdottir, S.; Oelkers, E.; Gislason, S.; Aradottir, E.; Gunnlaugsson, E. Rapid carbon mineralization for permanent disposal of anthropogenic carbon dioxide emissions. Science 2016, 352, 1312–1314. [Google Scholar] [CrossRef] [PubMed] [Green Version]
  11. Snæbjörnsdóttir, S.Ó.; Oelkers, E.H.; Mesfin, K.; Aradóttir, E.S.; Dideriksen, K.; Gunnarsson, I.; Gunnlaugsson, E.; Matter, J.M.; Stute, M.; Gislason, S.R. The chemistry and saturation states of subsurface fluids during the in situ mineralisation of CO2 and H2S at the CarbFix site in SW-Iceland. Int. J. Greenh. Gas Control 2017, 58, 87–102. [Google Scholar] [CrossRef] [Green Version]
  12. Hsieh, B.Z.; Nghiem, L.; Shen, C.H.; Lin, Z.S. Effects of complex sandstone–shale sequences of a storage formation on the risk of CO2 leakage: Case study from Taiwan. Int. J. Greenh. Gas Control 2013, 17, 376–387. [Google Scholar] [CrossRef]
  13. Kumar, A.; Noh, M.H.; Ozah, R.C.; Pope, G.A.; Bryant, S.L.; Sepehrnoori, K.; Lake, L.W. Reservoir simulation of CO 2 storage in aquifers. SPE J. 2005, 10, 336–348. [Google Scholar] [CrossRef]
  14. Nghiem, L.; Sammon, P.; Grabenstetter, J.; Ohkuma, H. Modeling CO2 storage in aquifers with a fully-coupled geochemical EOS compositional simulator. In SPE/DOE Symposium on Improved Oil Recovery; Society of Petroleum Engineers: Tulsa, Oklahoma, 17–21 April 2004. [Google Scholar]
  15. Land, C.S. Calculation of imbibition relative permeability for two-and three-phase flow from rock properties. Soc. Pet. Eng. J. 1968, 8, 149–156. [Google Scholar] [CrossRef]
  16. Peng, D.-Y.; Robinson, D.B. A new two-constant equation of state. Ind. Eng. Chem. Fundam. 1976, 15, 59–64. [Google Scholar] [CrossRef]
  17. Bethke, C. Geochemical Reaction Modeling: Concepts and Applications; Oxford University Press: Oxford, UK, 1996. [Google Scholar]
  18. Nghiem, L.; Shrivastava, V.; Kohse, B.; Hassam, M.; Yang, C. Simulation and optimization of trapping processes for CO2 storage in saline aquifers. J. Can. Pet. Technol. 2010, 49, 15–22. [Google Scholar] [CrossRef]
  19. Li, Y.K.; Nghiem, L.X. Phase equilibria of oil, gas and water/brine mixtures from a cubic equation of state and Henry’s law. Can. J. Chem. Eng. 1986, 64, 486–496. [Google Scholar] [CrossRef]
  20. GAMS. Solmineq.88 Geochemical Aqueous Equilibrium Models; Geochemical Applications & Modelling Software Ltd.: Edmonton, AB, Canada, 2011. [Google Scholar]
  21. GAMS. GAMSPath Geochemical Reaction Path Models; Geochemical Applications & Modelling Software Ltd.: Edmonton, AB, Canada, 2011. [Google Scholar]
  22. Thibeau, S.; Nghiem, L.X.; Ohkuma, H. A modelling study of the role of selected minerals in enhancing CO2 mineralization during CO2 aquifer storage. In SPE Annual Technical Conference and Exhibition; Society of Petroleum Engineers: Anaheim, CA, USA, 11–14 November 2007. [Google Scholar]
  23. Lin, Q.-H. In-Situ Stress and Fault Reactivation Potential in Response to Fluid Injection in Yunghoshan Structure. Master’s Thesis, National Central University, Taoyuan, Taiwan, 2014. [Google Scholar]
Figure 1. Structural map of the Yutengping (YTP) formation in the Y-field.
Energies 13 05259 g001
Figure 2. The analyzed results of the lithology of the sublayers in the YTP formation at well Y-15.
Energies 13 05259 g002
Figure 3. Top view of the three-dimensional model of the YTP sandstone formation.
Energies 13 05259 g003
Figure 4. The injection scenario used in this study (a) Schematic diagram of the injection interval in the YTP formation; (b) schematic diagram of the supercritical CO2 scenario; (c) schematic diagram of the dissolved CO2 solution scenario.
Energies 13 05259 g004
Figure 5. Injection profile of the supercritical CO2 scenario (a) During the injection period, (b) During the total simulation period.
Energies 13 05259 g005
Figure 6. Spatial distribution of the CO2 saturation in the supercritical CO2 scenario.
Energies 13 05259 g006
Figure 7. Spatial distribution of the CO2 molality in the supercritical CO2 scenario.
Energies 13 05259 g007
Figure 8. Spatial distribution of the change in moles of calcite in the supercritical CO2 scenario.
Energies 13 05259 g008
Figure 9. Evolutions of kaolinite, calcite, muscovite, and anorthite in the supercritical CO2 scenario.
Energies 13 05259 g009
Figure 10. Injection profile of the dissolved CO2 scenario: (a) During the injection period, (b) During the total simulation period.
Energies 13 05259 g010
Figure 11. Spatial distribution of the CO2 molality in the dissolved CO2 scenario.
Energies 13 05259 g011
Figure 12. Spatial distribution of the change in moles of calcite in the dissolved CO2 scenario.
Energies 13 05259 g012
Figure 13. Evolutions of kaolinite, calcite, muscovite, and anorthite in the dissolved CO2 scenario.
Energies 13 05259 g013
Figure 14. Comparison of the spatial distribution of CO2 molality between scenarios.
Energies 13 05259 g014
Figure 15. Comparison of the spatial distribution of the change in moles of calcite between scenarios.
Energies 13 05259 g015
Figure 16. Comparison of evolutions of kaolinite, calcite, muscovite, and anorthite between scenarios.
Energies 13 05259 g016
Figure 17. Comparison of the contributions of the different trapping mechanisms between the two scenarios.
Energies 13 05259 g017
Figure 18. Comparison of the safety index (SFI) calculations between the two scenarios.
Energies 13 05259 g018
Table 1. Reservoir parameters and initial conditions.
ParameterUnitValue
PorositySandfrac.0.25
Shaly Sandfrac.0.23
Sandy Shalefrac.0.05
Shalefrac.0.025
PermeabilitySandmD530
Shaly SandmD200
Sandy ShalemD0.001
ShalemD0.0001
Formation Pressure @ 5400 ftpsi2445
Formation Temperature @ 5400 ft°F162
Table 2. Chemical reactions of the aqueous phase and mineral reactions used in this study. (The reaction rate constant was adopted from the Thibeau et al. (2007) [22]).
Intra-Aqueous Chemical ReactionsKeq at 33 °C
Al(OH)2+ + 2H+ Al3+ + 2H2O4.75
CO2(aq) + H2O H+ + HCO3-−6.35
CO32- + H+ HCO3-10.31
KOH + H+ K+ + H2O15.43
OH- + H+ H2O13.74
Geochemical Mineral Reactionsk at T0
Anorthite + 8H+ 4H2O + Ca2+ + 2Al3+ + 2SiO2(aq)25.72 at 33 °C
Calcite + H+ Ca2+ + HCO3-1.6 at 33 °C
Kaolinite + 6H+ 5H2O + 2Al3+ + 2SiO2(aq)6.77 at 33 °C
Muscovite + 6H+ 6H2O + K+ + 3Al3+ + 3SiO2(aq)12 at 25 °C
Table 3. Initial molality of the primary aqueous components of the saline at the reservoir conditions and the volume percentages of the minerals in the rock used in the simulation model.
Primary SpeciesMolality (mole/kg)MineralVolume Percentage (%)
H+8.90 × 10⁻⁹Anorthite13.15%
Ca2+8.75 × 10⁻⁵Kaolinite3.77%
K+6.68 × 10⁻⁵Calcite0%
Al3+7.24 × 10⁻¹¹Muscovite6.43%
SiO22.35 × 10−8Quartz73.65%