Determination and Fire Analysis of Gob Characteristics Using CFD

 , , and
Abstract
:1. Introduction
2. Materials and Methods
2.1. Experimental Set-Up
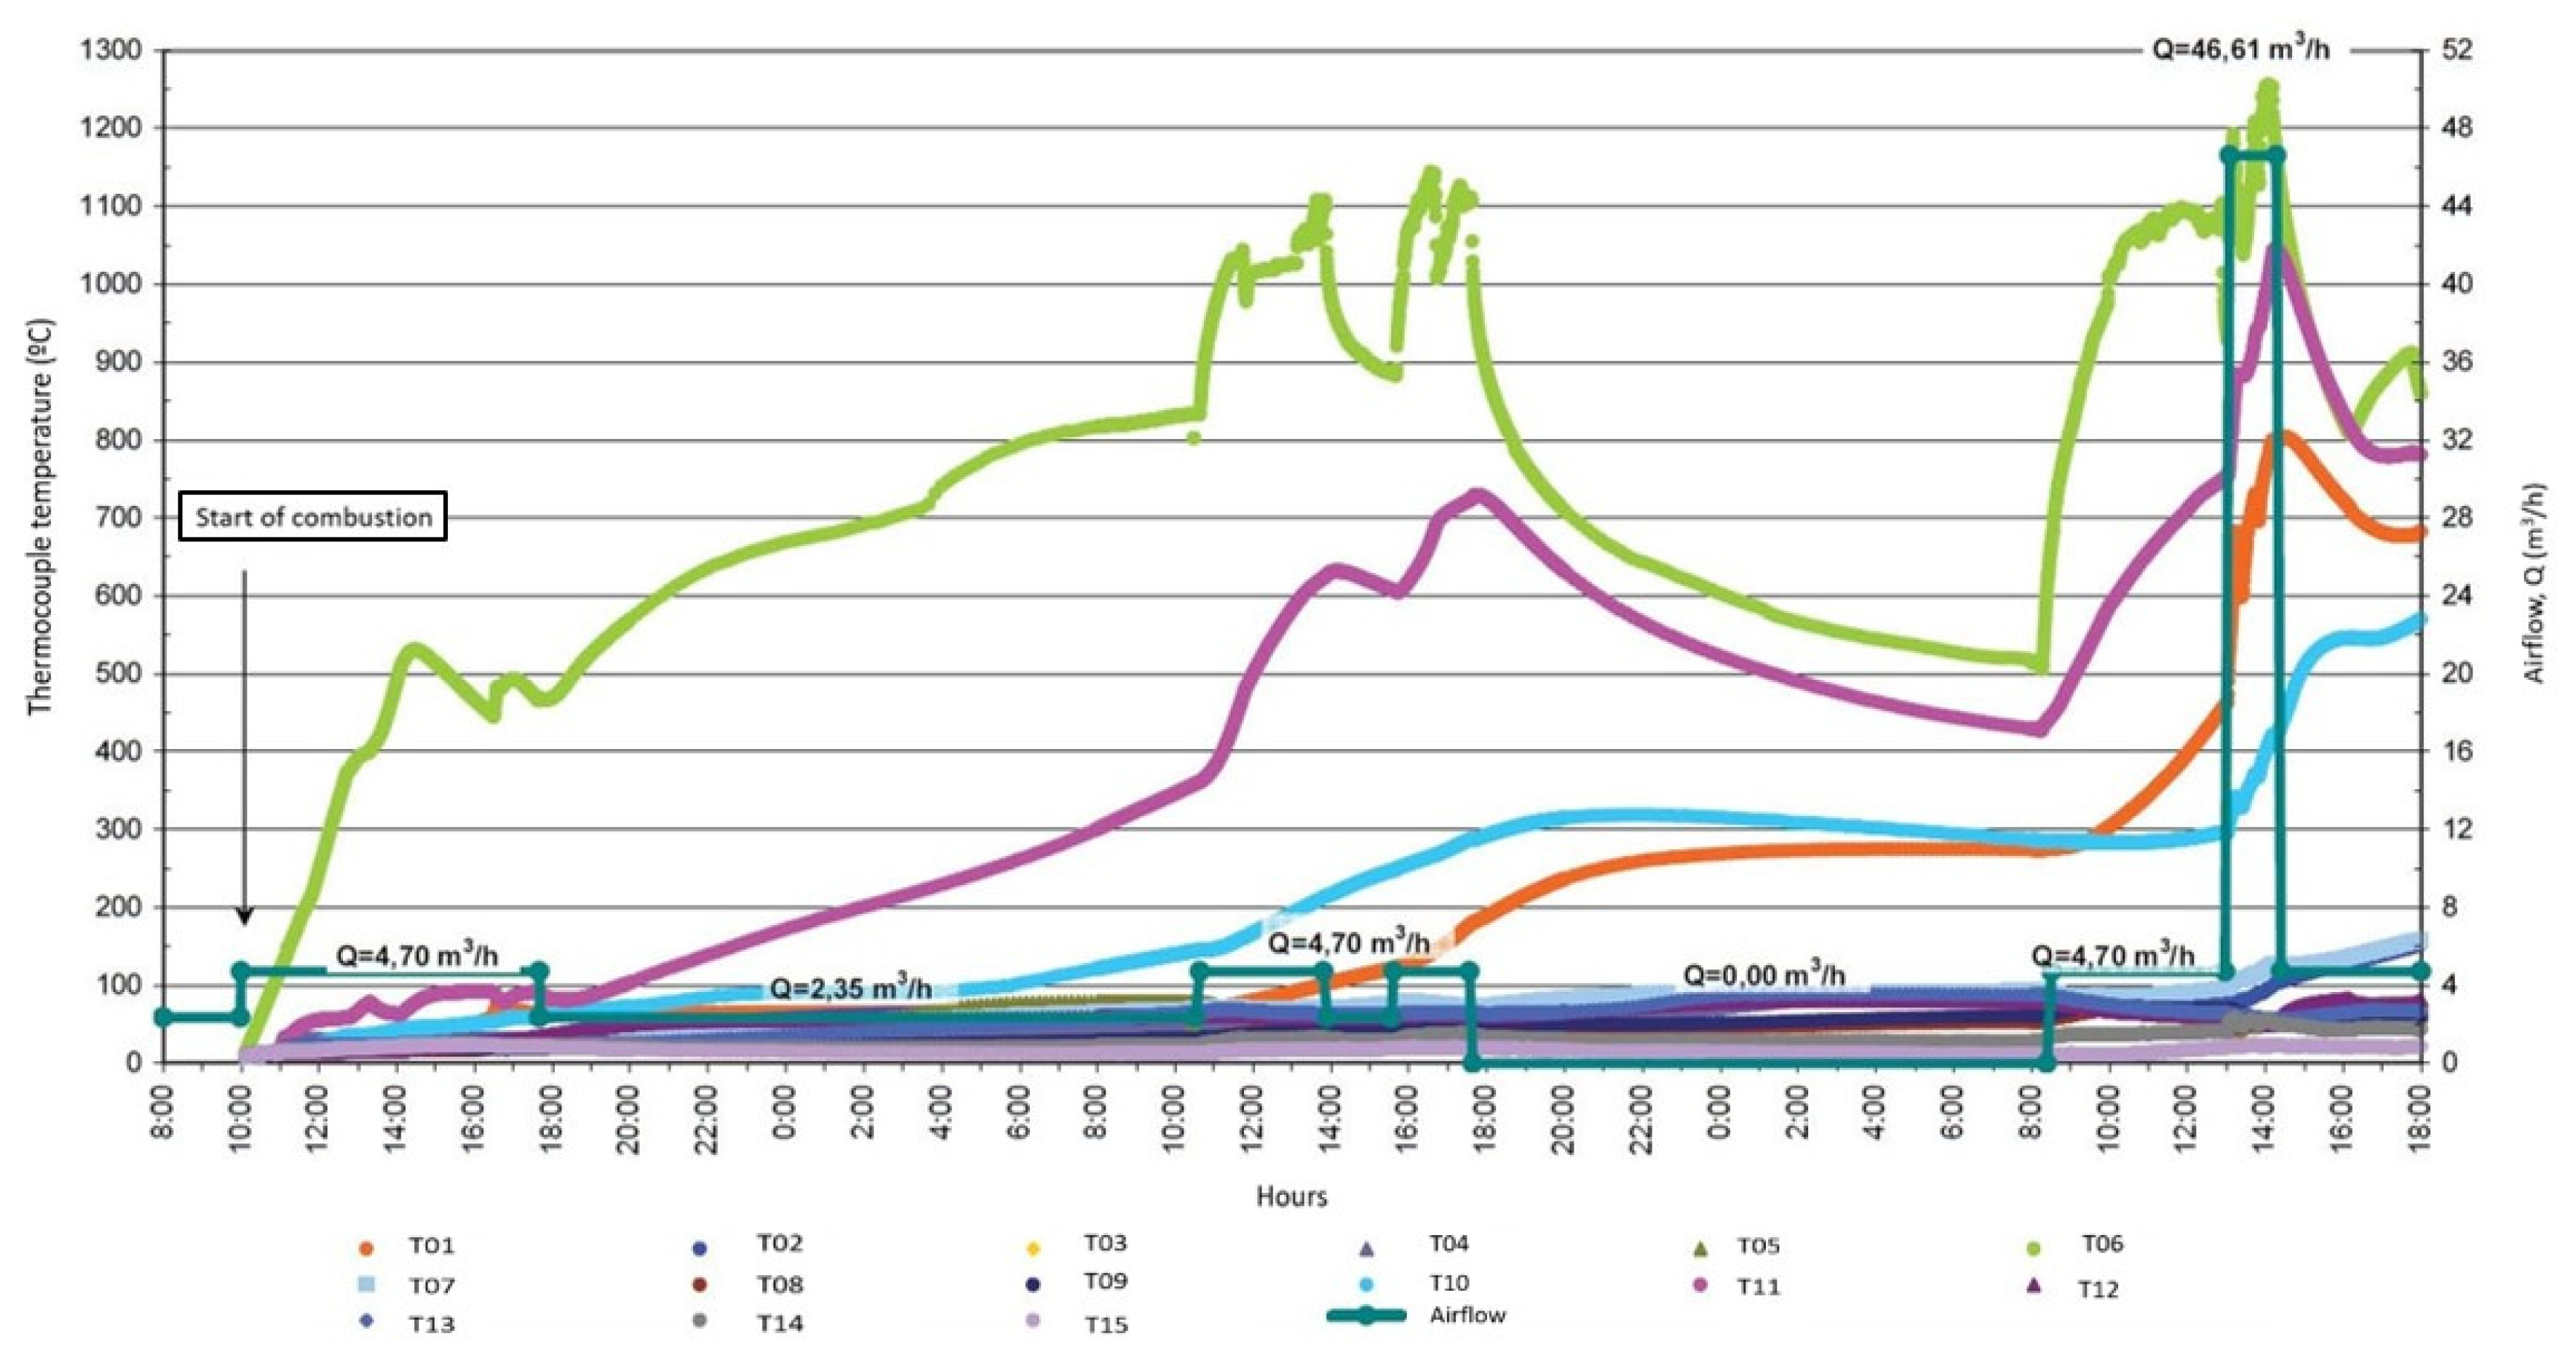
- Monitoring the tendency of the coal to self-combust by injecting an air stream into the sample volume, with a flow rate ranging from 2.35 to 4.7 m3/h.
- Hot air, between 50 and 70 °C, was injected over the course of the experiment.
- Because of the difficulty of starting the expected self-combustion process, electrical resistance was introduced into the coal to cause ignition, producing a significant increase in temperature at the point where resistance was introduced, between 300 and 800 °C.
- The progress of combustion was observed over a certain period of time, and, finally, it was extinguished with water.
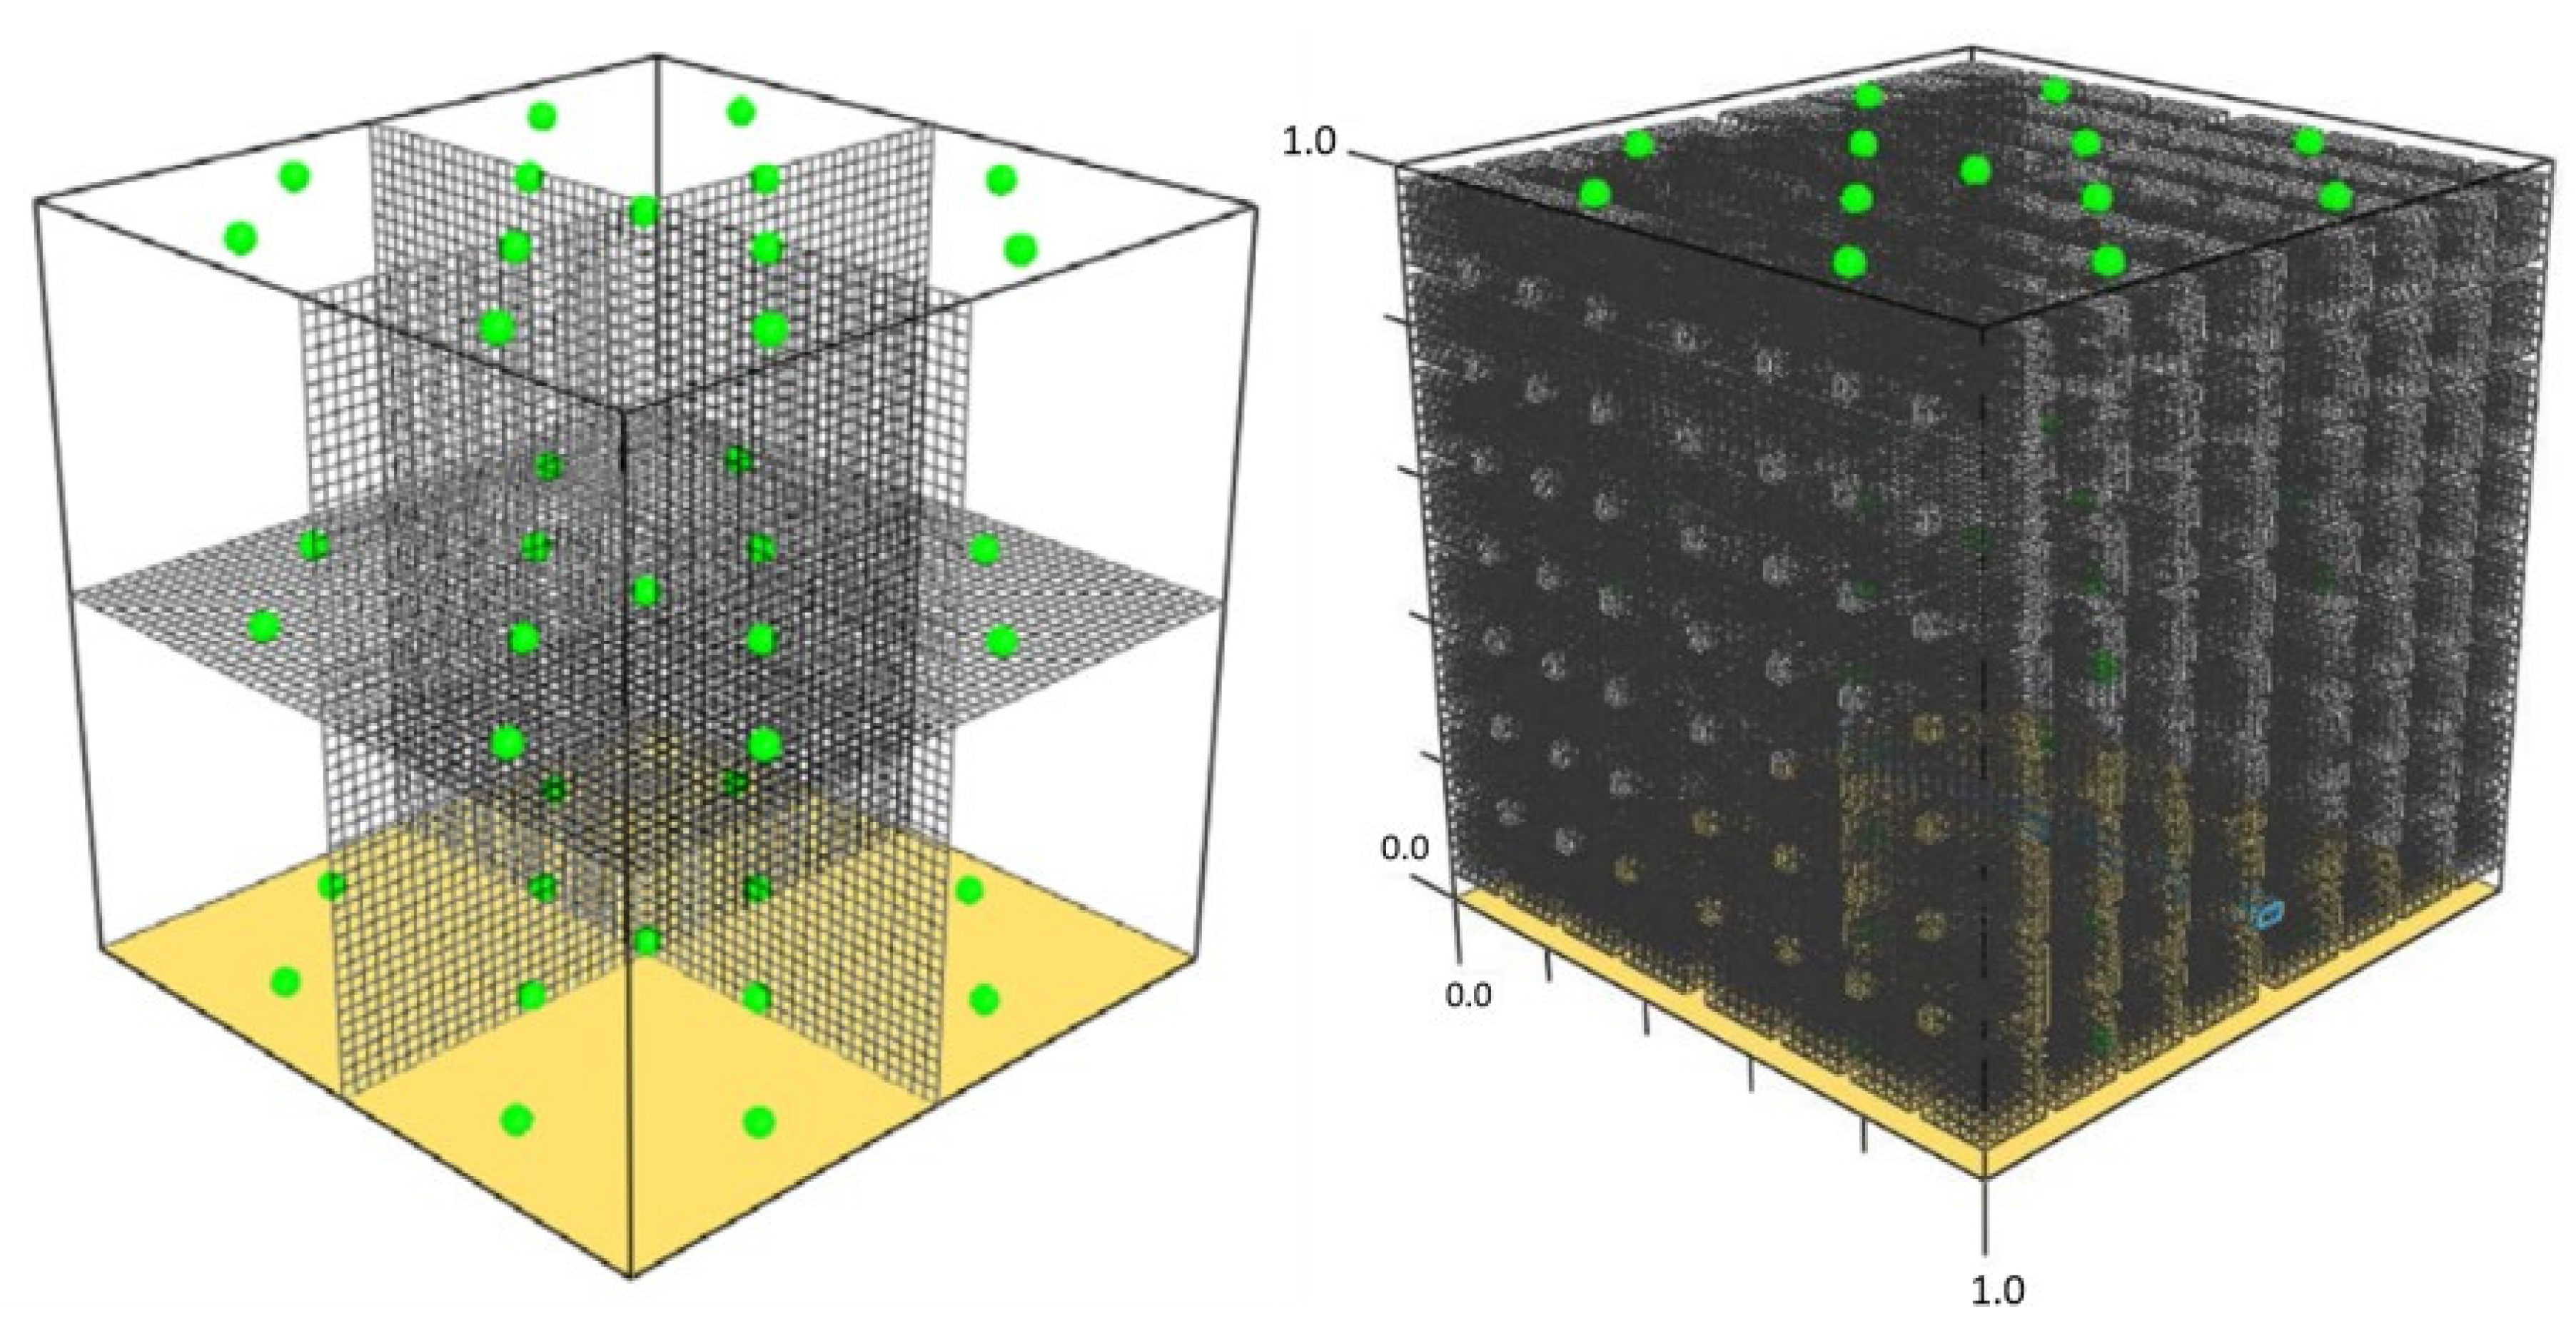
2.2. CFD Analysis
3. Results and Discussion
3.1. Real Data
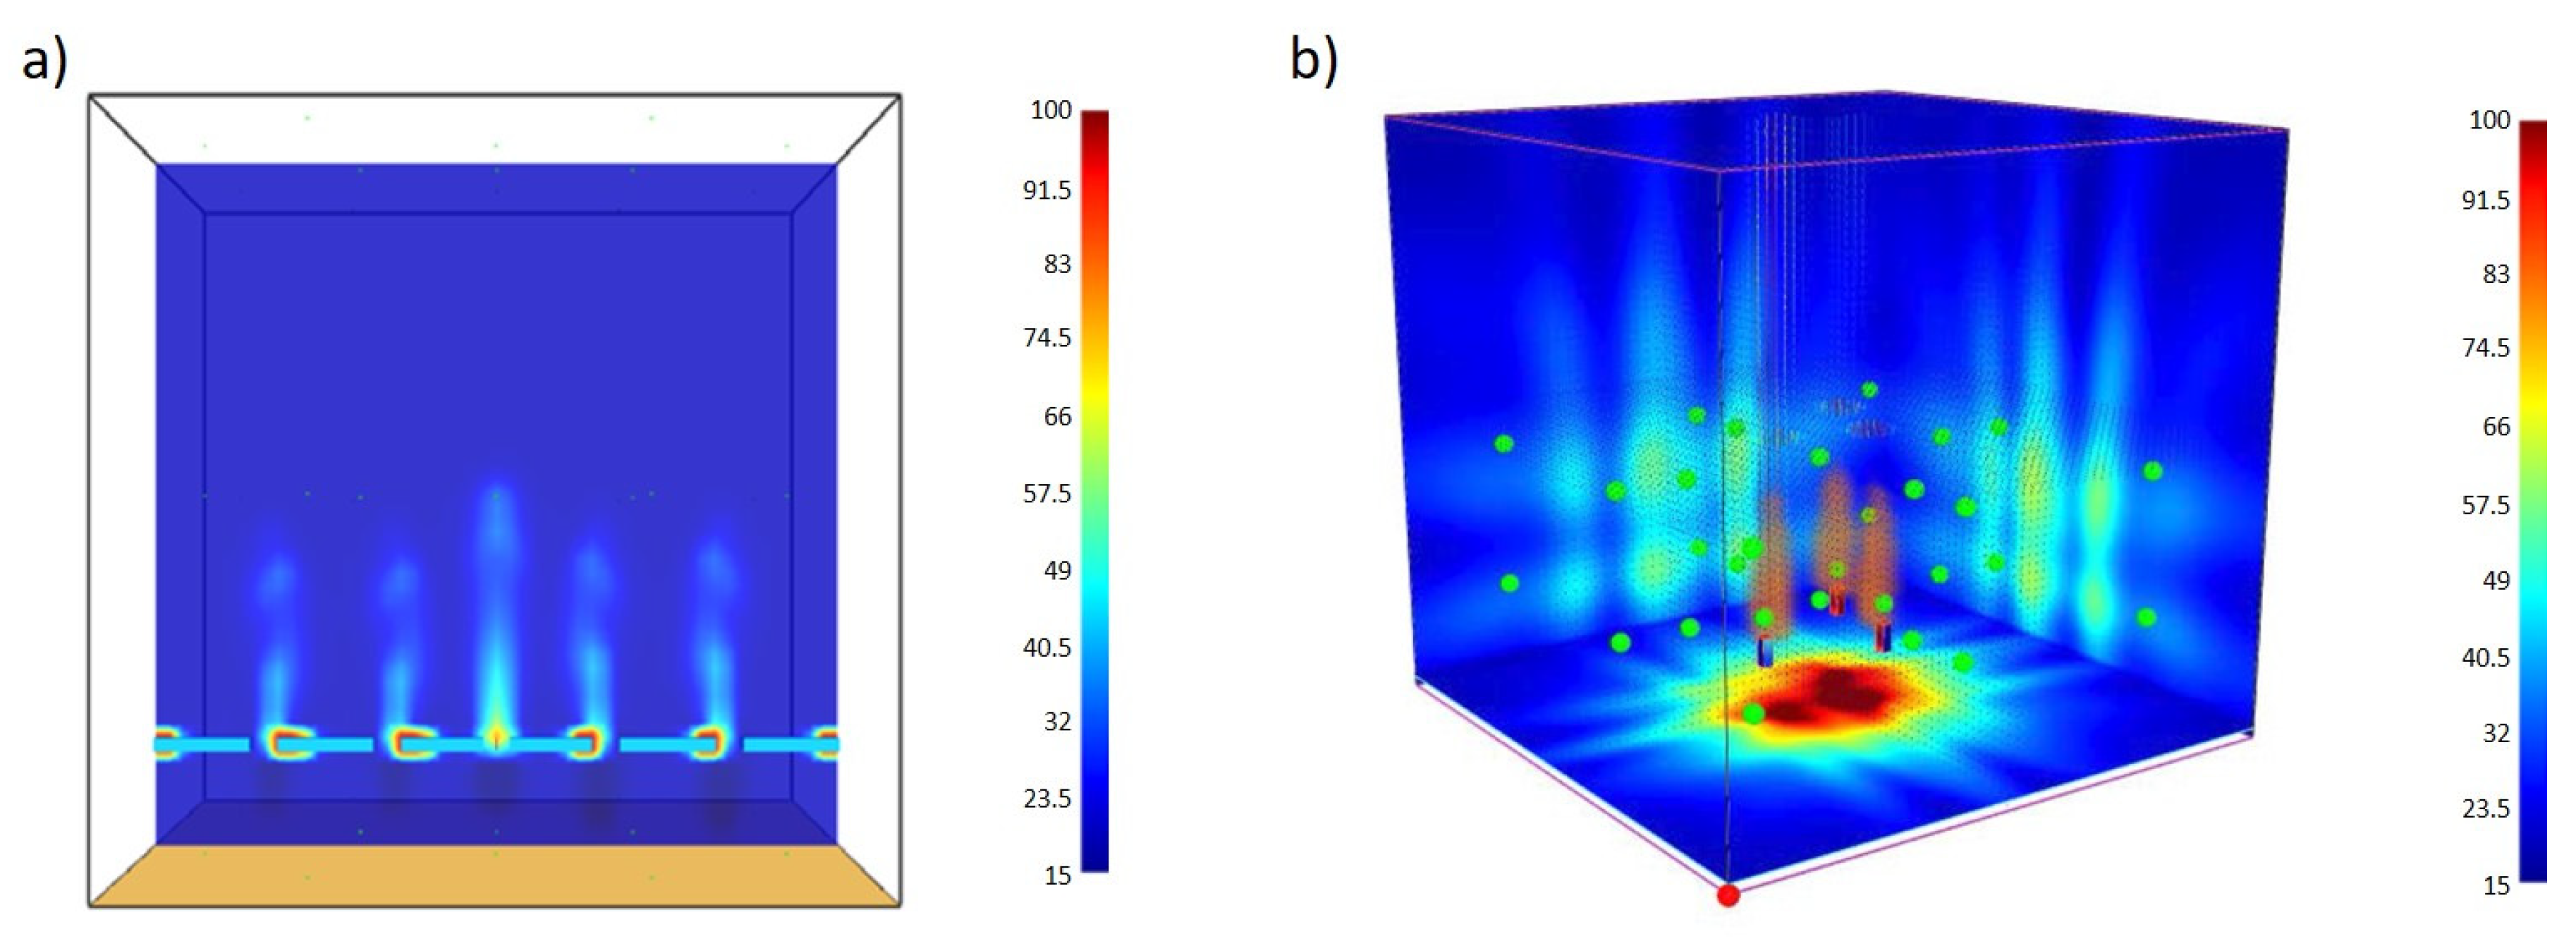
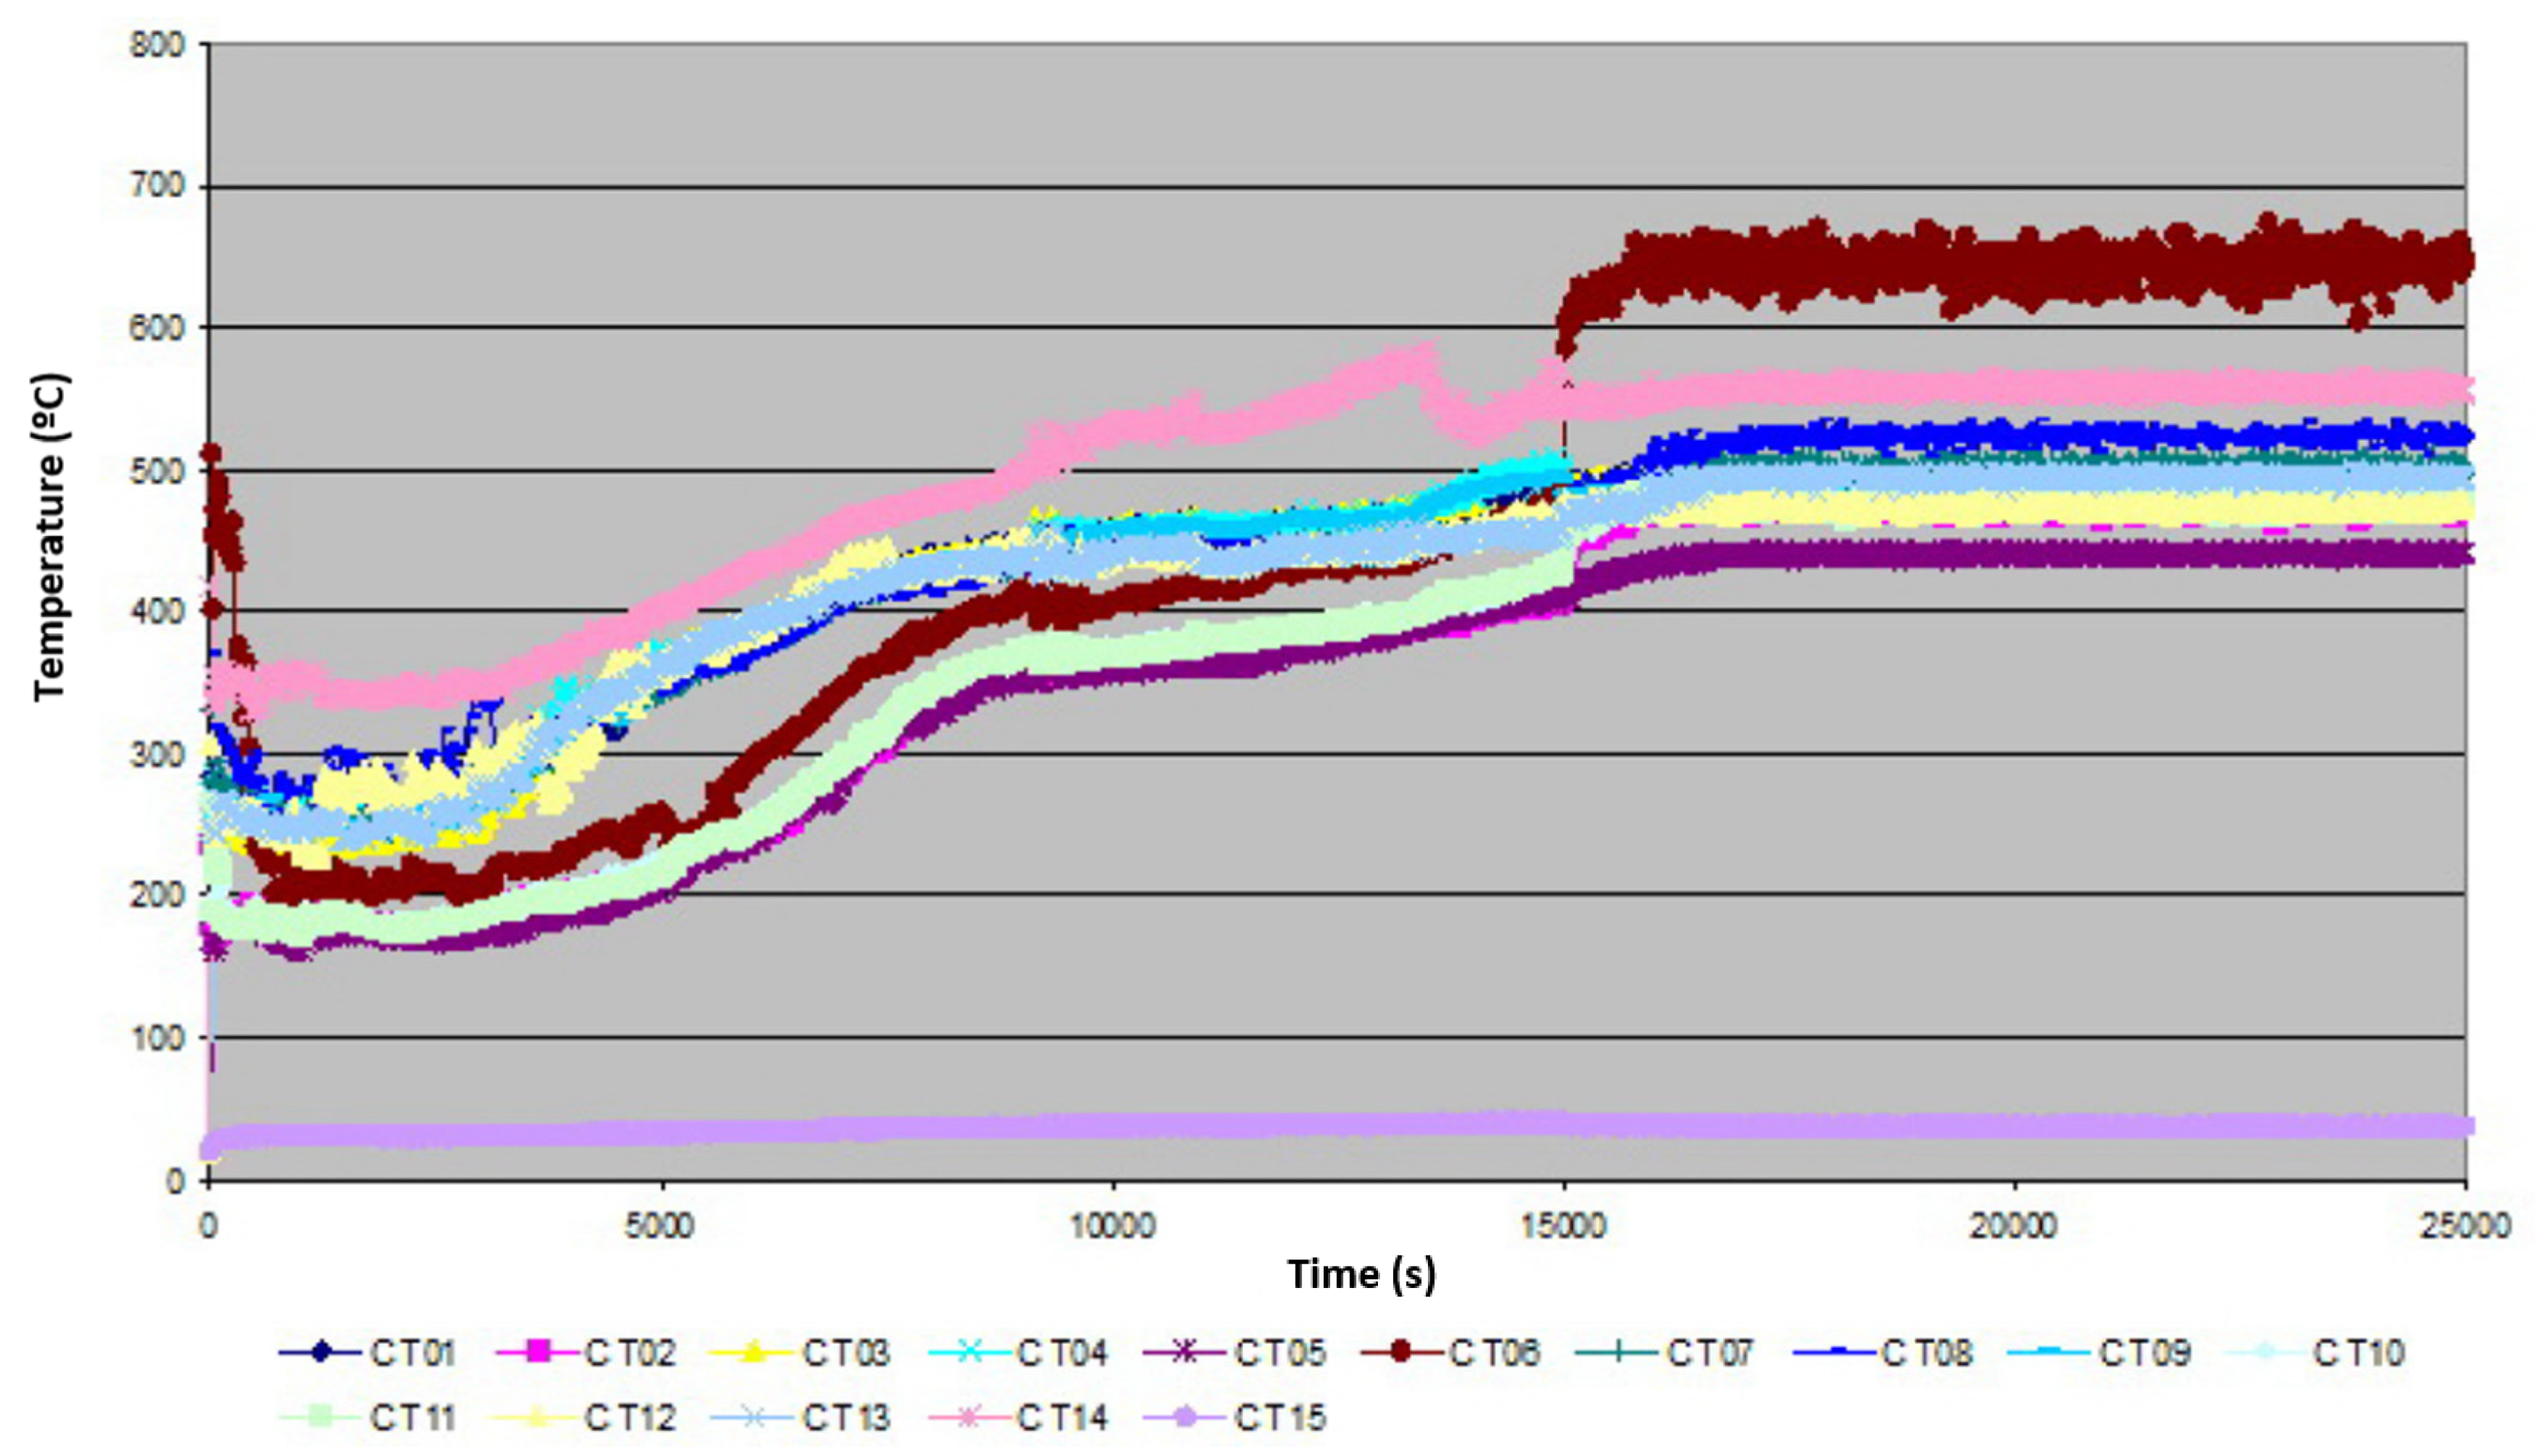
3.2. CFD Modelling
4. Conclusions
Author Contributions
Funding
Acknowledgments
Conflicts of Interest
References
- Carvel, R. A review of tunnel fire research from Edinburgh. Fire Saf. J. 2019, 105, 300–306. [Google Scholar] [CrossRef] [Green Version]
- Sanmiquel, L.; Bascompta, M.; Anticoi, H.F. Analysis of a historical accident in a Spanish coal mine. Int. J. Environ. Res. Public Health 2019, 16, 3615. [Google Scholar] [CrossRef] [Green Version]
- Medic-Pejic, L.; García Torrent, J.; Fernandez-Añez, N.; Lebecki, K. Experimental study for the application of water barriers to Spanish small cross section galleries. Dyna 2015, 82, 142–148. [Google Scholar] [CrossRef]
- Larry Grayson, R.; Kinilakodi, H.; Kecojevic, V. Pilot sample risk analysis for underground coal mine fires and explosions using MSHA citation data. Saf. Sci. 2009, 47, 1371–1378. [Google Scholar] [CrossRef]
- Fernández-Alaiz, F.; Castañón, A.; Gómez-Fernández, F.; Bernardo-Sánchez, A.; Bascompta, M. Analysis of the Fire Propagation in a Sublevel Coal Mine. Energies 2020, 13, 3754. [Google Scholar] [CrossRef]
- Edwards, J.C.; Hwang, C.C. CFD Modeling of Fire Spread along Combustibles in a Mine Entry; SME Annual Meeting; Society for Mining, Metallurgy, and Exploration, Inc.: Littleton, CO, USA, 2006; pp. 1–5. [Google Scholar]
- Hansen, R. Analysis of methodologies for calculating the heat release rates of mining vehicle fires in underground mines. Fire Saf. J. 2015, 71, 194–216. [Google Scholar] [CrossRef]
- Goffart, T.V.; Vasil’ev, A.A. Practical Issues of Safety in Coal Mines. Combust. Explos. Shock Waves 2019, 55, 500–506. [Google Scholar] [CrossRef]
- Trevits, M.A.; Yuan, L.; Teacoach, K.; Valoski, M.P.; Urosek, J.E. Understanding Mine Fires By Determining The Characteristics Of Deep-Seated Fires; SME Annual Meeting; NIOSH: Pittsburgh, PA, USA, 2009.
- Zhu, S.; Wu, S.; Cheng, J.; Li, S.; Li, M. An underground air-route temperature prediction model for ultra-deep coal mines. Minerals 2015, 5, 527–545. [Google Scholar] [CrossRef]
- Greuer, R.E. Modeling the movement of smoke and the effect of ventilation systems in mine shaft fires. Fire Saf. J. 1985, 9, 81–87. [Google Scholar] [CrossRef]
- Yuan, L.; Smith, A.C. Numerical study on effects of coal properties on spontaneous heating in longwall gob areas. Fuel 2008, 87, 3409–3419. [Google Scholar] [CrossRef]
- Fernández-Alaiz, F.; Castañón, A.M.; Gómez-Fernández, F.; Bascompta, M. Mine Fire Behavior under Different Ventilation Conditions: Real-Scale Tests and CFD Modeling. Appl. Sci. 2020, 10, 3380. [Google Scholar] [CrossRef]
- Sun, J.; Fang, Z.; Tang, Z.; Beji, T.; Merci, B. Experimental study of the effectiveness of a water system in blocking fire-induced smoke and heat in reduced-scale tunnel tests. Tunn. Undergr. Space Technol. 2016, 56, 34–44. [Google Scholar] [CrossRef] [Green Version]
- Guo, X.; Zhang, Q. Analytical solution, experimental data and CFD simulation for longitudinal tunnel fire ventilation. Tunn. Undergr. Space Technol. 2014, 42, 307–313. [Google Scholar] [CrossRef]
- Beckmann, A.M.; Mancini, M.; Weber, R.; Seebold, S.; Müller, M. Measurements and CFD modeling of a pulverized coal flame with emphasis on ash deposition. Fuel 2016, 167, 168–179. [Google Scholar] [CrossRef]
- Zhang, H.; Sanmiquel, L.; Zhao, Y.; Vintro, C. Researches and applications on geostatistical simulation and laboratory modeling of mine ventilation network and gas drainage zone. Process Saf. Environ. Prot. 2015, 94, 55–64. [Google Scholar] [CrossRef]
- Bustamante Rúa, M.O.; Daza Aragón, A.J.; Bustamante Baena, P. A study of fire propagation in coal seam with numerical simulation of heat transfer and chemical reaction rate in mining field. Int. J. Min. Sci. Technol. 2019, 29, 873–879. [Google Scholar] [CrossRef]
- Kong, B.; Li, Z.; Wang, E. An experimental study for characterization the process of coal oxidation and spontaneous combustion by electromagnetic radiation technique. Process Saf. Environ. 2018, 119, 285–294. [Google Scholar] [CrossRef]
- Wu, Y.; Zhang, Y.; Wang, J.; Zhang, X.; Wang, J.; Zhou, C. Study on the effect of extraneous moisture on the spontaneous combustion of coal and its mechanism of action. Energies 2020, 13, 1969. [Google Scholar] [CrossRef]
- Pan, W.; Zhang, S.; Liu, Y. Safe and Efficient Coal Mining Below the Goaf: A Case Study. Energies 2020, 13, 864. [Google Scholar] [CrossRef] [Green Version]
- Song, Z.Y.; Zhu, H.Q.; Tan, B. Numerical study on effects of air leakages from abandoned galleries on hill-side coal fires. Fire Saf. J. 2014, 69, 99–110. [Google Scholar] [CrossRef]
- Qi, G.; Lu, W.; Qi, X.; Zhong, X.; Cheng, W.; Liu, F. Differences in smoldering characteristics of coal piles with different smoldering propagation directions. Fire Saf. J. 2018, 102, 77–82. [Google Scholar] [CrossRef]
- Qi, G.S.; Wang, D.M.; Zheng, K.M. Smoldering combustion of coal under forced air flow: Experimental investigation. J. Fire Sci. 2016, 34, 267–288. [Google Scholar] [CrossRef]
- Hooman, K.; Maas, U. Theoretical analysis of coal stockpile self-heating. Fire Saf. J. 2014, 67, 107–112. [Google Scholar] [CrossRef]
- Wang, J.H.; Chao, C.Y.H.; Kong, W. Experimental study and asymptotic analysis of horizontally forced forward smoldering combustion. Combust. Flame 2003, 135, 405–419. [Google Scholar] [CrossRef]
- Yuan, L.; Smith, A.C. CDF modeling of spontaneous heating in a large-scale coal chamber. J. Loss Prev. Process Ind. 2009, 22, 426–433. [Google Scholar] [CrossRef]


| Sample 1 | Sample 2 | Sample 3 | |||||||
|---|---|---|---|---|---|---|---|---|---|
| s/Dry | s/s.a. | s/Gross | s/Dry | s/s.a. | s/Gross | s/Dry | s/s.a. | s/Gross | |
| Air-dried moisture (%) | - | - | 6.91 | - | - | 7.85 | - | - | 2.82 |
| Hygroscopic moisture (%) | - | 1.69 | 1.57 | - | 1.41 | 1.30 | - | 1.82 | 1.77 |
| Total moisture (%) | - | 1.69 | 8.48 | - | 1.41 | 9.15 | - | 1.82 | 4.59 |
| Volatile matter (%) | 29.14 | 28.65 | 26.67 | 28.40 | 28.00 | 25.80 | 29.63 | 29.09 | 28.27 |
| Ash (815 °C) (%) | 16.49 | 16.21 | 15.09 | 20.66 | 20.37 | 18.77 | 16.15 | 15.86 | 15.41 |
| Carbon (%) | 70.47 | 69.28 | 64.49 | 65.08 | 64.16 | 59.13 | 69.58 | 68.31 | 66.39 |
| Hydrogen (%) | 4.41 | 4.52 | 4.98 | 4.23 | 2.33 | 4.86 | 4.24 | 4.37 | 4.56 |
| Nitrogen (%) | 1.49 | 1.46 | 1.36 | 1.38 | 1.36 | 1.25 | 1.68 | 1.65 | 1.60 |
| Sulphur (%) | 0.49 | 0.48 | 0.45 | 0.45 | 0.44 | 0.41 | 0.49 | 0.48 | 0.47 |
| Oxygen (%) (calculated) | 6.65 | 8.04 | 13.63 | 8.20 | 9.34 | 15.58 | 7.86 | 9.33 | 11.58 |
| Higher calorific value (HCV)v (Kcal/Kg) | 6.869 | 6.753 | 6.286 | 6.434 | 6.343 | 5.845 | 6.727 | 6.605 | 6.418 |
| Lower calorific value (LCV)v (Kcal/Kg) | 6.648 | 6.526 | 6.037 | 6.223 | 6.127 | 5.603 | 6.515 | 6.386 | 6.190 |
| Lower calorific value (LCV)p (Kcal/Kg) | 6.640 | 6.518 | 6.027 | 6.215 | 6.119 | 5.592 | 6.507 | 6.377 | 6.181 |
| Sulphur forms: | |||||||||
| Sulphate (%) | 0.01 | - | - | 0.04 | - | - | 0.04 | - | - |
| Pyritic (%) | 0.11 | - | - | 0.18 | - | - | 0.19 | - | - |
| Organic (%) | 0.37 | - | - | 0.23 | - | - | 0.26 | - | - |
| Name | Position | Depth (cm) | Comment |
|---|---|---|---|
| T01 | F5 | 30 | Coal |
| T02 | D7 | 60 | Coal |
| T03 | D6 | 20 | Coal |
| T04 | C3 | 20 | Coal |
| T05 | C2 | 50 | Coal |
| T06 | B2 | 70 | Coal |
| T07 | G2 | 30 | Coal |
| T08 | H1 | 10 | Coal |
| T09 | E4 | 10 | Coal |
| T10 | G7 | 70 | Coal |
| T11 | H8 | 50 | Coal |
| T12 | H9 | 20 | Coal |
| T13 | C8 | 30 | Coal |
| T14 | C6 | ----- | Air chamber |
| T15 | ----- | ----- | Environmental conditions |
| Properties | Value |
|---|---|
| Density of the coal particles (kg/m3) | 1200 |
| Apparent density (kg/m3) | 870 |
| Specific heat (kJ/kg·K) | 1 |
| Conductivity W/(m·K) | 0.2 |
| Heat reaction (kJ/kg) | 209 |
| Combustion heat (kJ/mol·O2) | 2.8402 × 10⁴ |
| Activation energy (kJ/kmol) | 6.65 × 10⁴ |
| Pre-exponential factor (K/s) | 1.9 × 10⁶ |
| Initial temperature (°C) | 20 |
© 2020 by the authors. Licensee MDPI, Basel, Switzerland. This article is an open access article distributed under the terms and conditions of the Creative Commons Attribution (CC BY) license (http://creativecommons.org/licenses/by/4.0/).
Share and Cite
Fernández-Alaiz, F.; Castañón, A.M.; Gómez-Fernández, F.; Bernardo-Sánchez, A.; Bascompta, M. Determination and Fire Analysis of Gob Characteristics Using CFD. Energies 2020, 13, 5274. https://doi.org/10.3390/en13205274
Fernández-Alaiz F, Castañón AM, Gómez-Fernández F, Bernardo-Sánchez A, Bascompta M. Determination and Fire Analysis of Gob Characteristics Using CFD. Energies. 2020; 13(20):5274. https://doi.org/10.3390/en13205274
Chicago/Turabian StyleFernández-Alaiz, Florencio, Ana Maria Castañón, Fernando Gómez-Fernández, Antonio Bernardo-Sánchez, and Marc Bascompta. 2020. "Determination and Fire Analysis of Gob Characteristics Using CFD" Energies 13, no. 20: 5274. https://doi.org/10.3390/en13205274