Article

The Effect of Fracturing Fluid Saturation on Natural Gas Flow Behavior in Tight Reservoirs

1
State Key Laboratory of Petroleum Resources and Prospecting, China University of Petroleum, Beijing 102249, China
2
Key Laboratory of Deep Oil and Gas, China University of Petroleum (East China), Qingdao 266580, China
*
Author to whom correspondence should be addressed.
Energies 2020, 13(20), 5278; https://doi.org/10.3390/en13205278
Submission received: 8 September 2020 / Revised: 3 October 2020 / Accepted: 5 October 2020 / Published: 12 October 2020
(This article belongs to the Section L: Energy Sources)

Abstract

:
Hydraulic fracturing becomes an essential method to develop tight gas. Under high injection pressure, fracturing fluid entering into the formation will reduce the flow channel. To investigate the influence of water saturation on gas flow behavior, this study conducted the gas relative permeability with water saturation and the flow rate with the pressure gradient at different water saturations. As the two dominant tight gas-bearing intervals, the Upper Paleozoic Taiyuan and Shihezi Formations deposited in Ordos Basin were selected because they are the target layers for holding vast tight gas. Median pore radius in the Taiyuan Formation is higher than the one in the Shihezi Formation, while the most probable seepage pore radius in the Taiyuan Formation is lower than the one in the Shihezi Formation. The average irreducible water saturation is 54.4% in the Taiyuan Formation and 61.6% in the Shihezi Formation, which indicates that the Taiyuan Formation has more movable water. The average critical gas saturation is 80.4% and 69.9% in these two formations, respectively, which indicates that the Shihezi Formation has more movable gas. Both critical gas saturation and irreducible water saturation have a negative relationship with porosity as well as permeability. At the same water saturation, the threshold gradient pressure of the Taiyuan Formation is higher than the one in the Shihezi Formation, which means that water saturation has a great influence on the Taiyuan Formation. Overall, compared with the Shihezi Formation, the Taiyuan Formation has a higher median pore size and movable water saturation, but water saturation has more influence on its gas flow capacity. Our research is conducive to understanding the effect of fracturing fluid filtration on the production of natural gas from tight reservoirs.

1. Introduction

A tight sand formation attracts a lot of attention due to its great natural gas-bearing property [1], and hydraulic fracturing is regarded as an effective way to exploit its resources [2,3]. Hydraulic fracturing was conducted to create complex fractures near a borehole, which increases the conductivity of the formation and makes oil/gas flow into the well easily. Under the effect of high injection pressure, capillary force and osmotic effect, and so on [4,5,6], fracturing fluid filtrates into the formation. This behavior can reduce the gas flow channel, and cause aqueous phase trapping (APT), which will influence the natural gas exploitation [7,8]. Usually, through quick and effective flowback to reduce the soaking time and liquid filtration distance, the APT damage can be relieved [9], and some chemical treatments for improving the flowback rate of the aqueous phase have been widely investigated [10,11,12,13,14,15]. Some equations have been proposed to evaluate the APT damage. Bennion et al. [16] proposed two important parameters to evaluate APT damage, including initial water saturation and permeability. Initial water saturation is closely related to gas relative permeability, and the APT damage caused by ultra-low water saturation is more severe than the one caused by irreducible water saturation [17]. An index including initial water saturation and porosity was also proposed to estimate APT damage [18]. A phase trapping coefficient (PTC) index was proposed by You and Kang [19] to evaluate APT damage, which includes many parameters, such as permeability, porosity, biggest differential pressure for the driving fluid, viscosity ratio to the trapping phase and gas, interfacial tension, the angle of contact, initial water saturation and irreducible water saturation. Initial water saturation and displacement pressure difference play key roles in evaluating the damage of aqueous phase trapping. Tian et al. [20] proposed a new method to appraise the permeability damage caused by APT, because the new method exerted a back pressure, and APT damage appraised by this new method is weaker than the one by the conventional method. Even though there is some previous research related to the influence of water saturation on tight gas production, it still needs more investigation for better developing the resource in tight reservoirs.
This research focused on gas relative permeability with water saturation and the flow rate with the pressure gradient at different water saturations. Complementary experiments mainly include mercury intrusion porosimetry (MIP), scanning electron microscope (SEM), quantitative evaluations of minerals by scanning electron microscopy (QEMSCAN), gas bubble pressure (GBP) and centrifugation. Distilled water is the experimental liquid. The main purpose of our study focused on the effect of fracturing fluid filtration on the exploitation of natural gas from tight reservoirs.

2. Samples and Experimental Methods

All samples are taken from the Upper Paleozoic Taiyuan and Shihezi Formations in Ordos Basin. The formation temperature distributes from 60° to 95° in the study depth, which is obtained through the temperature log. These selected samples can be representative of the field because they are the typical formations and depth for tight gas production. The Taiyuan Formation is full of the matrix, but lacks primary intergranular pores, and dissolution pores are the main space for holding natural gas. The Shihezi Formation lacks the matrix, but is full of primary intergranular pores which are packed by late diagenetic minerals, and intercrystal pores are the main space for holding natural gas [21]. The Taiyuan Formation was formed under the environment of sea transgression, which mainly belongs to the overlapping sedimentary system between marine and continental facies. The Shihezi Formation was formed under the environment of coastal plains, which mainly belongs to the lacustrine and delta sedimentary system. The cylindrical samples were cored from the whole diameter rocks, and before the testing, the samples were dried in an oven. Some main and supplementary experiments were conducted to research the effect of water saturation on the gas flow behavior in tight reservoirs, including porosity, permeability, mercury intrusion porosimetry (MIP), scanning electron microscope (SEM), quantitative evaluations of minerals by scanning electron microscopy (QEMSCAN), gas bubble pressure (GBP), centrifugation, gas relative permeability and gas flow rate with the pressure gradient at different water saturations. The sample porosity was measured by helium porosimetry (KXD-III type), where the error of the pressure transducer was ±0.5% FS and the testing temperature was about 25 °C, which was controlled by an air-conditioner in the room, with the testing gas as helium at 0.8 MPa. Two types of permeability measurement apparatuses were used, including a conventional permeameter and a pulse decay permeameter. Usually, the testing time of the conventional permeameter is longer than the one of the pulse decay permeameter. At the same time, the pulse decay permeameter can measure a lower permeability, while the conventional permeameter can monitor the flow rate with different pressure gradients. The basic sample permeability was tested by the conventional permeameter, and the testing gas was nitrogen, with the confining pressure at 5 MPa, gas pressure at 0.25 MPa and the testing temperature at about 25 °C, which was controlled by an air-conditioner in the room. The mercury intrusion porosimetry was measured by an AutoPore IV 9505 which was made by Micromeritics Instrument Corporation in Norcross, Georgia, US, and the sample was a cylinder with a diameter of 25.4 mm, and the error of the pressure transducer was ±0.1% FS. The SEM was analyzed with a Helios Nanolab 650 and QEMSCAN was observed by an QEMSCAN 650F instrument, and both were made by FEI Company in Hillsboro, Oregon, US. The gas bubble pressure experiment was carried out with an assembly apparatus, which reflects the distribution of seepage pores by using a gas displacing saturated sample [22,23]. The centrifugation experiment was conducted with an LXJ-2, where the maximum centrifugal speed was 10,000 r/min and the error of centrifugal speed was ±2.5% FS. The conventional permeameter can monitor the gas flow rate, and the pulse decay permeameter can calculate the gas relative permeability. These two methods are described in detail below.
The schematic diagram of the conventional permeameter is shown in Figure 1. This instrument mainly consists of a gas storage tank, core holder, fluid pressurizer and graduated glass tube. The gas storage tank provides high-pressure gas, which can be as high as 14 MPa; the sample was placed in the core holder; the fluid pressurizer was used to impose the confining pressure on the rock; the graduated glass tube works by measuring the gas rate by monitoring the liquid film migration at atmospheric pressure. The error number of flow rate was ±2% FS. This apparatus can measure the flow rate and then calculate the gas permeability.
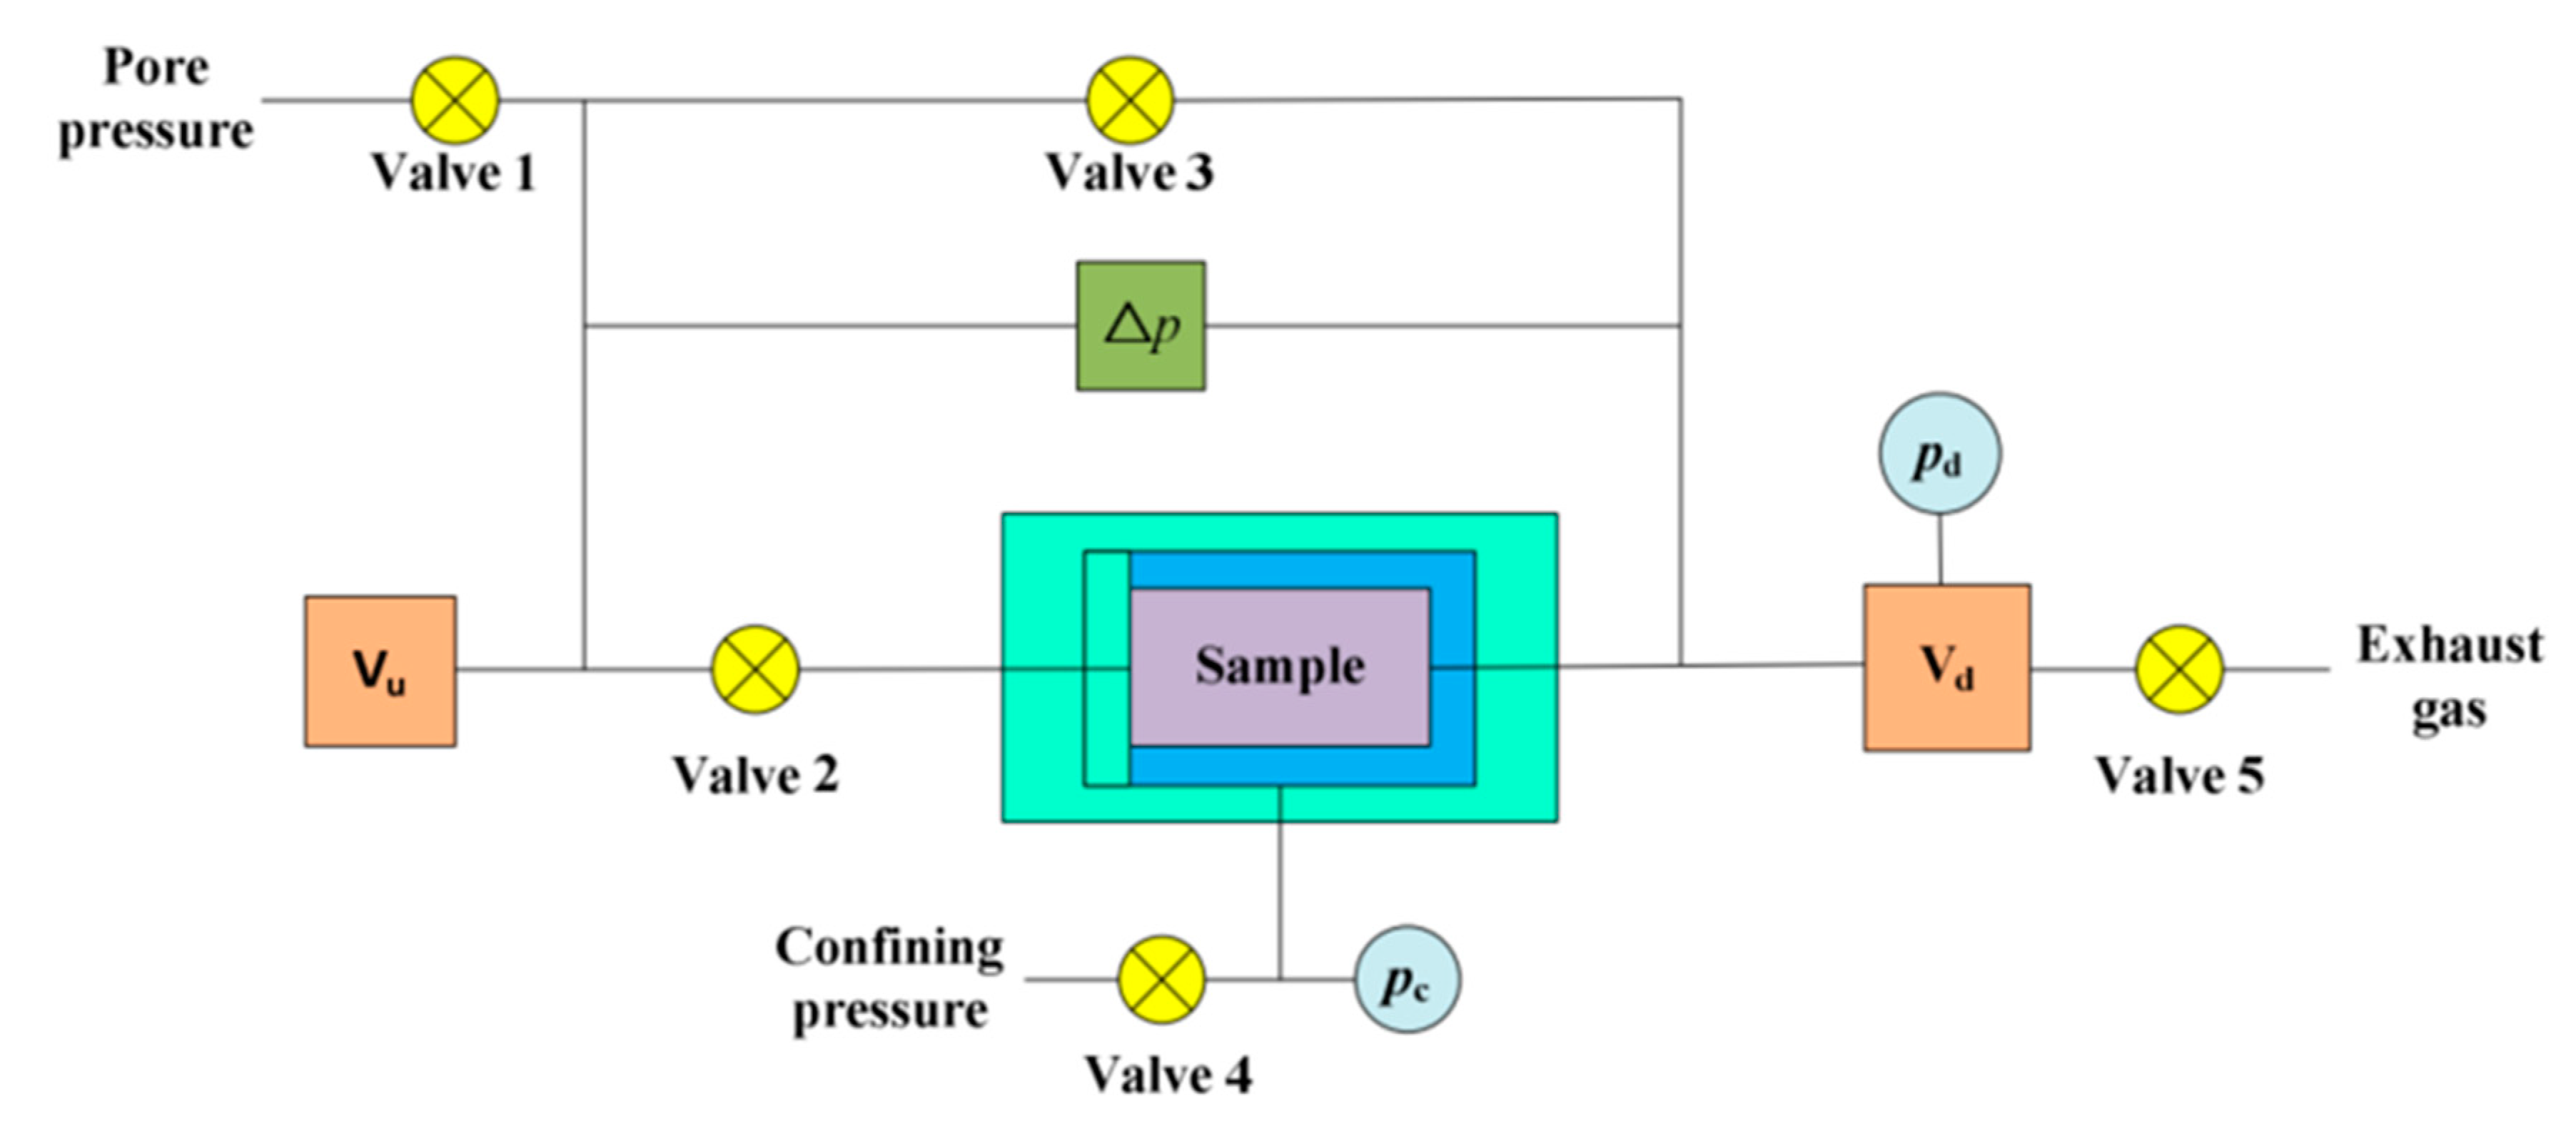
The gas relative permeability was studied by using a pulse decay permeameter which was made by Beijing Yongruida Technology CO., LTD in China, and its schematic diagram is shown in Figure 2. This apparatus mainly consists of a core holder, upstream cell (Vu), downstream cell (Vd), differential pressure transducer (△p), pore pressure transducer (Pd) and confining pressure transducer (Pc). The errors of the differential pressure transducer, pore pressure transducer and confining pressure transducer were 0.1 level, ±0.25% FS and ±0.25% FS, respectively. The theory of the pulse decay permeameter was based on the relationship between the logarithm of differential pressure and testing time, which has a linear relationship, and the slope has a good relationship with permeability [24,25,26]. Therefore, the permeability can be obtained by multiple parameters calculation. The permeability calculation model is similar to the one in [24]. The testing gas was nitrogen, and the confining pressure was imposed by water. The pulse decay permeameter has been proved an effective method to determine the permeability of tight reservoirs, which can quickly obtain the sample permeability [27].

3. Results and Discussion

3.1. Some Basic Properties of Samples

Some basic information about tested samples is shown in Table 1. The porosity of the Taiyuan Formation ranges from 3.4% to 9.07%, and the average is 6.64%. The porosity of the Shihezi Formation distributes from 2.25% to 13.77%, and the average is 8.93%. The permeability of the Taiyuan Formation ranges from 0.07 to 0.39 mD, and the average is 0.17 mD. The permeability of the Shihezi Formation distributes from 0.06 to 2.15 mD, and the average is 0.62 mD. Overall, the Shihezi Formation has a higher value of both average porosity and permeability. The depth of the Taiyuan Formation ranges from 1983 to 2456 m, and the depth of the Shihezi Formation ranges from 1660.2 to 3225.4 m.

3.2. Pore Throat Size Distribution, SEM and QEMSCAN Analysis

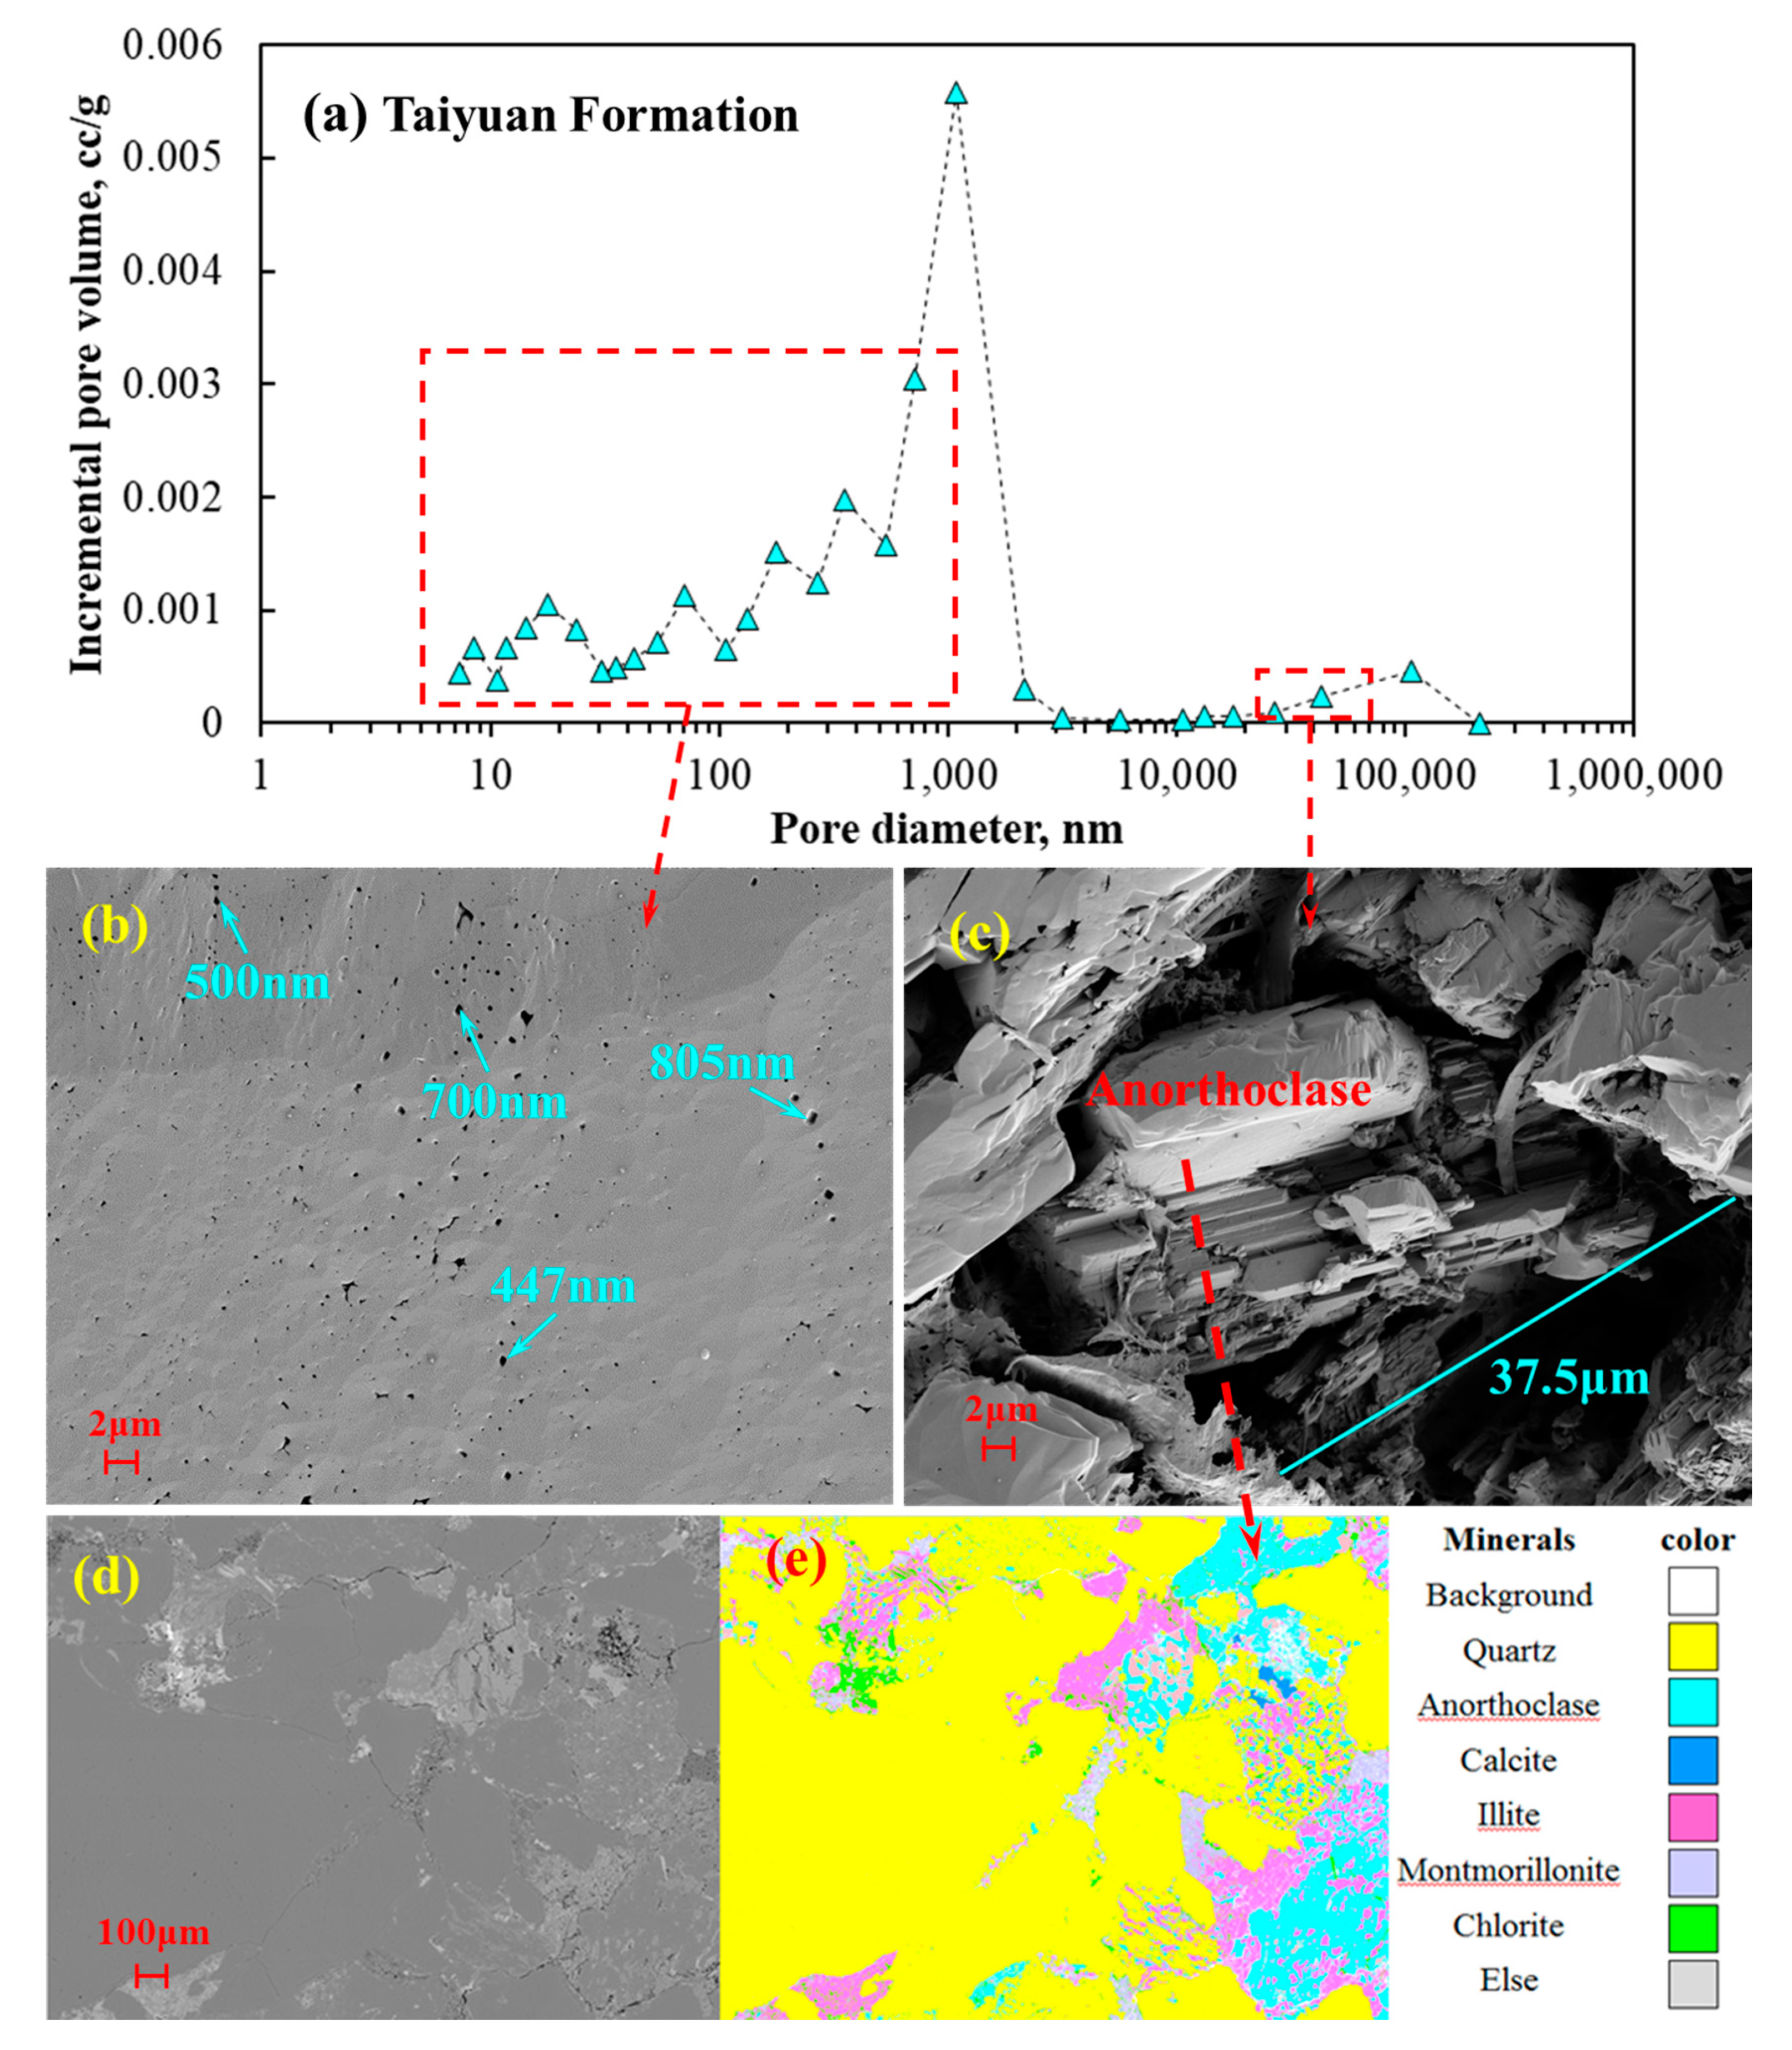
Multiple methods have been used to appraise the pore structure characteristics of tight reservoirs, which mainly include casting the thin section, scanning electron microscope (SEM), low-temperature nitrogen adsorption (NA), mercury intrusion porosimetry (MIP), low-field nuclear magnetic resonance (NMR) and computed tomography (CT) [28]. Both casting the thin section and SEM can directly observe the pore characteristics in two dimensions, but SEM has a higher resolution [29,30,31,32]. The methods of NA and NMR are indirect ways to reflect the pore size distribution, while the MIP method can reflect the pore throat size distribution [33,34]. For researching the mineral distribution in a large area, the quantitative evaluation of minerals by scanning electron microscopy (QEMSCAN) is regarded as an effective way [35]. The pore characterization and minerals distribution of the Taiyuan Formation are shown in Figure 3. The pore throat size distribution is presented in Figure 3a, and the median pore radius is 0.146 μm. The pore size smaller than 1 μm is shown in Figure 3b, and there are a lot of pores in quartz. The pore size in the small red dotted box of Figure 3a is corresponding to the pores in Figure 3c, and the pore size can be as large as 37.5 μm. Figure 3d is the SEM picture of Figure 3e. In Figure 3e, quartz, anorthoclase and illite are the main minerals.
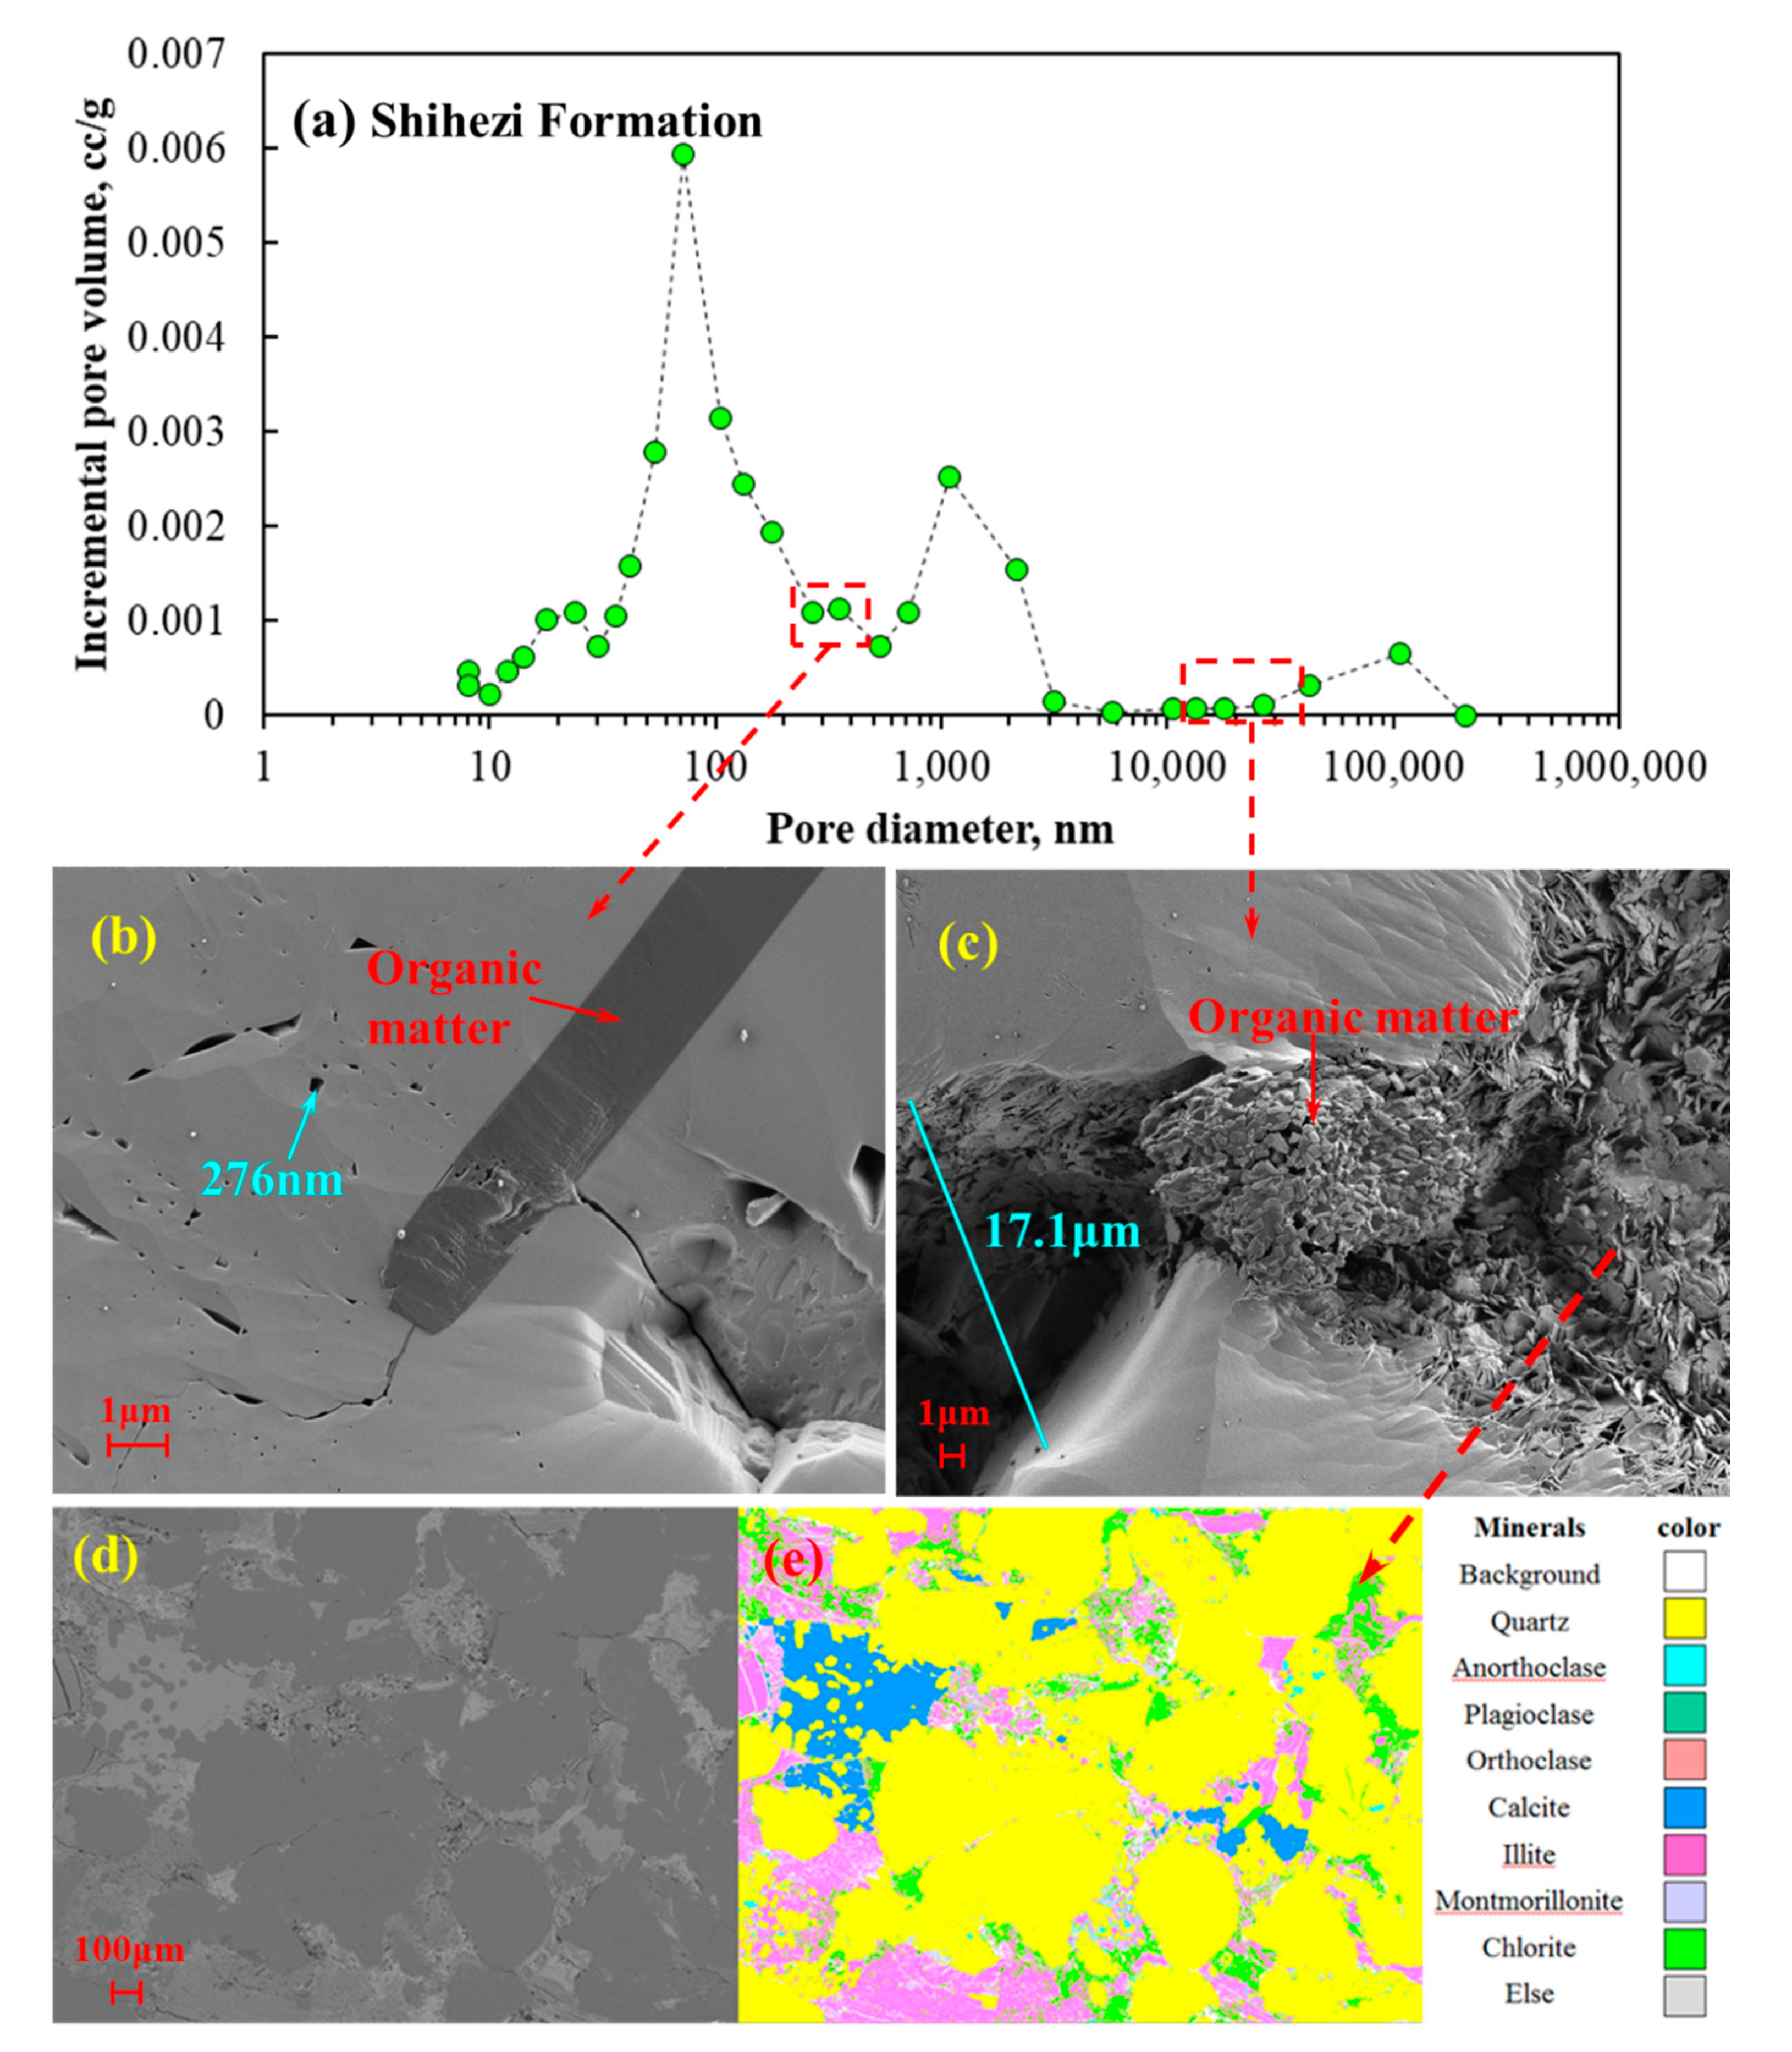
The pore structure characterization and minerals distribution of the Shihezi Formation are shown in Figure 4. Figure 4a is the pore throat size distribution and the median pore size is 0.047 μm. The pore size in the left dotted box of Figure 4a is corresponding to the pores in Figure 4b which has organic matter and this organic matter may be residual asphaltene. The pore size in the right dotted box of Figure 4a is corresponding to the pores in Figure 4c which has some organic matter in the pores, and the organic matter may be the residual asphaltene. The chlorite is well developed in the sample shown in Figure 4c, which also can be reflected in Figure 4e. Figure 4d is the SEM picture of Figure 4e. In Figure 4e, quartz, illite, chlorite and calcite are the main minerals. The residual asphaltene may be caused by oil decomposition or gas flowing out of the oil. If the reservoir pressure is above the asphaltene onset point, the producing gas and reducing pressure down to the asphaltene instability region are prone to generating solid asphaltene [36]. This kind of asphaltene can narrow the gas flow channel and influence the production rate.
In Table 2, the minerals’ components are shown based on the QEMSCAN analysis. In the Taiyuan Formation, quartz is the main mineral component with 69.94% in weight and 68.71% in area. Anorthoclase is 12.73% in weight percent and illite is 11.16% in weight percent, which indicated that these two types of minerals have a similar percent in the Taiyuan Formation. In the Shihezi Formation, the quartz content in weight percent is 66.45% and its area content is 64.66%. Illite is the second-highest mineral, which is 15.28% in weight percent, and then it is chlorite with 10.02% in weight percent. On the whole, quartz is the main mineral in these two types of formations.

3.3. Seepage Pore Size Distribution

The whole pore throat size distribution and pore structure were described in the previous section, which can influence the flow rate, but their relationship with the flow rate is weaker than the relationship between the seepage pore size and flow rate. Seepage pore size distribution was obtained by the gas bubble pressure (GBP) method, which is based on the physical principle that gas passing through different saturated pores needs different pressures, and the recorded flow rate at different pressures can be converted to seepage pore size distribution. There are several assumptions when the gas bubble pressure method is used to calculate the seepage pore size distribution in porous media: (1) the seepage pore is regarded as a cylindrical shape; (2) the contact angle is zero; and (3) at the wetting condition, the flow rate has a positive relationship with the opened seepage pore area. Therefore, the ratio between the opened seepage pore area and total seepage pore area is R(r), which can be equal to the ratio between the flow rate at the wetting condition and the one at the non-wetting condition [22].
R ( r ) = F w ( r ) F D ( r ) × 100 %
where FW is the flow rate with different gas bubble pressures at the wetting condition; FD is the flow rate with different gas bubble pressures at the non-wetting condition.
The function of seepage pore radius distribution can be obtained by taking the R(r) derivative with respect to the pore radius.
f ( r ) = d ( R ( r ) ) / dr
According to the data of the gas pressure flow rate, the seepage pore size distribution can be obtained.
Before GBP testing, the samples were saturated with water under 15 MPa for 24 h, and the seepage pore size distribution is shown in Figure 5. In Figure 5a, the seepage pore size distributes from 0.103 to 0.137 μm, and the most probable seepage pore size is 0.111 μm. This indicated that the seepage pore size with 0.111 μm contributes more to the flow rate. In Figure 5b, the seepage pore size ranges from 0.078 to 0.12 μm, and the most probable pore size is 0.078 μm. This indicated that the seepage pore size with 0.078 μm mainly controls the flow rate. In Figure 5c, the seepage pore size ranges from 0.096 to 0.26 μm, and the most probable pore size is 0.096 μm. Therefore, the small pores influence the flow rate greatly. Based on the above analysis, the most probable radius is less than 0.111 μm in the Taiyuan Formation. Sample TS1 with the highest most probable radius is mainly caused by its highest porosity and permeability. In Figure 5d, the seepage pore size ranges from 0.144 to 0.576 μm, and the most probable pore size is 0.288 μm. In Figure 5e, the seepage pore size distributes from 0.156 to 0.274 μm, and the most probable pore size is 0.175 μm. In Figure 5f, the seepage pore size distributes from 0.115 to 0.24 μm, and the most probable pore size is 0.152 μm. Sample HS3 has the lowest most probable radius but has the highest porosity and permeability, which is mainly caused by the pore structure. Therefore, the most probable pore size is larger than 0.152 μm in the Shihezi Formation, which is higher than the one in the Taiyuan Formation. The higher the most probable seepage pore size is, the much easier the gas flow will be. The variability between samples at the same formation is mainly influenced by the pore structure, and the variability between samples at different formations is mainly influenced by the sedimentary environment and minerals’ components.

3.4. Irreducible Water Saturation

The seepage pore mainly reflects the throat size, which could not show how much water can move out of the pore network. However, irreducible water saturation is a useful parameter to appraise the movable water content [37,38,39]. The water saturation that varied with the centrifugal speed is shown in Figure 6a, and the utmost centrifugation speed is 10,000 r/min. From the curves, the water saturation of all samples decreases with the centrifugal speed. Sample TS3 decreases slowly with the centrifugal speed, and sample HS3 decreases quickly, which is closely related to porosity and permeability. The porosity of sample HS3 with 13.56% is far higher than the one of sample TS3 with only 3.4%, and the permeability of sample HS3 with 2.147 mD is far higher than the one of sample TS3 with only 0.075 mD. At the centrifugal speed of 10,000 r/min, the irreducible water saturation in sample HS3 is 33.3%, but the one in sample TS3 is as high as 77.8%, which is more than two times the one of sample HS3. Therefore, the higher the porosity as well as permeability, the lower the irreducible water saturation. When the centrifugal speed reached 10,000 r/min, the irreducible water saturation was 38.4%, 46.9%, 72.2% and 79.4% in samples TS1, TS2, HS1 and HS2, respectively. Usually, the lower the irreducible water saturation is, the better the flowback efficiency of fracturing fluid will be. The relationship between irreducible water saturation and porosity as well as permeability is shown in Figure 6b. The irreducible water saturation has a negative relationship with porosity, which indicated that the higher the porosity is, the more water can move in pore networks. Therefore, the formation with high porosity is prone to have a high flowback rate. As a whole, the irreducible water saturation has a negative relationship with permeability, which indicates that more liquid can move out of the high-permeability sample than the low-permeability sample.

3.5. Gas Relative Permeability

Water saturation has a great influence on gas permeability, and with increasing the water saturation, the gas permeability decreases gradually. The gas relative permeability was measured by the pulse decay permeameter. The water saturation was established by the rolling method. Namely, the sample was rolled on the wet cloth and then packed with a preservative film for 12 h. The experimental conditions are shown in Table 3.
The gas relative permeability is shown in Figure 7a, and all curves decrease with the water saturation. The curves of samples TS3, HS1 and HS2 have similar characteristics, and when gas could not move, the water saturation was 14.1%, 14% and 13.8% in these three samples, respectively. The gas relative permeability of sample HS3 decreases slowly with the water saturation, and there is still some relative permeability at 0.028 when the water saturation becomes 62.4%. The permeability of sample TS2 becomes 0 when the water saturation is 25.2%. In sample TS1, when the water saturation increases from 11.9% to 19.4%, the gas relative permeability decreases from 0.8 to 0, which indicates that the increased water in this region has a serious influence on permeability. Critical gas saturation is a significant parameter in appraising the aqueous phase effect [40]. Usually, the lower the critical gas saturation, the weaker the aqueous phase effect on the reservoir. The relationship among critical gas saturation, porosity and permeability is shown in Figure 7b. The critical gas saturation has a negative relationship with porosity, which indicates that a high porosity benefits the gas flow at high water saturation. It also shows that high porosity has weak aqueous phase damage. On the whole, the critical gas saturation has a negative relationship with permeability, which shows that gas can flow at high water saturation when formation permeability is high enough. Therefore, less aqueous phase damage will be when tight sand has a lower critical gas saturation. The most probable seepage pore size has no direct influence on the gas relative permeability, and the order of most probable pore size is HS1 > HS2 > HS3 > TS1 > TS3 > TS2. The critical gas saturation of HS3 is highest, but its most probable pore size is in the middle value. The critical gas saturation is similar among TS3, HS1 and HS2, while their most probable pore size is totally different.

3.6. Flow Rate with Gradient Pressure at Different Water Saturations

During hydraulic fracturing, liquid fills into the formation and damages the effective flow channel. In the process of flowback, the liquid was displaced out of the main flow channel and the flow channel was opened. To simulate the flow rate with the pressure gradient at different water saturations, firstly, the water saturation was established by using the rolling method, which was conducted by rolling the cylindrical sample on a wet cloth, and then the sample was packed with a preservative film for 12 h to make the homogeneous water distribution. Through the rolling method, different water saturations were established, and then the flow rate with different gradient pressures was carried out, which can study the effect of filtration fracturing fluid saturation on gas production. The experimental conditions are listed in Table 4. The relationship between flow rate and pressure gradient at different water saturations is presented in Figure 8.

3.6.1. Taiyuan Formation

In Figure 8a, the dry sample and two kinds of water saturation were used. In the dry condition, the flow rate increases quickly, and at the pressure gradient of 1 MPa/cm, the flow rate in the dry sample with 200 mL/min is far higher than the ones in the other two kinds of water saturation, which are 14.5 and 3.8 mL/min, respectively. No threshold pressure gradient exists in the dry sample, while there is a threshold pressure gradient in the wet sample. The threshold pressure gradient in Sw = 20% is 0.2 MPa/cm, and the one in Sw = 40% is 0.5 MPa/cm, which indicates that the higher the water saturation, the higher the threshold pressure gradient. At the same time, the low water saturation at 20% also causes great damage to the flow rate. In Figure 8b, when the pressure gradient is 0.9 MPa/cm, the flow rate in the dry sample is 48 mL/min, which is far higher the ones of the wet samples, because the flow rate in the sample at Sw = 20% is only 6.9 mL/min and the flow rate in the sample at Sw = 40% is only 0.43 mL/min. There is no threshold pressure gradient in the dry samples, but the threshold pressure gradient exists in the wet samples, which is 0.2 and 0.7 MPa/cm in the sample at Sw = 20% and in the sample at Sw = 40%, respectively. This indicated that the threshold pressure gradient in sample TS5 is higher than the one in sample TS4 at a higher water saturation.

3.6.2. Shihezi Formation

In Figure 8c, compared with the two samples from the Taiyuan Formation, water saturation has less influence on the flow rate in HS4. When the pressure gradient is 1 MPa/cm, the flow rate in the dry samples, Sw = 25% and Sw = 41%, is 114.3, 60 and 40 mL/min, respectively. There is no threshold pressure gradient in the dry sample and wet sample at 25% water saturation. The threshold pressure gradient of the wet sample at 41% is 0.2 MPa/cm, which is far lower than the one in sample TS5. In Figure 8d, a sample with three kinds of water saturation was conducted. Nearly no threshold pressure gradient exists even though the water saturation is 100%. At the pressure gradient of 0.1 MPa/cm, the flow rate is 13.3, 6 and 0.013 mL/min, respectively, which indicates nearly no flow rate when the water saturation is 100%. At the pressure gradient of 0.8 MPa/cm, the flow rate is 360, 167.8 and 64.2 mL/min, respectively. Compared with samples from the Taiyuan Formation, at the same water saturation, the water content has less influence on the flow rate. In Figure 8e, on the whole, there is nearly no threshold pressure gradient, and at 0.1 MPa/cm, the flow rate is 3, 0.86 and 0.013 mL/min in samples at Sw = 23%, 45% and 64%, respectively. When the pressure gradient is 0.9 MPa/cm, the flow rate is 75, 26.9 and 0.57 mL/min at the three kinds of water saturation. Therefore, the flow rate before 0.9 MPa/cm at Sw = 64% is too small to be neglected, and the flow rate can be 48 mL/min when the pressure gradient reaches 3.6 MPa/cm. Compared with sample HS5, water saturation has a more severe influence on the flow rate in sample HS6. In Figure 8f, three types of water saturation were used, including 18%, 40% and 64%. There is no threshold pressure gradient at Sw = 18% and 40%, while the wet sample at 64% water saturation has a threshold pressure gradient which is 0.43 MPa/cm. When the pressure gradient reached 1.1 MPa/cm, the flow rate was 127.7 mL/min and 74.1 mL/cm at Sw = 18% and 40%, respectively. The flow rate is 35.3 mL/min at Sw = 64% when the pressure gradient is 1.3 MPa/cm, and the flow rate can be 75 mL/min as the pressure gradient reaches 1.7 MPa/cm. Therefore, water saturation plays a significant role in the gas flow rate and influences gas production.

3.6.3. Comparison between These Two Formations

Both the Taiyuan Formation and Shihezi Formation are important targets for exploiting natural gas. Through comparison, more properties will be exposed and the understanding of these two kinds of formations will be improved. Based on the above research, water saturation has more influence on the Taiyuan Formation than the Shihezi Formation. When water saturation is about 20%, the threshold pressure gradient is 0.2 MPa/cm in the Taiyuan Formation, while there is no threshold pressure gradient in the Shihezi Formation. When water saturation is about 40%, the threshold pressure gradient is 0.5 and 0.7 MPa/cm, while the threshold pressure gradient of the Shihezi Formation is lower than 0.2 MPa/cm. The reason may be that there are a lot of small pore throats in the Taiyuan Formation which is presented in Figure 3b. Small throats need a high pressure gradient to make fluid pass through. Therefore, from the displacement perspective, the fracturing fluid retention in the Shihezi Formation is much easier to be displaced out than the one in the Taiyuan Formation. Overall, reducing fracturing fluid filtration will conserve reservoirs and fracturing fluid filtration has more influence on the Taiyuan Formation than the Shihezi Formation. The clay minerals may be related to gas recovery. The chlorite content of the Taiyuan Formation is 2.67% in weight, while the one in the Shihezi Formation is 10.02% in weight, which indicates that the higher the chlorite content, the much easier it is for the liquid to be displaced out of the formation.

3.7. Comparison of Tight Sand Formation with Other Unconventional Formations

The natural gas exploitation from tight sand reservoirs is different from other unconventional reservoirs, such as shale reservoirs. Both tight sand reservoirs and shale reservoirs need hydraulic fracturing to develop their resources. In a tight sand reservoir, the higher the flowback rate, the less formation damage, and the higher the natural gas production will be. This phenomenon is closely related to aqueous phase trapping (APT), because a higher fracturing fluid retention can reduce the gas flow channel and cause serious APT. Therefore, quick flowback and some additive surfactant to reduce the interfacial tension can reduce liquid retention, which benefits a higher natural gas production from tight sand reservoirs [41]. The natural gas production from the shale reservoir is totally different from tight sand reservoirs. Usually, a good shale gas reservoir has a lower flowback rate, which is contrary to a tight gas reservoir. Based on relevant research, the clay swelling-induced cracks and fracturing fluid diffusion account for the special phenomenon in the shale gas reservoir [27,42]. Induced cracks increase the space for both liquid retention and gas flow. Fracturing fluid trapped in the micro-nano induced cracks is difficult to flowback due to the strong capillary force, but under the capillary force, the liquid can move from induced cracks to small pores, which can greatly increase the main gas flow channel, and thus after well shut-in for a time, shale gas can flow out of the formation.

4. Conclusions

A tight reservoir is an important formation to hold a large amount of natural gas, and hydraulic fracturing is necessary to exploit the resources. Fracturing fluid filtrating into the formation can cause aqueous phase damage, which will influence the production of tight gas out of the formation. The main results were shown as follows.
From the gas bubble pressure method, the most probable pore radius ranges from 0.078 to 0.111 μm in the Taiyuan Formation, while the most probable pore radius distributes from 0.152 to 0.288 μm in the Shihezi Formation, which indicates that the main seepage pore size in the Taiyuan Formation is lower than the one in the Shihezi Formation.
The average irreducible water saturation is 54.4% and 61.6% in the Taiyuan Formation and the Shihezi Formation, respectively. The average critical gas saturation is 80.4% and 69.9% in these two kinds of formation, respectively. Therefore, the Taiyuan Formation has more movable water saturation and the Shihezi Formation has more movable gas saturation. Both irreducible water saturation and critical gas saturation have a negative relationship with porosity and permeability.
At the same water saturation, such as about 40%, the threshold pressure gradient can be as high as 0.7 MPa/cm in the Taiyuan Formation, while the highest threshold pressure gradient in the Shihezi Formation is only 0.2 MPa/cm, which indicates that water saturation has more influence on the Taiyuan Formation than the Shihezi Formation.
Unlikely, a productive shale reservoir, which has the capacity of aqueous phase trapping auto-removal, reducing the contact time between the fracturing fluid and reservoir can reduce formation damage and benefit tight gas flowing out of the formation.

Author Contributions

Conceptualization, M.M. and H.G.; methodology, M.M. and Y.S.; validation, H.G. and Y.S.; formal analysis, M.M. and X.X.; investigation, X.X. and Y.W.; resources, Y.S.; data curation, X.X. and Y.W.; writing—original draft preparation, M.M.; writing—review and editing, H.G. and Y.S.; funding acquisition, H.G. and Y.S. All authors have read and agreed to the published version of the manuscript.

Funding

This work was supported by National Science and Technology Major Project (2017ZX05039-004) & the Strategic Cooperation Technology Projects of CNPC and CUPB (ZLZX2020-01), and the APC was funded by (2017ZX05039-004).

Conflicts of Interest

The authors declare no conflict of interest.

References

  1. Kang, Y.; Xu, C.; You, L.; Yu, H.; Zhang, B. Comprehensive evaluation of formation damage induced by working fluid loss in fractured tight gas reservoir. J. Nat. Gas Sci. Eng. 2014, 18, 353–359. [Google Scholar] [CrossRef]
  2. Lai, F.; Li, Z.; Wang, Y. Impact of water blocking in fractures on the performance of hydraulically fractured horizontal wells in tight gas reservoir. J. Pet. Sci. Eng. 2017, 156, 134–141. [Google Scholar] [CrossRef]
  3. Liang, X.; Zhou, F.; Liang, T.; Su, H.; Yuan, S.; Li, Y. Impacts of pore structure and wettability on distribution of residual fossil hydrogen energy after imbibition. Int. J. Hydrog. Energy 2020, 45, 14779–14789. [Google Scholar] [CrossRef]
  4. Li, C.; Singh, H.; Cai, J. Spontaneous imbibition in shale: A review of recent advances. Capilarity 2019, 2, 17–32. [Google Scholar] [CrossRef] [Green Version]
  5. Shen, Y.; Ge, H.; Zhang, X.; Chang, L.; Liu, D.; Liu, J. Impact of fracturing liquid absorption on the production and water-block unlocking for shale gas reservoir. Adv. Geo Energy Res. 2018, 2, 163–172. [Google Scholar] [CrossRef] [Green Version]
  6. Shen, W.; Li, X.; Cihan, A.; Lu, X.; Liu, X. Experimental and numerical simulation of water adsorption and diffusion in shale gas reservoir rocks. Adv. Geo Energy Res. 2019, 3, 165–174. [Google Scholar] [CrossRef]
  7. Bennion, D.B.; Thomas, F.B.; Bennion, D.W.; Bietz, R.F. Mechanisms of Formation Damage and Permeability Impairment Associated With the Drilling, Completion and Production of Low API Gravity Oil Reservoirs. In Proceedings of the SPE International Heavy Oil Symposium, Society of Petroleum Engineers, Calgary, AB, Canada, 19–21 June 1995; pp. 689–707. [Google Scholar]
  8. Bennion, D.; Bietz, R.; Thomas, F.; Cimolai, M. Reductions in the Productivity of Oil And Low Permeability Gas Reservoirs Due to Aqueous Phase Trapping. J. Can. Pet. Technol. 1994, 33, 33. [Google Scholar] [CrossRef]
  9. Bennion, D.B.; Thomas, F.B.; Ma, T. Formation Damage Processes Reducing Productivity of Low Permeability Gas Reservoirs. In Proceedings of the SPE Rocky Mountain Regional/Low-Permeability Reservoirs Symposium and Exhibition, Society of Petroleum Engineers, Denver, CO, USA, 12–15 March 2000; pp. 1–19. [Google Scholar]
  10. Kewen, L.; Abbas, F. Experimental Study of Wettability Alteration to Preferential Gas-Wetting in Porous Media and Its Effects. SPE Reserv. Evaluation Eng. 2000, 3, 139–149. [Google Scholar] [CrossRef]
  11. Tang, G.Q.; Firoozabadi, A. Wettability Alteration to Intermediate Gas-Wetting in Porous Media at Elevated Temperatures. Transp. Porous Media 2003, 52, 185–211. [Google Scholar] [CrossRef]
  12. Fahes, M.M.; Firoozabadi, A. Wettability Alteration ro Intermediate Gas-Wetting in Gas-Condensate Reservoirs at High Temperatures. In Proceedings of the SPE Annual Technical Conference and Exhibition; Society of Petroleum Engineers (SPE), Dallas, TX, USA, 9–12 October 2005; p. 14. [Google Scholar]
  13. Kim, J.; Gomaa, A.M.; Nelson, S.G.; Hudson, H.G. Engineering Hydraulic Fracturing Chemical Treatment to Minimize Water Blocks: A Simulated Reservoir-on-a-Chip Approach. In Proceedings of the SPE International Conference and Exhibition on Formation Damage Control; Society of Petroleum Engineers (SPE), Lafayette, LA, USA, 24–26 February 2016; p. 16. [Google Scholar]
  14. Liu, X.; Kang, Y.; Luo, P.; You, L.; Tang, Y.; Kong, L. Wettability modification by fluoride and its application in aqueous phase trapping damage removal in tight sandstone reservoirs. J. Pet. Sci. Eng. 2015, 133, 201–207. [Google Scholar] [CrossRef]
  15. Arshad, A.; Muhannad Talib, S.; Khalil, R.; Hassan, B.; Muhammad Khan, M. Reducing Mechanical Formation Damage by Minimizing Interfacial Tension and Capillary Pressure in Tight Gas. In IOP Conference Series: Materials Science and Engineering; IOP Publishing: Bristol, UK, 2013; Volume 50, p. 12019. [Google Scholar]
  16. Bennion, D.; Thomas, F.; Bietz, R.; Bennion, D. Water and Hydrocarbon Phase Trapping In Porous Media-Diagnosis, Prevention And Treatment. J. Can. Pet. Technol. 1996, 35, 29–36. [Google Scholar] [CrossRef]
  17. Cimolai, M.P.; Gies, R.M.; Bennion, D.B.; Myers, D.L. Mitigating Horizontal Well Formation Damage in a Low-Permeability Conglomerate Gas Reservoir. In Proceedings of the SPE Gas Technology Symposium, Society of Petroleum Engineers, Calgary, AB, Canada, 28–30 June 1993; p. 11. [Google Scholar]
  18. Davis, B.B.J.; Wood, W.D. Maximizing Economic Return by Minimizing or Preventing Aqueous Phase Trapping During Completion and Stimulation Operations. In Proceedings of the SPE Annual Technical Conference and Exhibition, Society of Petroleum Engineers, New Orleans, LA, USA, 4–7 October 2004; pp. 1–8. [Google Scholar]
  19. You, L.; Kang, Y. Integrated Evaluation of Water Phase Trapping Damage Potential in Tight Gas Reservoirs. In Proceedings of the 8th European Formation Damage Conference; Society of Petroleum Engineers (SPE), Scheveningen, The Netherlands, 27–29 May 2009; pp. 1–10. [Google Scholar]
  20. Tian, J.; Kang, Y.; Luo, P.; You, L.; Zhang, D. A new method of water phase trapping damage evaluation on tight oil reservoirs. J. Pet. Sci. Eng. 2019, 172, 32–39. [Google Scholar] [CrossRef]
  21. Liu, N.; Yao, Y.; Junxiang, N.; Yin, P. Characteristics and low yield factors of H8 and Taiyuan Formation tight sandstone reservoir in the east of Ordos Basin, China. J. Chengdu Univ. Technol. Sci. Technol. Ed. 2015, 42, 435–443. (In Chinese) [Google Scholar]
  22. Xie, X.; Tang, H.; Meng, Y.; Li, G.; Zhao, F. The Application of Gas Bubble-pressure Method in the Study on Reservoir Pore Structures (Chinese Edition). J. Southwest Pet. Univ. Sci. Technol. Ed. 2009, 31, 17–20. [Google Scholar]
  23. McGuire, K.S.; Lawson, K.W.; Lloyd, D.R. Pore size distribution determination from liquid permeation through microporous membranes. J. Membr. Sci. 1995, 99, 127–137. [Google Scholar] [CrossRef]
  24. Jones, S. A Technique for Faster Pulse-Decay Permeability Measurements in Tight Rocks. SPE Form. Eval. 1997, 12, 19–26. [Google Scholar] [CrossRef]
  25. Cui, X.; Bustin, A.M.M.; Bustin, R.M. Measurements of gas permeability and diffusivity of tight reservoir rocks: Different approaches and their applications. Geofluids 2009, 9, 208–223. [Google Scholar] [CrossRef]
  26. Brace, W.F.; Walsh, J.B.; Frangos, W.T. Permeability of granite under high pressure. J. Geophys. Res. 1968, 73, 2225–2236. [Google Scholar] [CrossRef]
  27. Meng, M.; Ge, H.; Shen, Y.; Li, L.; Tian, T.; Chao, J. The effect of clay-swelling induced cracks on shale permeability during liquid imbibition and diffusion. J. Nat. Gas Sci. Eng. 2020, 83, 103514. [Google Scholar] [CrossRef]
  28. Sheng, G.; Zhao, H.; Su, Y.; Javadpour, F.; Wang, C.; Zhou, Y.; Liu, J.; Wang, H. An analytical model to couple gas storage and transport capacity in organic matter with noncircular pores. Fuel 2020, 268, 117288. [Google Scholar] [CrossRef]
  29. Meng, M.; Ge, H.; Shen, Y.; Ji, W.; Wu, Y.; Xu, X.; Huang, W.; Li, Q.; Yu, J. Analyzing Tight Sand Characteristics and Its Influence on Aqueous Phase Removal by Gas Displacement. Geofluids 2019, 2019, 1–18. [Google Scholar] [CrossRef]
  30. Liu, Y.; Xian, C.; Li, Z.; Wang, J.; Ren, F. A new classification system of lithic-rich tight sandstone and its application to diagnosis high-quality reservoirs. Adv. Geo Energy Res. 2020, 4, 286–295. [Google Scholar] [CrossRef]
  31. Li, W.; Lu, S.; Xue, H.; Zhang, P.; Hu, Y. Microscopic pore structure in shale reservoir in the argillaceous dolomite from the Jianghan Basin. Fuel 2016, 181, 1041–1049. [Google Scholar] [CrossRef]
  32. Ji, W.; Song, Y.; Rui, Z.; Meng, M.; Huang, H. Pore characterization of isolated organic matter from high matured gas shale reservoir. Int. J. Coal Geol. 2017, 174, 31–40. [Google Scholar] [CrossRef]
  33. Huang, H.; Li, R.; Xiong, F.; Hu, H.; Sun, W.; Jiang, Z.; Chen, L.; Wu, L. A method to probe the pore-throat structure of tight reservoirs based on low-field NMR: Insights from a cylindrical pore model. Mar. Pet. Geol. 2020, 117, 104344. [Google Scholar] [CrossRef]
  34. Zhang, P.; Lu, S.; Li, J.; Chang, X. 1D and 2D Nuclear magnetic resonance (NMR) relaxation behaviors of protons in clay, kerogen and oil-bearing shale rocks. Mar. Pet. Geol. 2020, 114, 104210. [Google Scholar] [CrossRef]
  35. Ji, W.; Hao, F.; Schulz, H.-M.; Song, Y.; Tian, J. The architecture of organic matter and its pores in highly mature gas shales of the lower Silurian Longmaxi Formation in the upper Yangtze platform, south China. AAPG Bull. 2019, 103, 2909–2942. [Google Scholar] [CrossRef]
  36. Hassanpouryouzband, A.; Joonaki, E.; Taghikhani, V.; Boozarjomehry, R.B.; Chapoy, A.; Tohidi, B. New Two-Dimensional Particle-Scale Model to Simulate Asphaltene Deposition in Wellbores and Pipelines. Energy Fuels 2018, 32, 2661–2672. [Google Scholar] [CrossRef]
  37. Goetz, D.; Knight, R.; Tercier, P. A Laboratory Procedure for Estimating Irreducible Water Saturation From Cuttings; SPWLA-1997-v38n2a4; Society of Petrophysicists and Well-Log Analysts: Houston, TX, USA, 1996; Volume 37, p. 7. [Google Scholar]
  38. Yang, Y.; Birmingham, T.J. Irreducible Water Saturation Has Been Determined as the Key Factor Governing Hydrocarbon Production From Low Permeability Carbonate at the Wattenberg Field in the Denver Julesburg Basin. In Proceedings of the SPE Annual Technical Conference and Exhibition, Society of Petroleum Engineers (SPE), Denver, CO, USA, 21–24 September 2008; p. 7. [Google Scholar]
  39. Bourdet, J.; Kempton, R. Novel Approach to Measuring Irreducible Water Salinity in Gas Reservoirs. In Proceedings of the Offshore Technology Conference-Asia, Kuala Lumpur, Malaysia, 25–28 March 2014; p. 8. [Google Scholar]
  40. Shanley, K.W.; Cluff, R.M.; Robinson, J.W. Factors controlling prolific gas production from low-permeability sandstone reservoirs: Implications for resource assessment, prospect development, and risk analysis. AAPG Bull. 2004, 88, 1083–1121. [Google Scholar] [CrossRef] [Green Version]
  41. Liang, X.; Zhou, F.; Liang, T.; Wang, C.; Wang, J.; Yuan, S. Impacts of low harm fracturing fluid on fossil hydrogen energy production in tight reservoirs. Int. J. Hydrogen Energy 2020, 45, 21195–21204. [Google Scholar] [CrossRef]
  42. Meng, M.; Ge, H.; Shen, Y.; Hu, Q.; Li, L.; Gao, Z.; Tian, T.; Chao, J. The effect of clay-swelling induced cracks on imbibition behavior of marine shale reservoirs. J. Nat. Gas Sci. Eng. 2020, 83, 103525. [Google Scholar] [CrossRef]
Figure 1. The schematic diagram of a conventional permeameter.
Energies 13 05278 g001
Figure 2. The schematic diagram of a pulse decay permeameter.
Energies 13 05278 g002
Figure 3. The pore size distribution (PSD) by mercury intrusion porosimetry (MIP) (a), the scanning electron microscope (SEM) (bd) and the quantitative evaluation of minerals by scanning electron microscopy (QEMSCAN) (e) in the Taiyuan Formation.
Energies 13 05278 g003
Figure 4. The PSD by MIP (a), SEM (bd) and QEMSCAN (e) in the Shihezi Formation.
Energies 13 05278 g004
Figure 5. The seepage pore size distribution: (ac) belonging to the Taiyuan Formation, and (df) belonging to the Shihezi Formation.
Energies 13 05278 g005
Figure 6. The water saturation changes with the centrifugal speed (a), and the relationship among irreducible water saturation, porosity and permeability (b).
Energies 13 05278 g006
Figure 7. The gas relative permeability changes with the water saturation (a), and the relationship among critical gas saturation, porosity and permeability (b).
Energies 13 05278 g007
Figure 8. The relationship among flow rate, pressure gradient and water saturation. (a,b) belong to the Taiyuan Formation, and (cf) belong to the Shihezi Formation.
Energies 13 05278 g008
Table 1. Some information about the tested samples.
SamplesLength, mmDiameter, mmPorosity, %Permeability, mDFormationDepth, m
TS154.6125.339.020.385Taiyuan1983.0
TS268.0225.316.400.18Taiyuan2425.7
TS366.7625.323.400.075Taiyuan2456.0
TS420.8225.259.070.115Taiyuan2090.4
TS513.5525.255.30.07Taiyuan2454.9
HS165.6225.368.160.77Shihezi1660.2
HS267.1425.342.250.057Shihezi2519.7
HS360.1725.2813.562.147Shihezi3225.4
HS420.7425.249.70.19Shihezi2449.5
HS519.7825.275.980.787Shihezi2522.0
HS624.9225.269.110.244Shihezi2581.0
HS723.2225.3613.770.158Shihezi3198.2
Table 2. The percent of weight and area of different minerals.
Taiyuan FormationShihezi Formation
MineralsWeight (%)Area (%)Weight (%)Area (%)
Quartz69.9468.7166.4564.66
Anorthoclase12.7312.71.711.69
Plagioclase0.010.0100
Orthoclase1.071.0800
Calcite0.20.195.725.39
Illite11.1610.4415.2814.16
Montmorillonite2.022.220.270.3
Chlorite2.672.1510.027.98
Else0.192.50.555.82
Table 3. Experimental conditions.
Temperature Saturated LiquidSaturated MethodTesting GasGas PressureConfining Pressure
25 °CDistilled waterRolling on a wet clothNitrogen5 MPa7 MPa
Table 4. Experimental conditions.
Temperature Saturated LiquidSaturated MethodTesting GasMinimum Displacing PressureMaximum Displacing PressureConfining Pressure
25 °CDistilled waterRolling on a wet clothNitrogen0.1 MPa/cm3.6 MPa/cm5 MPa/cm