Article

Microalgae Oil Production Using Wastewater in Japan—Introducing Operational Cost Function for Sustainable Management of WWTP

1
Graduate School of Life and Environmental Sciences, University of Tsukuba, Ibaraki 305-8572, Japan
2
Research Center for Chemistry, Indonesian Institute of Sciences, Serpong 15314, Indonesia
3
Faculty of Life and Environmental Sciences, University of Tsukuba, Ibaraki 305-8572, Japan
4
Algae Biomass and Energy System R&D Center, University of Tsukuba, Ibaraki 305-8572, Japan
*
Author to whom correspondence should be addressed.
Energies 2020, 13(20), 5310; https://doi.org/10.3390/en13205310
Submission received: 13 September 2020 / Revised: 9 October 2020 / Accepted: 11 October 2020 / Published: 13 October 2020
(This article belongs to the Section A: Sustainable Energy)

Abstract

:
A comparative evaluation of economic efficiency was performed for native polyculture microalgae oil production in an oxidation ditch (OD) process wastewater treatment plant (WWTP). A cost function was developed for the process. The operational cost per 1 m3 of wastewater (w.w.) was 1.34 $/m3-w.w. in the existing scenario, 1.29 $/m3-w.w. in algal scenario A (no cost for CO2 and waste heat) and 1.36 $/m3-w.w. in algal scenario B (no cost for CO2). The conditions were set as follows: hydraulic retention time (HRT): 4 days, microalgal productivity: 0.148 g/L and daily treatment volume: 81.6 m3-w.w./d. The cost differences were related to the increase in polymer flocculants for algae separation (+0.23 $/m3-w.w), carbon credits from CO2 absorption (−0.01 $/m3-w.w), the sales of biocrude (−0.04 $/m3-w.w) and sludge disposal (−0.18 $/m3-w.w). Hence, the introduction of the algae scenario was the same cost-effective as the existing scenario. Microalgae oil production in an OD process WWTP can serve as a new energy system and reduce the environmental load in a society with a declining population.

Graphical Abstract

1. Introduction

1.1. Microalgae Oil Production and Wastewater Treatment

In recent years, biofuels have attracted attention as a countermeasure against fossil fuel depletion. Microalgae oil production has been the particular focus of research and development. In addition to reducing greenhouse gas (GHG) emissions by fixing carbon dioxide, wastewater can be used as a nutrient without competing with food production [1]. In Japan, the conditions for microalgae cultivation are more challenging than in other equatorial countries due to lower solar radiation and lower water temperature in winter. However, large-scale microalgae oil production demonstration experiments have successfully been conducted in Minamisoma City and Saga City. A previous study has shown that the incorporation of a microalgae oil production system into an existing wastewater treatment plant (WWTP) using flue gas and waste heat can reduce environmental burden [2]. A study conducted by the University of Tsukuba in Minamisoma City Fukushima Prefecture, Japan, assessed the feasibility based on the greenhouse gas emissions (GWP100) of operational emissions without considering the initial capital investment [3]. Reducing the environmental impact of an optimized combination of algae production methods, flue gas, waste heat and so on is a concern for researchers [4].
The total construction depreciation and operating costs of producing biodiesel from microalgae are estimated at 141–159 JPY/L (1.3–1.5 $/L) [5]. The construction and operating costs (considering depreciation period of 20 years) contribute 20% and 80%, respectively, of the total cost. The study assumed that the production facility would be built on the premises of an existing thermal power plant to use waste heat and exhaust gas (CO2) in the Tohoku region of Japan. In Australia, the cost of oil production from microalgae is reported to be 1.5 $/L with high-value feed and fertilizer sold simultaneously as by-products [6]. Under these assumptions, the microalgae oil production system is not regarded as cost-efficient compared to existing fossil fuel systems. Therefore, a cost function is required to predict the cost of microalgae oil production for comparison with the existing scenario. In this regard, it is important to critically review microalgae production methods.

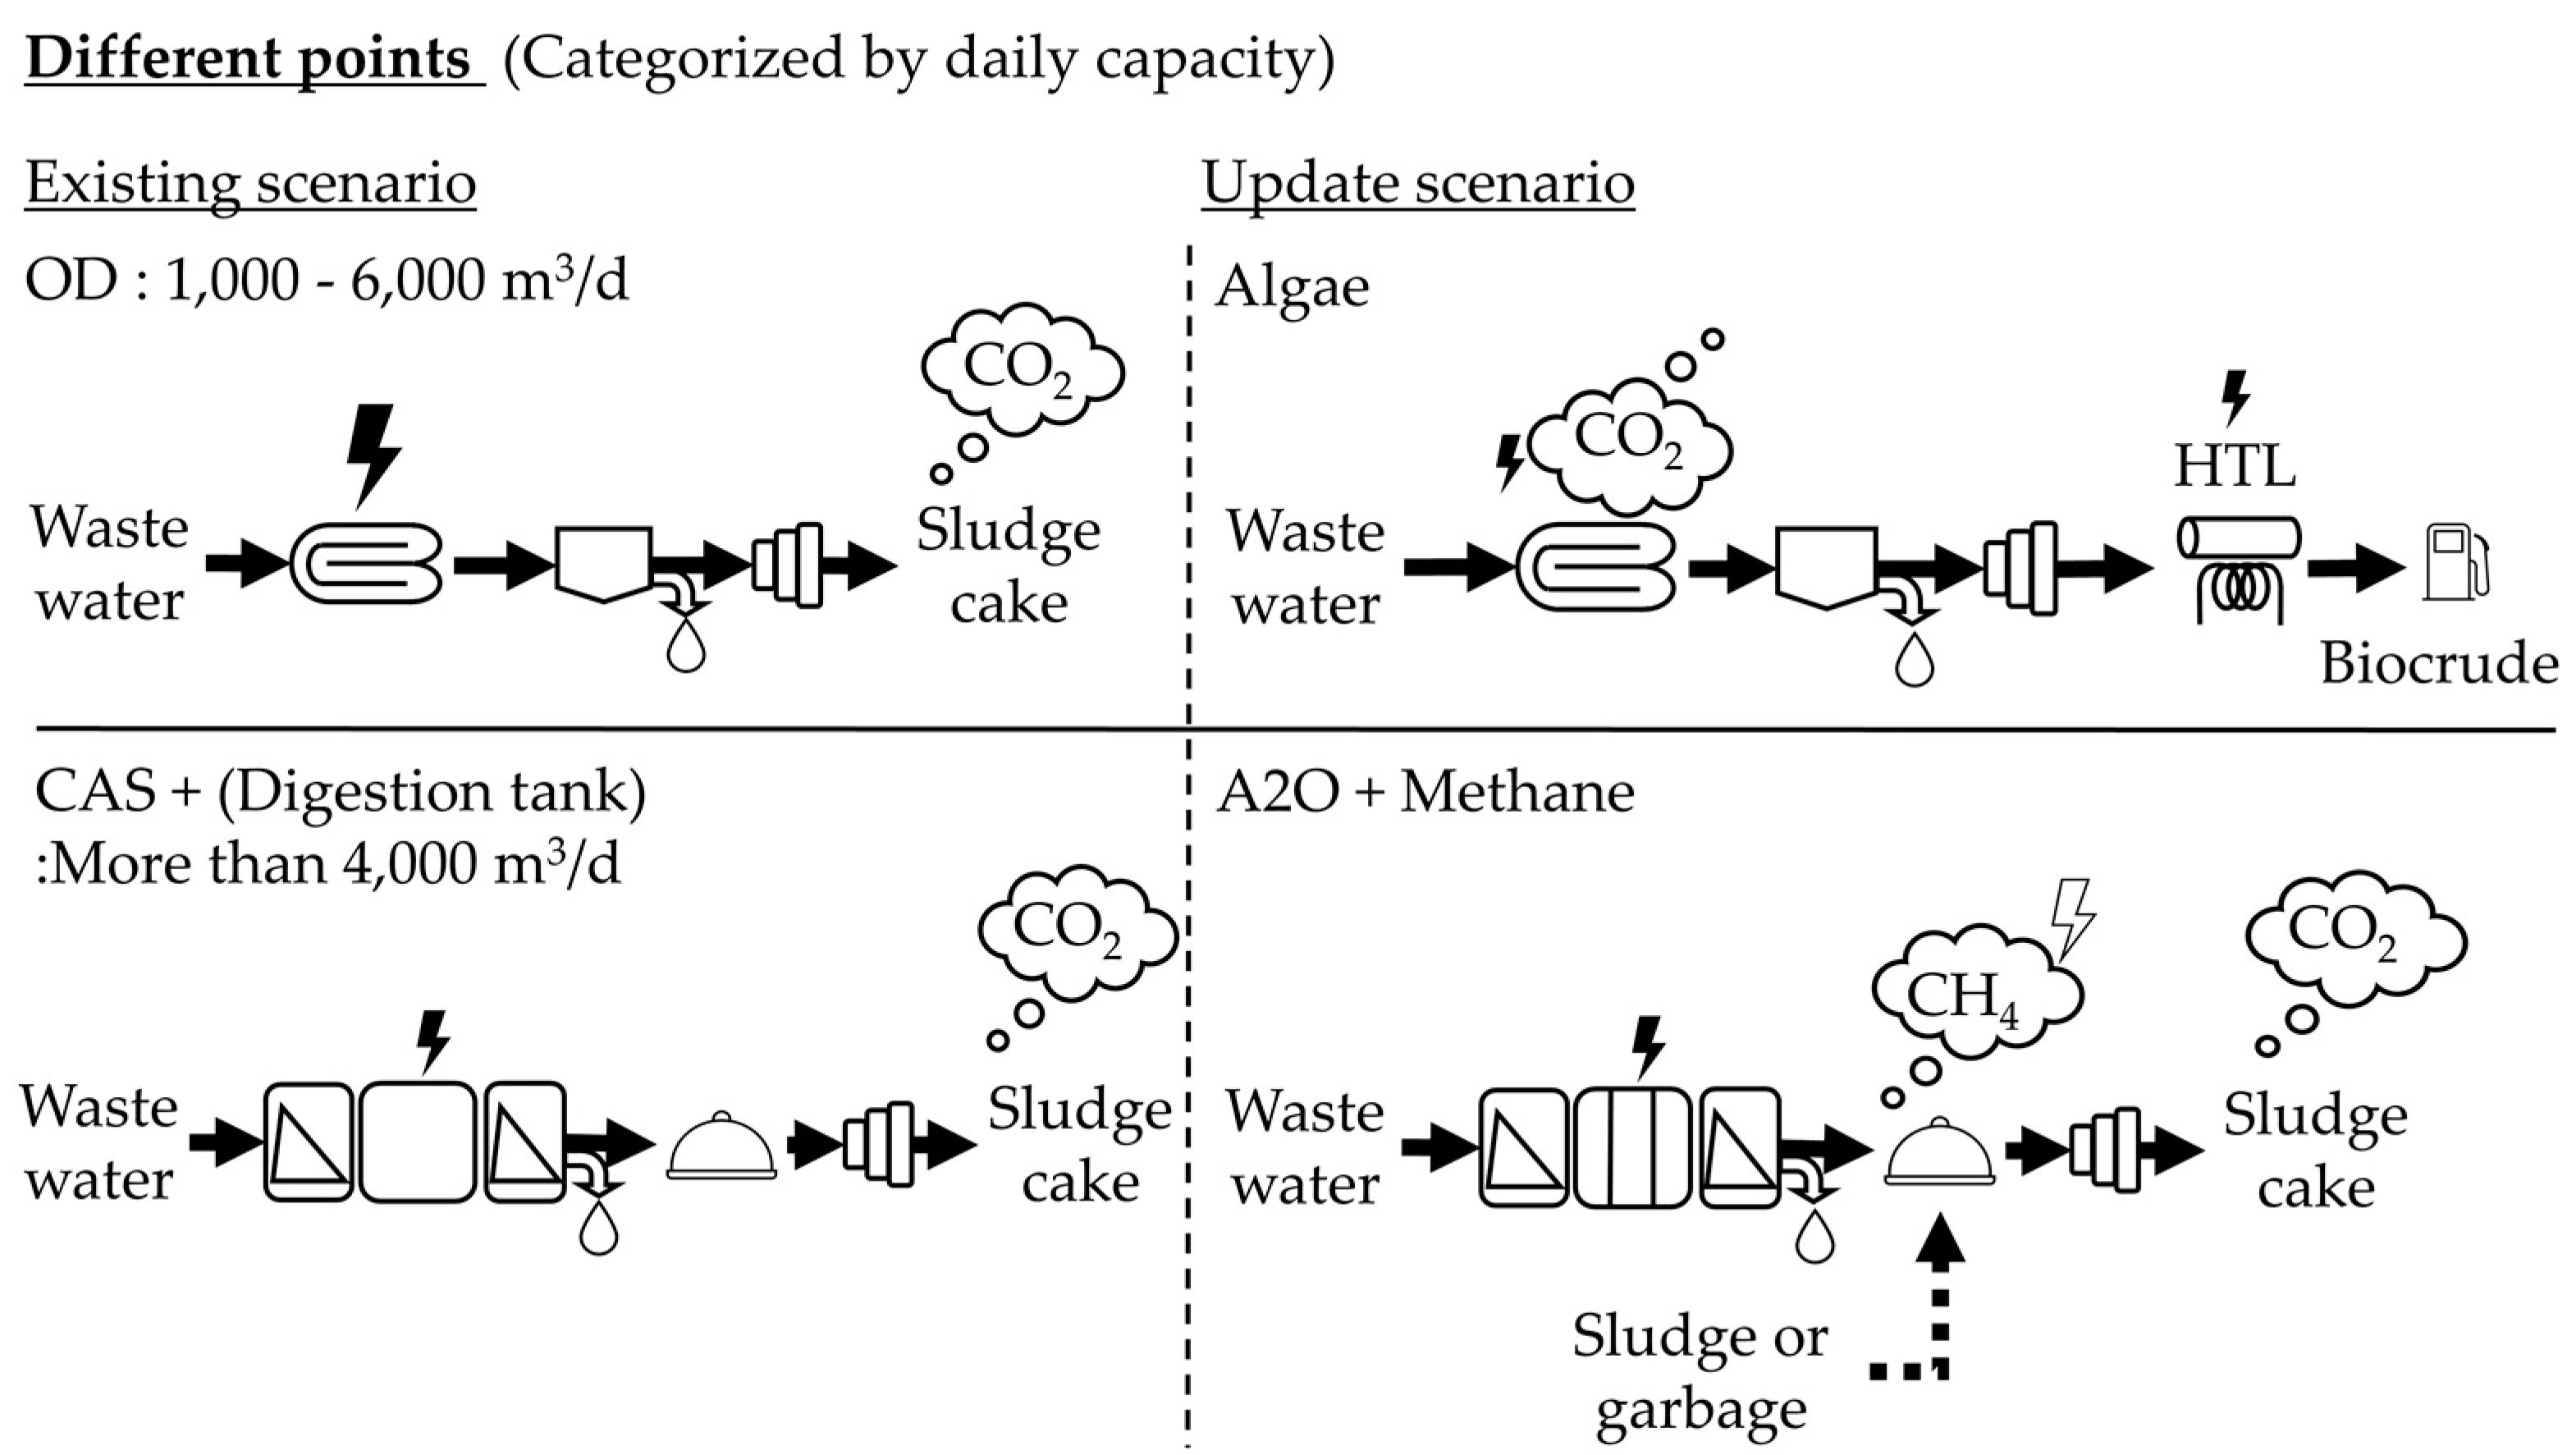
1.2. Microalgae Oil Production and Oxidation Ditch (OD) Process

The oxidation ditch (OD) process is used in approximately half (1038) of the total (2145) public WWTPs in Japan (Figure 1). Most small-scale WWTPs of capacities below 5,000 m3/d have adopted the OD process, whereas the standard activated sludge process (conventional activated sludge: CAS) is the mainstream process for relatively large-scale WWTPs of 10,000 m3/d or more. Although the land requirement per 1 m3 of wastewater is larger for the OD process, this process is preferred in small-scale WWTPs, as the plant is easier to maintain and manage. The treatment land requirement for the reaction tank in the OD process is more than 8 times larger than that of the CAS. As a result, it is difficult to prepare enough land for the OD method in urban areas. The depth of the OD reaction tank (2.5 m) is half that of the CAS (5 m). The hydraulic retention time (HRT) for the OD process is 24–48 h, which is four times longer than the HRT of 6–8 h for the CAS. On the other hand, the OD process does not require fine control of the flow rate and has low sludge generation owing to the long reaction time. Therefore, the OD process has an advantage in rural areas where land for WWTPs is more readily available.
In Japan, the rate of population decline in rural areas is larger than that in urban areas and the rate of reduction of treatment volume in the OD process WWTP is greater than that of CAS. With the introduction of the algae system, the environmental burden can be reduced and existing WWTPs can serve as new energy plants in communities with declining populations. In countries where the rate of construction of WWTPs is slower than in Japan, such as in neighboring China and Korea, the OD process is less widely used, often because of the adoption of newer technologies, such as the Anaerobic-Anoxic Oxic (A2O) process. The OD method has also been adopted in Australia [8].
The construction of WWTPs in Japan increased from around 1960 and reached its peak around 2000. Now, Japan is in a period of renewal and renovation. Recently, the focus has been on the introduction of advanced treatment methods, such as phosphorus recovery and energy recovery and the need to respond to a declining population [9]. As such, in large-scale CAS plants, the water treatment system is being upgraded to the A2O system and the digestion tank of the sludge treatment system is being replaced with methane anaerobic fermentation and use for power generation (Figure 2).
For methane fermentation, many large WWTPs using the CAS process have already installed digestion tanks for volume reduction. However, a sizable daily treatment volume is required to support the power generation facilities and ensure cost-effectiveness. Therefore, the city of Yokohama in Japan has been conducting methane fermentation of sludge from a five-CAS WWTP at one location. At other facilities, methane fermentation is performed by adding 0.1 t of food waste to 1 t of dehydrated sludge in order to increase the ratio of organic matter [10] but it is difficult to integrate food waste into other treatment plants and if the scale is small, the benefits of energy recovery through methane fermentation may not be realized [11].
The introduction of methane fermentation technology is rare in the OC process due to the associated small scale. On the other hand, the introduction of microalgae oil production seems to be suitable for the OD process [2] owing to the long HRT and open-air reaction tank. The addition of microalgae oil production is expected to reduce aeration energy, allow for CO2 absorption by microalgae, reduce the processing energy by reducing the volume of dehydrated sludge and allow for the recycling of biomass by producing biocrude.

1.3. Purpose of This Study

The purpose of this study is to assess the potential of optimizing environmental and economic benefits by combining microalgae oil production with OD process WWTP through the effective utilization of exhaust gas (CO2) and waste heat. This study is based on the results of a demonstration experiment in Minamisoma and the results differ from that of previous studies [12] in that we assess the practical applications. In this study, to explore the feasibility of microalgae oil production, the economic advantages of microalgae cultivation in combination with existing wastewater treatment facilities were examined. The cost function was developed based on the results from a large-scale experimental facility in Minamisoma [3], which was compared with the operating cost function of the OD process WWTP. If this operating cost is comparable or reduced compared to an existing OD process WWTP, the potential for microalgae oil production is considered suitable for combination with the OD process WWTP.

2. Methodology

First, the selection of a suitable WWTP for microalgae oil production is described in Section 2.1. Then, the scenario for the introduction of microalgae in the selected WWTP is described in Section 2.2. Finally, a comparison with the existing system is described in Section 2.3.

2.1. Suitability Detection of OD Process WWTP for Microalgal Oil Production (Suitability)

The selection of a suitable WWTP for microalgal oil production is one of the key factors in the biofuel industry. Each WWTP has specific scale, usage rate, treatment method, temperature and equipment characteristics. The first step of selection was based on the treatment process. As mentioned previously, there are mainly two types of wastewater treatment processes in Japan: first, the CAS process, which is adopted in relatively large treatment plants and second, the OD process, which is adopted in medium to small treatment plants. To effectively utilize and cultivate microalgae without major renovation of existing WWTPs, microalgae must be irradiated with sunlight to allow for photosynthesis. In the OD process, the treatment tanks are exposed to the open air and are thus suitable for this purpose.
Since microalgae productivity is lower in cold climates [13], in this study, the target location of the WWTP has an annual mean temperature equal to or higher than that of the experimental data collection site (Minamisoma City: 12.3 °C). Furthermore, it is desirable to obtain exhaust gas for cultivation and waste heat for hydrothermal liquefaction (HTL) from the neighborhood. However, the siting of the WWTP and the siting of the exhaust gas and heat recovery facilities vary widely depending on the demographics of each area and the sociological and historical background of municipal mergers, making it difficult to generalize. Therefore, the case studies were conducted on specific facilities and the cost function can be adapted to various WWTP sizes and locations.
In Japan, a decline in the treatment population between 2010 and 2040 will affect 92% (110/119 plants) of WWTPs [9]. The treatment capacity ratio of the facilities based on the daily average treatment volume tends to increase. Therefore, it is expected that the number of OD process WWTPs with microalgae oil production will increase in the future.

2.1.1. Suitability of Environmental Conditions for Microalgae Oil Production Based on the Lid and Location (Suitability)

The selection of a WWTP using the OD process was narrowed down using the following conditions (Figure 3). First, a public WWTP was selected in the Tochigi Prefecture [14], which was the first Prefecture to introduce the OD method in Japan and where the proportion of OD treatment plants is high (23 of 38 plants). However, some OD method WWTPs close to residential areas may be covered by lids for odor control. Although a transparent lid can be used to allow for light transmission and air circulation for CO2 absorption, the absence of a lid is more advantageous for improving the productivity of microalgae in polyculture cultivation. In addition, the calculation was based on no lid being present. Therefore, nine WWTPs with no lids were selected for the study. The average annual temperature of the nine WWTP locations was confirmed to be 12 °C or higher. The polyculture cultivation species used in this study were indigenous algae (main algae species—Desmodesmus sp., Dictyosphaerium sp., Klebsormidium sp., Micractinium sp. and Scenedesmus sp. [15]) that were used in the demonstration experiments in Minamisoma.

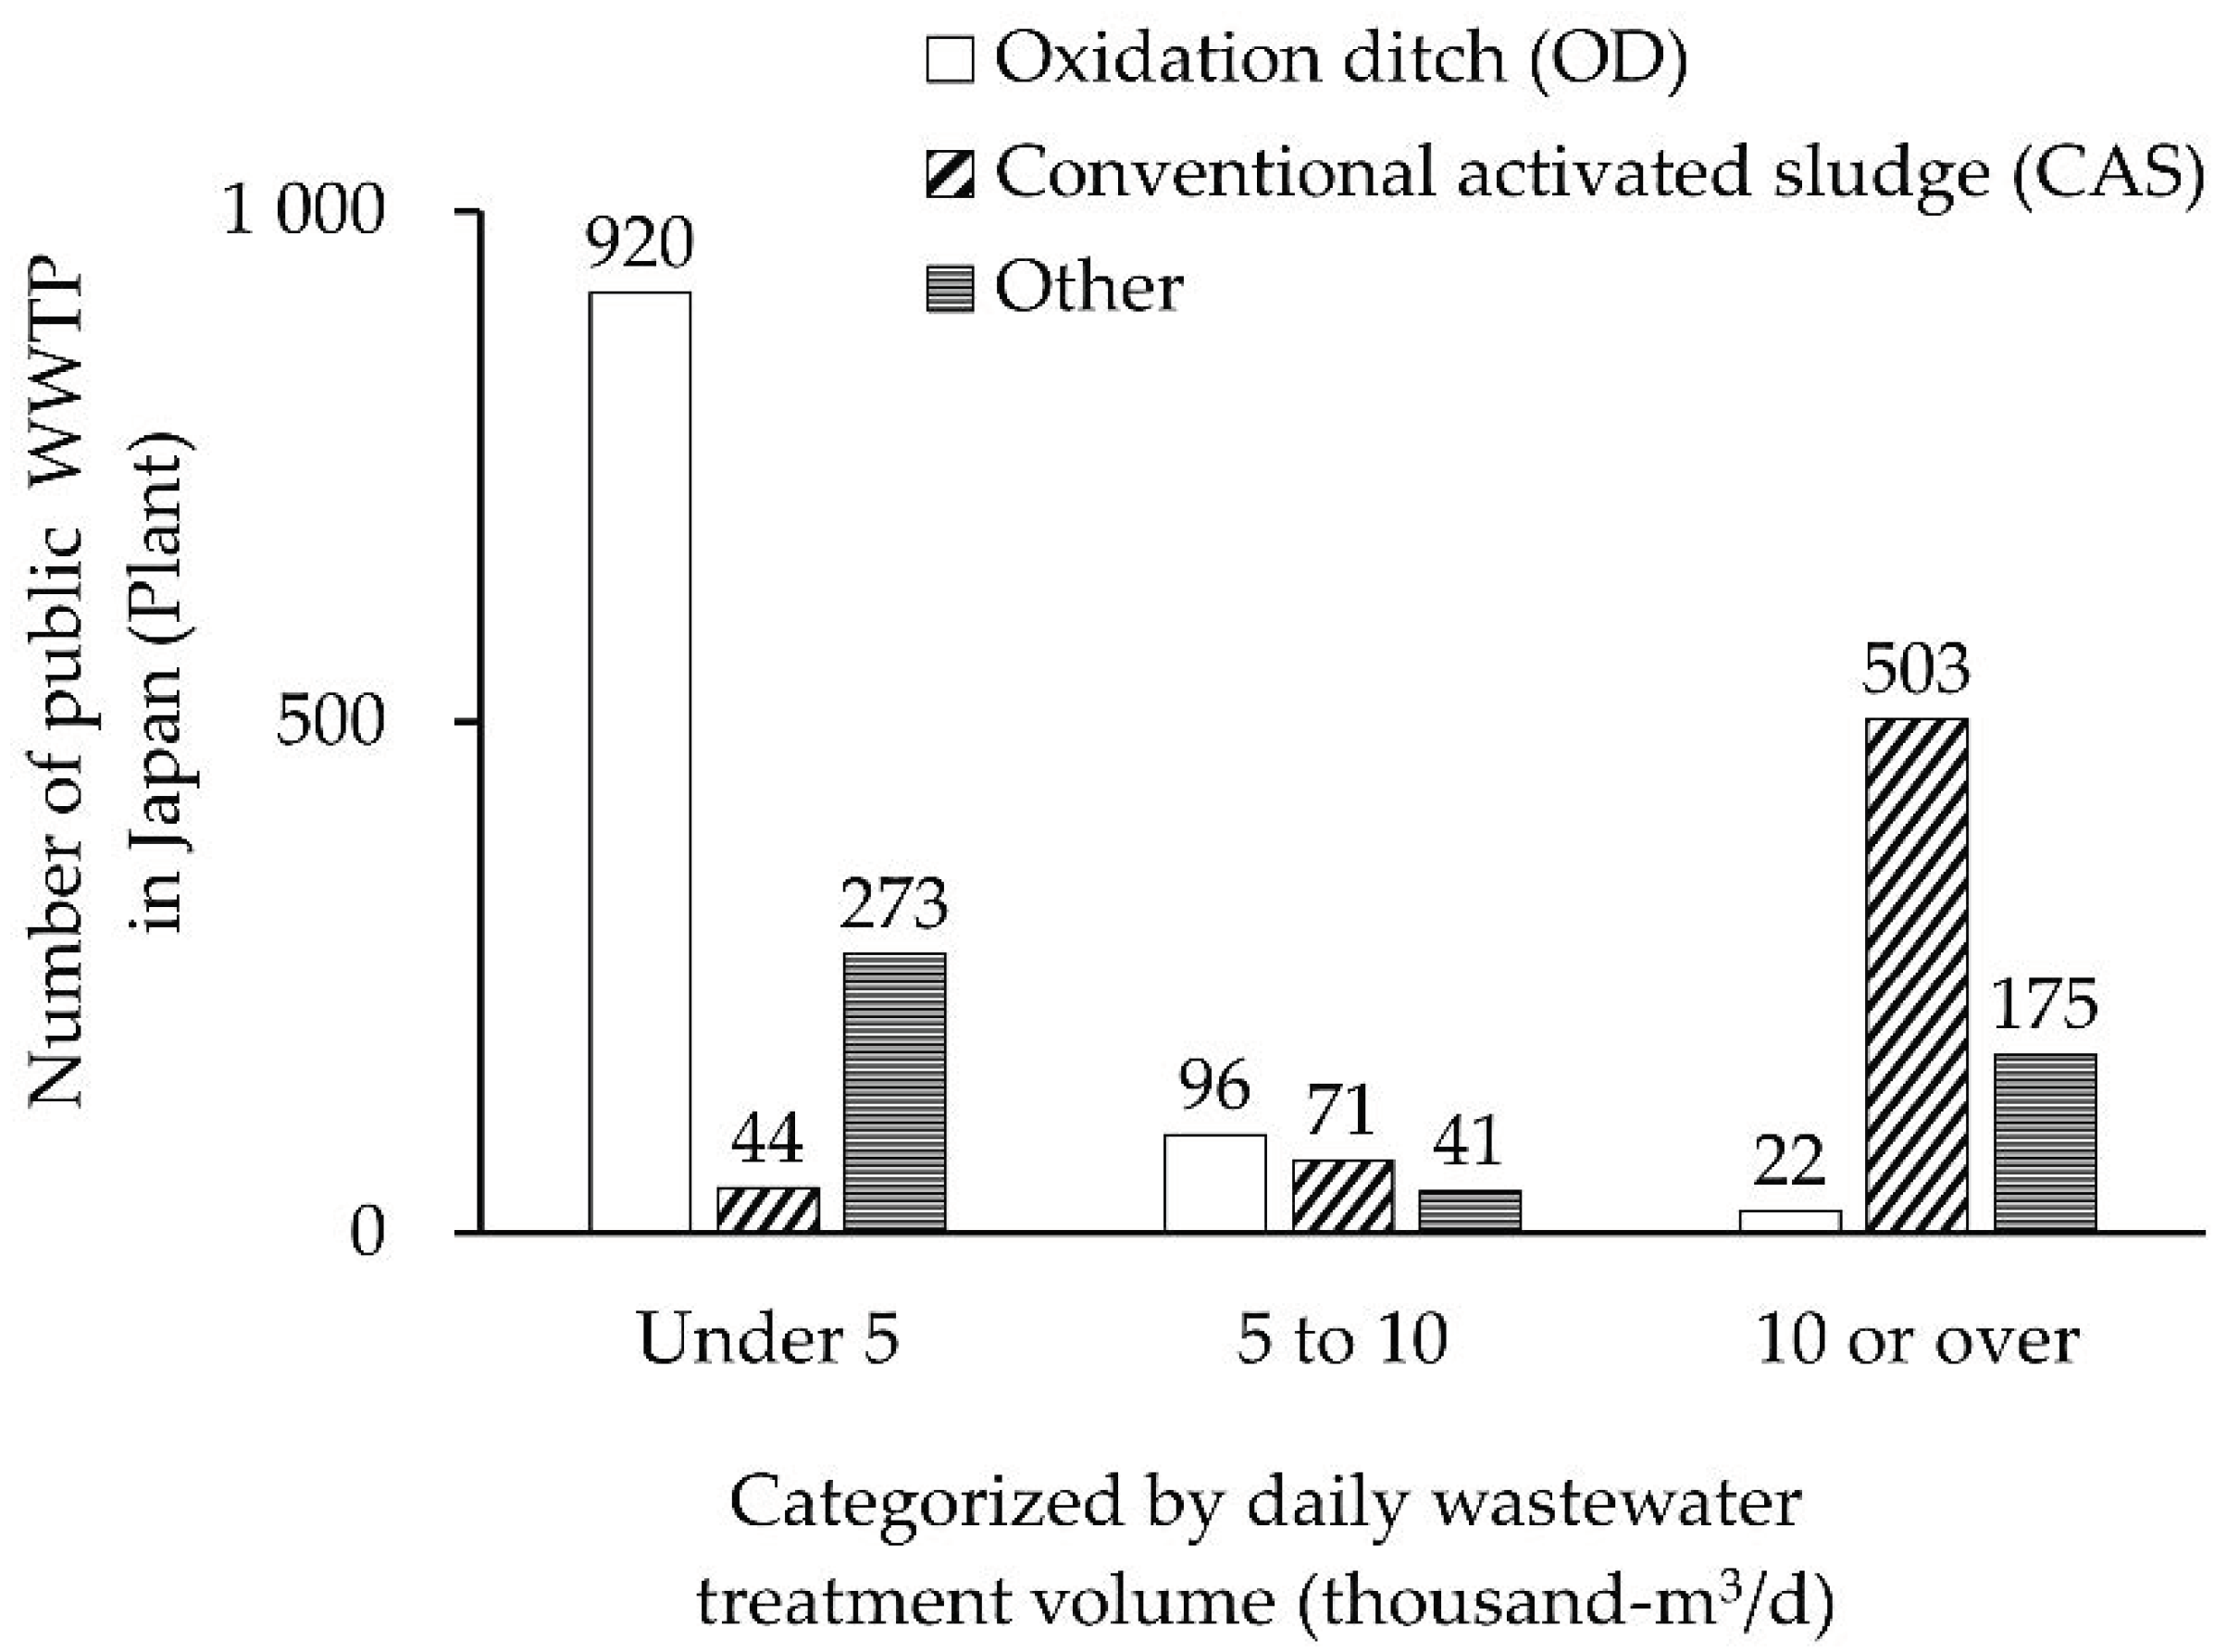
2.1.2. Suitability of Facility Utilization Rates Based on Current Capacity and Average Daily Throughput (Suitability)

For microalgae cultivation, it is necessary to change the depth of water in the reaction tank to approximately 0.8 m, which is shallower than the depth of the existing OD process (2.0–2.5. m). Moreover, the HRT of the existing OD process must be increased from an average of 2.5 days to ~4.0 days. In other words, to achieve a facility utilization rate of at least less than 50%, the total volume of the reaction tank should be increased by a factor of about 4.5, that is, by decreasing the water depth by 3 times and increasing the number of days 1.5 times. Therefore, the average daily wastewater treatment volume and the existing treatment capacity were compared in nine uncovered OD process WWTPs (Figure 4).
The OD process can be adapted to an increase in the number of sewage connections through increasing the number of treatment tanks in parallel in a step-by-step manner based on the treatment volume, with a treatment capacity of 1000 to 1500 m3/d. The treatment plants with greater available capacity with a smaller treatment volume will have more leeway. As a result, the treatment WWTPs were narrowed down to five plants which have more than 50% available capacity (6 Motegi-machi 23%, 5 Awano 33%, 1 Nishizawa 41%, 2 Minami Nasuno 44% and 3 Niida 51%).

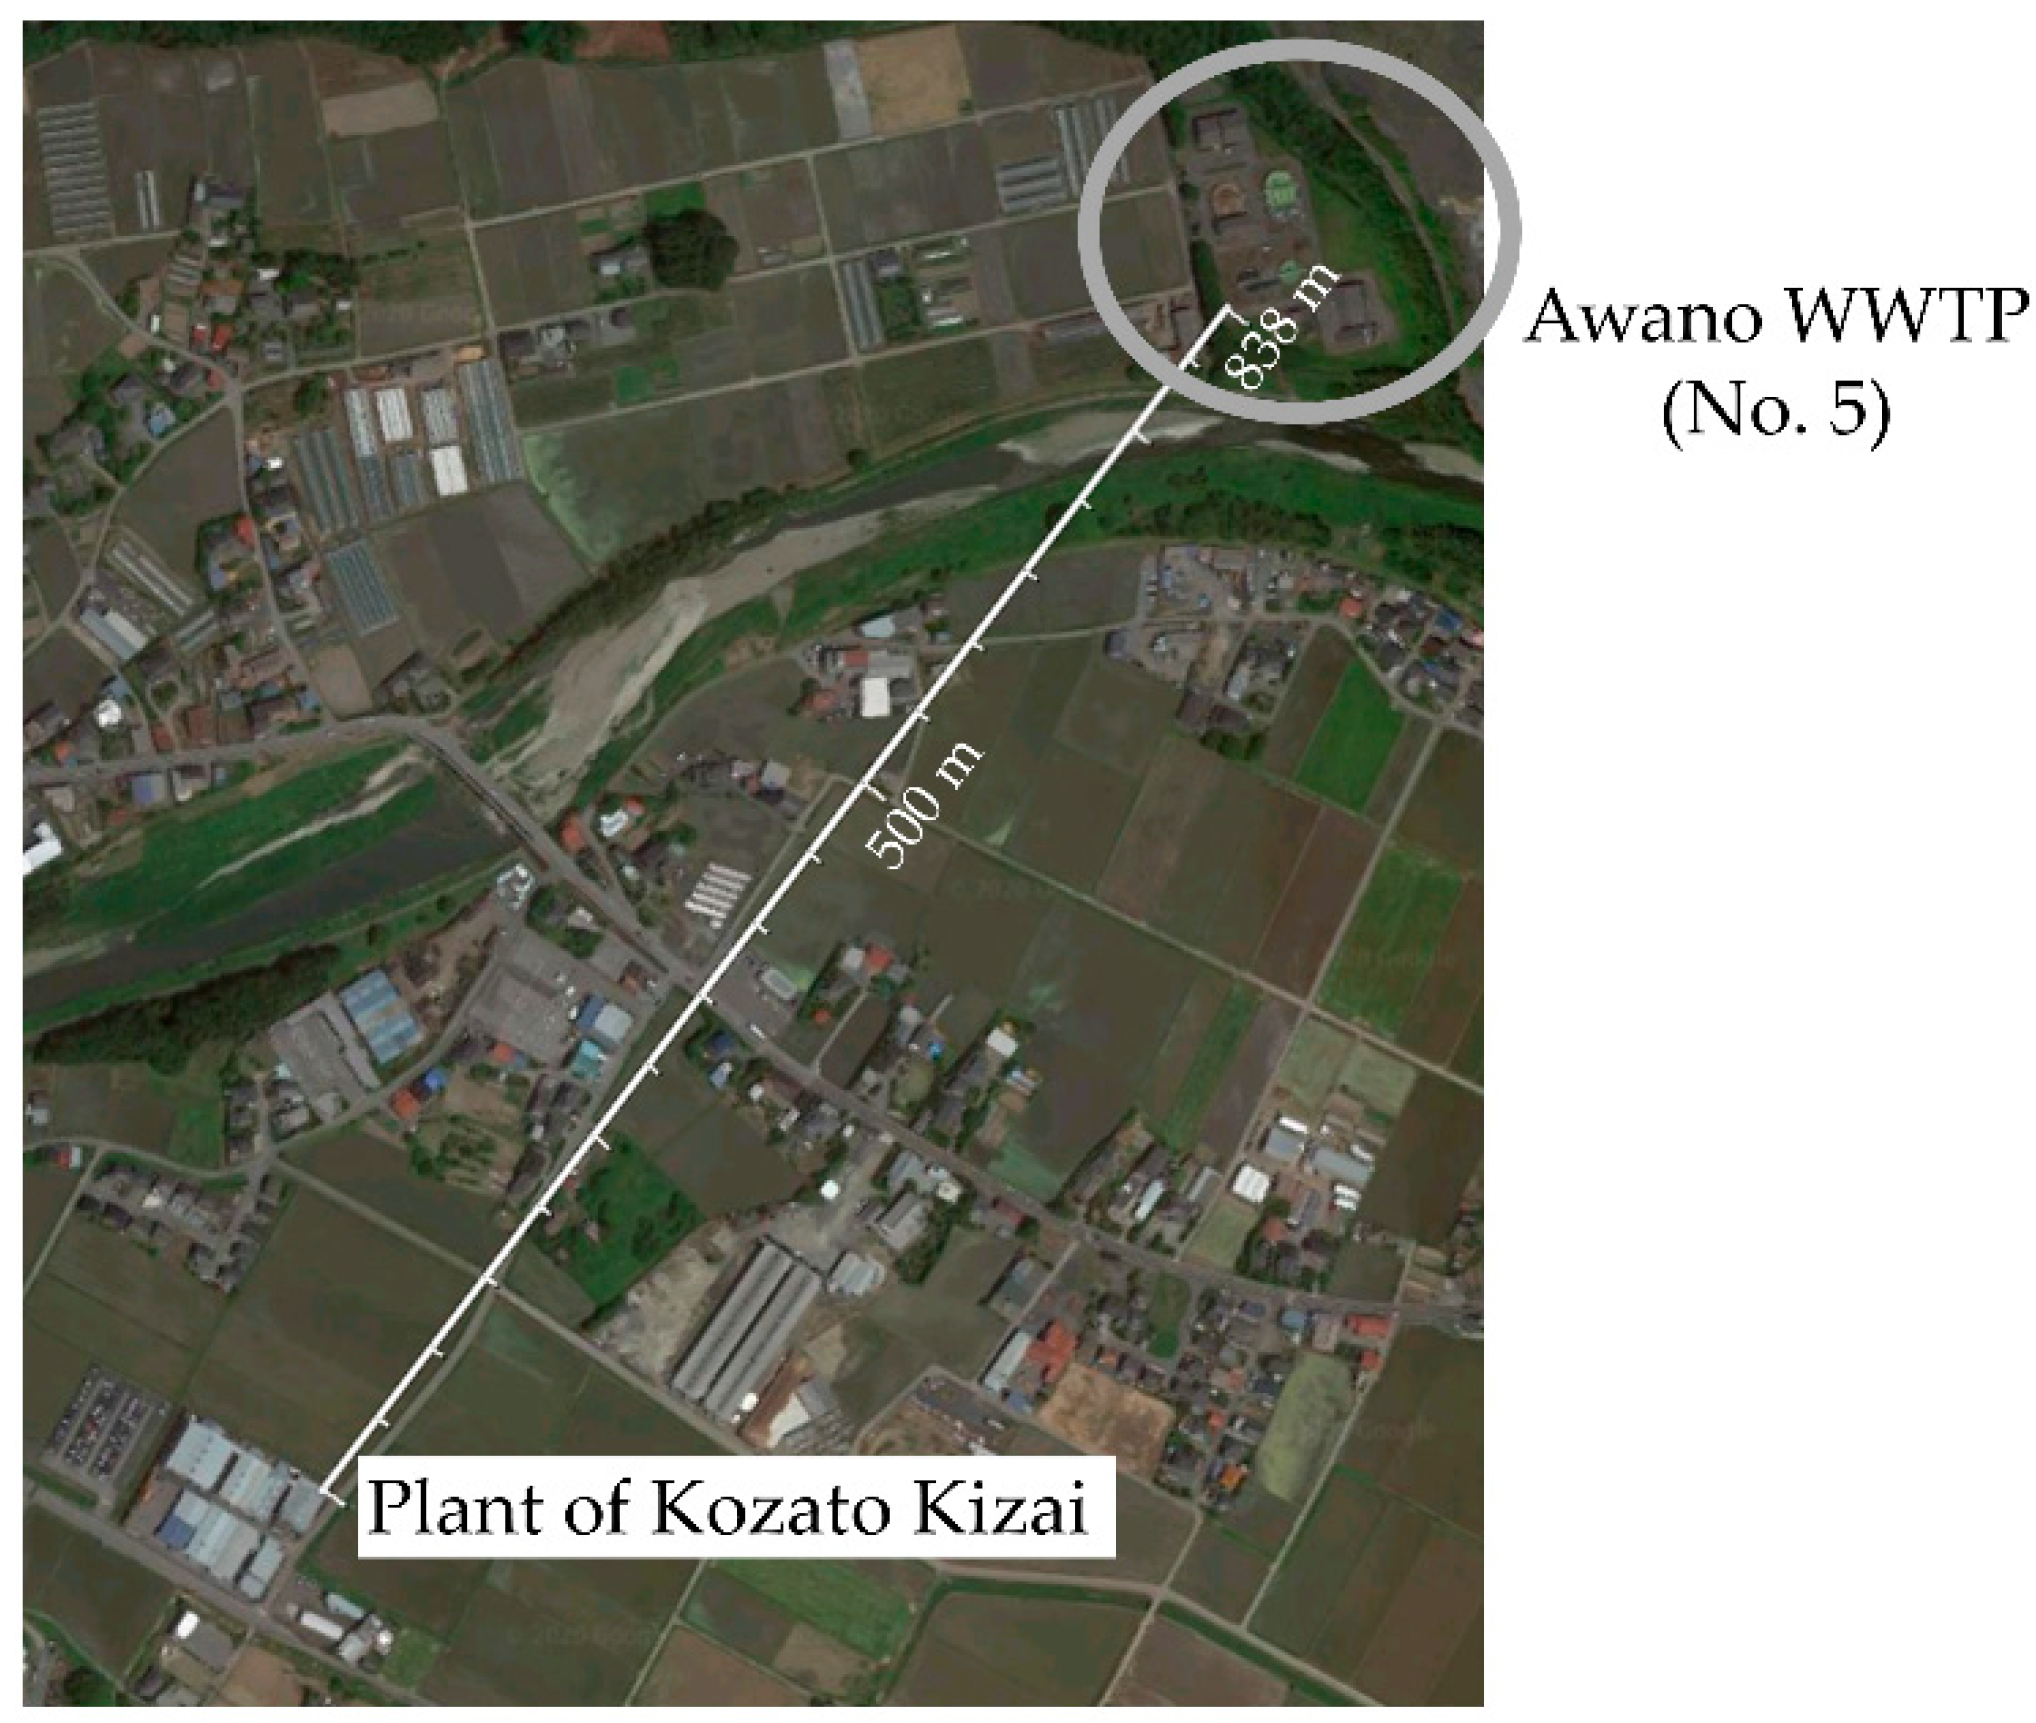
2.1.3. Availability of Exhaust Heat and Discharged CO2 Associated with the Geography of the WWTP (Suitability)

Next, we confirmed the location of facilities that produce exhaust heat and discharge CO2 in the vicinity of the five selected WWTPs (Table 1). The Kanuma City Clean Center, a potential source of waste heat, is located ~6 km in a straight-line distance from Awano WWTP (No. 5) and Nishizawa WWTP (No. 1).
There are two methods of utilizing the discharged heat. One involves supplying it through a pipeline and the other involves installing the plant on-site. A previous study on district heat supply in Hokkaido [16] showed that about 50% of the heat is lost through the heat supply pipes in a survey of heat supply to various facilities within about 400 m. In this study, the distance is approximately 6 km, which is considered too great to supply heat by pipeline. Therefore, it was assumed that dehydrated microalgae would be delivered to the on-site treatment plant at the Kanuma City Clean Center (waste incinerator). The Awano WWTP was selected as one of the two WWTPs for the study, as its facility utilization rates are low and it has a sludge dewatering facility.
Exhaust gas (CO2) would be obtained from neighboring plants. In general, WWTP using the OD process are located amidst conditions similar to that of manufacturing plants in suburban areas with a moderate population. Therefore, the possibility of obtaining exhaust CO2 gas from a neighboring manufacturing plant is high. The Kozato Kizai Co. Ltd. Awano plant, which manufactures rubber-seals for condensers, is located 838 m from the Awano WWTP (Figure A1).

2.2. Scenarios for the Introduction of Microalgal Oil Production (Existing and Algal Scenario)

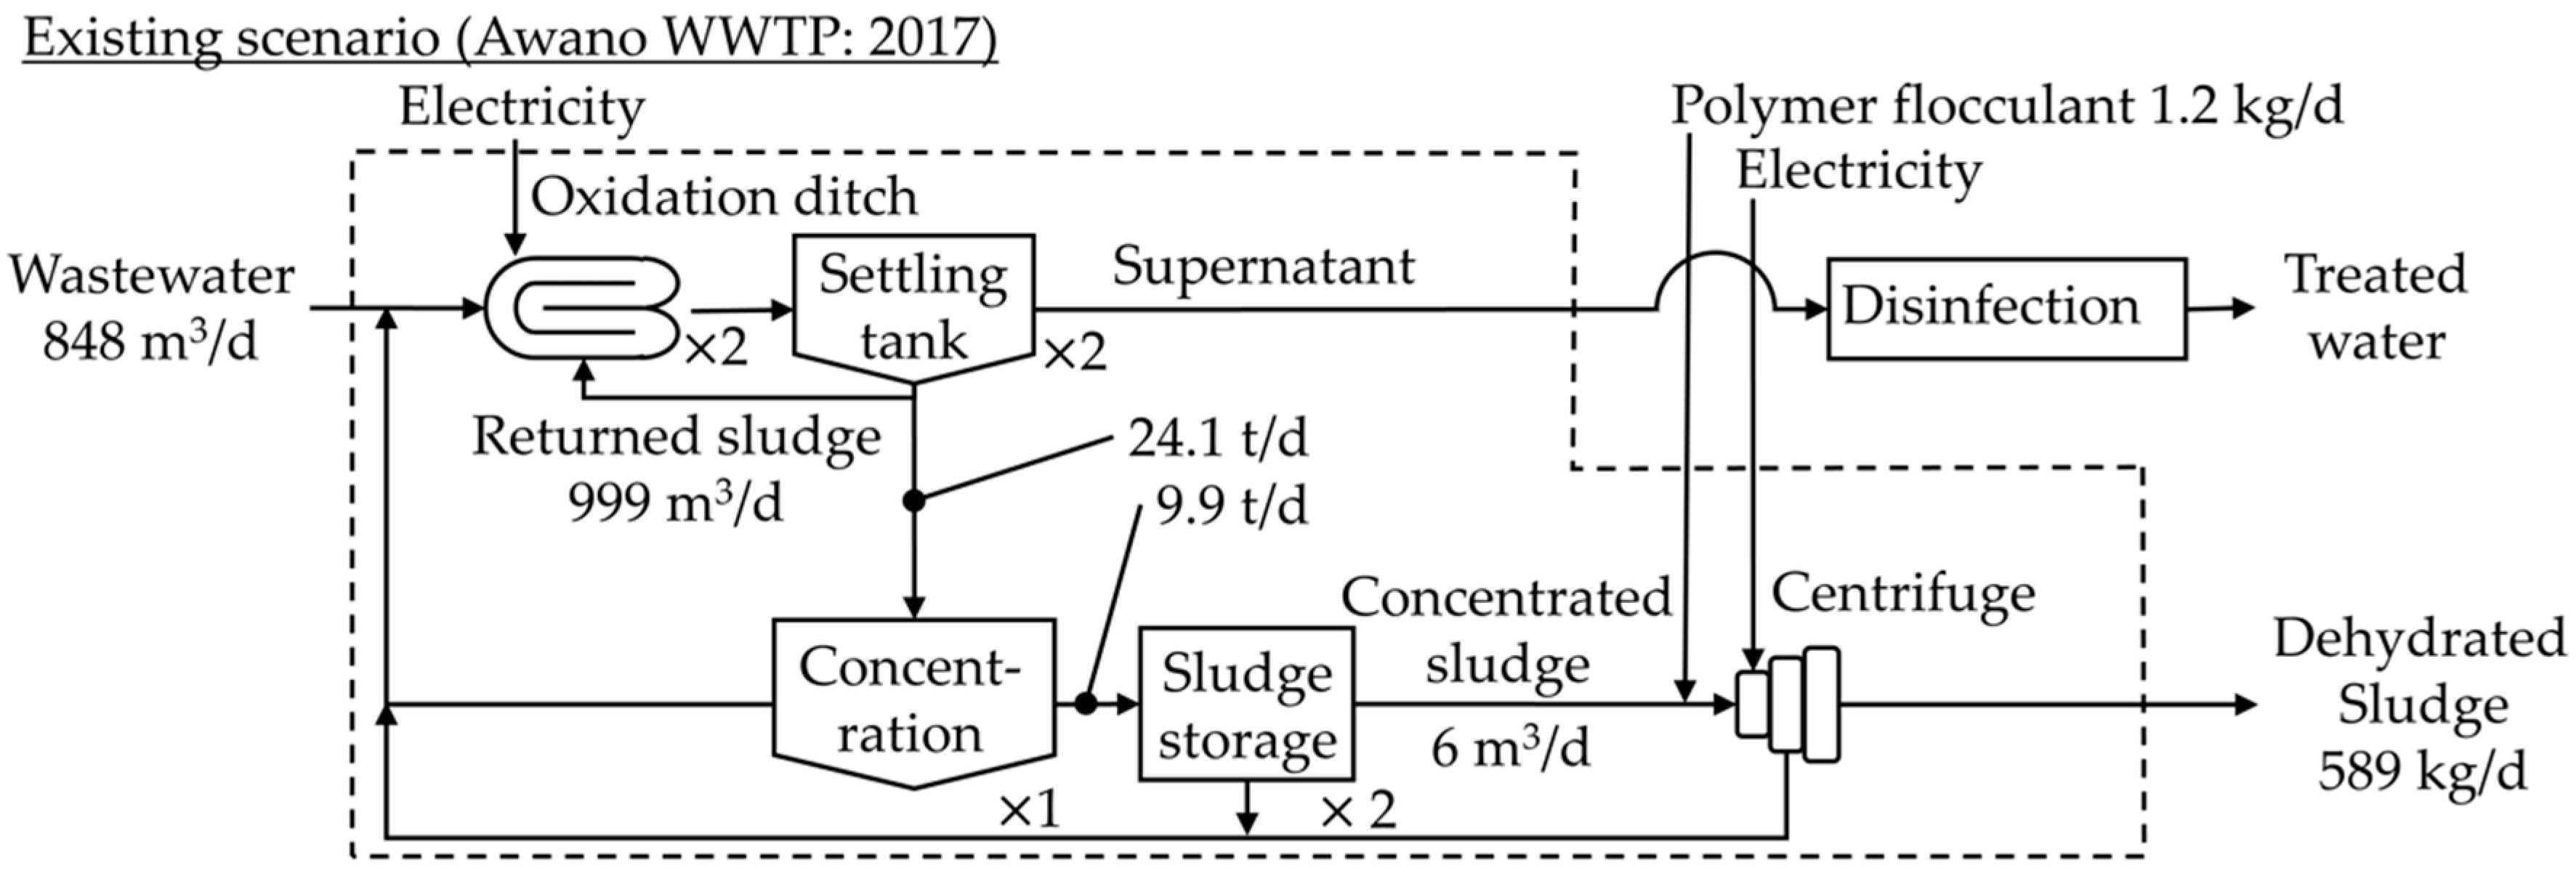
2.2.1. Existing Scenario of Awano WWTP (Existing Scenario)

The Awano WWTP, which was selected as a model case, received 848 m3/d of treated water per day and performs digestion under aerobic conditions by aeration and denitrification under anaerobic conditions without aeration in an OD tank under HRT of 1.2 days (Figure 5). The sludge is separated from the supernatant in the sedimentation tank and advances to the sludge sedimentation tank and sludge storage tank, where a polymer coagulant is added and the sludge is separated into the dehydrated sludge and the separating liquid in the centrifuge. The accumulated dehydrated sludge is entrusted to the private sector for treatment [7]. The total cost for the fiscal year was divided over 365 days and converted to the cost per volume treated per day, so there were some inconsistencies.

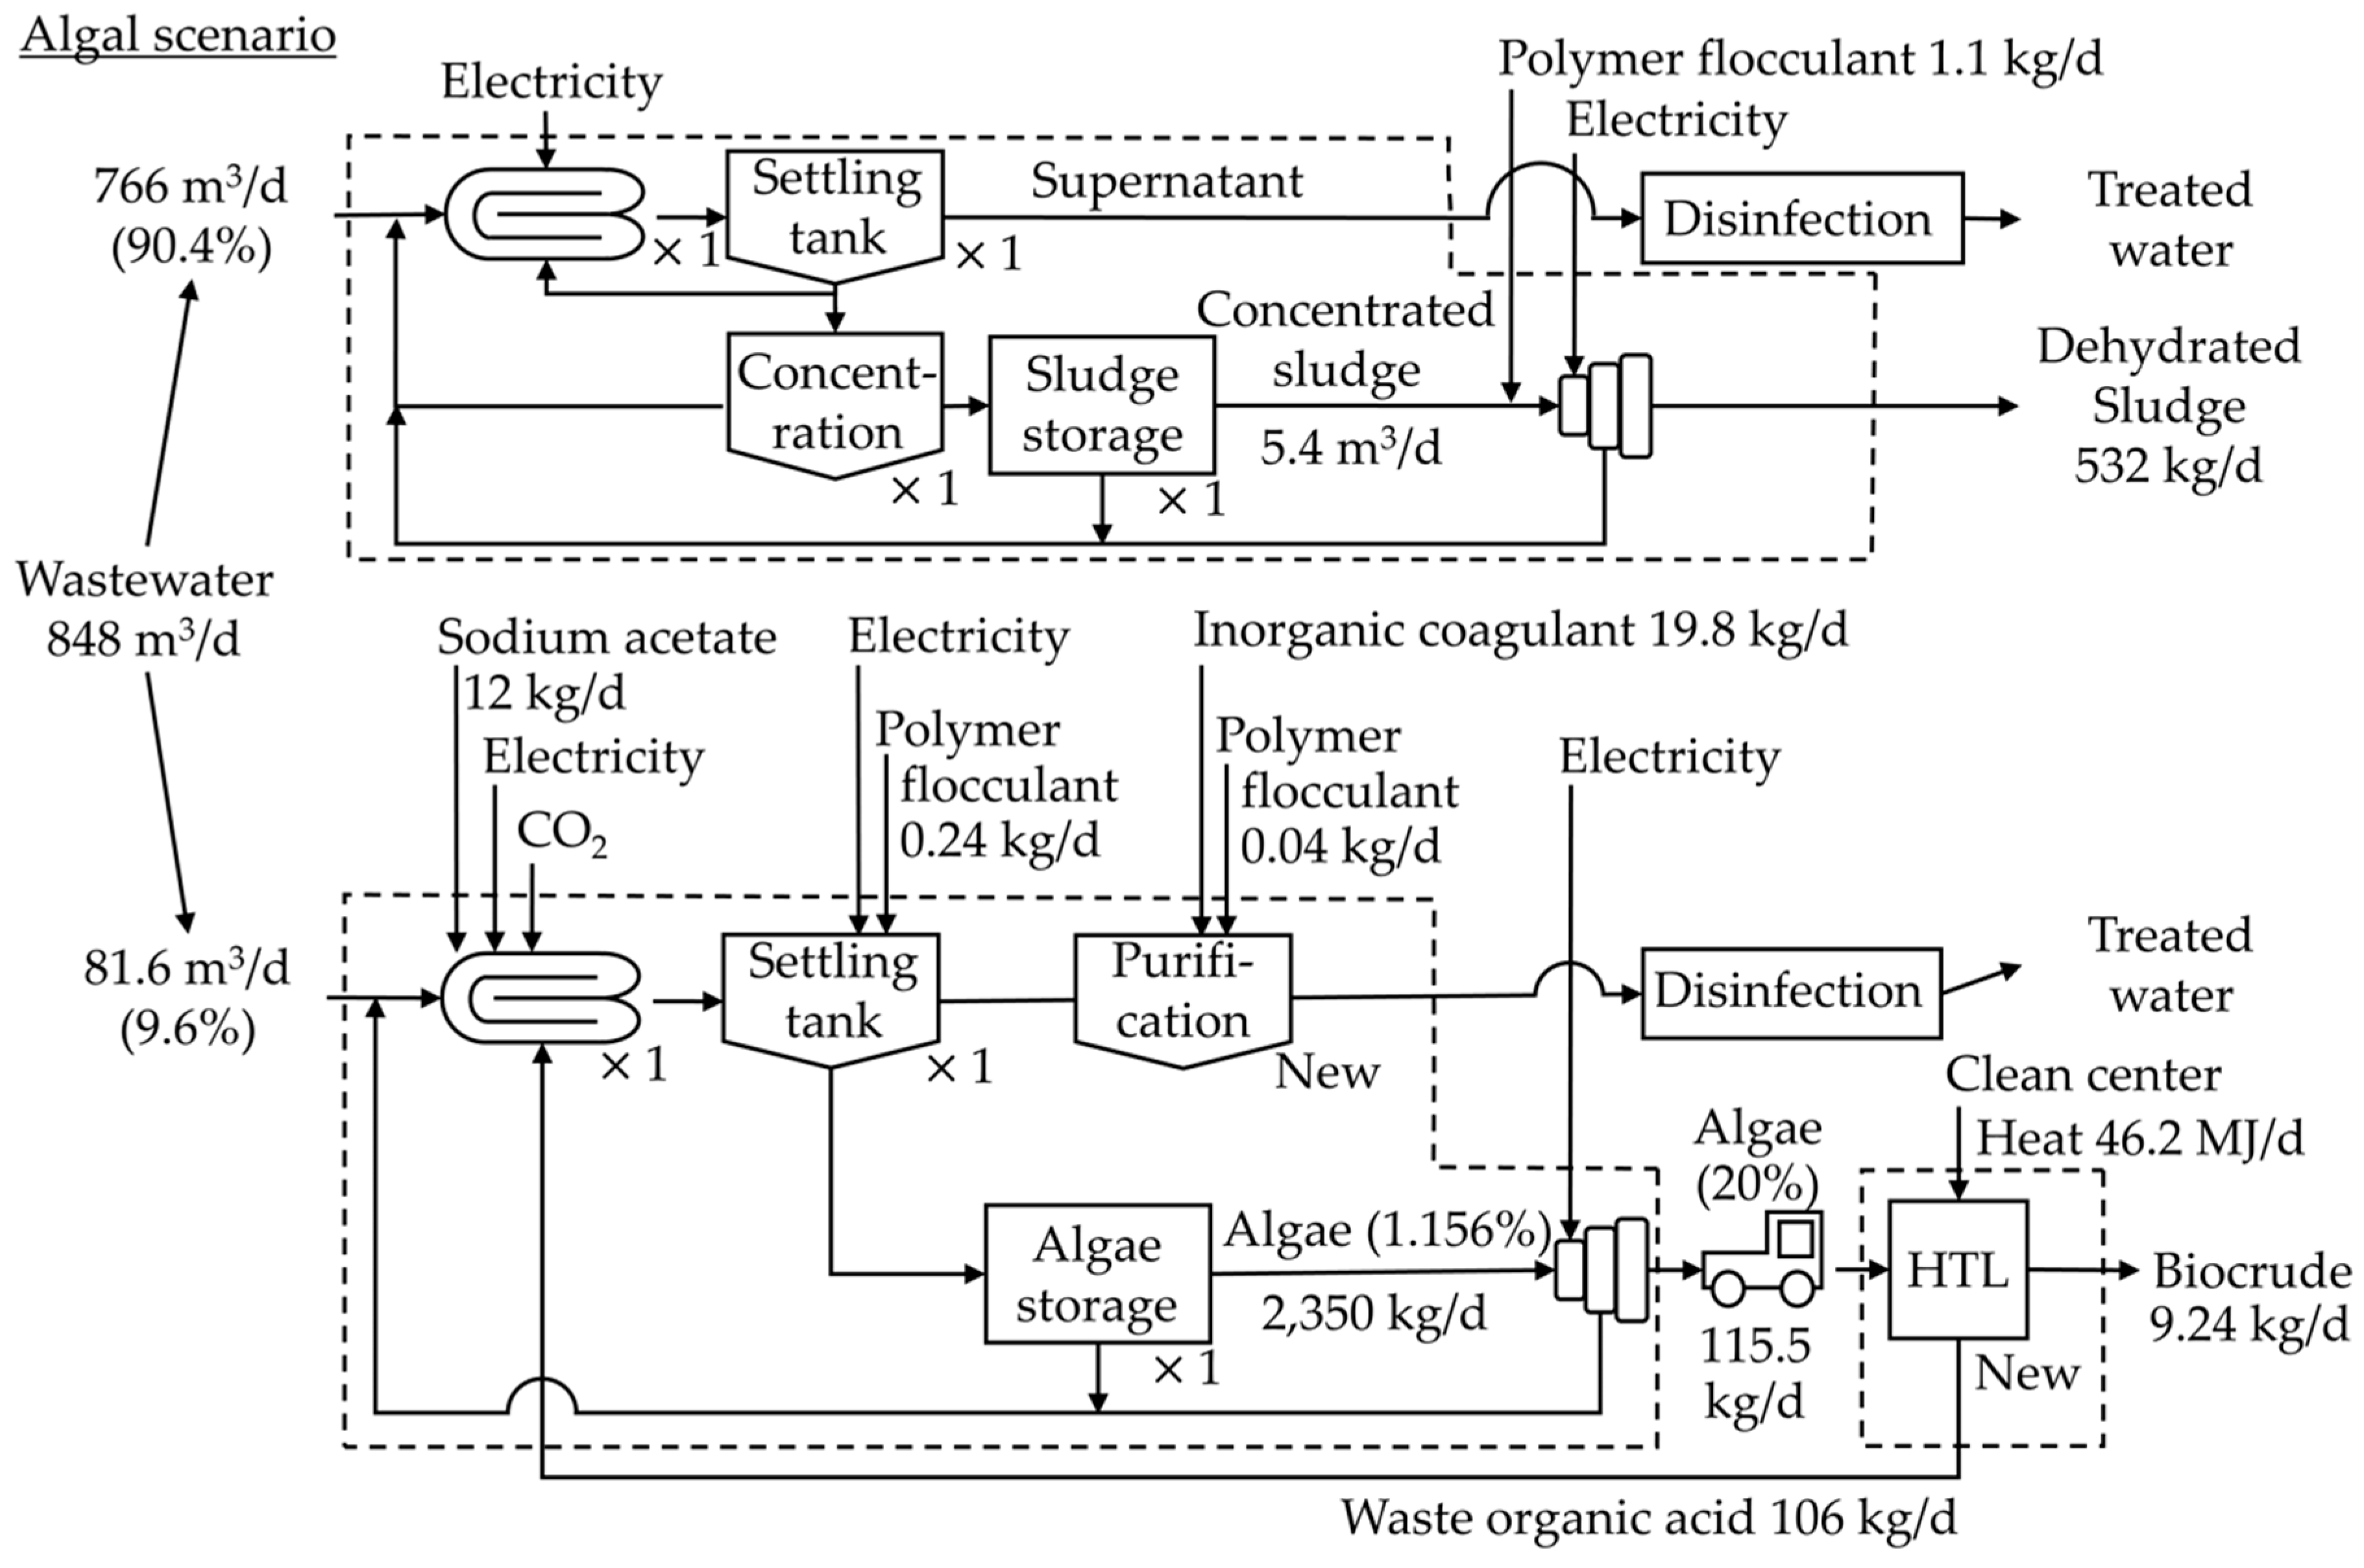
2.2.2. Introduction of Microalgae Oil Production Process at Awano WWTP (Algal Scenario)

Next, a scenario is shown in which a microalgae oil production system is partially installed in the Awano WWTP (Figure 6). Because photosynthesis is essential for microalgae production, the water depth needs to be reduced to allow for sunlight transmission. Water depth, HRT and algal biomass productivity are closely related to each other and further optimization research is in progress. Although it has been shown that microalgae can be cultured up to a depth of 5 m, we adopted a water depth of 0.8 m, HRT of 4 days and biomass concentration at harvest of 0.148 g/L (Table 2) based on the results of the field study in Minamisoma, Japan.

2.2.3. Treatment Volume of the Algal Scenario Introduced in Awano WWTP (Algal Scenario)

In the algal scenario, the water depth is reduced from 2.5 m to 0.8 m and the HRT is increased from 1.2 to 4.0 days, compared to the existing OD process. Therefore, if the entire volume currently being treated (848 m3/d) is diverted to the algal system, the capacity of the treatment plant will be insufficient. Therefore, it was decided that one of the two OD tanks will be used for the algal system and the untreated portion was to be treated using the conventional method. The algal system can treat 81.6 m3/d (ratio of inflow: 9.6%). Even if two tanks were converted to the algal system, only 163 m3/d (19.2%) could be treated. However, if microalgae cultivation is possible at a water depth of 5 m, which is currently under investigation at the University of Tsukuba, the capacity of the cultivation tank is approximately six times greater than the assumed water depth of this study (0.8 m) and so the two tanks will be able to treat 979 m3/d (115%) of sewage and all the treated water can be treated using the algal system.
In this study, the labor cost in the Clean Center was not considered because it is the same as the existing cost (Table 3). Since the HTL process is a heat-only reaction and does not use hazardous chemicals, automatic plant operation technology can be applied to the HTL process. In the future, automatic operation of the plant can be made possible by adding an HTL monitoring system to a part of the waste treatment monitoring system. In addition, the cost of transporting the algal and waste organic acid from the Awano WWTP to the Clean Center is minor compared to the maintenance fee, which is about 1% [5], so it was not included in this study.

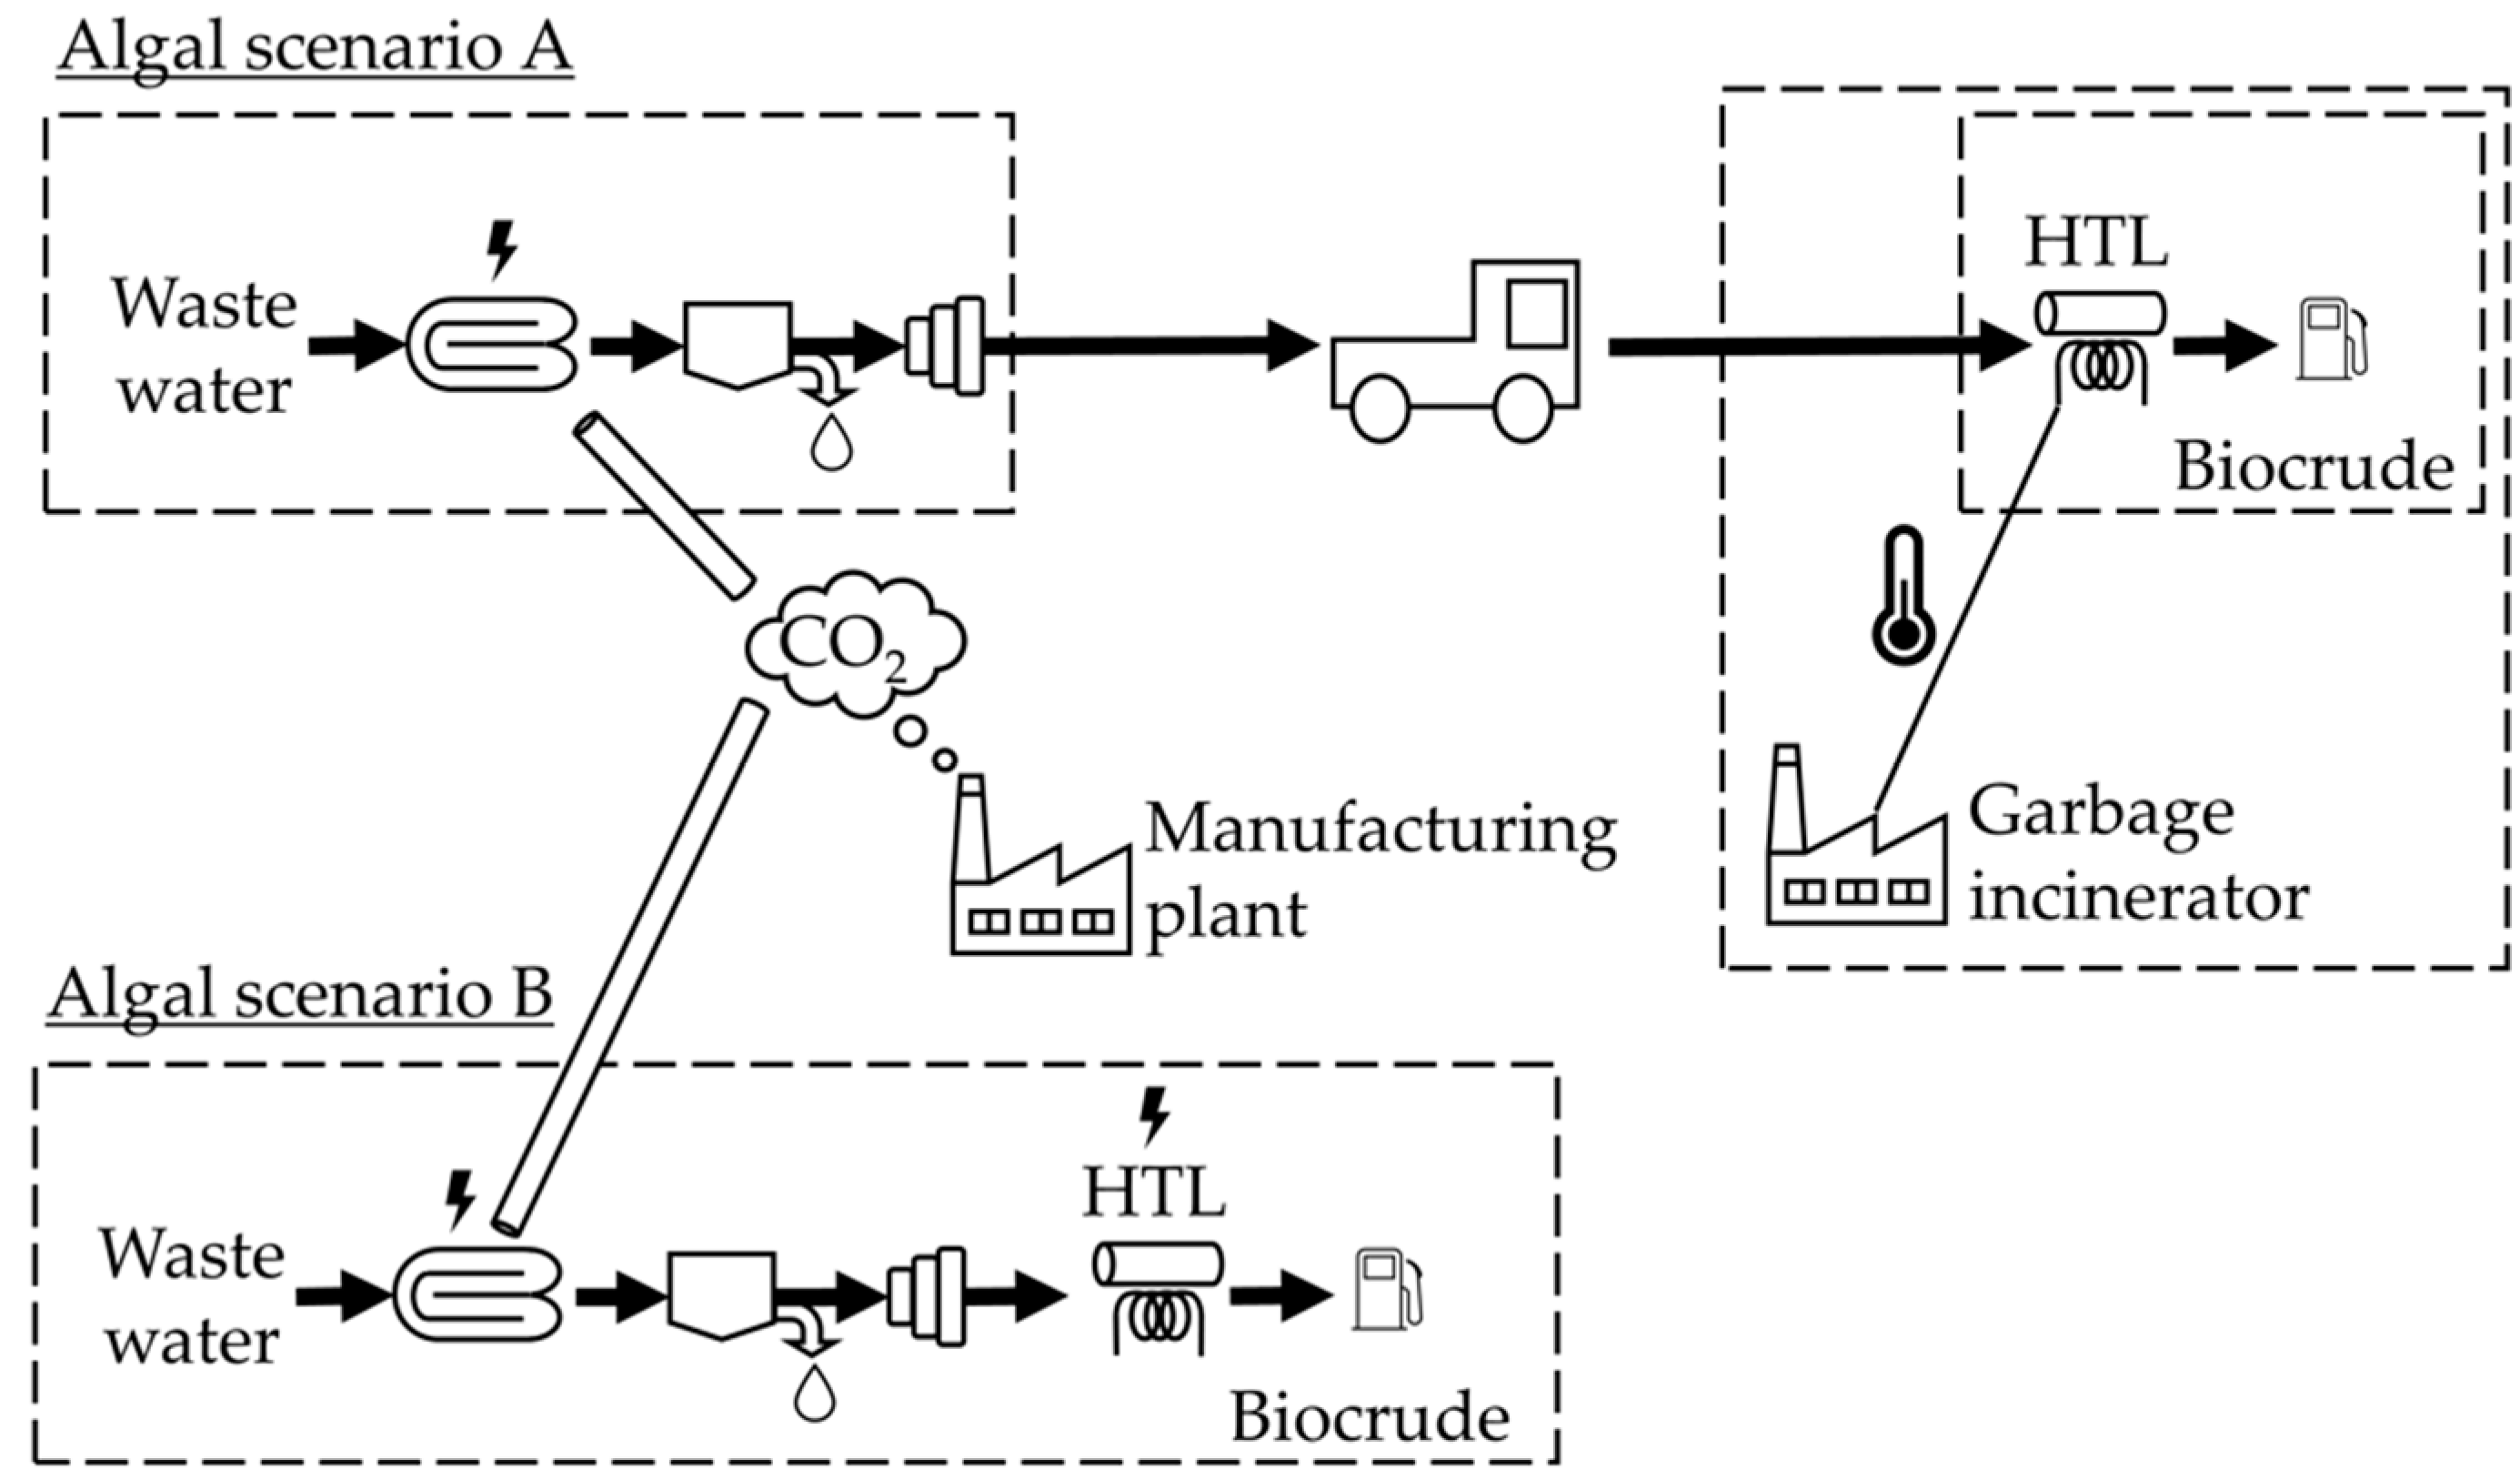
2.2.4. Algal Scenarios A and B (Algal Scenario)

Algal scenarios A and B were established to compare the differences in cost associated with the proximity of neighboring facilities (Figure 7). In algal scenario A, a 20% suspension of dehydrated algae is transported for HTL at a garbage incinerator. The HTL is performed using waste heat from garbage incineration. In algal scenario B, the HTL is undertaken in a WWTP using an electric heater. As expected, scenario A had better performance in terms of cost and environmental impact. However, in some cases, there were challenges in the transport of the algae or the use of garbage incinerators.

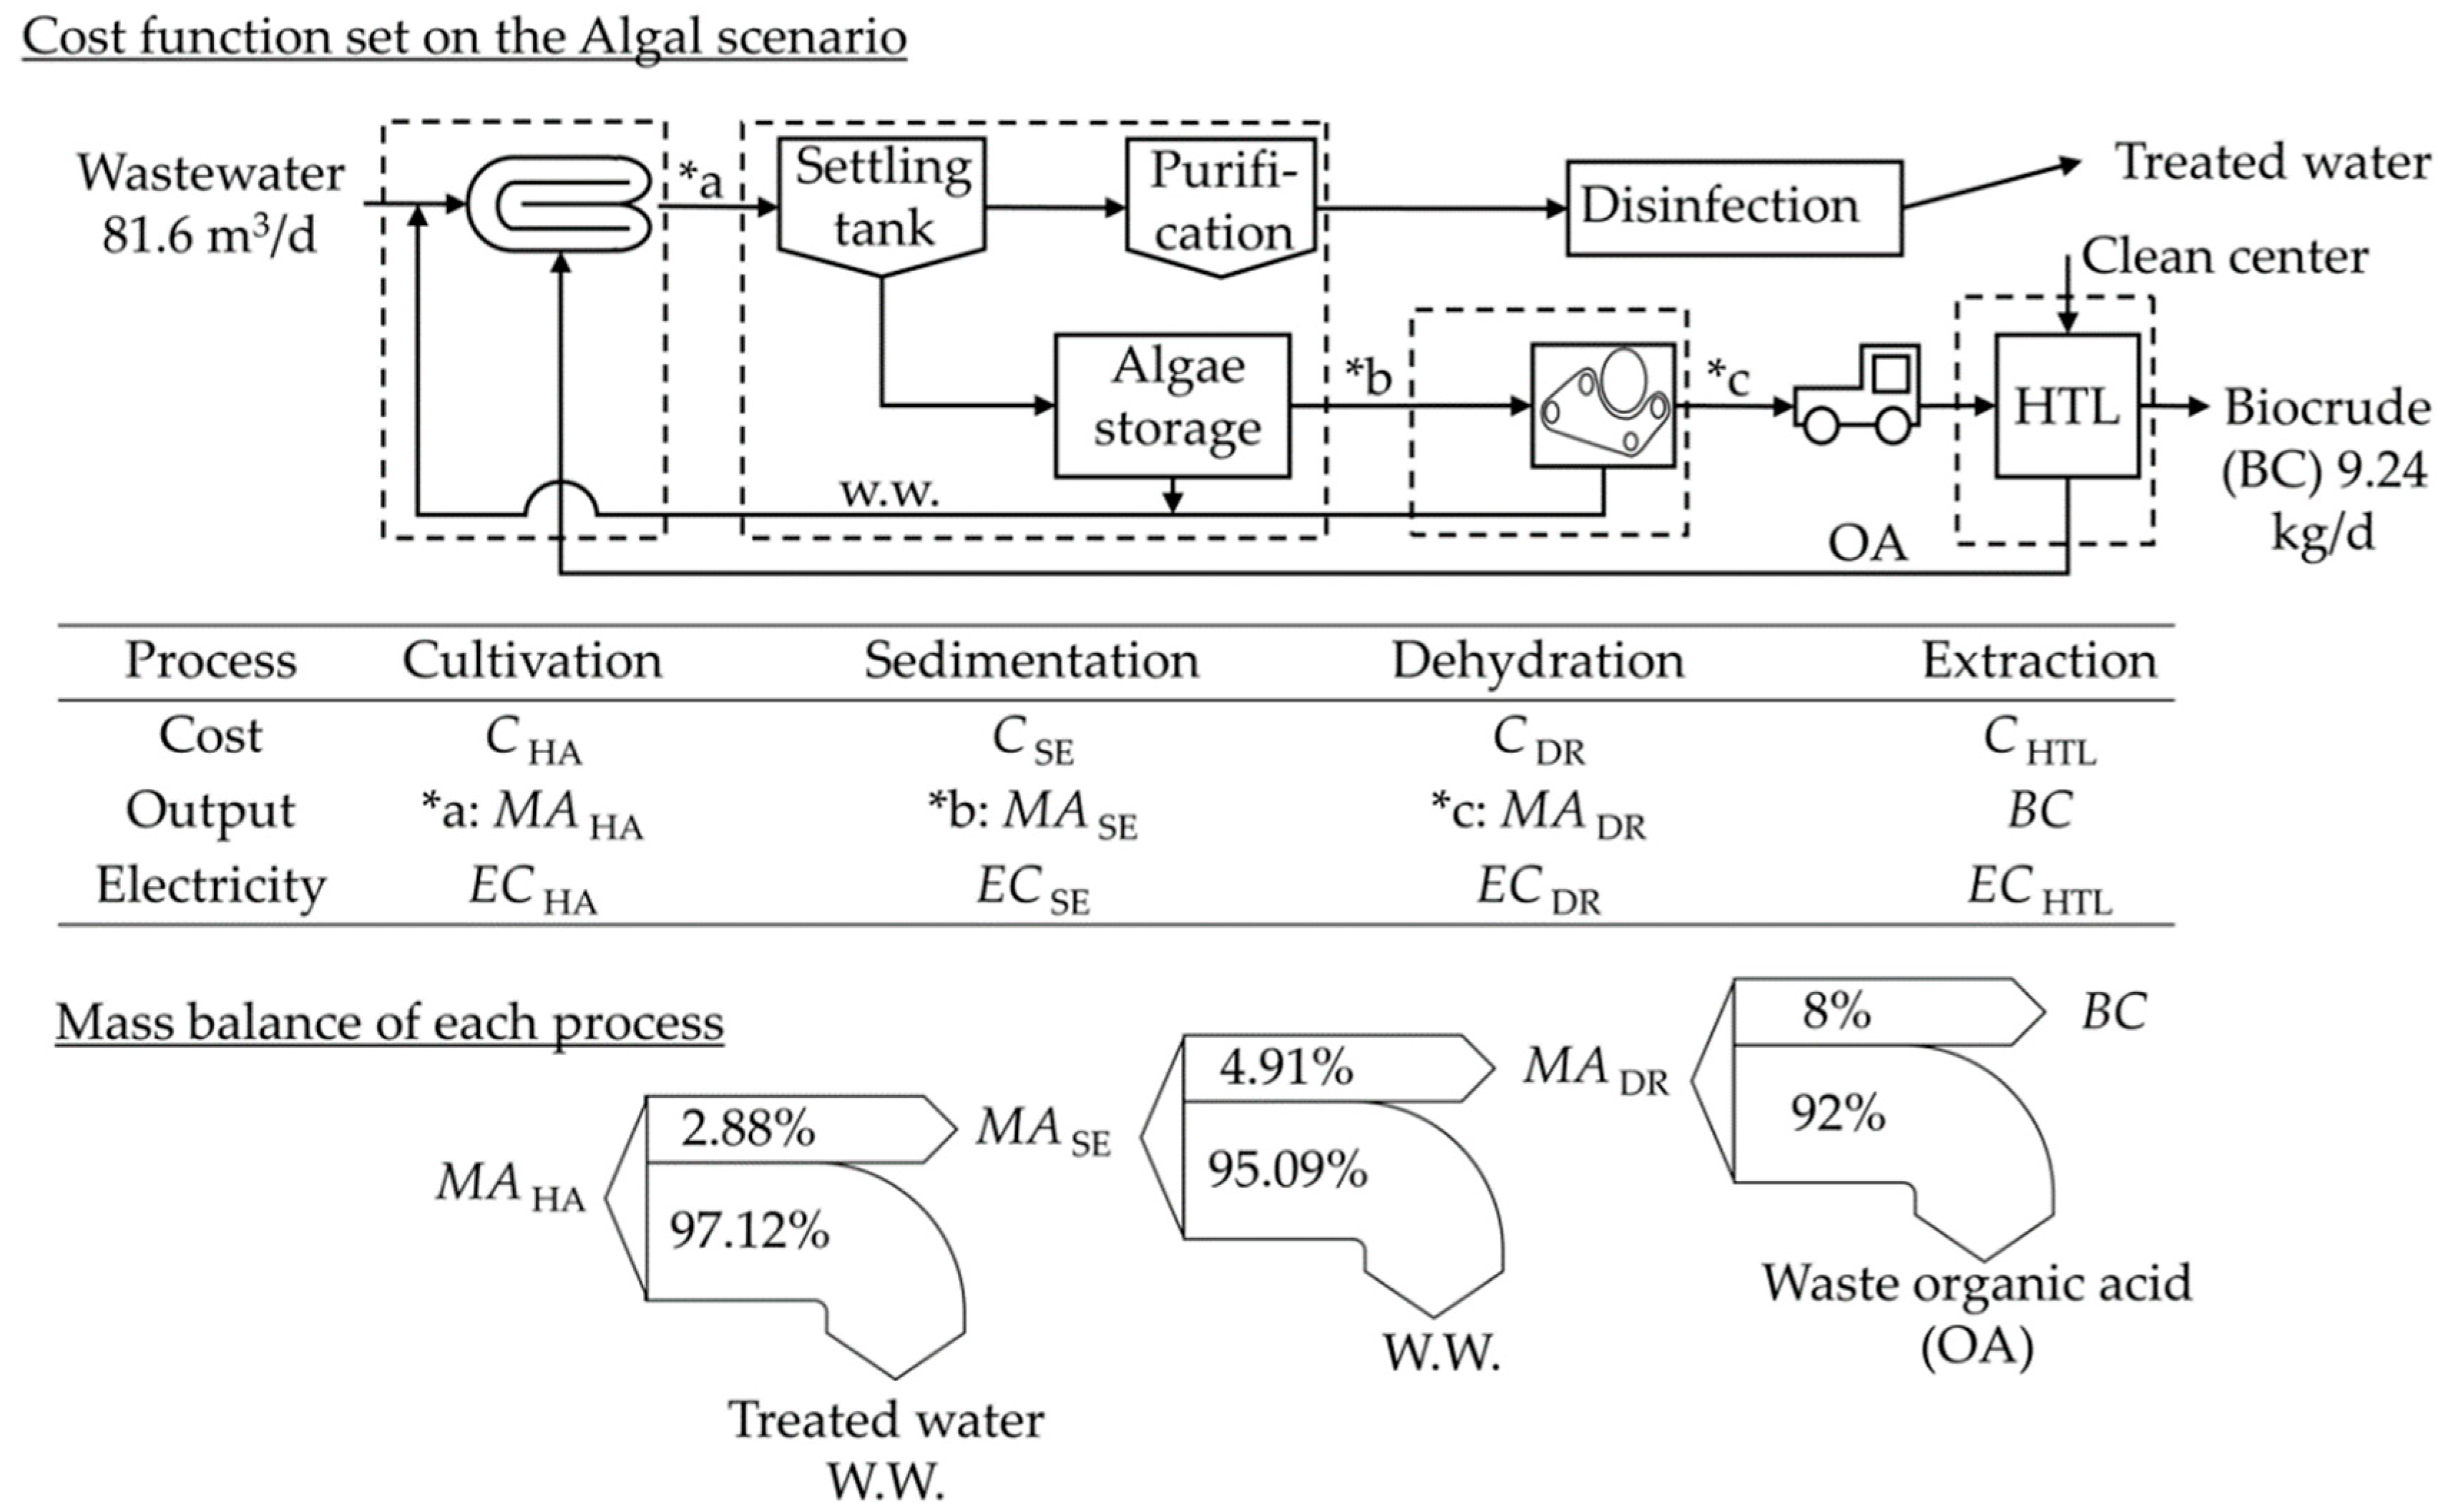
2.3. Cost Function in Microalgal Oil Production Scenario (Cost Function)

2.3.1. Categorize the Algal Scenario to Five Process (Cost Function)

The cost functions of the microalgae oil production system were examined by classifying the processes in algal production into five categories: cultivation, precipitation (polymer coagulant), dewatering (drum filter), HTL and the cost of product and waste (Figure 8). In the calculation, the cost functions were set up so that they could be applied to other treatment plants with different annual treatment volumes. The raw data for setting the cost functions were collected from a large-scale demonstration experiment conducted from FY2016 to FY2019 in Minamisoma City, Fukushima Prefecture [3] and other related data were supplemented from the Sewage Statistics [7] to set the variables. The processing volume was 50 m3/d. In addition, economies of scale should be applied when considering the depreciation of the construction cost. However, in this study, the construction cost was not considered. Since it was assumed that the existing facilities would be used effectively, the effect of economies of scale on the operating cost part was small and could be neglected.

2.3.2. The Functions and Variables for Calculating Each Process (Cost Function)

The total daily operation cost is derived from a developed function and the reference function [18]. The developed function C (JPY/d) is the sum of the daily costs of each process minus the profit from the sale of biocrude BC (kg/d) in the algal scenario (Equation (1)).
C = CHA + CSE + CDR + CHTL - PBC × BC.
The cost of chlorine and other costs of disinfection is the same in both systems in this comparison and were excluded from the cost calculation parameters (Table 3).
The yield of the algal suspension per day MAHA (t/d) is equal to the multiplying volume of the influent wastewater WW (m3/d) by ρ (t/m3). And the WW (m3/d) is obtained by dividing the volume calculated from the area of the incubation tank A (m2) and the water depth d (m) by the HRT (d) (Equation (2)). For the algal scenario, the system is introduced to a sewage treatment plant as a retrofit and the treatment volume in the algal system is determined by considering the inflow volume per day and the margin of the volume ratio.
M A HA   =   W W ×   ρ =   A × d HRT   ×   ρ .
The productivity of microalgae depends on various conditions such as the depth of water in the reaction tank as well as the addition of solvents and nutrients. In this study, the harvest concentration of microalgae in the culture medium at the time of harvest after HRT of 4 days was 0.148 g/L (Table 2, No. 8) based on previous studies [3].
The relationships between the yield of algal suspension MAHA (t/d), algal suspension MASE (kg/d) after coagulation and precipitation, algal suspension MADR (kg/d) after dehydration and generated biocrude BC (kg/d) were determined from the experimental values (Equations (3)–(5)). Since the experimental values at Minamisoma were obtained in small lots, the loss ratio in each process is expected to decrease with continuous cultivation and expansion of scale but the experimental values are applied in the following calculation.
MASE = MAHA × 2.88% × 1000
MADR = MASE × 98.02% × 4.91%
BC = MADR × 8%.
To calculate the cost of each process (Equation (1)), various conditions were set (Table 4). These correspond to the calculation of the environmental impact of the material balance in each process in a previous study [17].

2.3.3. Cultivation and Harvesting Process (Cost Function)

The daily operating cost of CHA (JPY/d) in the cultivation process was derived from the electricity consumption ECHA (kWh/d) for aeration, which depends on the depth and area of the incubation tank. The use of acetic acid (AA) as a nutrient salt (kg/m3-w.w.) is proportional to the yield MAHA (t/d) and the microalgae absorption is derived from the CO2 consumed CO2HA (kg/m3-w.w.) (Equation (6)). The cost of CO2 was assumed to be PCO2 (JPY/kg) when CO2 was purchased as an industrial gas and PCO2’ (JPY/kg) can be obtained through carbon credits at the time of use when the exhaust CO2 gas is used. A previous study showed that the ratio of CO2 absorption from exhaust gas (15%) to that from the atmosphere is 8:2 [2]. Therefore, total CO2 absorption from the exhaust gas was assumed to be 80% in this study.
CHA = ECHA × PEC + (AA × PAA + CO2HA × 80% × PCO2’) × MAHA × 1000
ECHA = NPW × WPW × whEQ + NPUMP × WPUMP × 2 × whPUMP.
The daily electricity consumption ECHA (kWh/d) in the harvesting process was calculated from the power requirement of the paddlewheel for water mixing and oxygen supply to the water WPW (kWh/h/unit), the power requirement of the pump for harvesting and wastewater replenishment from WPUMP (kWh/h/unit) and whPW, whEQ and whPUMP (h/d) were used for each operating time. The coefficients were determined according to the period of incubation, the incubation area and the pump’s required capacity α (L/min). The equation for power requirements was taken from Reference [2] (Table 5).

2.3.4. Primary Enrichment by Sedimentation Process (Cost Function)

The daily operating cost of the sedimentation process (primary enrichment) CSE (JPY/d) and centrifuges in Minamisoma were used [2]. However, the energy efficiency of the centrifuge was low because it used a large amount of electricity, so it is assumed that the sedimentation system using a polymer coagulant had lower energy efficiency and GHG emissions than the centrifuge. In addition, the Awano WWTP, the subject of this study, used gravity sedimentation for treating the primary concentration and there was a high possibility that the existing system could be used for the algal scenario.
We have confirmed that good precipitation of microalgae can be achieved with a poly-iron solution but because of the possibility of adverse effects on the HTL process due to ferrous sludge derived from the poly-iron solution, we used only the cationic polymer flocculant at the time of harvesting and the poly-iron solution and the anionic polymer flocculant for purification during sedimentation to meet the water quality standards of the effluent discharged after harvesting. The cost of both flocculants was estimated to be the same. Here, the power consumption of the ECSE (kWh/d), polymer coagulant PCHA (kg/m3-w.w), PCPU (kg/m3-w.w) and PS (kg/m3-w.w.) can be expressed as follows (Equations (8) and (9)):
CSE= ECSE × PEC + PCHA × PPC × MAHA+ (PCPU × PPC + PS × PPS) × MAHA × 97.12%
ECSE = WSE × whEQ.

2.3.5. Secondary Enrichment by Dehydration Process (Cost Function)

The operating cost CDR (JPY/d) for the dehydrating process (secondary enrichment) was calculated only using the ECDR (kWh/d) of the drum filter (Equation (10)). Generally, sludge is dehydrated using a centrifugal dehydrator that utilizes centrifugal force, a belt-press dehydrator using consolidation and a screw press dehydrator using compression. The adaptation of equipment is dependent on the daily treatment volume and sludge content [19]. Here, in the algal scenario, calculations were performed based on the data of the belt-press dehydrator used in the Minamisoma experiment.
The power consumption (WDR (kW/h/unit)) was determined from the processing capacity γ (kg/h) (Table 4 and Table 5). However, this processing capacity had a lower limit (300 kg/h) than the catalog value on the web, so the utilization rate RDR (%) was set by throughput against the lower limit. This represents the ratio of the treatment volume of 2350 kg/d calculated by MASE to the treatment volume of 2400 kg/d when the plant was operated for 8 h, which was the set up as the operating time (whDR) for the treatment volume γ (300 kg/h) (Equation (11)).
This process can coexist with the dewatering process in the existing WWTP system using the centrifuges or drum filters installed in existing facilities for dewatering.
CDR = ECDR × PEC
ECDR = WDR × whDR × RDR (%).

2.3.6. Hydrothermal Liquefaction Process (Cost Function)

The operating cost of the HTL process, CHTL (JPY/d), was mainly derived from the heaters (Equation (12)). However, since detailed power consumption data were not available for Minamisoma, the power consumption was estimated from the hydrothermal liquefaction data for the dewatered sludge. The processing capacity δ (kg/h) was set based on the results of the Minamisoma experiment [3] (Table 4), a reaction temperature of 350 °C, pressure of 20 MPa-G, residence time of 6 min in the reaction tube and flow rate of 20 mL/min, where the biocrude yield was maximum. The number of HTL units NHTL (unit) and utilization rate RHTL-U (%) were also set and calculated (Equation (13)). The utilization of RHTL-U (%) was set in the same way as for the dehydration process.
The power consumption WHTL in the HTL was derived as follows. The total output of the six HTL heaters (2.2 kW, 2 kW, 2.5 kW × 2, 0.5 kW × 2) for the HTL of the microalgae in Minamisoma (350 °C, 20 MPa, 6 min) was 10.2 kWh, which was used for an HTL treatment capacity of 1.2 kg/h to 1 m3 of algal suspension (SS 20%) [2]. The maximum calorific value was 30,600 MJ/m3. However, this calorific value represented the maximum output and this power was not always consumed. Therefore, based on the data of similar studies, the heat consumption of 5476 MJ · m3-w.w. [20] (2181 MJ/m3-w.w. from feed pumps, pressurized pumps and so forth and 3294 MJ/m3-w.w. from heaters) was used when 1 m3 wastewater (SS 15%) was subjected to HTL (400 °C, 10 MPa, 15 min). From this, 18% RHTL-U was adopted as the energy usage rate in the HTL. As a result, the power consumption WHTL was calculated as 10.2 kWh × 18% = 1.84 kWh.
The heat recovery rate of RHTL-H (%) of sewage sludge under HTL at 409 °C and 11 MPa was 86% [20]. In other similar studies, the heat recovery rate was approximately 80% [21]. Therefore, the heat recovery rate of RHTL-H (%) was set as 86%.
CHTL = ECHTL × PEC
ECHTL = NHTL × WHTL × whEQ × RHTL-U × RHTL-H.

2.3.7. Biocrude Selling Prices and Dehydrated Sludge Disposal Cost (Cost Function)

The selling price of biocrude was set at 45 $/bbl. for the same level of crude oil price. This was converted by 140 kg/bbl.-oil and 109 JPY/USD to 35 JPY/kg. Biocrude is expected to be more costly than crude oil in terms of carbon neutrality. However, considering its alternative energy source, the price must have the same selling price.
In the case of existing systems, dehydrated sludge (sludge cake) DS (kg/d) is generated as a final waste product after wastewater treatment. Dehydrated sludge is used as a fertilizer, cement material or fuel or disposed to landfill and so forth. In some cases, a pickup fee is charged and in other cases, the sludge is accepted free of charge, such as when it is used in municipal projects as part of the public sector. The sludge disposal cost, PDS (JPY/kg), of the Awano WWTP was 28,753 JPY/t-sludge cake (264 $/t-sludge cake) from the Sewage Statistics 2017 [7].
Finally, the cost function for the operating cost of microalgae introduction was constructed using Equations (1)–(13).

2.4. Environmental Burden in Microalgal Oil Production Scenario

The microalgae oil production system coupled with an OD method WWTP is superior to the existing system in terms of the global warming potential associated with GWP100 [2]. The difference between this study and the present study is that the microalgae suspension (algal concentration: 20%) and the waste organic acid needs to be transported approximately 6 km to utilize the waste heat at the Clean Center.
If the heat of the HTL is generated from electrical energy without using discharged heat, the environmental impact (without heat recovery) amounts to an additional 1.34 kg-CO2 eq/m3-w.w. for the HTL process in algal scenario A. The total environmental impact was 2.95 kg-CO2 eq/m3-w. kg, which was higher than the existing scenario (2.76 kg-CO2 eq/m3-w.w). In addition, we estimated the environmental impact of the algal scenario assuming 86% heat recovery in algal scenario B (Equation (13)). As a result, the total environmental impact was found to be 1.77 kg-CO2 eq/m3-w.w., which was approximately two-thirds of the existing scenario (Figure 9).

3. Results and Discussion

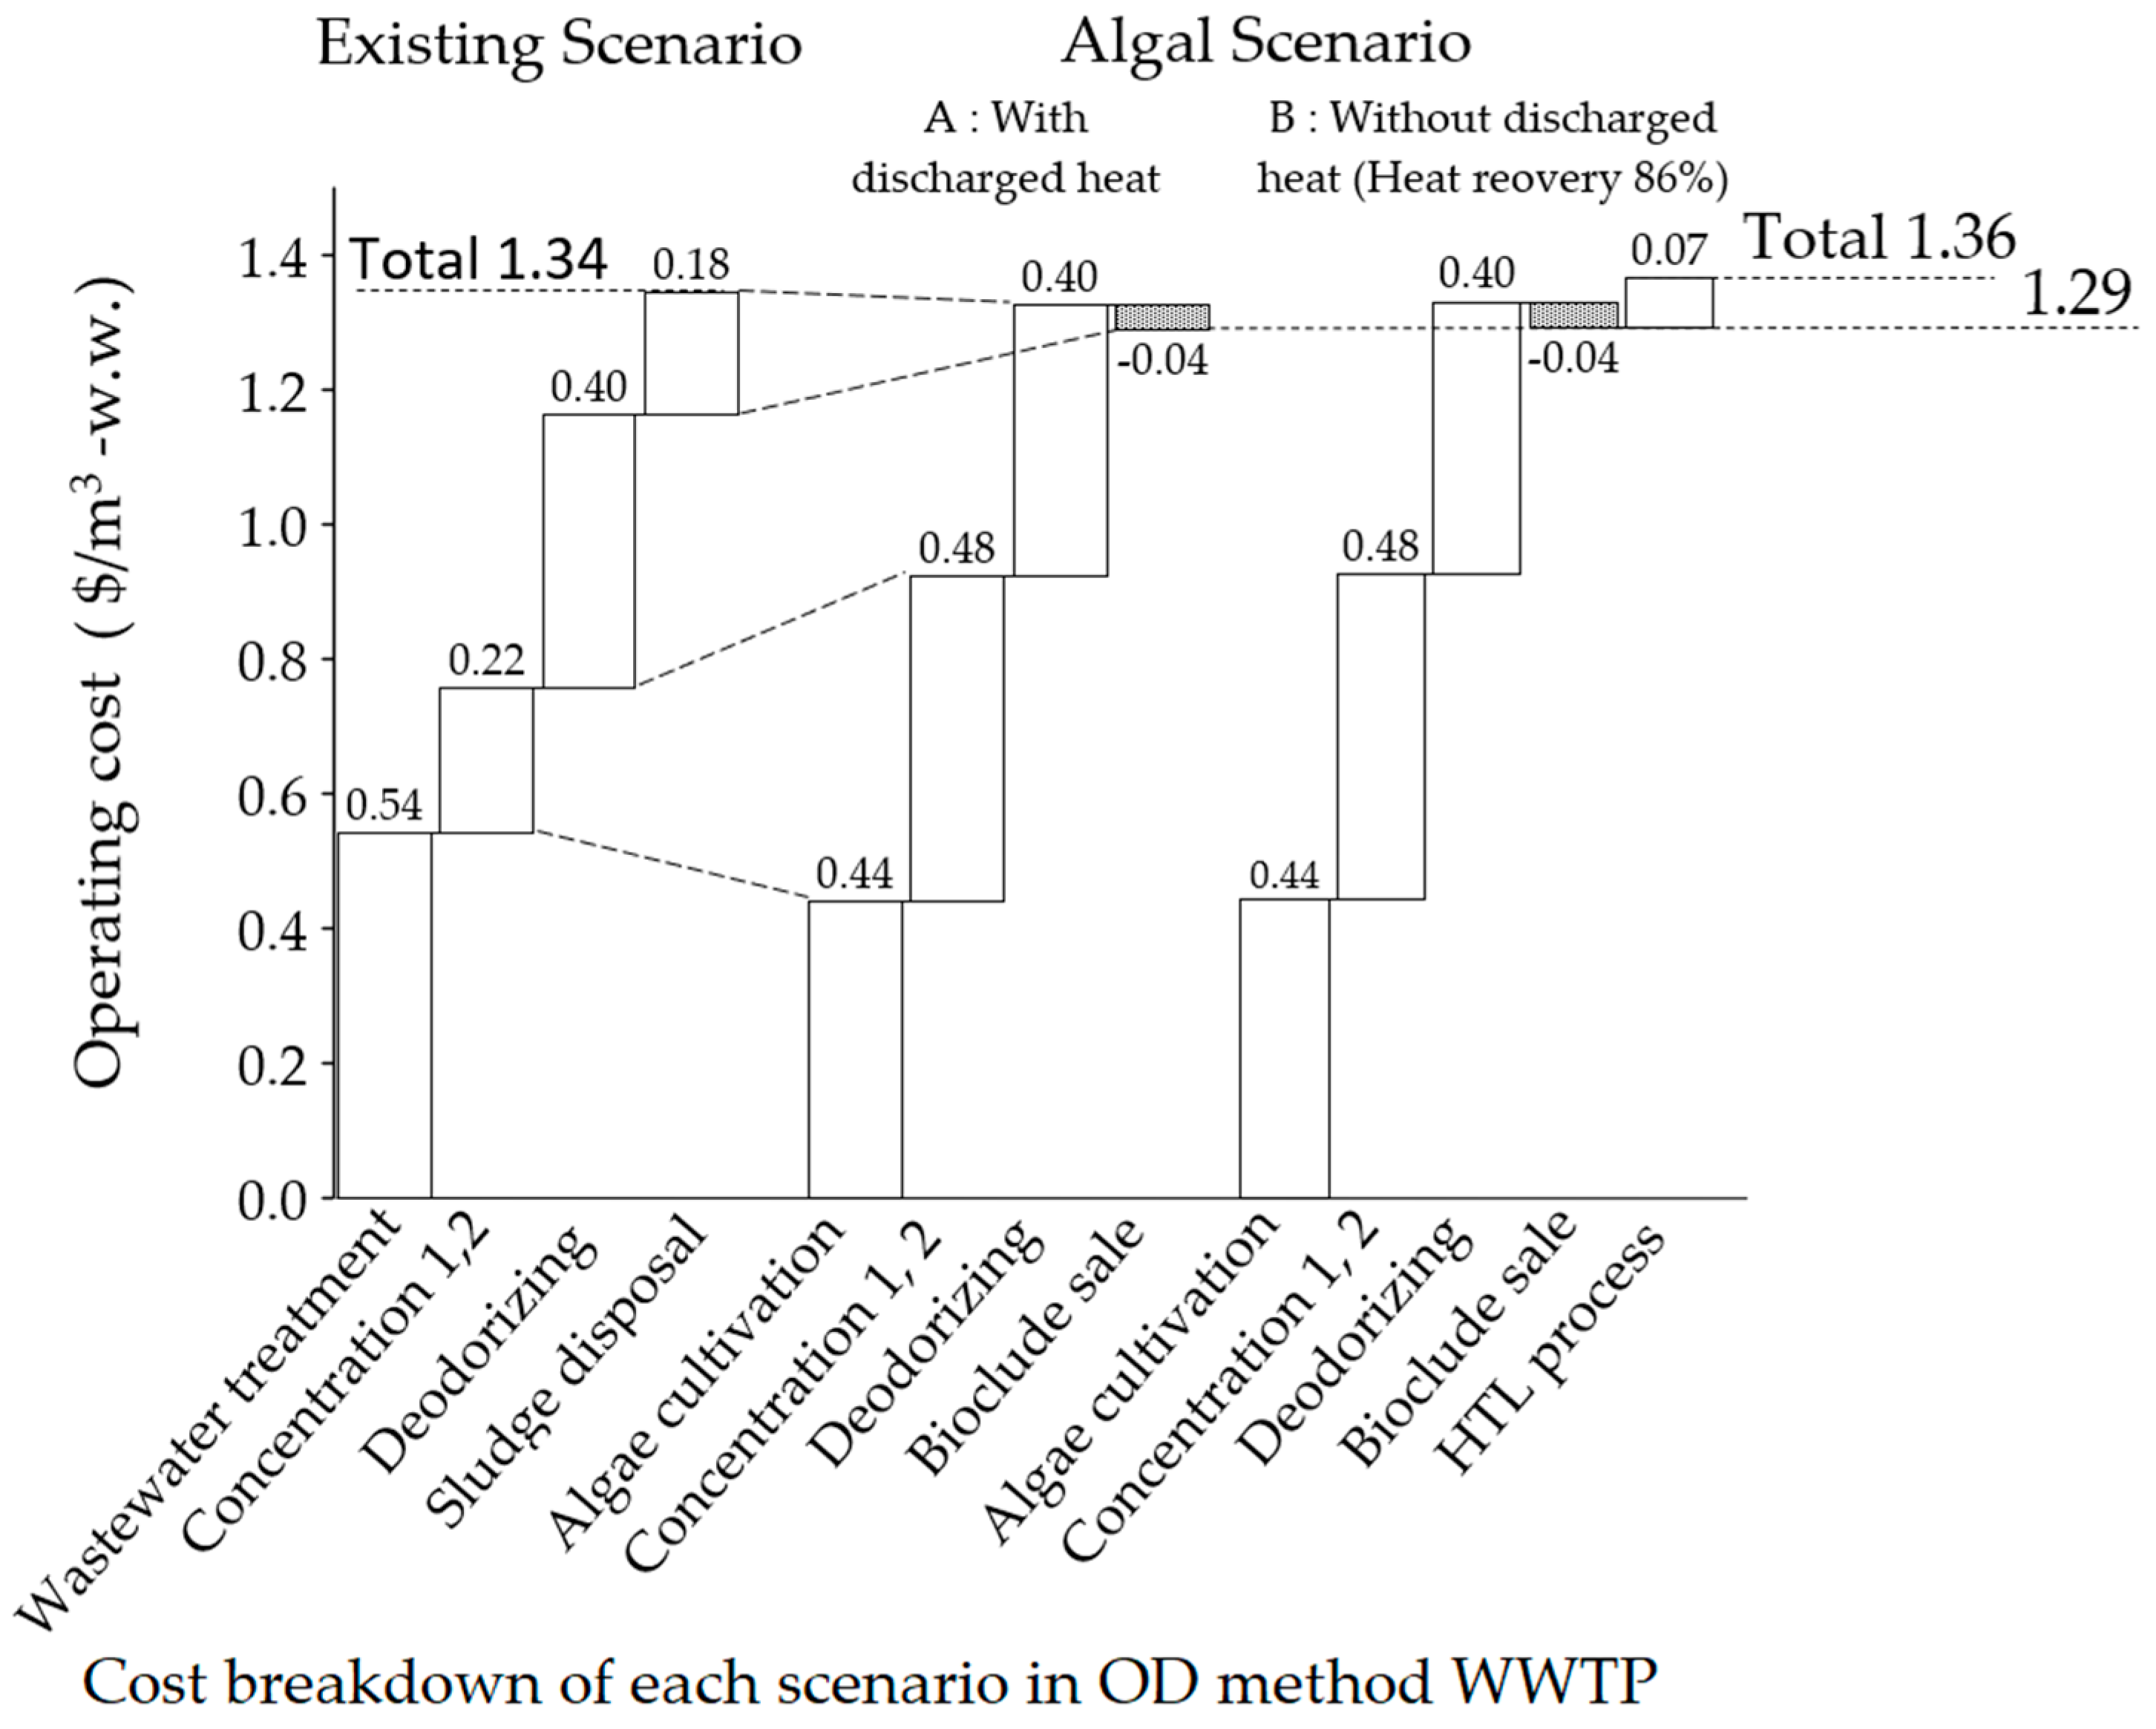
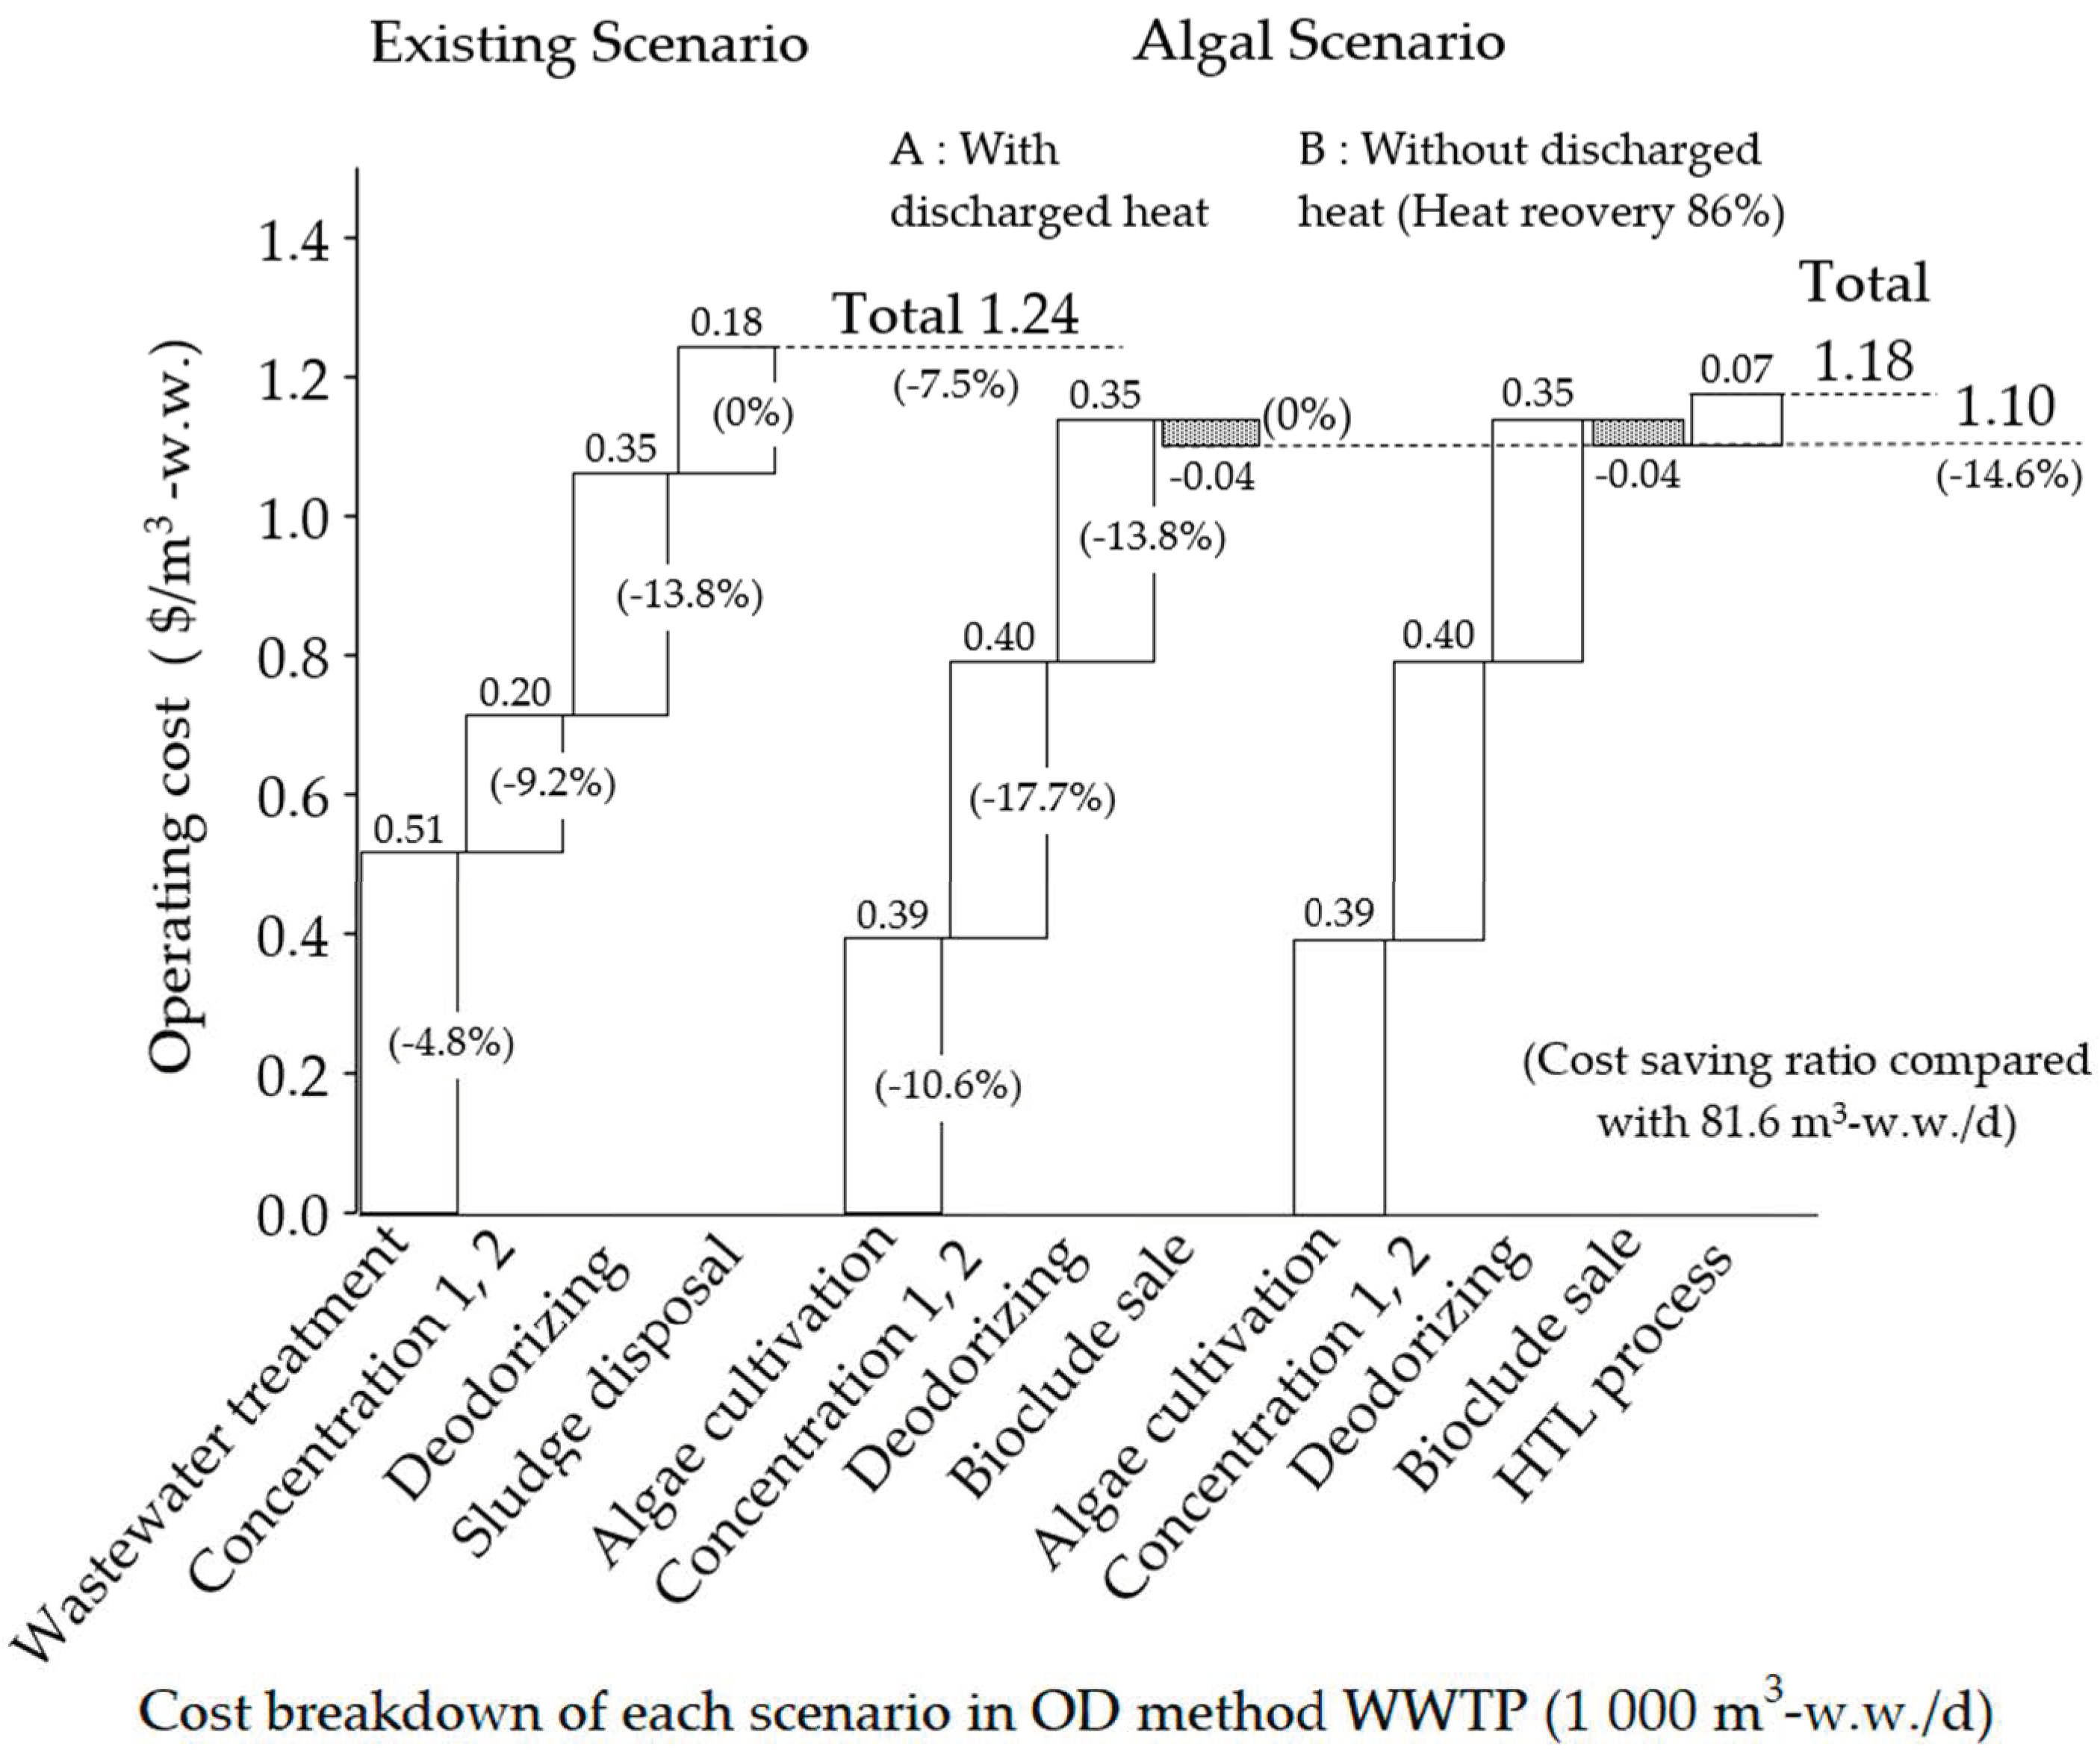
3.1. Results of the Operation Cost for the Three Scenarios

The operating cost per m3 of incoming wastewater, assuming 81.6 m3 per day, was calculated from the above-developed cost functions and the cost function of the operating cost of the sewage treatment plant under the existing OD method [20] (Figure 10, Table A1). The operating cost of the algal scenario reflects the 81.6 m3 part of the algal scenario (Figure 6). In addition, the existing scenario reflects the 81.6/848 m3 portion (9.6%) of the existing scenario (Figure 5).
The setup of the algal scenario was based on the assumption that algae would be used as a partial replacement for the existing system at the Awano WWTP. Based on a wastewater treatment volume of 81.6 m3/d, the amount of primarily concentrated sludge, sludge input to the dewatering machine and dehydrated sludge disposal were converted from the Sewage Statistics 2017 [7]. Comparing the total operating cost per 1 m3-w.w., the existing system was 1.34 $/m3-w.w., algal scenario A (using exhaust gas and discharged heat) 1.29 $/m3-w.w. and algal scenario B (using exhaust gas only) 1.36 $/m3-w.w. If both exhaust gas and waste heat are available, the cost was slightly lower than that of the existing process. On the other hand, when electricity was used in the HTL process without using waste heat, the cost was slightly higher at a utilization rate of 18% with heat recovery of 86% of the heater output. In summary, the operating cost was similar to that of the existing OD method.
In terms of the breakdown of operation costs (Table A1), the cost of electricity for water treatment and the cultivation process of CHA was lower for algae. This is because the reaction proceeds slowly due to the shallow depth of water and the long HRT, so relatively less electricity was needed to supply oxygen. In this process, the cost savings from carbon credits (−0.01 $/m3-w.w.) were also included but they were not significant (~5% of CHA).
The primary concentrate part (gravity concentration) was more expensive (+0.23 $/m3-w.w.) because the algal system CSE uses a polymeric coagulant, whereas the existing system did not use chemicals. The secondary concentrate (centrifugal dehydration) and deodorizing had little effect. Finally, the disposal cost of the dehydrated sludge (−0.18 $/m3-w.w.) was not required and the sales income of biocrude (−0.04 $/m3-w.w.) was add. As a result, there are few difference in the total cost, the cost of the polymer flocculant was largely compensated by carbon credits, sales of biocrude and the lack of sludge disposal costs.

3.2. Changes in the Cost with the Scale of the Daily Water Treatment Volume (1000 m3)

The scaled-up scenario was assessed in relation to a change in the one-day treatment volume. At 81.6 m3/d, the cost of algal system B (using flue gas only) exceeded that of the existing system but at a scale of 1000 m3/d, the cost of algal system B was less than 1.18 $/m3-w.w., compared to the costs of the existing system at 1.24 $/m3-w.w. When the treatment volume was increased, the cost of the algal system decreased. This shows that the algal system has an advantage over the existing system (Figure 11).
For the existing scenario in Figure 8, the treatment rate of 848 m3/d was reduced to 81.6 m3/d as part of the large-scale treatment, so there was no significant change. On the other hand, the treatment rate of the algal system 1000 m3-w.w./d was 10 times higher than that of the 81.6 m3-w.w./d system. So the total cost of both algal systems A and B were lower than those of the existing system, as each cost was reduced slightly.

3.3. Effect of Changing Key Assumptions in the Algal Scenario

In this study, algal scenarios A and B were based on some assumptions (Table 4). To see the changes in the costs, several patterns were calculated by changing the key assumptions (Table 6). When the heat recovery rate was changed to 0% in algal scenario B, the cost was 1.3 times greater than that of the existing scenario. When the exhaust CO2 gas was changed to commercial gas in the algal scenario A, the cost was 2.1 times greater than that of the existing scenario. Where both the discharged heat and exhaust CO2 gas were changed to commercial sources in algal scenario A, the cost was 2.5 times greater than that of the existing scenario. The effective use of discharged heat and exhaust CO2 is a necessary cost reduction factor in the algal scenario.

4. Conclusions

Microalgae oil production using wastewater is one of the solutions for the sustainable operation of WWTPs in areas with a declining population. Appropriate methods have been sought to improve the cost-effectiveness of small-scale WWTPs, to reduce the maintenance costs and to improve the use of advanced technology. Gas utilization by methane fermentation has been limited to large-scale treatment plants.
Based on the constructed cost function and the design of the system using the existing treatment facility as an example, 81.6 m3-w.w./d of wastewater treatment could be replaced by algal production, which could effectively utilize the current facilities. Microalgae oil production can be realized as a new regional, low environmental impact WWTP method with the same cost-effectiveness as the existing method, based on the detailed results of experiments.
Small-scale wastewater treatment and oil production using microalgae can be expected to further reduce operating costs and improve biocrude output with increased commercial application and through further research. Although this research dealt with existing OD process WWTPs in Japan, the algal system could also be implemented in new WWTPs in developing countries.

Author Contributions

Conceptualization, R.I. and R.N.; methodology, R.I., A.S.P., S.I. and R.N.; validation, R.I., T.A. and R.N.; formal analysis, R.I. and R.N.; writing—original draft preparation, R.I.; writing—review and editing, T.A. and R.N.; visualization, R.I. and R.N.; supervision, R.N.; project administration, M.M.W. and R.N. All authors have read and agreed to the published version of the manuscript.

Funding

This research received no external funding.

Conflicts of Interest

The authors declare no conflict of interest.

Appendix A

The surrounding environment and proximity of the Awano WWTP to obtain the exhaust CO2 gas (Figure A1).
Figure A1. Proximity of the Awano WWTP and the Kozato Kizai Co., Ltd plant (Map: Made from Google Maps).
Energies 13 05310 g0a1
The details of the operating costs result (Figure 10) per treatment of 1 m3-w.w. (Table A1) Based treatment volume scale was 81.6 m3-w.w./d.
Table A1. Operating costs for the existing OD method and microalgae scenario.
Operating Cost ($/m3-w.w.)
ExistingAlgal AAlgal BRemarks
Use of exhaust CO2 gas as free-
Use of discharged heat--
Water-treat / Cultivation
Electricity costs0.260.160.16[18], CHA
Maintenance inspection cost0.050.050.05Same, [18]
labor cost0.220.220.22Same, [18]
Primary Concentration (Gravity Concentration)
Electricity & chemical costs-0.250.25CSE
Maintenance inspection cost0.020.020.02Same, [18]
Secondary Concentration (Centrifugal Dehydration)
Electricity costs0.0040.030.03[18], CDR
Maintenance inspection cost0.060.060.06Same, [18]
Chemical cost (polymer flocculant*)0.02--[18], Algal included in CSE
labor cost0.120.120.12Same, [18]
Deodorizing Equipment
Electricity costs0.010.010.01Same, [18]
Maintenance inspection cost0.030.030.03Same, [18]
Activated carbon cost0.370.370.37Same, [18]
Dehydrated sludge disposal cost0.18--PDS × DS
Sales income of biocrude-−0.04−0.04−PBC × BC
HTL cost (heat recovery 86%)--0.07CHTL × 14%
Total1.341.291.36
* Costs of disinfection chlorine are not included in any of the scenarios.

References

  1. Shahid, A.; Malik, S.; Zhu, H.; Xu, J.; Nawaz, M.Z.; Nawaz, S.; Alam, M.A.; Mehmood, M.A. Cultivating microalgae in wastewater for biomass production, pollutant removal, and atmospheric carbon mitigation; a review. Sci. Total Environ. 2020, 704, 135303. [Google Scholar] [CrossRef] [PubMed]
  2. Ishizaki, R.; Noguchi, R.; Putra, A.S.; Ichikawa, S.; Ahamed, T.; Watanabe, M.M. Reduction in Energy Requirement and CO2 Emission for Microalgae Oil Production Using Wastewater. Energies 2020, 13, 1641. [Google Scholar] [CrossRef] [Green Version]
  3. Algae Industry Incubation Consortium. Japan Annual Report of the Microalgae Pilot Project for Biofuel Production 2019; Algae Biomass and Energy System R&D Center, University of Tsukuba: Tsukuba, Japan, 2019; pp. 28, 29, 35, 107. [Google Scholar]
  4. Choi, H.I.; Hwang, S.-W.; Sim, S.J. Comprehensive approach to improving life-cycle CO2 reduction efficiency of microalgal biorefineries: A review. Bioresour. Technol. 2019, 291, 121879. [Google Scholar] [CrossRef] [PubMed]
  5. Oshita, K.; Furubayashi, T.; Nakata, T. The Analysis on Performance of Microalgae-based Biofuel Production System Considering Regional Climate Condition and Transportation. J. Jpn. Inst. Energy 2011, 90, 1047–1056. [Google Scholar] [CrossRef]
  6. Doshi, A.; Pascoe, S.; Coglan, L.; Rainey, T. The financial feasibility of microalgae biodiesel in an integrated, multi-output production system. Biofuels Bioprod. Biorefining 2017, 11, 991–1006. [Google Scholar] [CrossRef]
  7. Narita, Y. Annual Report of Sewer Statistics 2017; Japan Sewage Works Association: Tokyo, Japan, 2019; Volume 74, p. 90. [Google Scholar]
  8. Australian Science and Technology Heritage Centre Technology in Australia 1788–1988. Available online: https://www.austehc.unimelb.edu.au/tia/184.html (accessed on 16 August 2020).
  9. Akiyama, C.M. Sustainability Study of Sewerage Project Based on Future Estimated Population. Soc. Environ. Sci. Jpn. 2019, 32, 46–52. [Google Scholar] [CrossRef]
  10. Okaniwa, Y.; Mihara, Y.; Okajima, K.; Tanaka, T. Economical Evaluation of Small Scale Biogas Systems Based on Data of Biogas Plants in Operation. Water Land Environ. Eng. 2019, 77, 635–638. [Google Scholar] [CrossRef]
  11. Matsuda, K.; Iwahori, K. Policy Evaluation of Night Soil and Sludge Intensive Treatment Systems for Regional Resources Recycling. Jpn. J. Water Treat. Biol. 2018, 54, 29–38. [Google Scholar] [CrossRef] [Green Version]
  12. Wang, T.; Yabar, H.; Higano, Y. Feasibility of Combining an Algae-to-Oil System with Advanced Sewage Treatment in Japan. Stud. Reg. Sci. 2012, 42, 527–544. [Google Scholar] [CrossRef]
  13. Jimenez, C. Relationship between physicochemical variables and productivity in open ponds for the production of Spirulina: A predictive model of algal yield. Aquaculture 2003, 221, 331–345. [Google Scholar] [CrossRef]
  14. Tochigi Prefecture Prefectural Land Maintenance Business Meeting. Public Sewage of Tochigi; Tochigi Prefecture Prefectural Land Maintenance Business Meeting, Ed.; Tochigi Prefecture: Utsunomiya, Japan, 2013; pp. 3, 4, 19, 20. [Google Scholar]
  15. Demura, M.; Yoshida, M.; Yokoyama, A.; Ito, J.; Kobayashi, H.; Kayano, S.; Tamagawa, Y.; Watanobe, M.; Date, N.; Osaka, M.; et al. Biomass productivity of native algal communities in Minamisoma city, Fukushima Prefecture, Japan. Algal Res. 2018, 29, 22–35. [Google Scholar] [CrossRef]
  16. Yamazaki, K.; Saito, M.; Shukuya, M. Exergy Analysis on a Community Heating System Using Biomass Generated by Local Forest: A case study on Shimokawa town, Hokkaido. J. Environ. Eng. Trans. AIJ 2016, 81, 295–305. [Google Scholar] [CrossRef]
  17. Wibawa, D.; Nasution, M.; Noguchi, R.; Ahamed, T.; Demura, M.; Watanabe, M. Microalgae Oil Production: A Downstream Approach to Energy Requirements for the Minamisoma Pilot Plant. Energies 2018, 11, 521. [Google Scholar] [CrossRef] [Green Version]
  18. Nakajima, E.; Kotsuka, T.; Nakano, Y.; Nakazono, S. Study of Construction in Cost and Energy Consumption Calculation Method for Sewage Treatment System; Japan Institute of Wastewater Engineering and Technology: Tokyo, Japan, 2016; pp. 175–180. [Google Scholar]
  19. Gohda, S. Recent Technologies of Thickening and Dehydration in Sludge Treatment.pdf. J. Soc. Powder Technol. Jpn. 2010, 38, 177–183. [Google Scholar] [CrossRef]
  20. Torii, S.; Okajima, I.; Sako, T. Treatment and Energy Recovery of Sewage Sludge by High-pressure Superheated Steam Oxidation. J. Jpn. Inst. Energy 2013, 92, 945–956. [Google Scholar] [CrossRef] [Green Version]
  21. Anastasakis, K.; Biller, P.; Madsen, R.; Glasius, M.; Johannsen, I. Continuous Hydrothermal Liquefaction of Biomass in a Novel Pilot Plant with Heat Recovery and Hydraulic Oscillation. Energies 2018, 11, 2695. [Google Scholar] [CrossRef] [Green Version]
Figure 1. Number of wastewater treatment plants (WWTPs) in Japan categorized by daily treatment volume (m3/d) [7].
Energies 13 05310 g001
Figure 2. Existing and updated scenario classified by WWTP treatment process with daily treatment capacity.
Energies 13 05310 g002
Figure 3. The suitability detection flow for the microalgae oil production using the oxidation ditch (OD) process without the need for new construction of reaction tank and sludge dehydrating facility.
Energies 13 05310 g003
Figure 4. Facility utilization and locations of nine open-air (no cover) OD process WWTP in Tochigi Prefecture, Japan [14] (Map: Japanese GSI website).
Energies 13 05310 g004
Figure 5. Current estimated system flow at Awano WWTP.
Energies 13 05310 g005
Figure 6. Introduction of the microalgae oil production system at Awano WWTP.
Energies 13 05310 g006
Figure 7. Comparison of algal scenarios A and B based on proximity of neighboring facilities.
Energies 13 05310 g007
Figure 8. The cost function and mass balance for each process, based on the flow of the algal scenario (Figure 6).
Energies 13 05310 g008
Figure 9. Environmental impact in terms of GWP100 for each operating cost scenario (Scenario B added from Reference [2]).
Energies 13 05310 g009
Figure 10. Operating costs ($: USD) per 1 m3-w.w. for existing and microalgae oil production scenarios A and B (Treatment volume is 81.6 m3-w.w./d).
Energies 13 05310 g010
Figure 11. Operating costs ($) per 1 m3-w.w. for existing and microalgae oil production scenarios A and B (Treatment volume is 1000 m3-w.w./d).
Energies 13 05310 g011
Table 1. Proximity of WWTP to facilities that supply exhaust heat and discharged CO2.
Facility Utilization RatesNo.*Name of WWTPDewatering FacilityFacility to Supply Exhaust Heat & Discharged CO2Direct Distance
(km)
23%6Motegi-machiYesHaga Area Eco Station19.9
33%5AwanoYesKanuma City Clean Center6.8
41%1NishizawaNoKanuma City Clean Center6.1
44%2MinaminasuYesSouth Nasu Wide Area Clean Center 7.3
51%3NiidaYesShimodahara Clean Center10.2
* No. of facility is indicated in Figure 4.
Table 2. Productivity in microalgal oil production from previous studies (No. 1–7) and applied values in this study (No. 8).
No.NutrientAcetic Acid15%
CO2
Culture Pond **HRTHarvestProductivity (Per Culture Volume)Ref
C*W.W.C*from HTLVolumeDepthSurface AreaC**Yield
g/Lg/LmL/min/LLmm2dg/LL/dg/L/dg/m2/d
1-0.30-200,0000.2100040.34050,0000.08517.00[17]
2---0.61000.20.7140.203250.0517.16[3]
3---0.62100.40.7140.138530.03510.25[3]
4---0.64500.80.6940.1181130.03019.21[3]
5-0.30-0.61000.20.7140.182250.0456.41[3]
6-0.30-0.62100.40.7140.196530.04914.50[3]
7-0.30-0.64500.80.6940.1481130.03724.06[3]
8-0.150.15326,2670.840840.14881,5670.03729.61
C*: Commercial nutrient and Acetic acid (Sodium acetate), C**: Concentration, ** Aeration was done under all conditions.
Table 3. Cost calculation parameters for each scenario.
ParameterAlgalOD Process
Treatment volume (m3/d)81.681.6
Base volume (m3/d)81.6847.9
Labor cost in the Awano WWTPIncludedIncluded
Labor cost in the Clean CenterNot included-
Algal transfer feeNot included-
Recycle Acetic acid transfer feeNot included-
Disinfection costNot includedNot included
Construction feeNot includedNot included
Maintenance feeIncludedIncluded
Table 4. Variables and constant values in microalgae oil production, for the treated volume of 81.6 m3-w.w./d.
VariableDescriptionReference
Value
UnitRemarks
dThe depth of open raceway pond (ORP)0.8mProductivity is changed by the depth
AThe surface area of ORP408m2Reuse of existing pond
WWWastewater used as a solvent81.6m3/d-
ρVolumetric mass density1t/m3-
MAHAMass of the algal suspension at harvest81.6t/dSS * weight ratio 0.015%
MASEMass of the algal suspension after coagulation and sedimentation2350kg/dSS weight ratio of 1.156%
MADRMass of the algal suspension after drum-filtration115.5kg/dSS weight ratio of 20%
BCBiocrude9.24kg/dBiocrude-wet [2]
DSDehydrated sludge56.7kg/d(Existing scenario)
OAHTL water phase (Contains organic acid)106kg/dUse as heterotrophic
CTotal operation cost4002JPY/dNot included disinfection and CHTL
CHAOperation cost of cultivation1458JPY/dFree exhausted CO2
CSEOperation cost of sedimentation2255JPY/d-
CDROperation cost of dehydration290JPY/d-
(CHTL)Operation cost of extraction (HTL)4594JPY/dFree when using waste heat
ECHAElectricity consumption of cultivation33.1kWh/d-
(ECPW)Paddlewheel part in the cultivation19.8kWh/d-
(ECPUMP)Pump part in the cultivation13.3kWh/d-
ECSEElectricity consumption of sedimentation62.2kWh/d-
ECDRElectricity consumption of dehydration11.1kWh/dDrum-filter
ECHTLElectricity consumption of extraction (HTL)176.7kWh/d-
RDRUtilization rate within the drum-filter working hour98%-
RHTL-UUtilization rate within the extraction (HTL) working hour80%Algal scenario B
RHTL-HHeat recovery rate within the extraction (HTL) 86%Algal scenario B
NPWNumber of paddle wheels1unit1 unit/1000 m2
NPUMPNumber of the pump unit
1 unit includes 2 pumps (In-Out)
1unit1 unit/1000 m2
NHTLNumber of HTL5unit-
WPWPower consumption of paddle wheel2.20kW/h/unitTable 5: e4
WPUMPPower consumption of the pump0.67kW/h/unitTable 5: e1
WSEPower consumption of settling tank2.59kW/h/unitTable 5: e2
WDRPower consumption of drum-filter1.42kW/h/unitTable 5: e3
WHTLHTL heater output 10.2 kWh × 18%1.84kW/h/unitCatalog value
αProcessing capacity of the pump136L/min-
βProcessing capacity of the settling tank3.4m3/h-
γProcessing capacity of drum-filter300kg/hMinimum 300 kg/h
δProcessing capacity of HTL1.2kg/h[3]
PriceDescriptionSetting
Value
UnitRemarks
PBCThe sales price of Biocrude35.0JPY/kg45 USD/barrel
PDSDisposal cost of dehydrated sludge28.8JPY/kg(Existing scenario)
PAAPrice of sodium acetate55JPY/kg-
PECelectricity charges26JPY/kWh-
PCO2Carbon dioxide purchase320JPY/kgUsed at 15%
PCO2The sales price of carbon credit−1.8JPY/kg-
PPCPrice of polymer flocculant500JPY/kg-
PPSPrice of Inorganic coagulant25JPY/kgIron (II) polysulphate
$(USD)Exchange rate109JPY/USDAve. 2019
ConstantDescriptionSetting
Value
UnitRemarks
HRTAlgal hydraulic retention time4d-
cHarvested algal suspension concentration0.148g/LTable 2: changes with d
AAThe usage rate of sodium acetate0.15kg/m3-w.w. **Table 2
whPWWorking hour of paddle wheel18h/d-
whDRWorking hour of drum-filter8h/d-
whPUMPWorking hour of pump10h/d-
whEQWorking hour of Equipment24h/dConstant operation
whHTLWorking hour of HTL24h/d-
CO2HACO2 absorption in the cultivation process included at harvesting0.639kg/m3-w.w.-
PCHAPolymer flocculant (Algal harvest)0.0030kg/m3-w.w.
PCPUPolymer flocculant (Water treat)0.0005kg/m3-w.w.
PSInorganic coagulant (Water treat)0.25kg/m3-w.w.Iron (II) polysulphate
* SS: Suspended solid, ** w.w.: Wastewater.
Table 5. Function list of “electricity” for dependent parameters (derived from Reference [2]).
No.Parameters f(x) (kW)Equation f(x) = ax + bxunitabR2
e1Pumpf(x) = 0.0029x + 0.2725Capacity(α)L/min0.00290.27251.00
e2Flocculant machinef(x) = 0.5972x + 0.5611Capacity(β)m3/h0.59720.56110.89
e3Drum filter machinef(x) = 0.0202x + 1.4161Capacity(γ)m3/h0.02021.41610.94
e4Paddlewheelf(x) = 2.75xDepth(d)m2.7501.00
Table 6. Cost change by changing key assumptions (treatment volume is 81.6 m3-w.w./d).
Key AssumptionsExisting
Scenario
Algal
Scenario A
Algal
Scenario B
Other Patterns
123
Use of exhaust CO2 gas as free---
Use of discharged heat in HTL----
HTL heat recovery (RHTL-H)--86%0%--
Operation cost ($/m3-w.w.)
(Ratio based existing)
1.34
(1.0)
1.29
(1.0)
1.36
(1.0)
1.81
(1.3)
2.80
(2.1)
3.32
(2.5)

