The Impact of Implied Volatility Fluctuations on Vertical Spread Option Strategies: The Case of WTI Crude Oil Market


Abstract
:1. Introduction
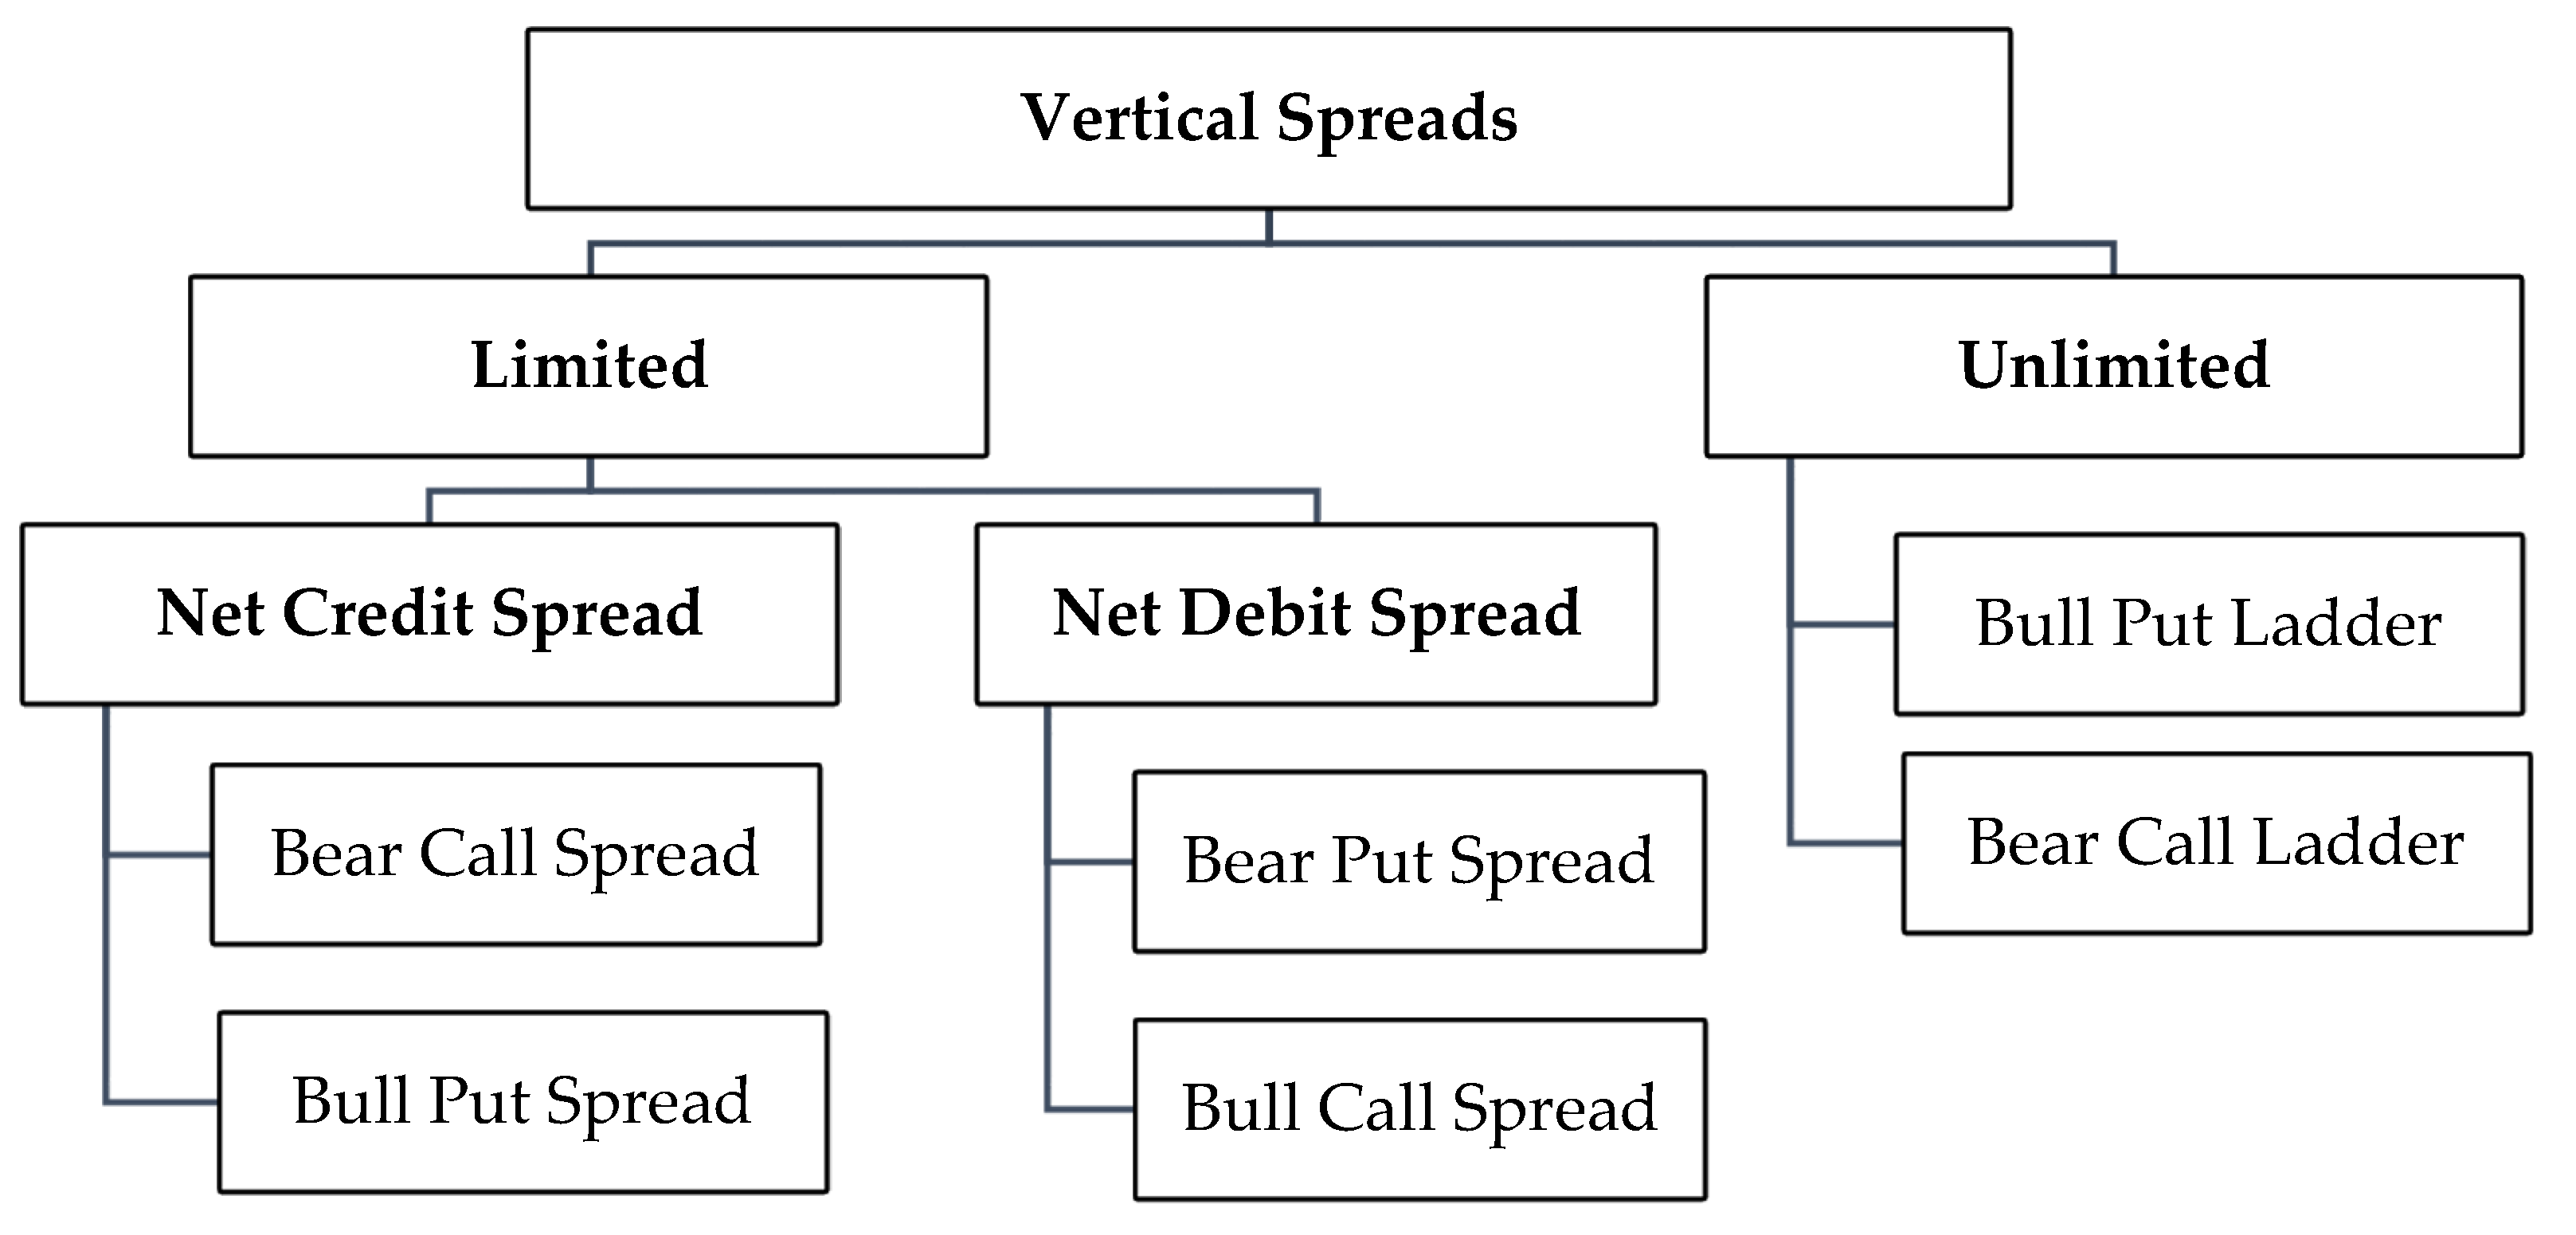
2. Vertical Spread Option Strategies
- with the same expiration date;
- with the same underlying asset;
- but with different strike prices.
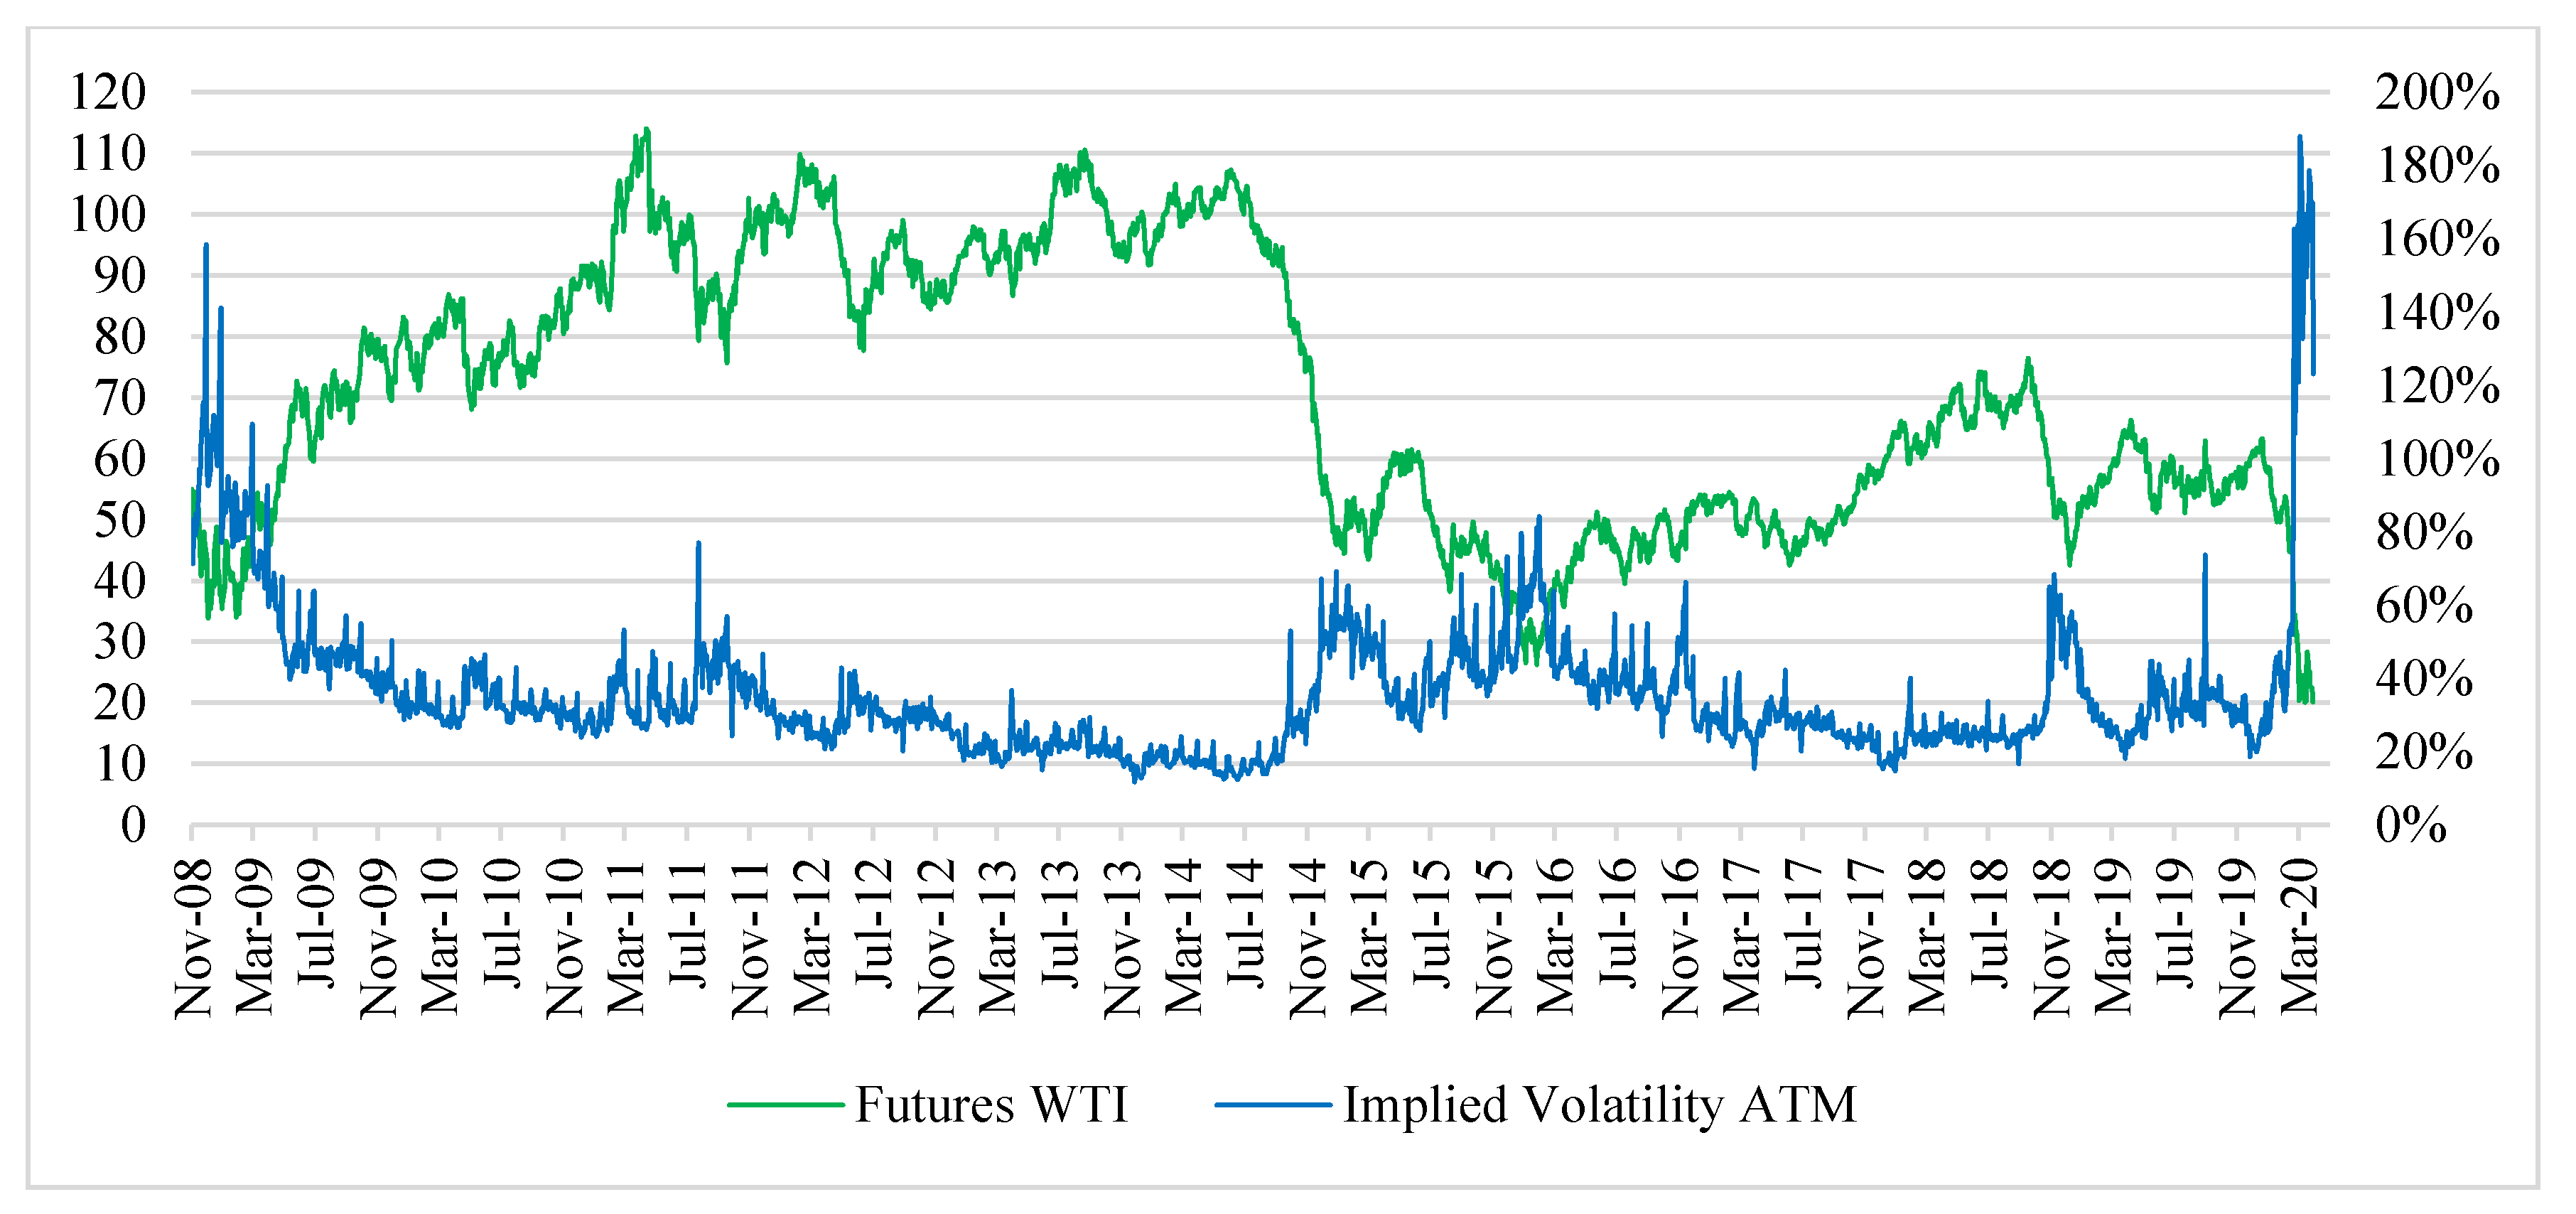
3. Data and Preliminary Analysis
- 0–20 implied volatility of ATM options was below the 20th percentile of the analyzed period;
- 20–80 implied volatility of ATM options was between the 20th and 80th percentile;
- 80–90 implied volatility of ATM was higher than 80% and not greater than 90% of the volatility observed;
- 90–95 implied volatility of ATM options was higher than 90%, and not greater than 95% of the volatility observed;
- 95–100 implied volatility of ATM options was above the 95th percentile.
- (O1)
- with strike price $2 USD lower than the ATM strike price;
- (O2)
- with strike price $1 USD lower than the ATM strike price;
- (O3)
- with strike price $0.5 USD lower than the ATM strike price;
- (O4)
- ATM options whose strike price was closest to the WTI crude oil price in the date of opening the position;
- (O5)
- with strike price $0.5 USD higher than the ATM strike price;
- (O6)
- with strike price $1 USD higher than the ATM strike price;
- (O7)
- with strike price $2 USD higher than the ATM strike price.
4. Results and Discussion
- (W1)
- Bull Call Spread (0.5; 1)
- (W2)
- Bull Call Spread (1; 2)
- (W3)
- Bull Call Spread (0.5; 2)
- (W4)
- Bear Put Spread (−1; −0.5)
- (W5)
- Bear Put Spread (−2; −1)
- (W6)
- Bear Put Spread (−2; −0.5)
- (W7)
- Bull Put Spread (−1; −0.5)
- (W8)
- Bull Put Spread (−2; −1)
- (W9)
- Bull Put Spread (−2; −0.5)
- (W10)
- Bear Call Spread (0.5; 1)
- (W11)
- Bear Call Spread (1; 2)
- (W12)
- Bear Call Spread (0.5; 2)
- (W13)
- Bull Put Ladder (−2; −1; −0,5)
- (W14)
- Bear Call Ladder (0.5; 1; 2)
4.1. Cost and BEP in Vertical Spread Strategy
4.2. Analysis the Frequency of Execution the Strategies with Profits and Loss
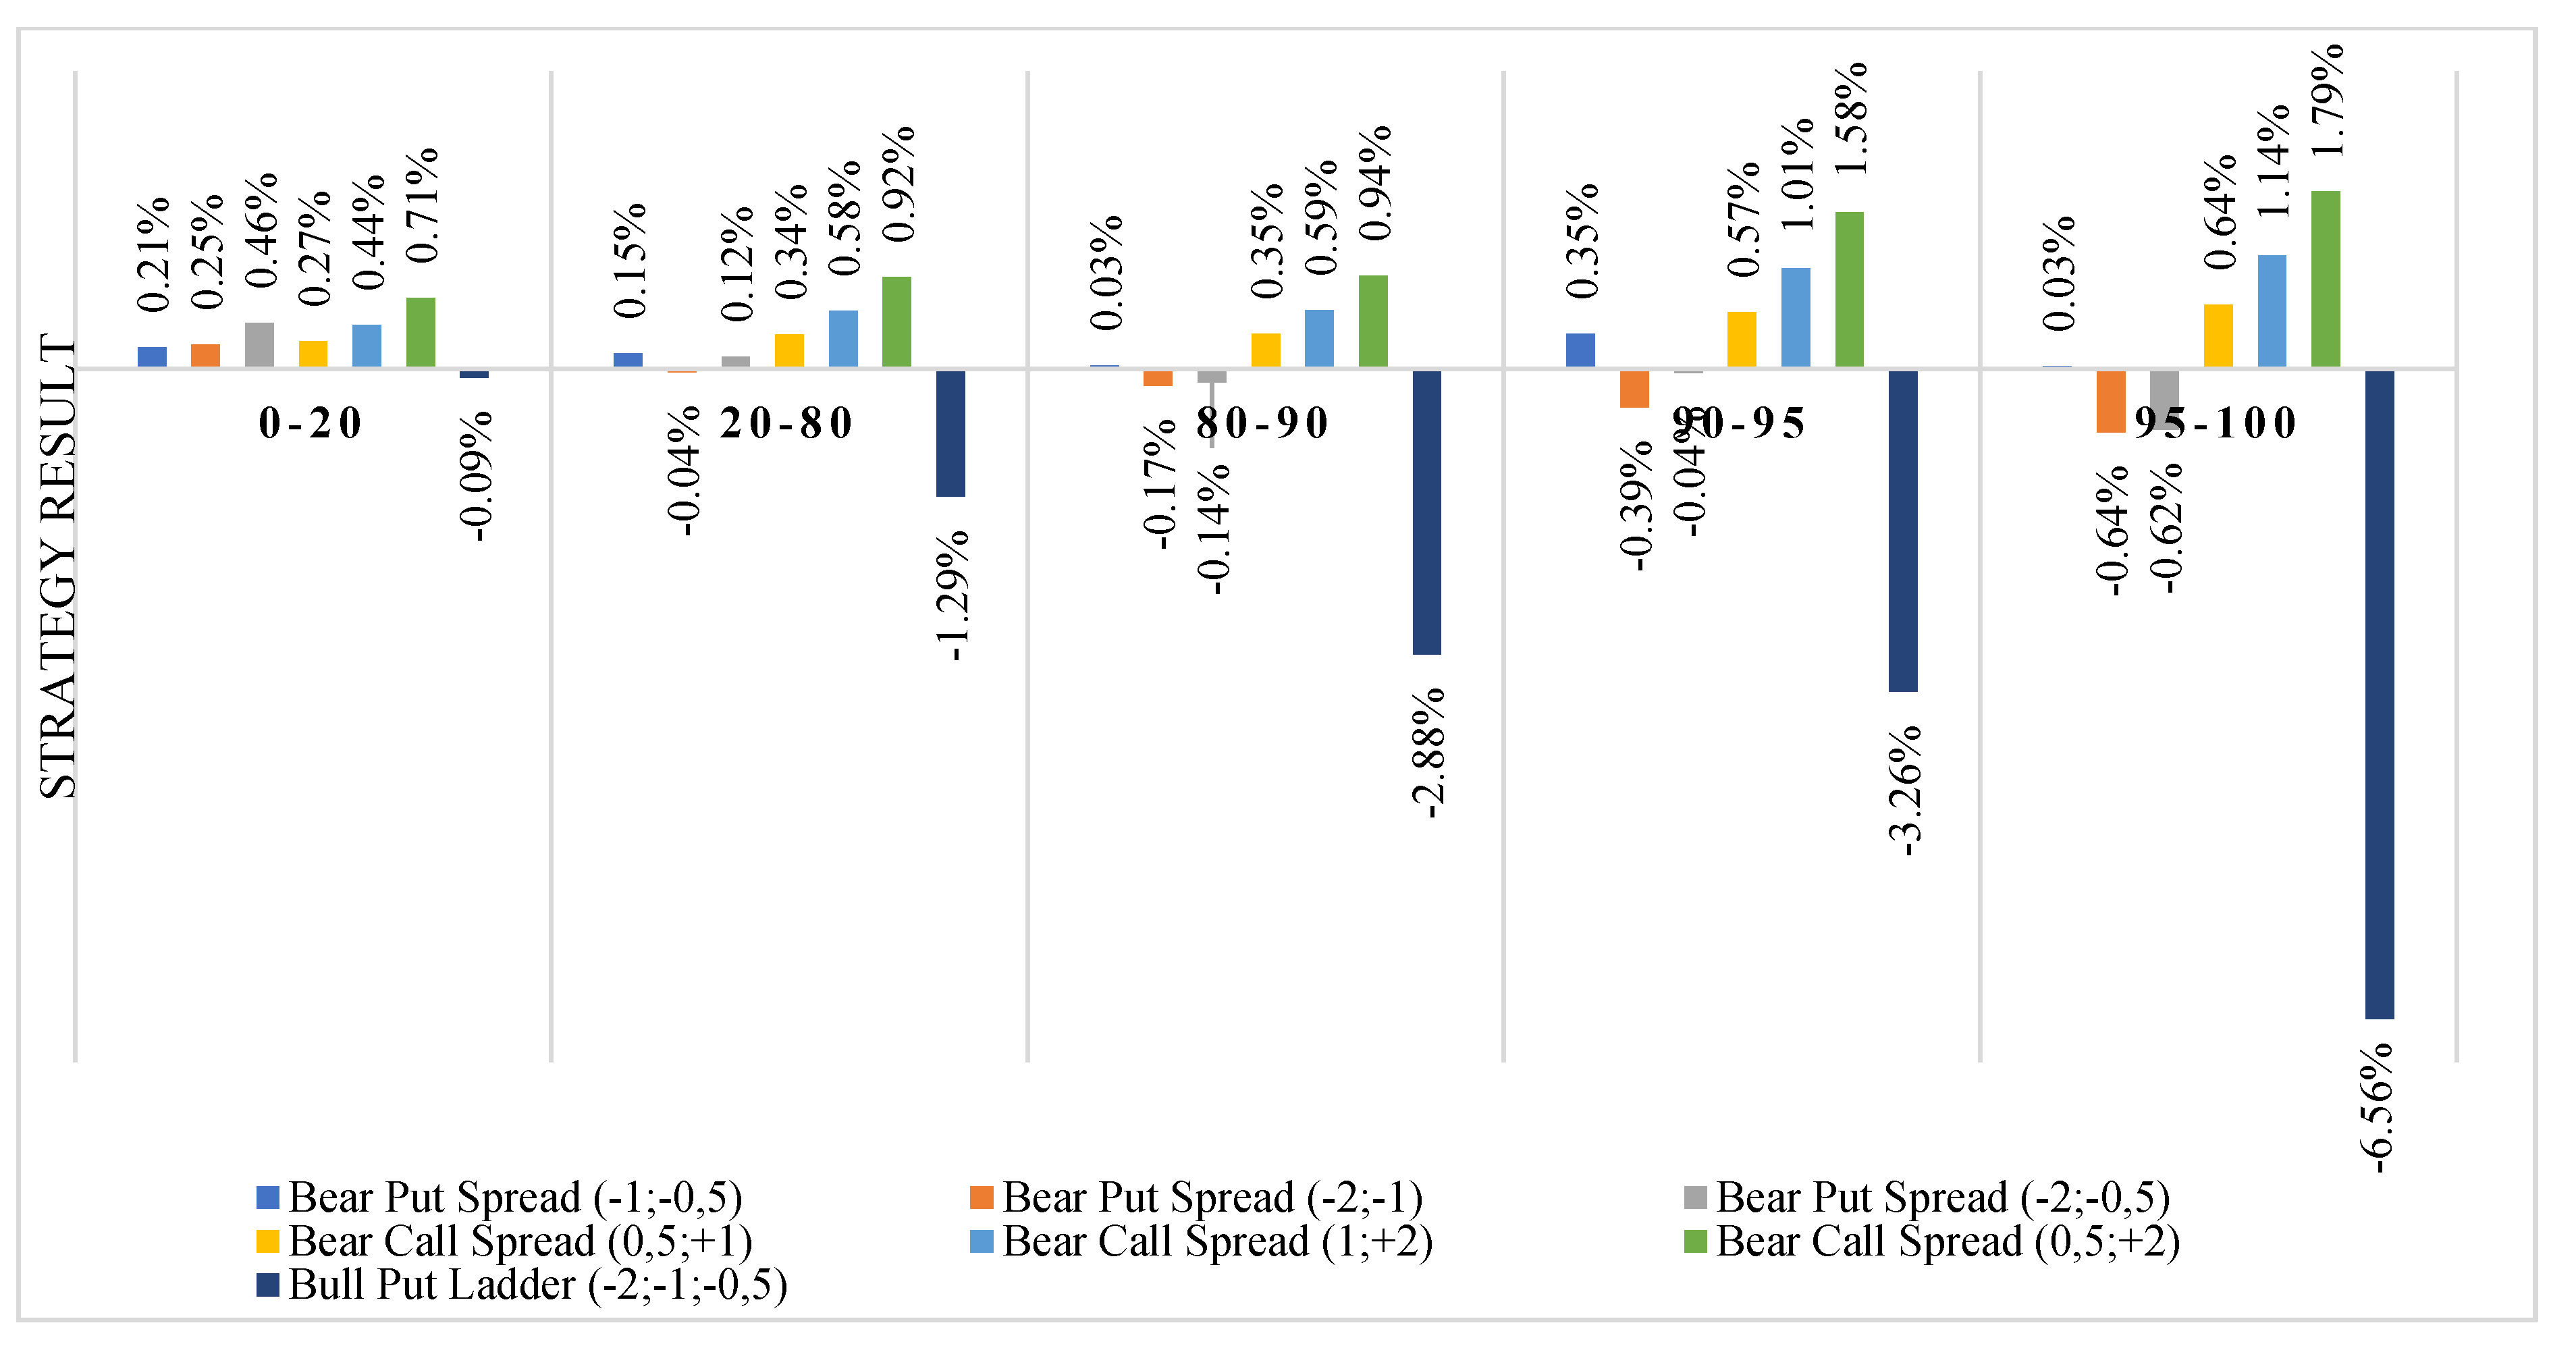
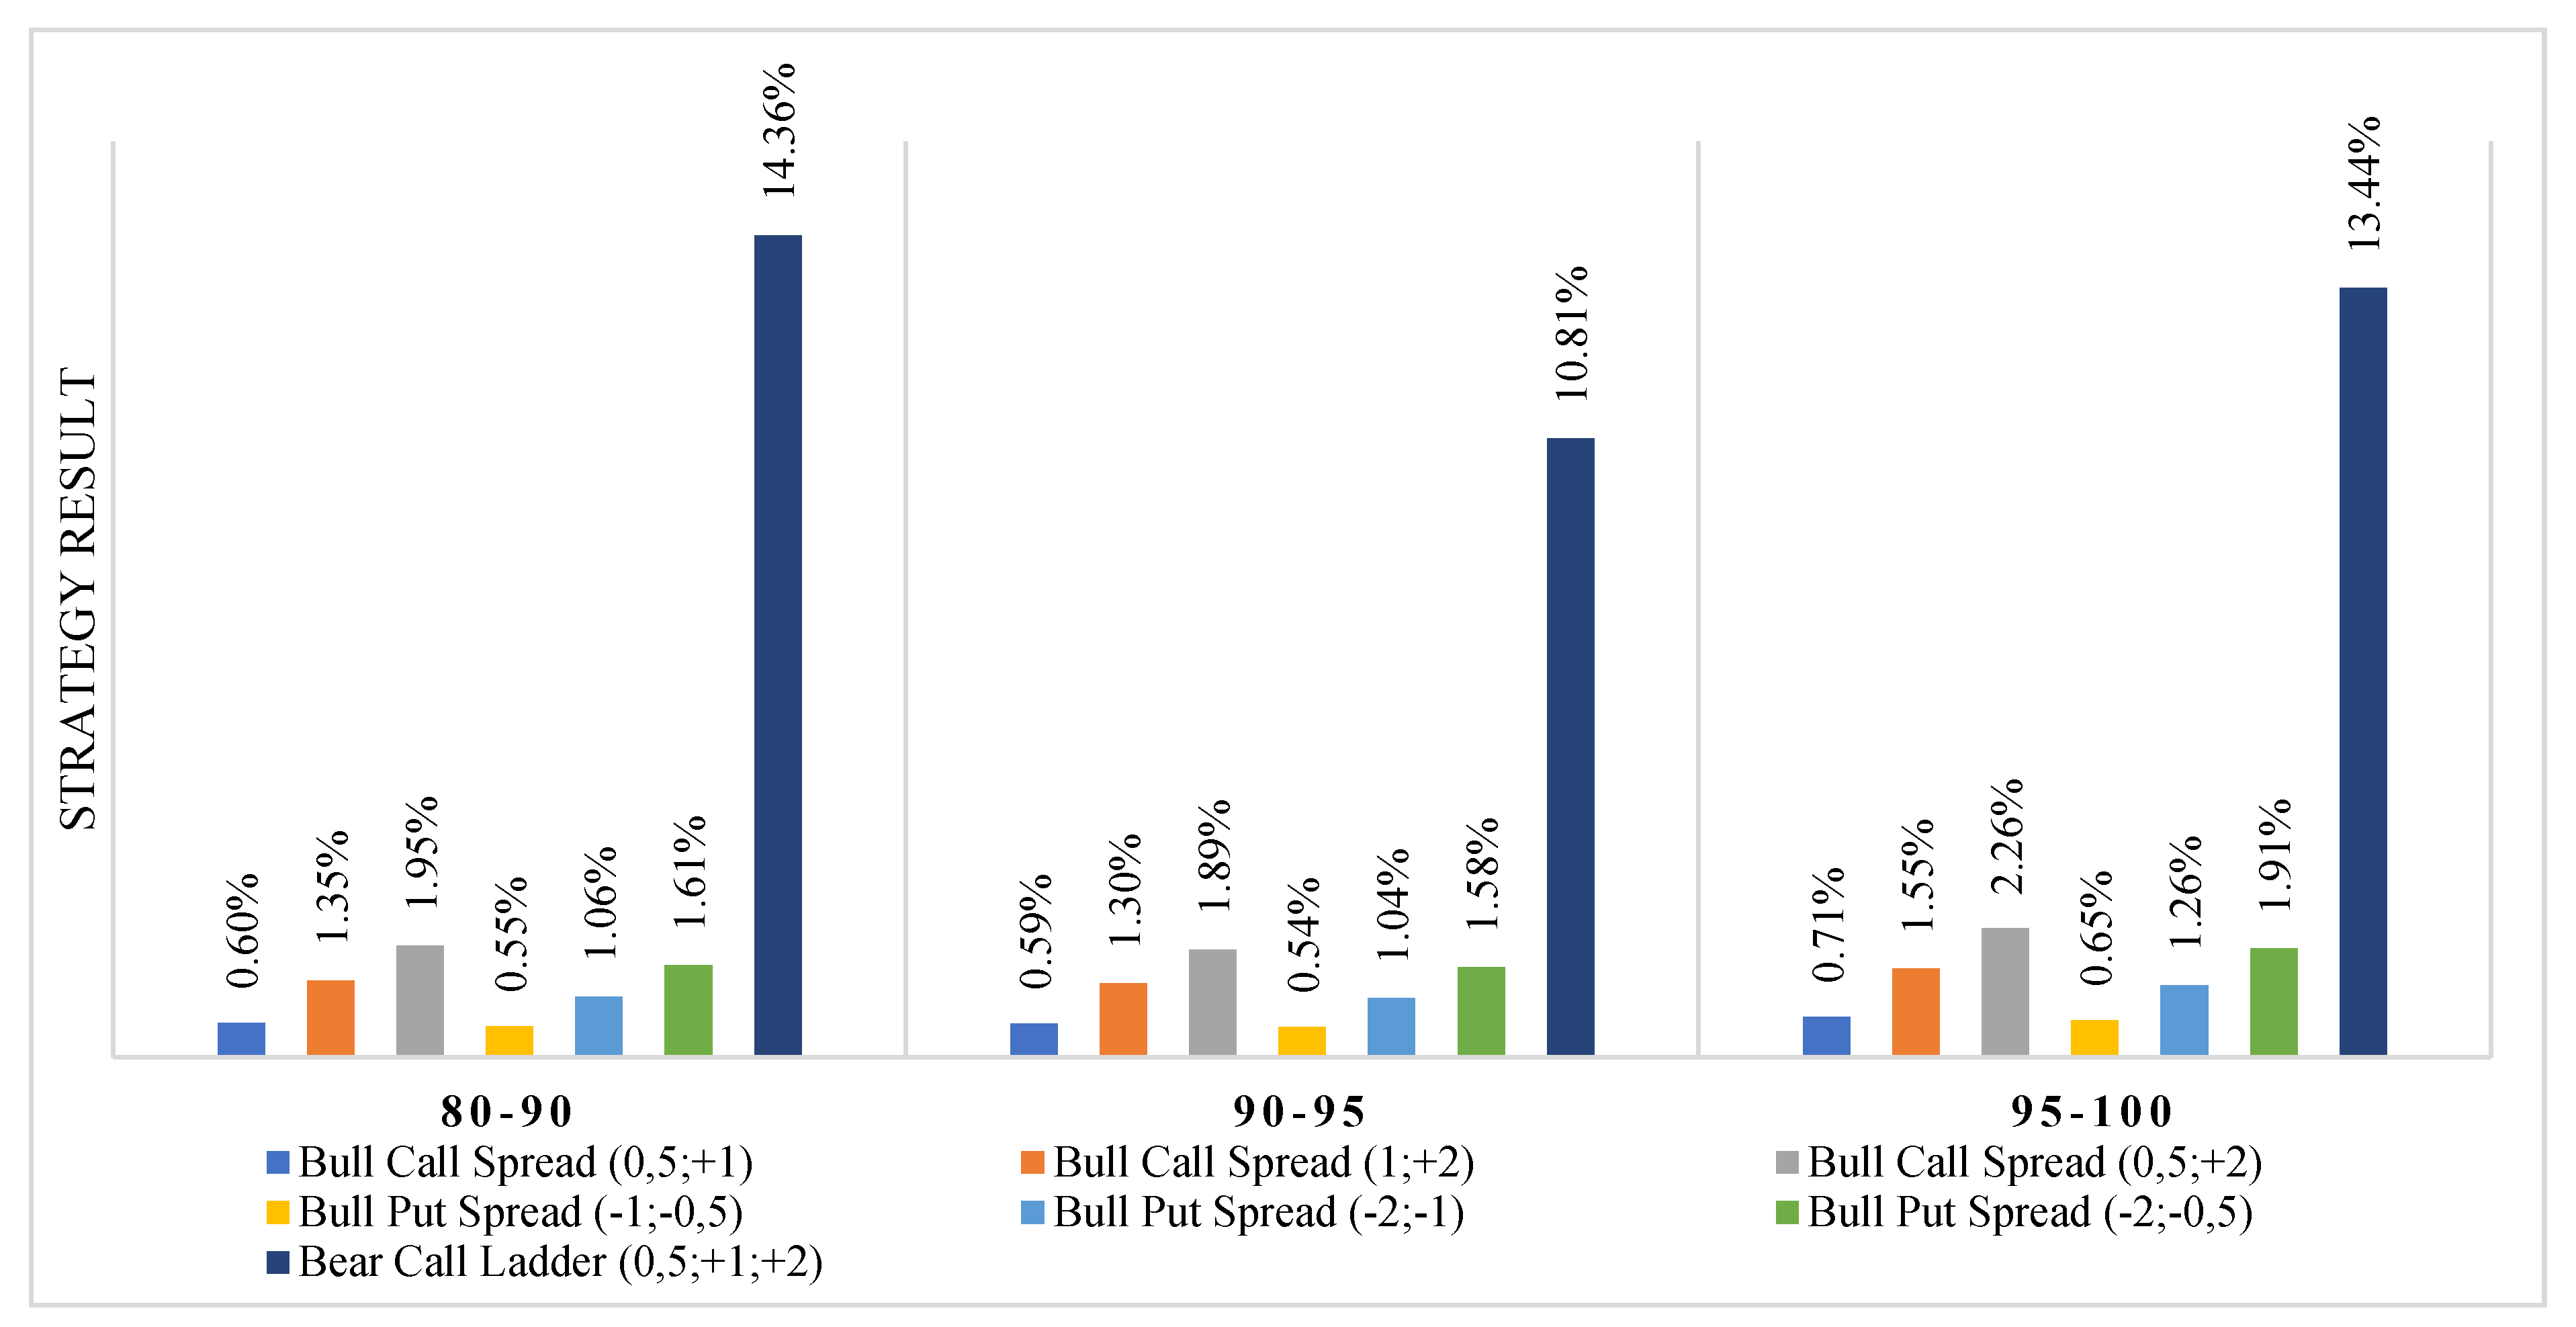
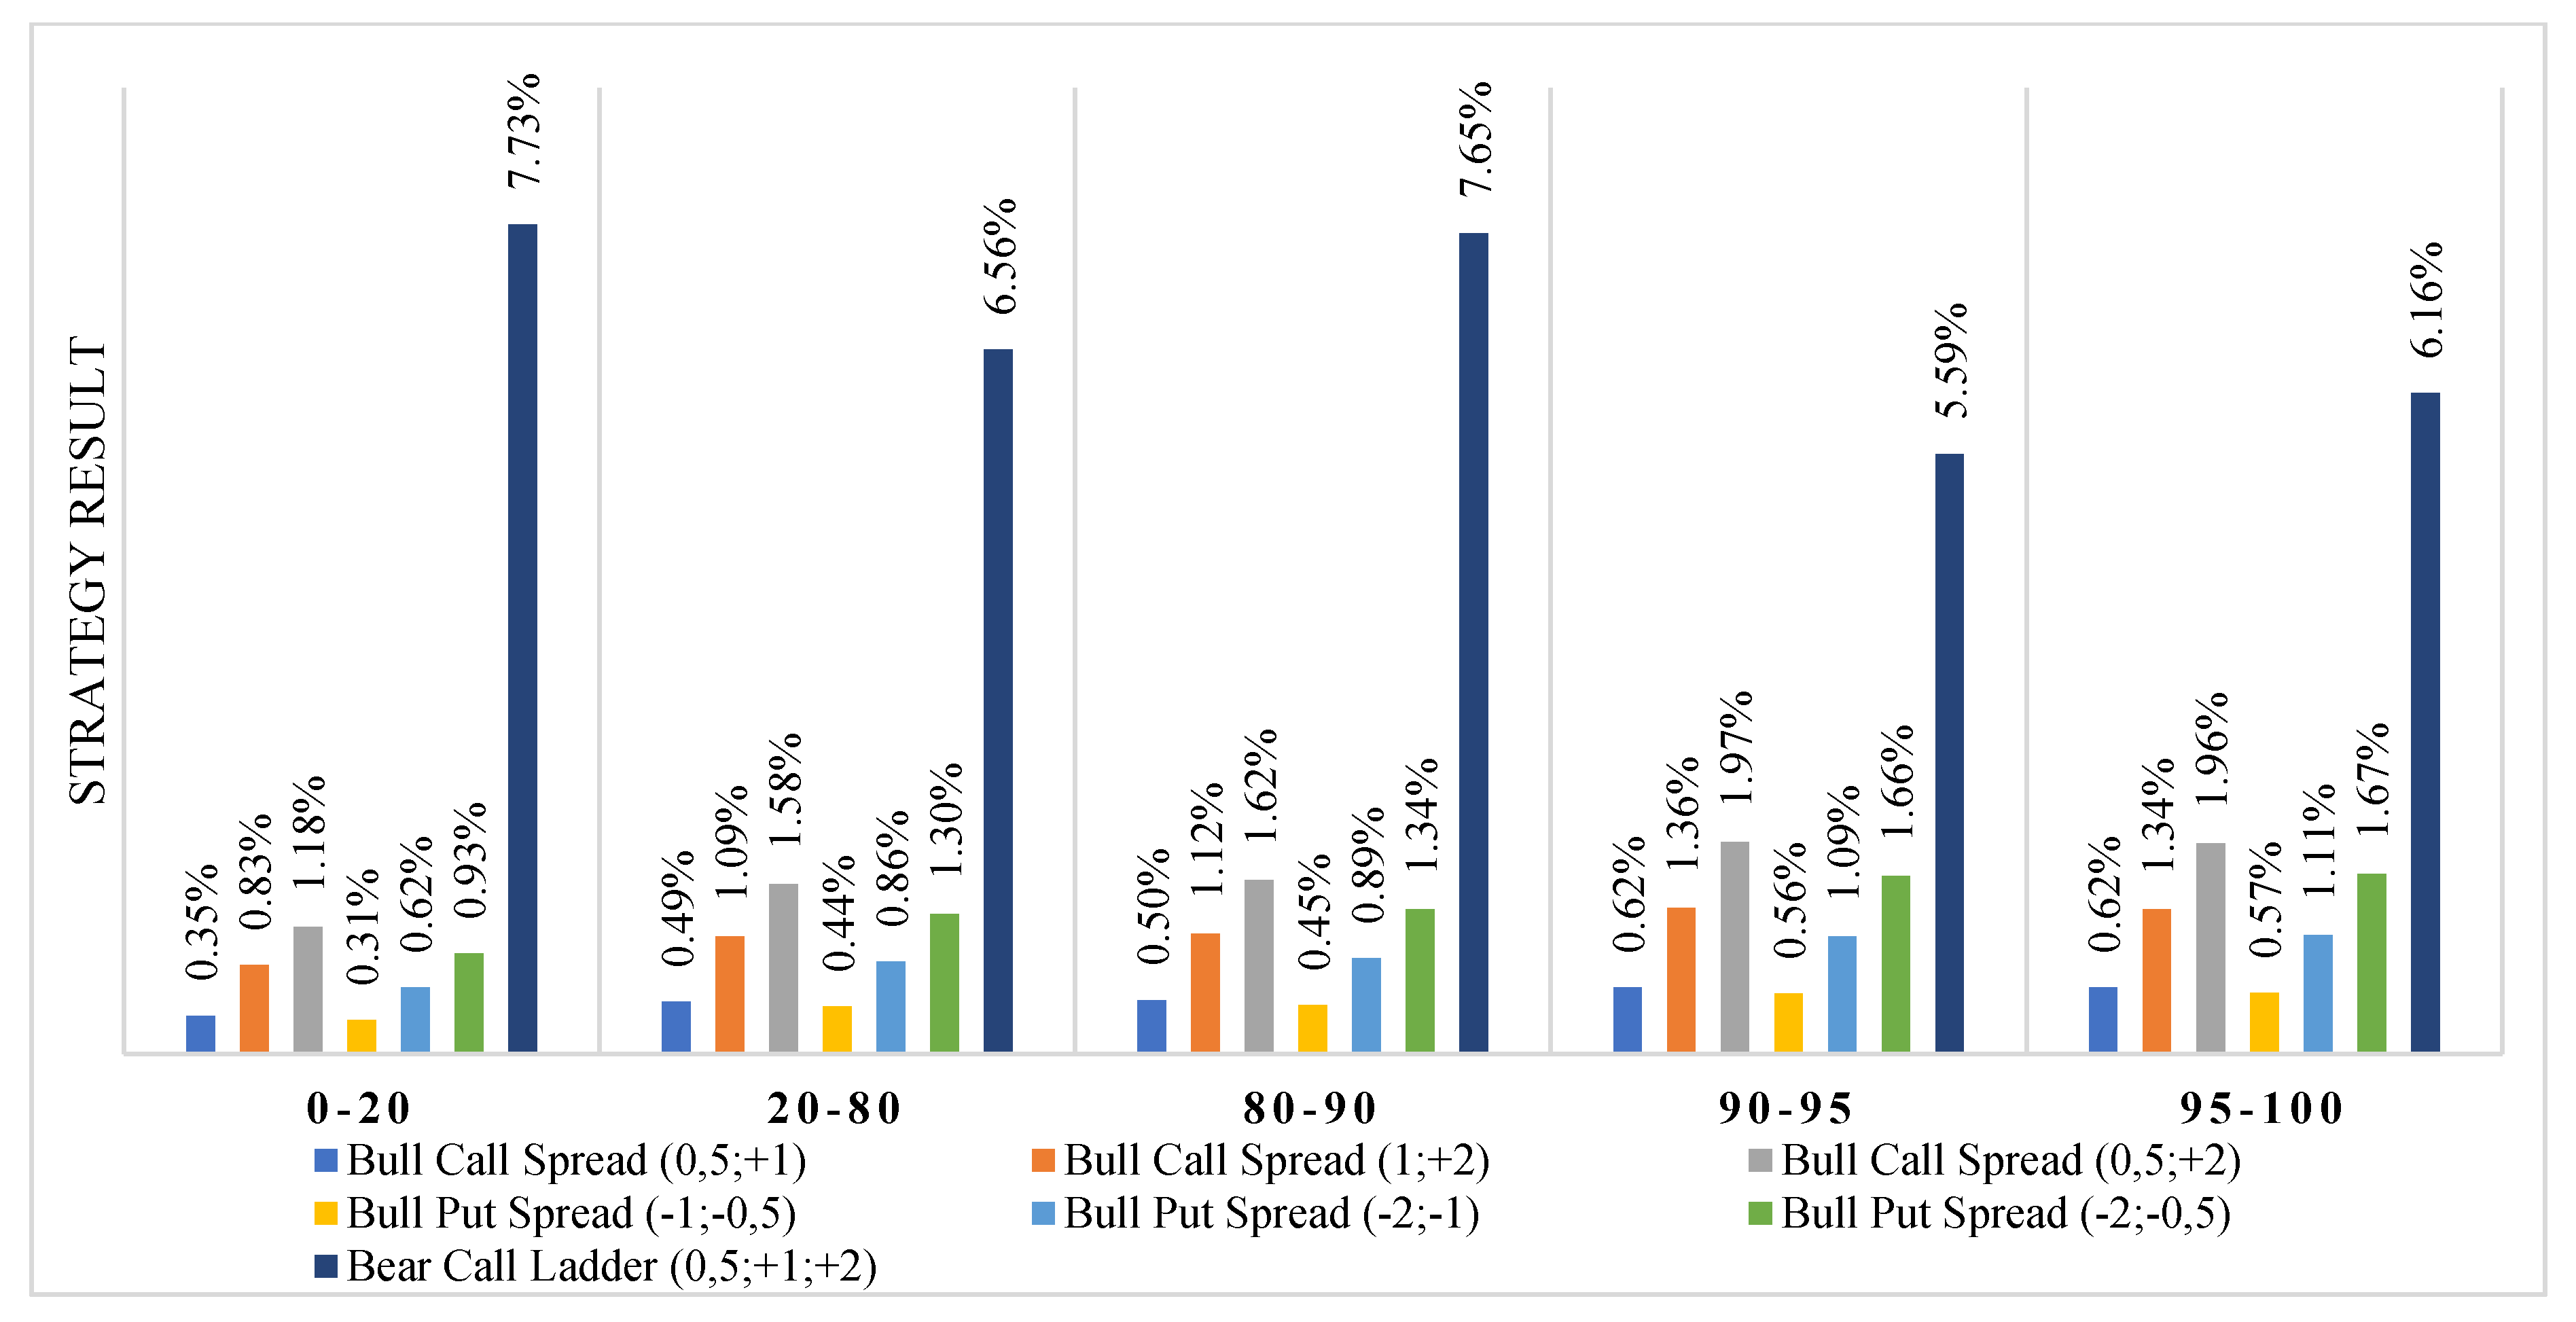
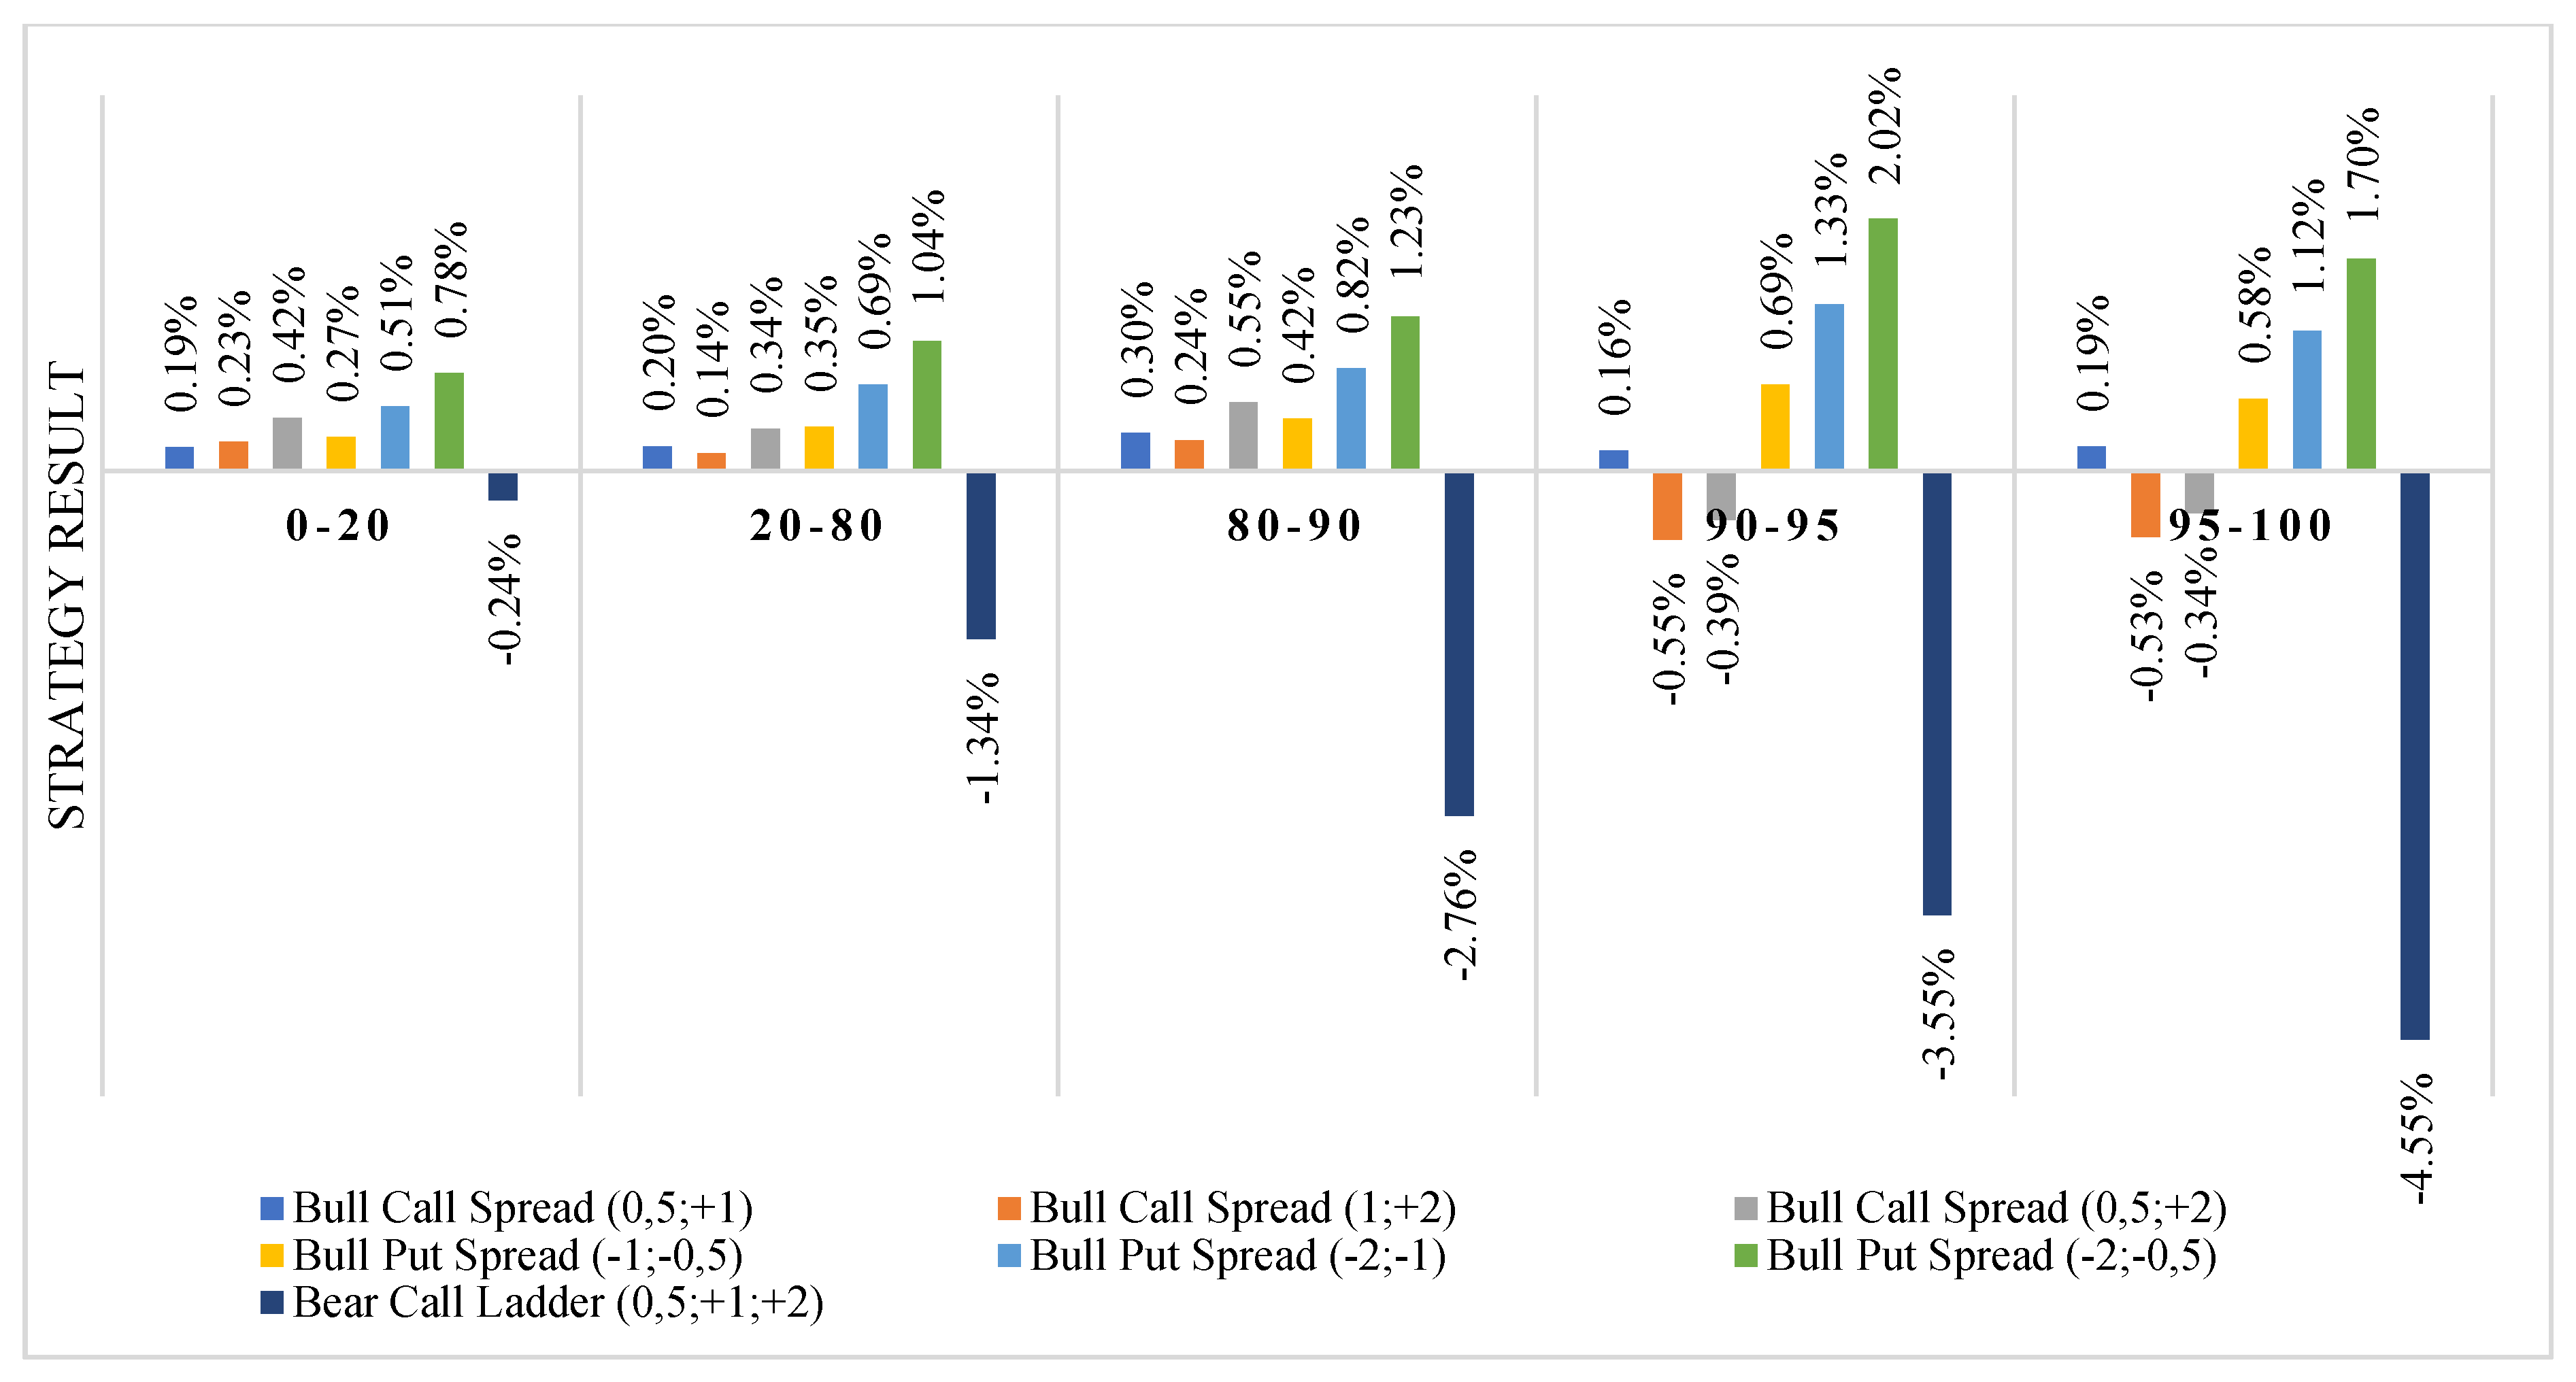
4.3. Strategies Final Results for Different Levels of Oil Price Changes
5. Conclusions and Future Research Directions
- (1)
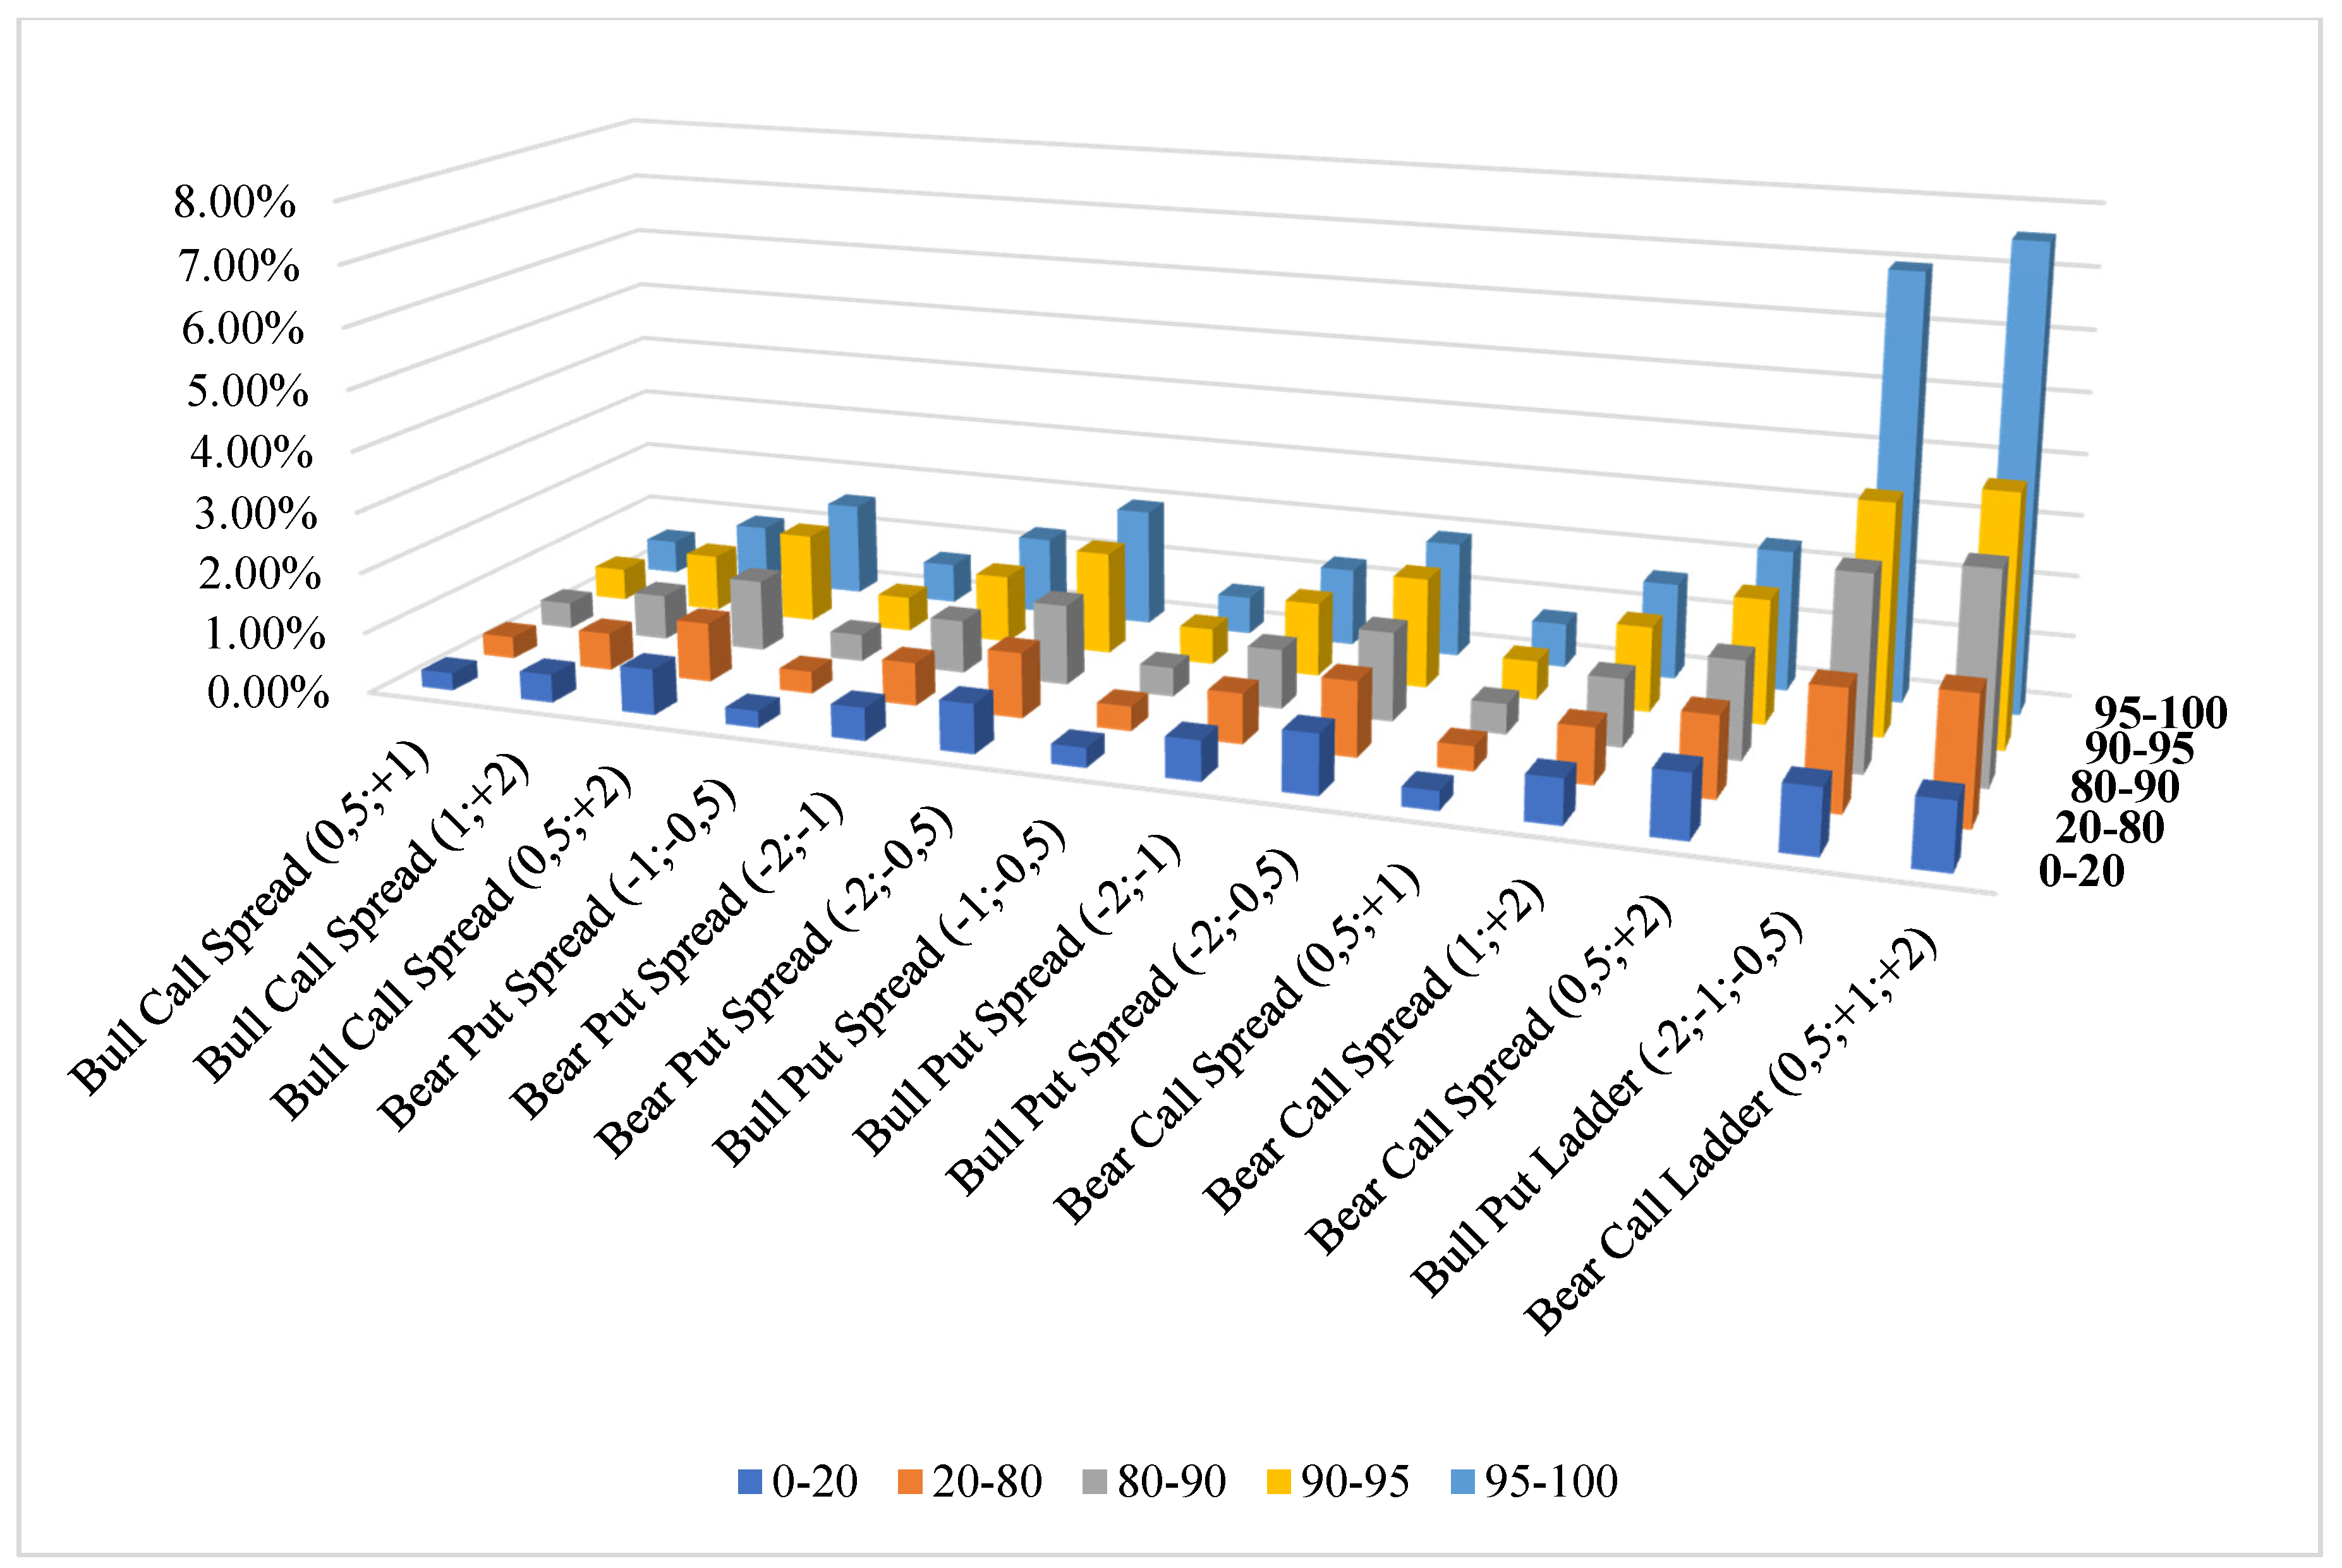
- The costs in the bull put ladder and bear call ladder (unlimited strategies) were very sensitive to the level of implied volatility. The ratio of the costs to the value of the option contract for the highest implied volatility levels (above the 95th percentile) was approximately seven times higher than that for the lowest levels (below the 20th percentile). In the case of unlimited strategies, the cost increase caused by the increase in implied volatility was much slower.
- (2)
- Smaller increases in costs with increasing implied volatility caused that in the categories 80–90, 90–95 and 95–100 the bear put spread, bear call spread, bull call spread, and bull put spread (limited strategies) were realized at a profit much more often than the unlimited strategies. In each category of volatility, there can be found two limited strategies in which all variants were realized with profits in more than 54% of observations. By comparison, bull put ladder strategies were more likely to lose than profit in each volatility category, whereas the bear call ladder strategy was more than 50% profitable only in the 90–95 categories.
- (3)
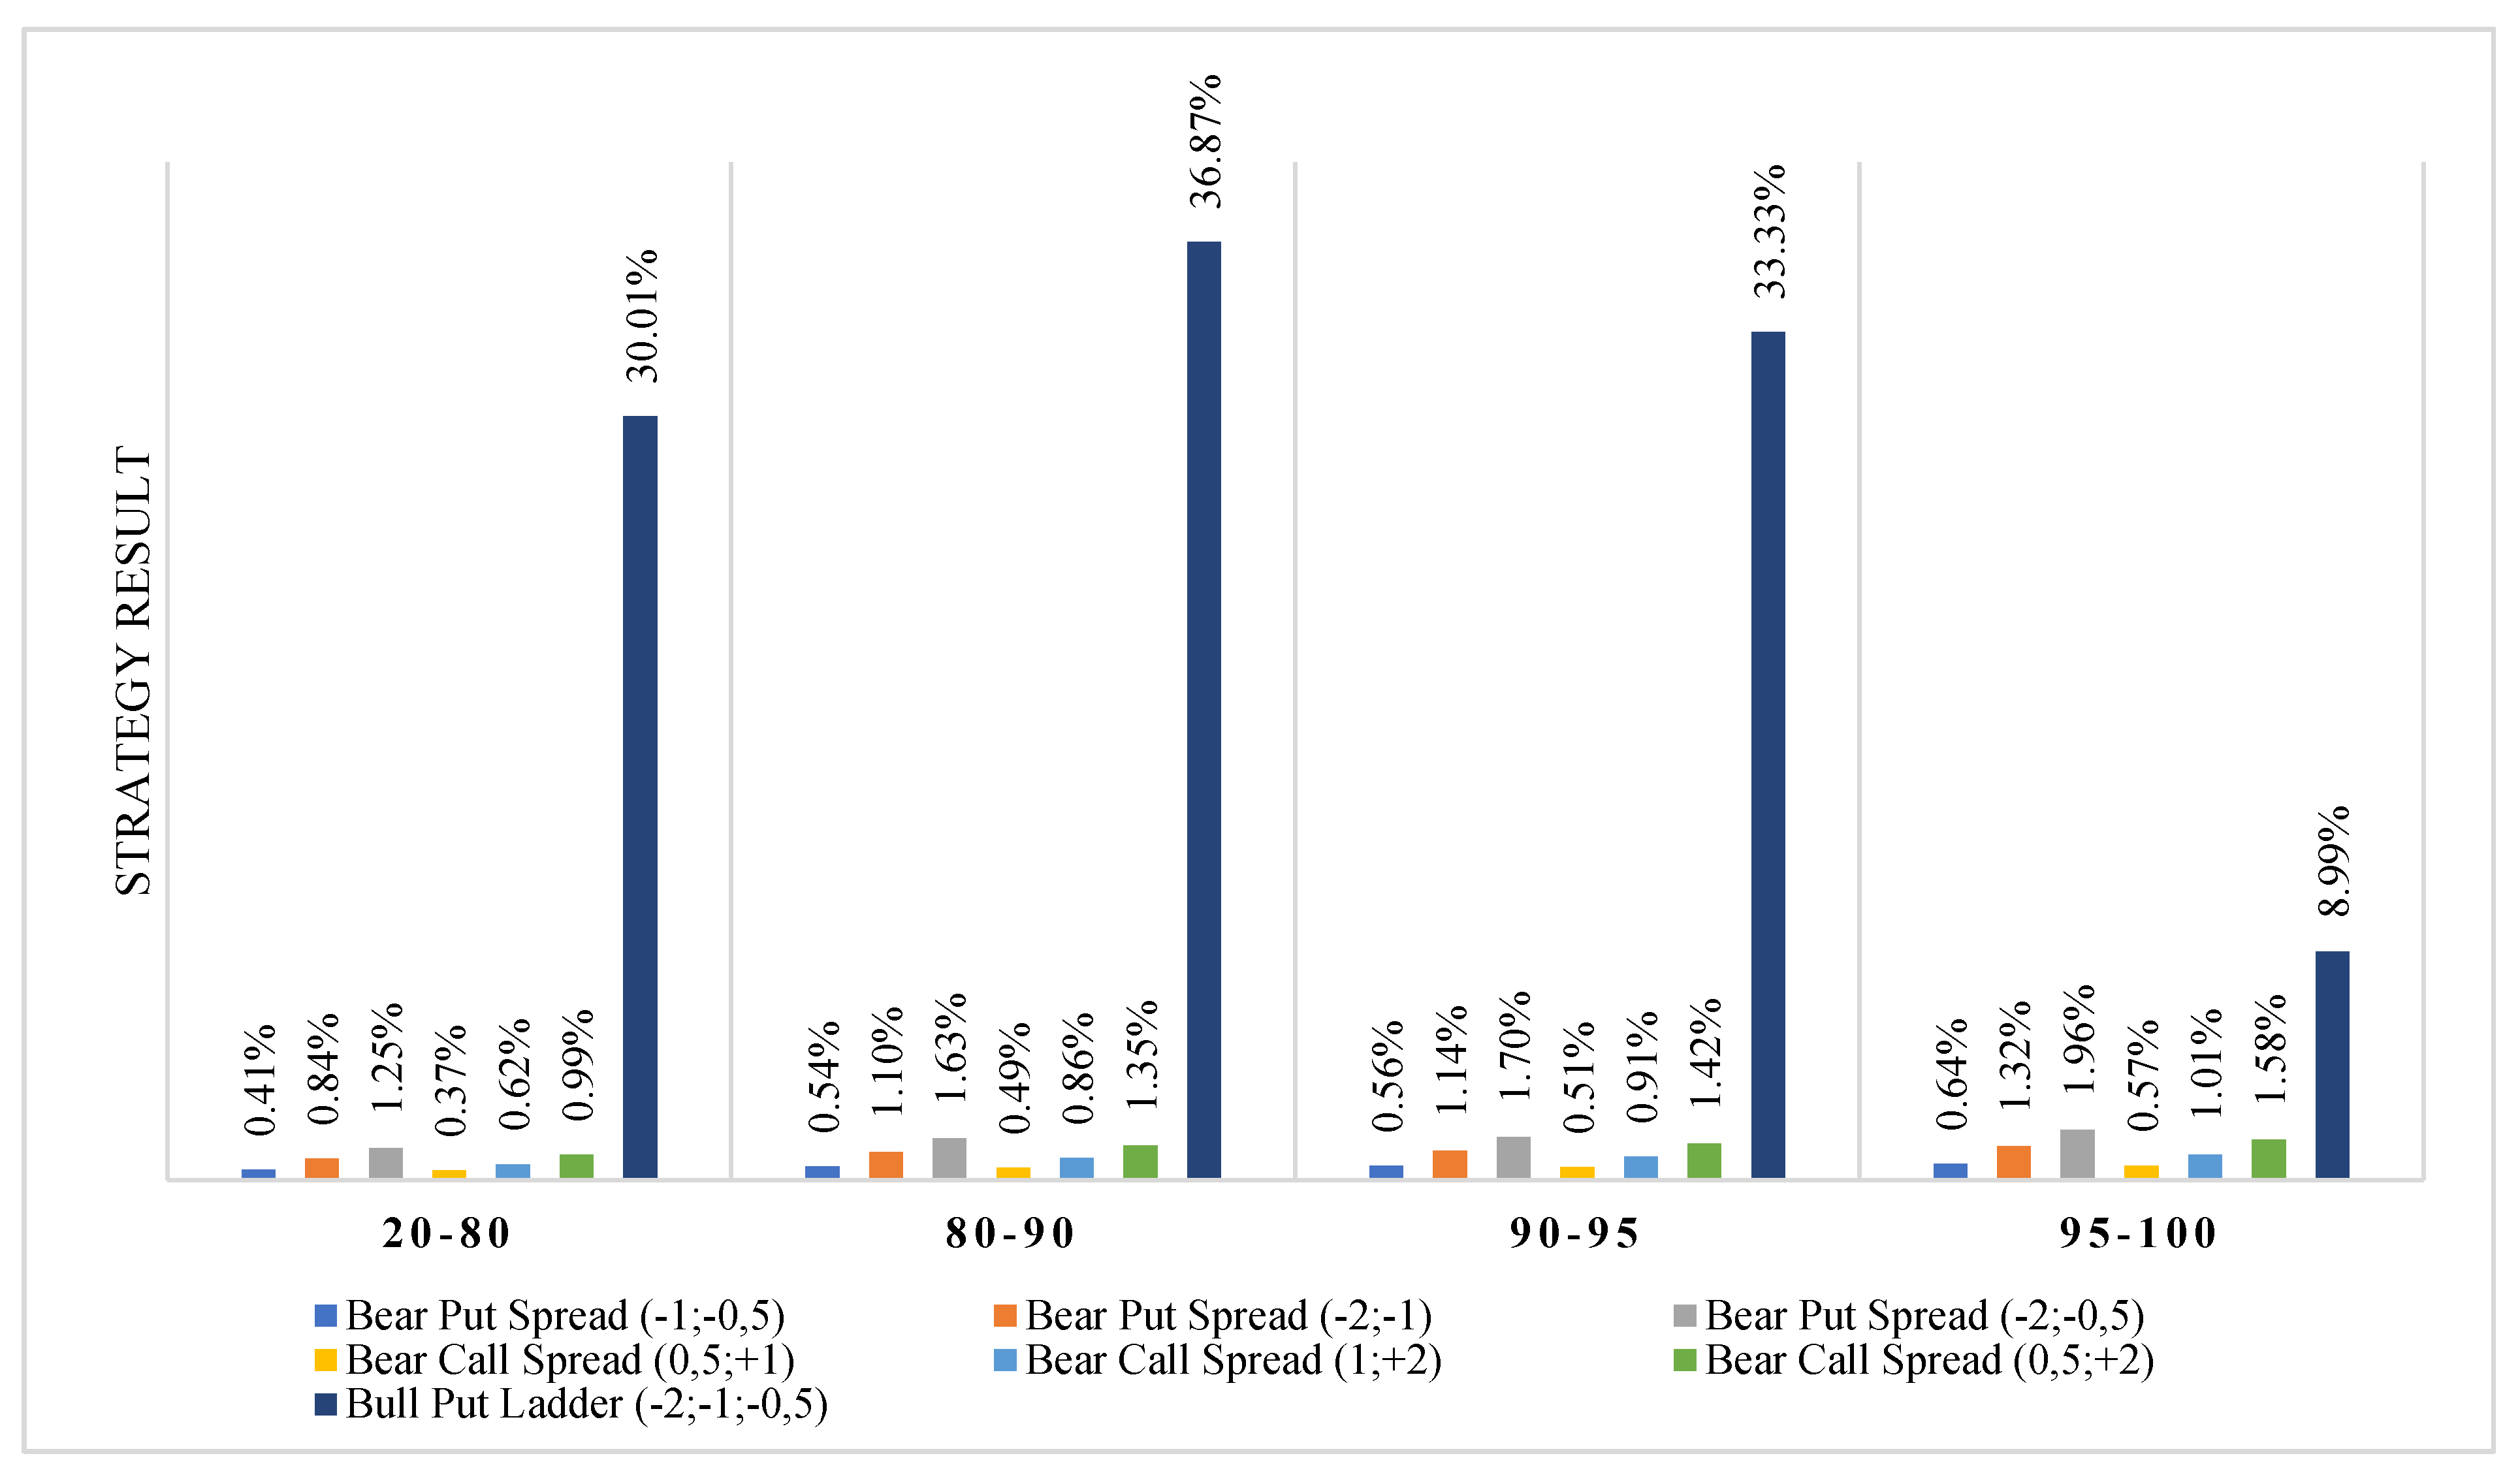
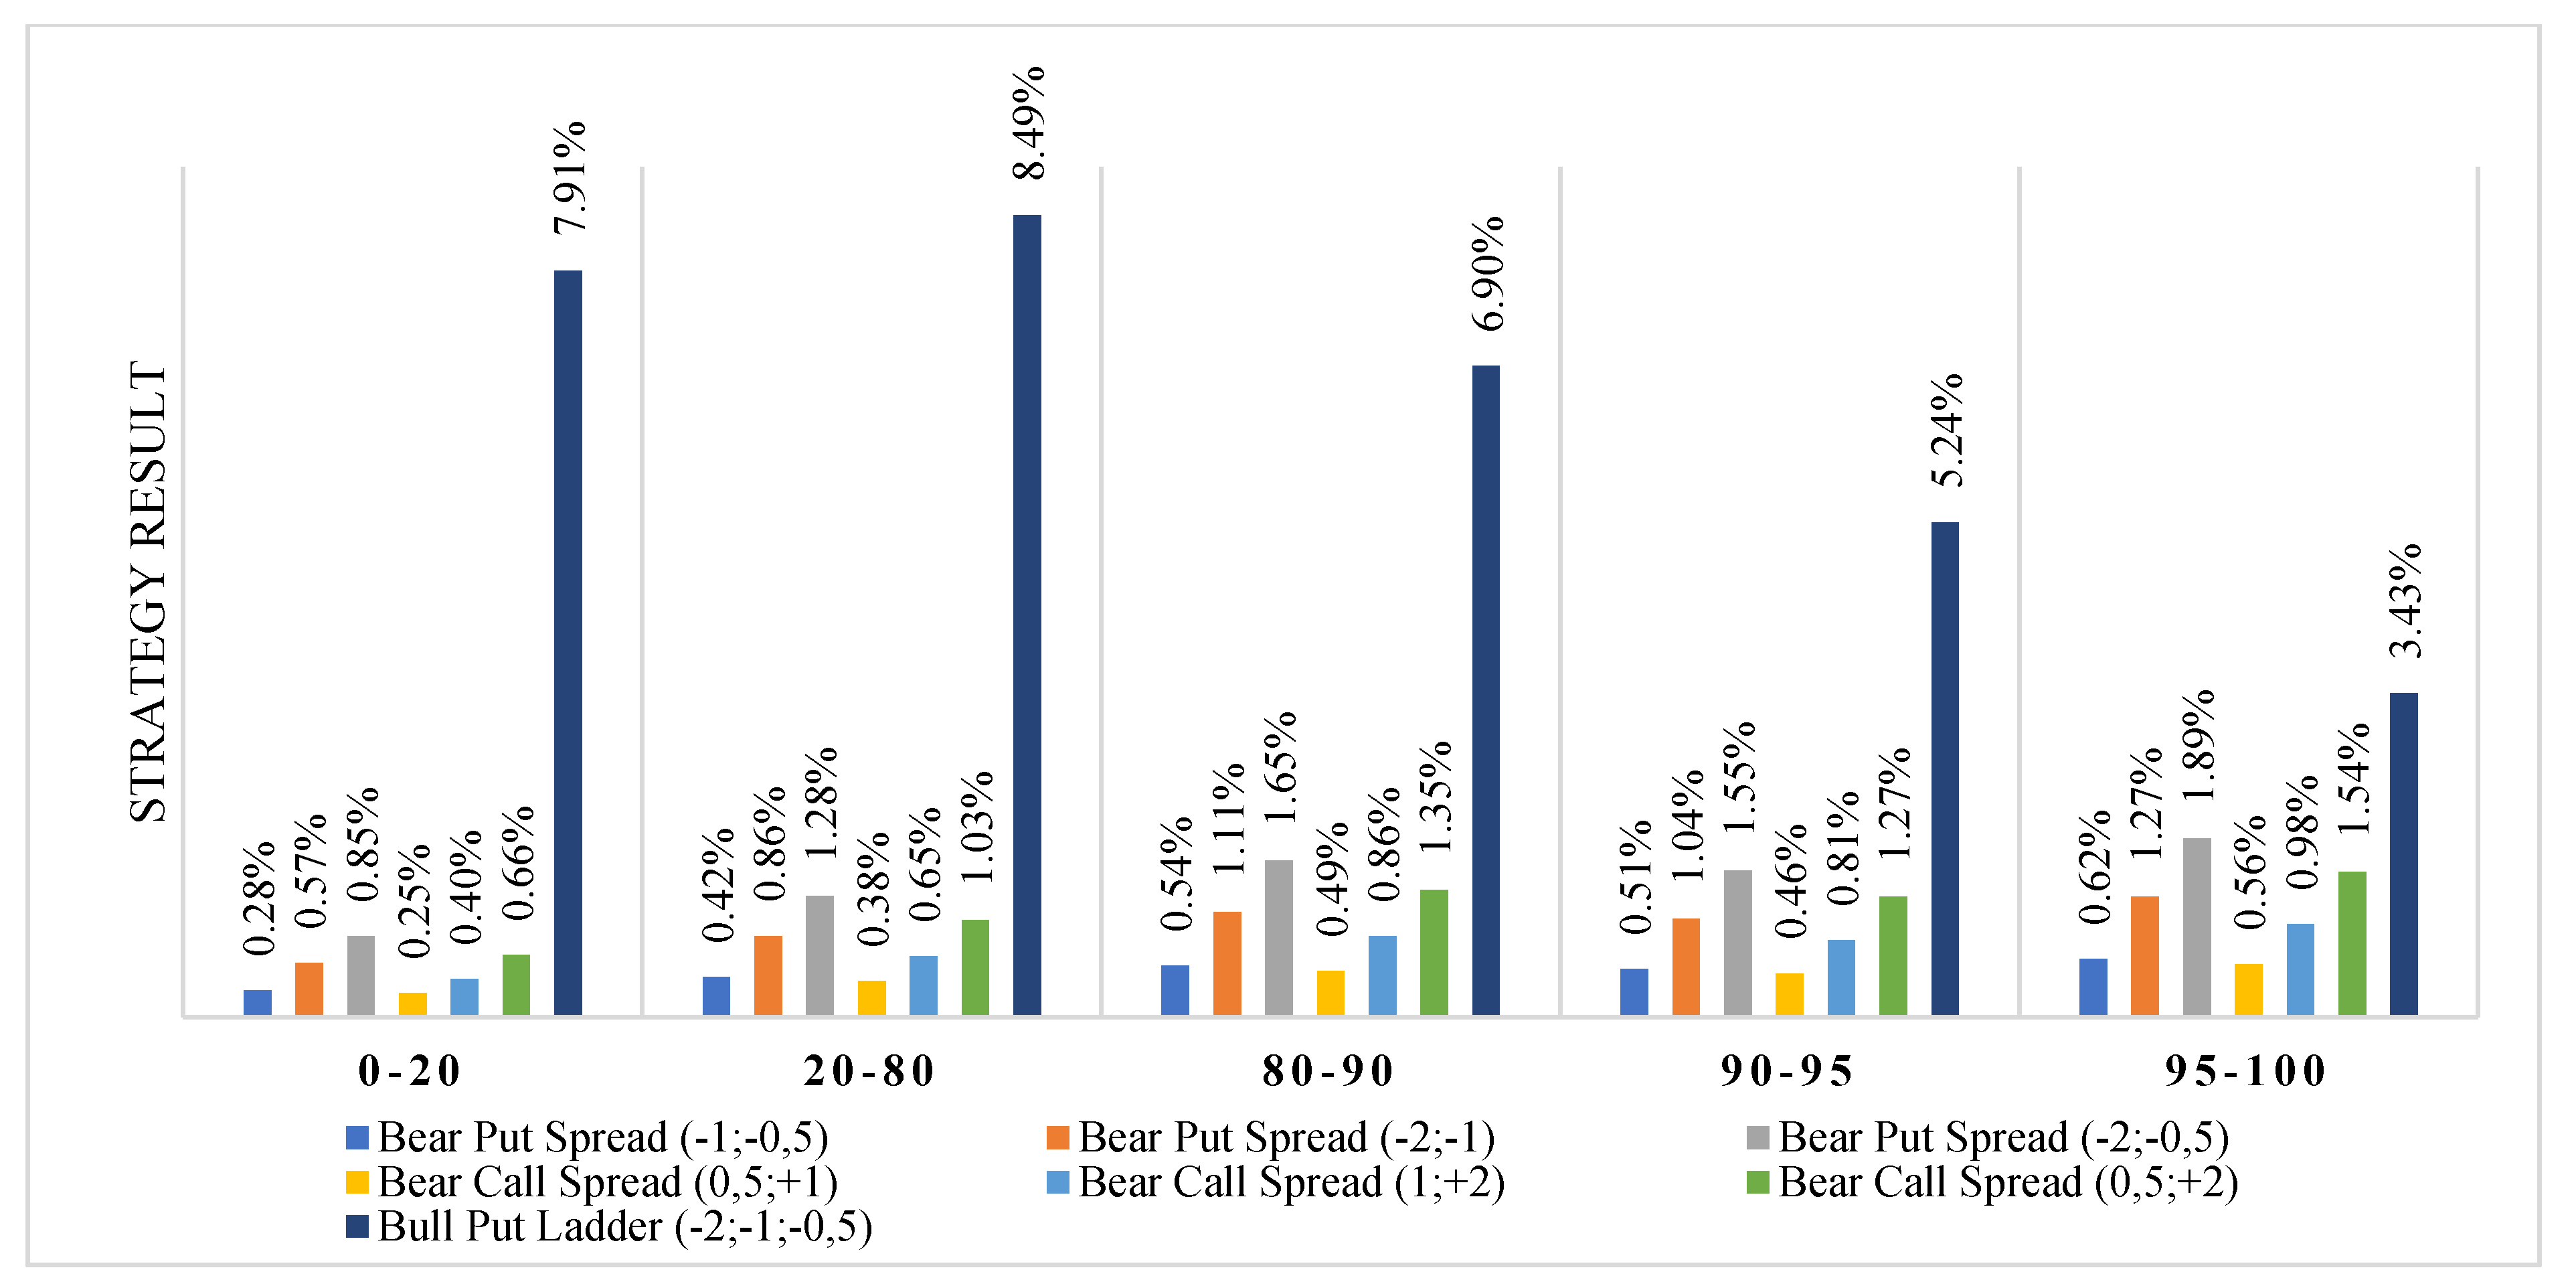
- The rates of return for unlimited strategies were by far the highest with significant oil price movements (exceeding 10%). However, due to the higher cost of acquisition (as compared with the limited strategies) of these strategies, it is recommended that they should be used when there are clear signals indicating large price changes. Such signals may include announcements of meetings of representatives of the OPEC+ group and their decisions to introduce the production limits (or to deviate from the limits).
- (4)
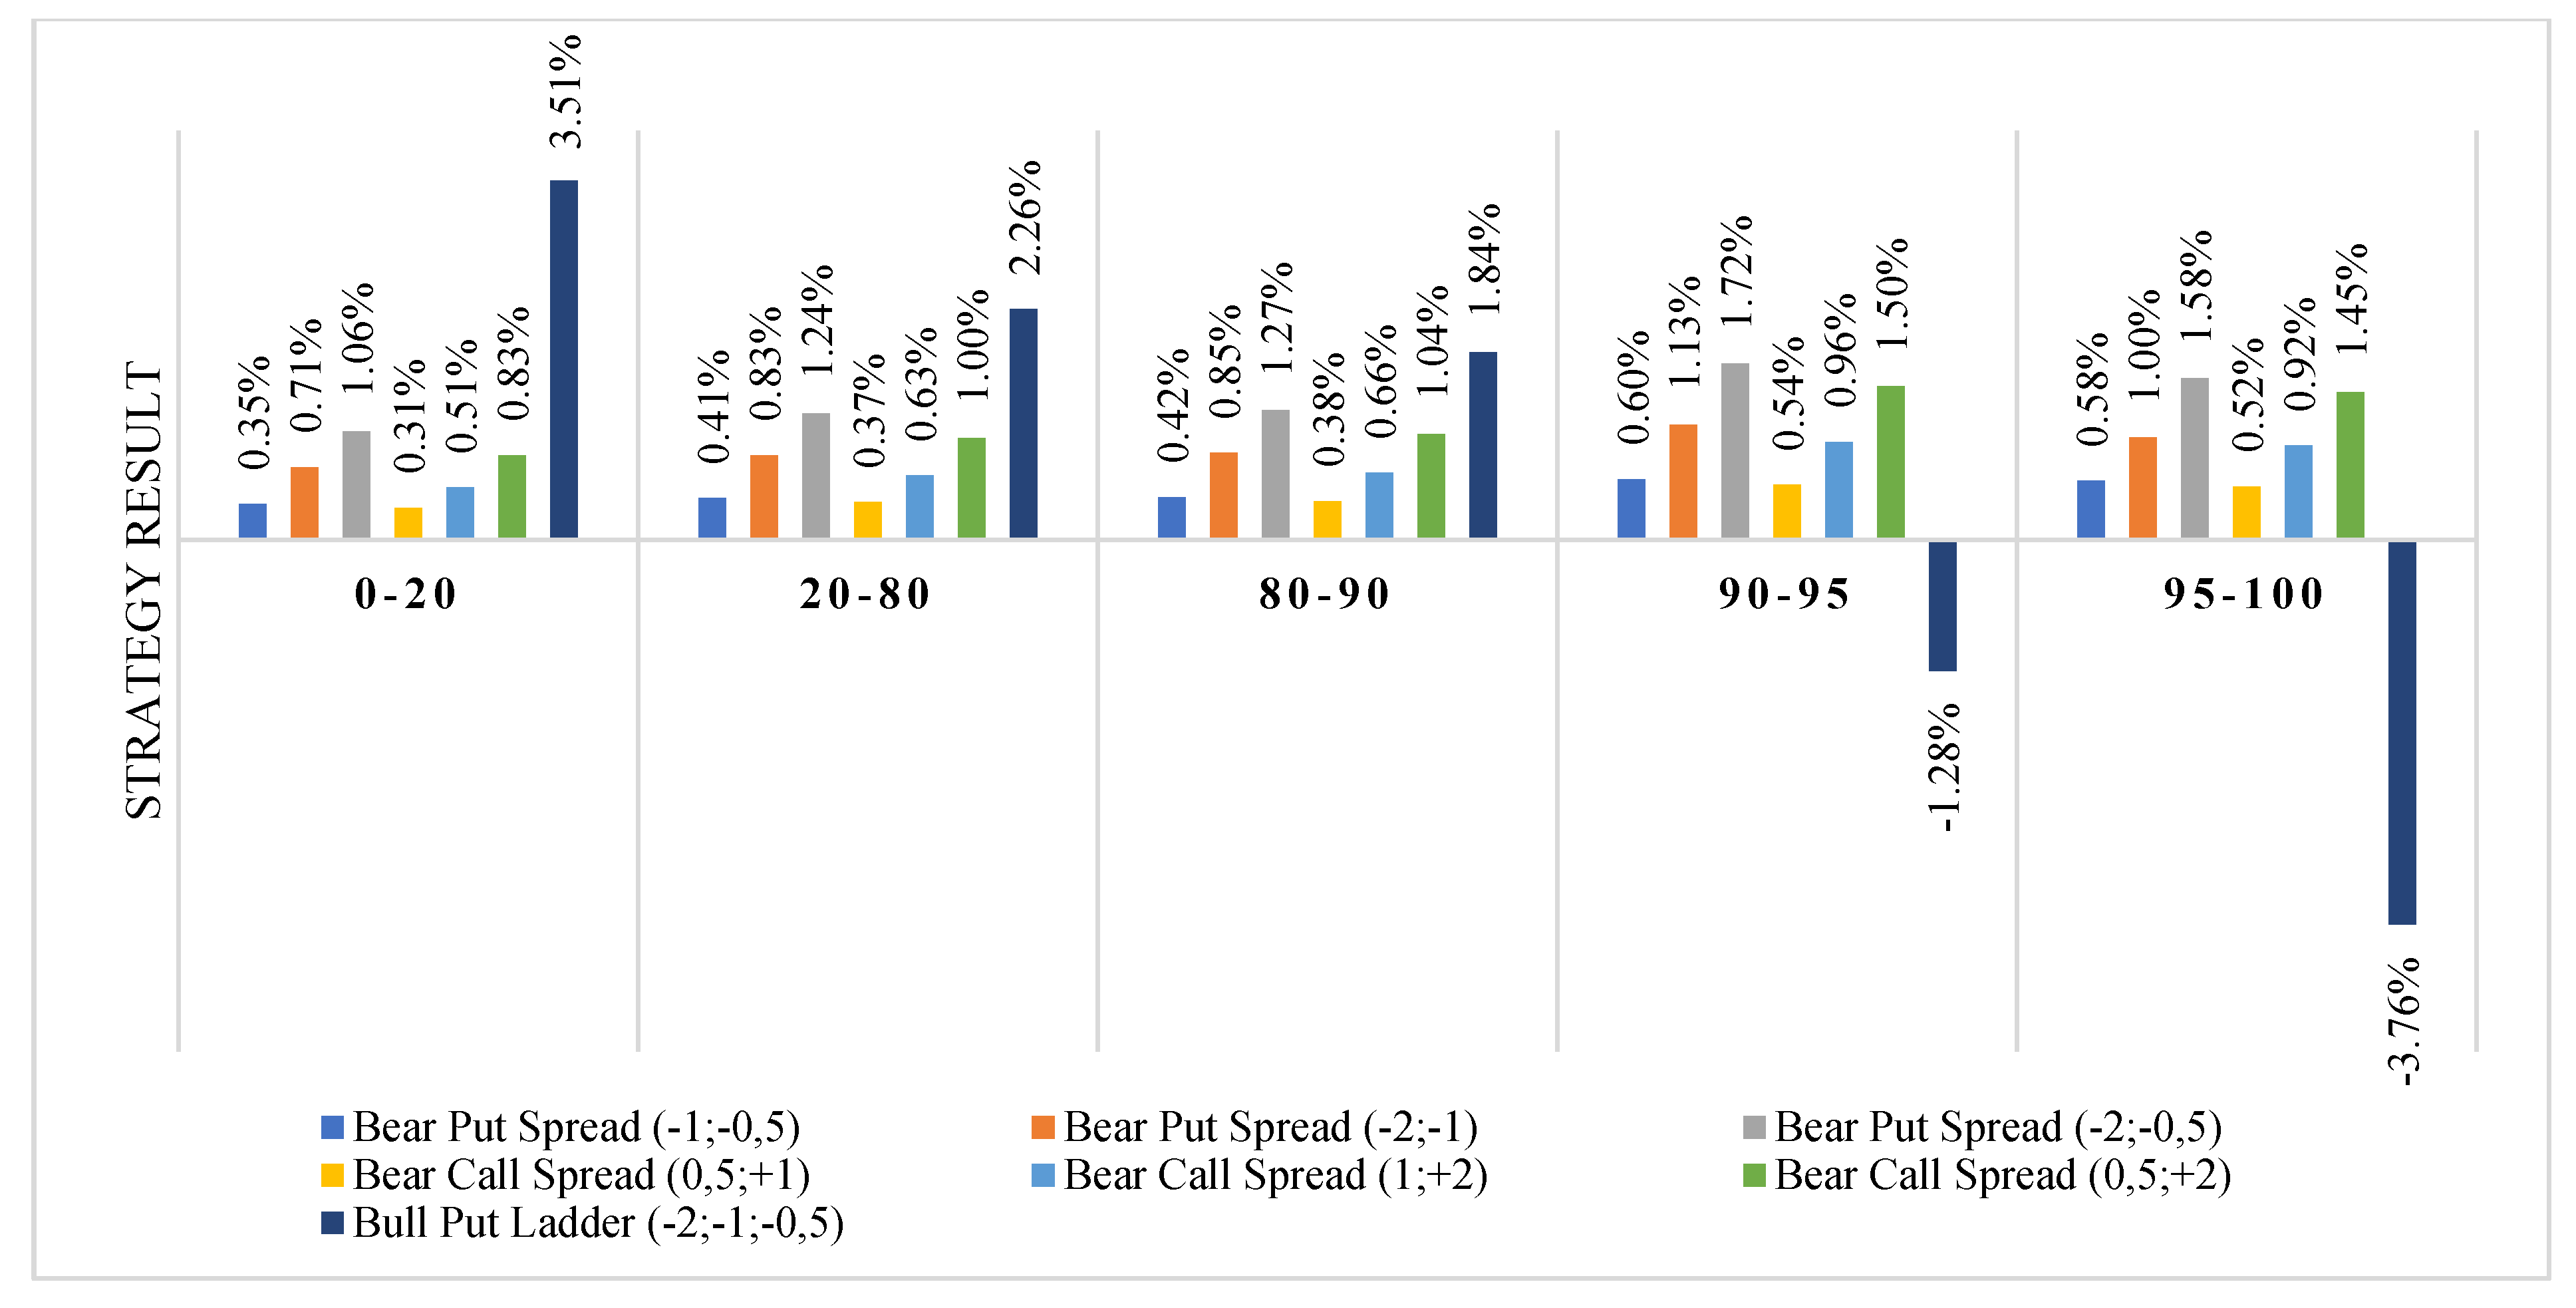
- For the expected slight changes in prices and a stable situation on the oil market, it is recommended to use net credit spread strategies (bear call in case of price drops and bull put in case of price increases). These strategies generate lower rates of return but protect against oil price fluctuations in the widest price ranges.
Author Contributions
Funding
Conflicts of Interest
Appendix A. Vertical Spread Option Strategy Costs

| Implied Volatility Category | |||||
|---|---|---|---|---|---|
| Variant | 0–20 | 20–80 | 80–90 | 90–95 | 95–100 |
| Bull Call Spread (0.5; +1) | 241.71 | 238.04 | 233.62 | 229.71 | 220.54 |
| Bull Call Spread (1; +2) | 387.90 | 399.56 | 401.55 | 405.38 | 388.45 |
| Bull Call Spread (0.5; +2) | 629.61 | 637.60 | 635.17 | 635.09 | 608.99 |
| Bear Put Spread (−1; −0.5) | 230.15 | 236.05 | 241.87 | 246.73 | 255.90 |
| Bear Put Spread (−2; −1) | 449.25 | 462.94 | 473.31 | 480.23 | 498.06 |
| Bear Put Spread (−2; −0.5) | 679.41 | 698.99 | 715.18 | 726.96 | 753.96 |
| Bull Put Spread (−1; −0.5) | 269.85 | 263.95 | 258.13 | 253.27 | 244.10 |
| Bull Put Spread (−2; −1) | 550.75 | 537.06 | 526.69 | 519.77 | 501.94 |
| Bull Put Spread (−2; −0.5) | 820.59 | 801.01 | 784.82 | 773.04 | 746.04 |
| Bear Call Spread (0.5; +1) | 258.29 | 261.96 | 266.38 | 270.29 | 279.46 |
| Bear Call Spread (1; +2) | 612.10 | 600.44 | 598.45 | 594.62 | 611.55 |
| Bear Call Spread (0.5; +2) | 870.39 | 862.40 | 864.83 | 864.91 | 891.01 |
| Bull Put Ladder (−2; −1; −0.5) | 937.86 | 1408.12 | 1859.54 | 1676.87 | 2760.30 |
| Bear Call Ladder (0.5; +1; +2) | 960.86 | 1483.93 | 1991.29 | 1814.12 | 2970.01 |
| Implied Volatility Category | |||||
|---|---|---|---|---|---|
| Variant | 0–20 | 20–80 | 80–90 | 90–95 | 95–100 |
| Bull Call Spread (0.5; +1) | 0.29% | 0.36% | 0.43% | 0.54% | 0.56% |
| Bull Call Spread (1; +2) | 0.46% | 0.62% | 0.75% | 0.95% | 1,00% |
| Bull Call Spread (0.5; +2) | 0.75% | 0.98% | 1.18% | 1.49% | 1.56% |
| Bear Put Spread (−1; −0.5) | 0.28% | 0.36% | 0.45% | 0.58% | 0.67% |
| Bear Put Spread (−2; −1) | 0.53% | 0.71% | 0.88% | 1.13% | 1.3% |
| Bear Put Spread (−2; −0.5) | 0.81% | 1.07% | 1.33% | 1.71% | 1.96% |
| Bull Put Spread (−1; −0.5) | 0.32% | 0.4% | 0.48% | 0.59% | 0.63% |
| Bull Put Spread (−2; −1) | 0.66% | 0.82% | 0.98% | 1.22% | 1.29% |
| Bull Put Spread (−2; −0.5) | 0.98% | 1.22% | 1.45% | 1.82% | 1.92% |
| Bear Call Spread (0.5; +1) | 0.31% | 0.4% | 0.49% | 0.64% | 0.73% |
| Bear Call Spread (1; +2) | 0.73% | 0.91% | 1.1% | 1.4% | 1.59% |
| Bear Call Spread (0.5; +2) | 1.04% | 1.31% | 1.6% | 2.03% | 2.32% |
| Bull Put Ladder (−2; −1; −0.5) | 1.05% | 1.93% | 3.14% | 3.76% | 6.99% |
| Bear Call Ladder (0.5; +1; +2) | 1.08% | 2.06% | 3.39% | 4.09% | 7.57% |
Appendix B. Vertical Spread Option Strategy Results
| Bear Put Spread (−1; −0.5) | Bear Put Spread (−2; −1) | Bear Put Spread (−2; −0.5) | Bear Call Spread (0.5; +1) | Bear Call Spread (1; +2) | Bear Call Spread (0.5; +2) | Bull Put Ladder (−2; −1; −0.5) | Category of Price Changes | Category of IV | Number of Observations |
|---|---|---|---|---|---|---|---|---|---|
| 0.41% | 0.84% | 1.25% | 0.37% | 0.62% | 0.99% | 30.01% | (−∞; −20%) | 20–80 | 14 |
| 0.54% | 1.1% | 1.63% | 0.49% | 0.86% | 1.35% | 36.87% | (−∞; −20%) | 80–90 | 4 |
| 0.56% | 1.14% | 1.7% | 0.51% | 0.91% | 1.42% | 33.33% | (−∞; −20%) | 90–95 | 5 |
| 0.64% | 1.32% | 1.96% | 0.57% | 1.01% | 1.58% | 8.99% | (−∞; −20%) | 95–100 | 11 |
| 0.28% | 0.57% | 0.85% | 0.25% | 0.4% | 0.66% | 7.91% | [20%; −10%) | 0–20 | 18 |
| 0.42% | 0.86% | 1.28% | 0.38% | 0.65% | 1.03% | 8.49% | [−20%; −10%) | 20–80 | 137 |
| 0.54% | 1.11% | 1.65% | 0.49% | 0.86% | 1.35% | 6.9% | [−20%; −10%) | 80–90 | 34 |
| 0.51% | 1.04% | 1.55% | 0.46% | 0.81% | 1.27% | 5.24% | [−20%; −10%) | 90–95 | 5 |
| 0.62% | 1.27% | 1.89% | 0.56% | 0.98% | 1.54% | 3.43% | [−20%; −10%) | 95–100 | 31 |
| 0.35% | 0.71% | 1.06% | 0.31% | 0.51% | 0.83% | 3.51% | [−10%; −5%) | 0–20 | 56 |
| 0.41% | 0.83% | 1.24% | 0.37% | 0.63% | 1,00% | 2.26% | [−10%; −5%) | 20–80 | 147 |
| 0.42% | 0.85% | 1.27% | 0.38% | 0.66% | 1.04% | 1.84% | [−10%; −5%) | 80–90 | 11 |
| 0.6% | 1.13% | 1.72% | 0.54% | 0.96% | 1.5% | −1.28% | [−10%; −5%) | 90–95 | 10 |
| 0.58% | 1,00% | 1.58% | 0.52% | 0.92% | 1.45% | −3.76% | [−10%; −5%) | 95–100 | 9 |
| 0.21% | 0.25% | 0.46% | 0.27% | 0.44% | 0.71% | −0.09% | [−5%; 0%) | 0–20 | 128 |
| 0.15% | −0.04% | 0.12% | 0.34% | 0.58% | 0.92% | −1.29% | [−5%; 0%) | 20–80 | 279 |
| 0.03% | −0.17% | −0.14% | 0.35% | 0.59% | 0.94% | −2.88% | [−5%; 0%) | 80–90 | 12 |
| 0.35% | −0.39% | −0.04% | 0.57% | 1.01% | 1.58% | −3.26% | [−5%; 0%) | 90–95 | 14 |
| 0.03% | −0.64% | −0.62% | 0.64% | 1.14% | 1.79% | −6.56% | [−5%; 0%) | 95–100 | 13 |
| −0.27% | −0.51% | −0.78% | −0.19% | −0.23% | −0.42% | −0.45% | [0%; 5%) | 0–20 | 150 |
| −0.35% | −0.69% | −1.04% | −0.2% | −0.14% | −0.34% | −1.1% | [0%; 5%) | 20–80 | 361 |
| −0.42% | −0.82% | −1.23% | −0.3% | −0.24% | −0.55% | −2.18% | [0%; 5%) | 80–90 | 32 |
| −0.69% | −1.33% | −2.02% | −0.16% | 0.55% | 0.39% | −2.41% | [0%; 5%) | 90–95 | 7 |
| −0.58% | −1.12% | −1.7% | −0.19% | 0.53% | 0.34% | −3.62% | [0%; 5%) | 95–100 | 5 |
| −0.32% | −0.63% | −0.95% | −0.36% | −0.86% | −1.22% | −0.29% | [5%; 10%) | 0–20 | 30 |
| −0.38% | −0.73% | −1.11% | −0.42% | −0.94% | −1.36% | −1.23% | [5%; 10%) | 20–80 | 176 |
| −0.43% | −0.84% | −1.27% | −0.47% | −1.04% | −1.52% | −2.31% | [5%; 10%) | 80–90 | 35 |
| −0.57% | −1.1% | −1.67% | −0.62% | −1.37% | −1.99% | −2.96% | [5%; 10%) | 90–95 | 6 |
| −0.6% | −1.16% | −1.76% | −0.65% | −0.94% | −1.59% | −4.38% | [5%; 10%) | 95–100 | 6 |
| −0.31% | −0.62% | −0.93% | −0.35% | −0.83% | −1.18% | −0.43% | [10%; 20%) | 0–20 | 11 |
| −0.44% | −0.86% | −1.3% | −0.49% | −1.09% | −1.58% | −1.46% | [10%; 20%) | 20–80 | 44 |
| −0.45% | −0.89% | −1.34% | −0.5% | −1.12% | −1.62% | −2.16% | [10%; 20%) | 80–90 | 45 |
| −0.56% | −1.09% | −1.66% | −0.62% | −1.36% | −1.97% | −2.66% | [10%; 20%) | 90–95 | 35 |
| −0.57% | −1.11% | −1.67% | −0.62% | −1.34% | −1.96% | −3.71% | [10%; 20%) | 95–100 | 4 |
| −0.55% | −1.06% | −1.61% | −0.6% | −1.35% | −1.95% | −2.44% | [20%; +∞) | 80–90 | 6 |
| −0.54% | −1.04% | −1.58% | −0.59% | −1.3% | −1.89% | −2.61% | [20%; +∞) | 90–95 | 9 |
| Bull Call Spread (0.5; +1) | Bull Call Spread (1; +2) | Bull Call Spread (0.5; +2) | Bull Put Spread (−1; −0.5) | Bull Put Spread (−2; −1) | Bull Put Spread (−2; −0.5) | Bear Call Ladder (0.5; +1; +2) | Category of Price Changes | Category of IV | Number of Observations |
|---|---|---|---|---|---|---|---|---|---|
| −0.37% | −0.62% | −0.99% | −0.41% | −0.84% | −1.25% | −1.68% | (−∞; −20%) | 20–80 | 14 |
| −0.49% | −0.86% | −1.35% | −0.54% | −1.1% | −1.63% | −1.8% | (−∞; −20%) | 80–90 | 4 |
| −0.51% | −0.91% | −1.42% | −0.56% | −1.14% | −1.7% | −1.71% | (−∞; −20%) | 90–95 | 5 |
| −0.57% | −1.01% | −1.58% | −0.64% | −1.32% | −1.96% | −8.05% | (−∞; −20%) | 95–100 | 11 |
| −0.25% | −0.4% | −0.66% | −0.28% | −0.57% | −0.85% | −0.67% | [−20%; −10%) | 0–20 | 18 |
| −0.38% | −0.65% | −1.03% | −0.42% | −0.86% | −1.28% | −1.31% | [−20%; −10%) | 20–80 | 137 |
| −0.49% | −0.86% | −1.35% | −0.54% | −1.11% | −1.65% | −2.32% | [−20%; −10%) | 80–90 | 34 |
| −0.46% | −0.81% | −1.27% | −0.51% | −1.04% | −1.55% | −2.72% | [−20%; −10%) | 90–95 | 5 |
| −0.56% | −0.98% | −1.54% | −0.62% | −1.27% | −1.89% | −6.74% | [−20%; −10%) | 95–100 | 31 |
| −0.31% | −0.51% | −0.83% | −0.35% | −0.71% | −1.06% | −0.43% | [−10%; −5%) | 0–20 | 56 |
| −0.37% | −0.63% | −1.00% | −0.41% | −0.83% | −1.24% | −1.21% | [−10%; −5%) | 20–80 | 147 |
| −0.38% | −0.66% | −1.04% | −0.42% | −0.85% | −1.27% | −2.39% | [−10%; −5%) | 80–90 | 11 |
| −0.54% | −0.96% | −1.5% | −0.6% | −1.13% | −1.72% | −2.69% | [−10%; −5%) | 90–95 | 10 |
| −0.52% | −0.92% | −1.45% | −0.58% | −1,00% | −1.58% | −5.6% | [−10%; −5%) | 95–100 | 9 |
| −0.27% | −0.44% | −0.71% | −0.21% | −0.25% | −0.46% | −0.5% | [−5%; 0%) | 0–20 | 128 |
| −0.34% | −0.58% | −0.92% | −0.15% | 0.04% | −0.12% | −1.3% | [−5%; 0%) | 20–80 | 279 |
| −0.35% | −0.59% | −0.94% | −0.03% | 0.17% | 0.14% | −2.69% | [−5%; 0%) | 80–90 | 12 |
| −0.57% | −1.01% | −1.58% | −0.35% | 0.39% | 0.04% | −2.79% | [−5%; 0%) | 90–95 | 14 |
| −0.64% | −1.14% | −1.79% | −0.03% | 0.64% | 0.62% | −6.83% | [−5%; 0%) | 95–100 | 13 |
| 0.19% | 0.23% | 0.42% | 0.27% | 0.51% | 0.78% | −0.24% | [0%; 5%) | 0–20 | 150 |
| 0.2% | 0.14% | 0.34% | 0.35% | 0.69% | 1.04% | −1.34% | [0%; 5%) | 20–80 | 361 |
| 0.3% | 0.24% | 0.55% | 0.42% | 0.82% | 1.23% | −2.76% | [0%; 5%) | 80–90 | 32 |
| 0.16% | −0.55% | −0.39% | 0.69% | 1.33% | 2.02% | −3.55% | [0%; 5%) | 90–95 | 7 |
| 0.19% | −0.53% | −0.34% | 0.58% | 1.12% | 1.7% | −4.55% | [0%; 5%) | 95–100 | 5 |
| 0.36% | 0.86% | 1.22% | 0.32% | 0.63% | 0.95% | 3.15% | [5%; 10%) | 0–20 | 30 |
| 0.42% | 0.94% | 1.36% | 0.38% | 0.73% | 1.11% | 1.76% | [5%; 10%) | 20–80 | 176 |
| 0.47% | 1.04% | 1.52% | 0.43% | 0.84% | 1.27% | 0.21% | [5%; 10%) | 80–90 | 35 |
| 0.62% | 1.37% | 1.99% | 0.57% | 1.1% | 1.67% | −0.9% | [5%; 10%) | 90–95 | 6 |
| 0.65% | 0.94% | 1.59% | 0.6% | 1.16% | 1.76% | −2.74% | [5%; 10%) | 95–100 | 6 |
| 0.35% | 0.83% | 1.18% | 0.31% | 0.62% | 0.93% | 7.73% | [10%; 20%) | 0–20 | 11 |
| 0.49% | 1.09% | 1.58% | 0.44% | 0.86% | 1.3% | 6.56% | [10%; 20%) | 20–80 | 44 |
| 0.5% | 1.12% | 1.62% | 0.45% | 0.89% | 1.34% | 7.65% | [10%; 20%) | 80–90 | 45 |
| 0.62% | 1.36% | 1.97% | 0.56% | 1.09% | 1.66% | 5.59% | [10%; 20%) | 90–95 | 35 |
| 0.62% | 1.34% | 1.96% | 0.57% | 1.11% | 1.67% | 6.16% | [10%; 20%) | 95–100 | 4 |
| 0.6% | 1.35% | 1.95% | 0.55% | 1.06% | 1.61% | 14.36% | [20%; +∞) | 80–90 | 6 |
| 0.59% | 1.3% | 1.89% | 0.54% | 1.04% | 1.58% | 10.81% | [20%; +∞) | 90–95 | 9 |
| 0.71% | 1.55% | 2.26% | 0.65% | 1.26% | 1.91% | 13.44% | [20%; +∞) | 95–100 | 7 |
References
- Zou, G.; Chau, K.W. Effects of International Crude Oil Prices on Energy Consumption in China. Energies 2020, 13, 3891. [Google Scholar]
- Ewing, B.T.; Malik, F. Volatility transmission between gold and oil futures under structural breaks. Int. Rev. Econ. Financ. 2013, 25, 113–121. [Google Scholar]
- Chen, R.; Xu, J. Forecasting volatility and correlation between oil and gold prices using a novel multivariate GAS model. Energy Econ. 2019, 78, 379–391. [Google Scholar]
- Nguyen, C.; Bhatti, M.I.; Komorníková, M.; Komorník, J. Gold price and stock markets nexus under mixed-copulas. Econ. Model. 2016, 58, 283–292. [Google Scholar]
- Sari, R.; Hammoudeh, S.; Soytas, U. Dynamics of oil price, precious metal prices and exchange rate. Energy Econ. 2010, 32, 351–362. [Google Scholar]
- Popp, J.; Oláh, J.; Fekete, M.F.; Lakner, Z.; Máté, D. The Relationship between Prices of Various Metals, Oil and Scarcity. Energies 2018, 11, 2392. [Google Scholar]
- Wu, F.; Guan, Z.; Myers, R.J. Volatility spillover effects and cross hedging in corn and crude oil futures. J. Futures Mark. 2011, 31, 1052–1075. [Google Scholar]
- Walid, M.; Shawkat, H.; Duc, K.; Seong, Y. Dynamic spillovers among major energy and cereal commodity prices. Energy Econ. 2014, 43, 225–243. [Google Scholar]
- Taghizadeh-Hesary, F.; Rasoulinezhad, E.; Yoshino, N. Volatility Linkages between Energy and Food Prices: Case of Selected Asian Countries. Asian Development Bank Institute Working Paper 829. Available online: https://www.adb.org/sites/default/files/publication/411176/adbi-wp829.pdf (accessed on 15 April 2020).
- Vo, D.H.; Vu, T.N.; Vo, A.T.; McAleer, M. Modeling the Relationship between Crude Oil and Agricultural Commodity Prices. Energies 2019, 12, 1344. [Google Scholar]
- Villar, J.A.; Joutz, F.L. The Relationship between Crude Oil and Natural Gas Prices; Energy Information Administration, Office of Oil and Natural Gas: Washington, DC, USA, 2006; pp. 1–43.
- Ji, Q.; Geng, J.B.; Fan, Y. Separated influence of crude oil prices on regional natural gas import prices. Energy Policy 2014, 70, 96–105. [Google Scholar]
- Lin, B.; Li, J. The spillover effects across natural gas and oil markets: Based on the VEC–MGARCH framework. Appl. Energy 2015, 155, 229–241. [Google Scholar] [CrossRef]
- Ji, Q.; Geng, J.B.; Aviral, K.T. Information spillovers and connectedness networks in the oil and gas markets. Energy Econ. 2018, 75, 71–84. [Google Scholar] [CrossRef]
- Zhang, D.Y.; Shi, M.; Shi, X. Oil indexation, market fundamentals, and natural gas prices: An investigation of the Asian premium in natural gas trade. Energy Econ. 2018, 69, 33–41. [Google Scholar] [CrossRef] [Green Version]
- Baffes, J. Oil spills on other commodities. Resour. Policy 2007, 32, 126–134. [Google Scholar] [CrossRef] [Green Version]
- Ji, Q.; Fan, Y. How does oil price volatility affect non-energy commodity markets? Appl. Energy 2012, 89, 273–280. [Google Scholar] [CrossRef]
- Demiralay, S.; Hourvouliades, N.; Fassas, A. Dynamic co-movements and directional spillovers among energy futures. Stud. Econ. Financ. 2020. [Google Scholar] [CrossRef]
- Liu, T.; Gong, X. Analyzing time-varying volatility spillovers between the crude oil markets using a new method. Energy Econ. 2020, 87, 1–11. [Google Scholar] [CrossRef]
- Reboredo, J.C.; Rivera-Castro, M.A. A wavelet decomposition approach to crude oil price and exchange rate dependence. Econ. Model. 2013, 32, 42–57. [Google Scholar] [CrossRef]
- Golub, S. Oil prices and exchange rates. Econ. J. 1983, 93, 576–593. [Google Scholar] [CrossRef]
- Zhang, Y.J.; Fan, Y.; Tsai, H.T.; Wei, Y.M. Spillover effect of US dollar exchange rate on oil prices. J. Policy Model. 2008, 30, 973–991. [Google Scholar] [CrossRef]
- De Truchis, G.; Keddad, B. On the risk comovements between the crude oil market and U.S. dollar exchange rates. Econ. Model. 2016, 52, 206–215. [Google Scholar] [CrossRef] [Green Version]
- Al Rahahleh, N.; Bhatti, M.I. Co-movement measure of information transmission on international equity markets. Phys. A Stat. Mech. Appl. 2017, 470, 119–131. [Google Scholar] [CrossRef]
- Jones, C.; Kaul, G. Oil and the stock markets. J. Financ. 1996, 51, 463–491. [Google Scholar] [CrossRef]
- Basher, S.A.; Sadorsky, P. Oil price risk and emerging stock markets. Glob. Financ. J. 2006, 17, 224–251. [Google Scholar] [CrossRef]
- Nandha, M.; Faff, R. Does oil move equity prices? A global view. Energy Econ. 2008, 30, 986–997. [Google Scholar] [CrossRef]
- Hsiao, C.Y.; Lin, W.; Wei, X.; Yan, G.; Li, S.; Sheng, N. The Impact of International Oil Prices on the Stock Price Fluctuations of China’s Renewable Energy Enterprises. Energies 2019, 12, 4630. [Google Scholar] [CrossRef] [Green Version]
- Malik, F.; Hammoudeh, S. Shock and volatility transmission on the oil, US and Gulf equity markets. Int. Rev. Econ. Financ. 2007, 16, 357–368. [Google Scholar] [CrossRef]
- Arouri, M.E.H.; Jouini, J.; Nguyen, D. Volatility spillovers between oil prices and stock sector returns: Implications for portfolio management. J. Int. Money Financ. 2011, 30, 1387–1405. [Google Scholar] [CrossRef]
- Maghyereh, A.I.; Awartani, B. Oil price uncertainty and equity returns. J. Financ. Econ. Policy 2016, 8, 64–79. [Google Scholar] [CrossRef]
- Arouri, M.; Jouini, J.; Nguyen, K.D. On the impacts of oil price fluctuations on European equity markets: Volatility spillover and hedging effectiveness. Energy Econ. 2012, 34, 611–617. [Google Scholar]
- Black, F.; Scholes, M. The pricing of option and corporate liabilities. J. Financ. Econ. 1973, 3, 637–654. [Google Scholar]
- Black, F. The pricing of commodity contracts. J. Political Econ. 1976, 81, 167–179. [Google Scholar] [CrossRef]
- Fassas, A.; Siriopoulos, C. Implied volatility indices—A review. Q. Rev. Econ. Financ. 2020. [Google Scholar] [CrossRef]
- Siriopoulos, C.; Fassas, A. Dynamic relations of uncertainty expectations: A conditional assessment of implied volatility indices. Rev. Deriv. Res. 2013, 16, 233–266. [Google Scholar] [CrossRef]
- Lopez, R. Volatility contagion across commodity, equity, foreign exchange and Treasury bond markets. Appl. Econ. Lett. 2014, 21, 646–650. [Google Scholar] [CrossRef]
- Kenourgios, D. On financial contagion and implied market volatility. Int. Rev. Financ. Anal. 2014, 34, 21–30. [Google Scholar] [CrossRef]
- Maghyereh, A.I.; Awartani, B.; Bouri, E. The directional volatility connectedness between crude oil and equity markets: New evidence from implied volatility indexes. Energy Econ. 2016, 57, 78–93. [Google Scholar] [CrossRef] [Green Version]
- Ji, Q.; Bouri, E.; Roubaud, D. Dynamic network of implied volatility transmission among US equities, strategic commodities, and BRICS equities. Int. Rev. Financ. Anal. 2018, 57, 1–12. [Google Scholar] [CrossRef]
- Badshah, I.U.; Bekiros, S.; Lucey, B.M.; Uddin, G.S. Asymmetric linkages among the fear index and emerging market volatility indices. Emerg. Mark. Rev. 2018, 37, 17–31. [Google Scholar] [CrossRef]
- Bouri, E.; Lucey, B.; Roubaud, D. Dynamics and determinants of spillovers across the option-implied volatilities of US equities. Q. Rev. Econ. Financ. 2020, 75, 257–264. [Google Scholar] [CrossRef]
- Giot, P. Relationships between implied volatility indexes and stock index returns. J. Portf. Manag. 2005, 31, 92–100. [Google Scholar]
- Banerjee, P.S.; Doran, J.S.; Peterson, D.R. Implied volatility and future portfolio returns. J. Bank. Financ. 2007, 31, 3183–3199. [Google Scholar]
- Hibbert, A.M.; Daigler, R.T.; Dupoyet, B. A behavioral explanation for the negative asymmetric return–volatility relation. J. Bank. Financ. 2008, 32, 2254–2266. [Google Scholar] [CrossRef]
- Whaley, R.E. Understanding the VIX. J. Portf. Manag. 2009, 35, 98–105. [Google Scholar] [CrossRef]
- Zhu, M. Return distribution predictability and its implications for portfolio selection. Int. Rev. Econ. Financ. 2013, 27, 209–223. [Google Scholar]
- Blair, B.; Poon, S.H.; Taylor, S.J. Forecasting S&P 100 volatility: The incremental information content of implied volatilities and high frequency index returns. J. Econom. 2001, 105, 5–26. [Google Scholar]
- Poon, S.H.; Granger, C.W. Forecasting volatility in financial markets: A review. J. Econ. Lit. 2003, 41, 478–539. [Google Scholar] [CrossRef]
- Poon, S.H.; Granger, C.W.J. Practical issues in forecasting volatility. Financ. Anal. J. 2005, 61, 45–56. [Google Scholar] [CrossRef] [Green Version]
- Gonzalez-Perez, M.T. Model-free volatility indexes in the financial literature: A review. Int. Rev. Econ. Financ. 2015, 40, 141–159. [Google Scholar] [CrossRef]
- Amaitiek, O.; Šoltés, V. Inverse vertical ratio put spread strategy and its application in hedging against a price drop. J. Adv. Stud. Financ. 2010, 1, 100–107. [Google Scholar]
- Šoltés, V.; Rusnáková, M. Hedging Against a Price Drop Using the Inverse Vertical Ratio Put Spread Strategy Formed by Barrier Options. Eng. Econ. 2013, 24, 18–27. [Google Scholar]
- Šoltés, M. Using Option Strategies in Trading. Procedia Soc. Behav. Sci. 2014, 110, 979–985. [Google Scholar] [CrossRef] [Green Version]
- Rusnáková, M.; Šoltés, V.; Szabo, Z.K. Short Combo Strategy Using Barrier Options and its Application in Hedging. Procedia Econ. Financ. 2015, 32, 166–179. [Google Scholar] [CrossRef] [Green Version]
- Sheu, H.-J.; Wei, J.-C.H. Effective options trading strategies based on volatility forecasting recruiting investor sentiment. Expert Syst. Appl. 2011, 38, 585–596. [Google Scholar] [CrossRef]
- Cohen, G. The Bible of Option Strategies: The Definitive Guide for Practical Trading Strategies; Pearson Education: Prentice Hall, NJ, USA, 2005; pp. 89–118. [Google Scholar]
- QuikVol Tool. WTI (LO) Volatility and Skew. Available online: https://www.cmegroup.com/tools-information/quikstrike/pricing-volatility-strategy-tools/quikvol-tool.html (accessed on 15 April 2020).
- Soini, V.; Lorentzen, S. Option prices and implied volatility in the crude oil market. Energy Econ. 2019, 83, 515–539. [Google Scholar] [CrossRef]
- Fassas, A.; Hourvouliades, N. VIX Futures as a Market Timing Indicator. J. Risk Financ. Manag. 2019, 12, 113. [Google Scholar]

| Name of the Strategy | Component Parts | Maximum Loss | Maximum Profit |
|---|---|---|---|
| Bull Call Spread |
| ||
| Bear Put Spread |
| ||
| Bull Put Spread |
| ||
| Bear Call Spread |
| ||
| Bull Put Ladder |
| ||
| Bear Call Ladder |
|
| Category of Implied Volatility | 0–20 | 20–80 | 80–90 | 90–95 | 95–100 |
|---|---|---|---|---|---|
| Number of obs. | 573 | 1724 | 286 | 144 | 144 |
| Mean | 19.38% | 31.81% | 47.23% | 59.03% | 99.48% |
| Median | 19.72% | 30.78% | 46.84% | 58.35% | 87.85% |
| Min | 11.68% | 23.64% | 43.44% | 52.91% | 68.20% |
| Max | 23.62% | 43.40% | 52.90% | 68.11% | 187.86% |
| Standard deviation | 2.87% | 5.44% | 2.53% | 4.34% | 30.61% |
| Skewness | −0.42 | 0.45 | 0.47 | 0.31 | 1.3 |
| Kurtosis | −0.79 | −0.89 | −0.79 | −1.11 | 0.64 |
| JB | 359.79 | 1145.17 | 181.70 | 103.66 | 73.98 |
| Category of Implied Volatility | 0–20 | 20–80 | 80–90 | 90–95 | 95–100 |
|---|---|---|---|---|---|
| Number of obs. | 393 | 1158 | 179 | 91 | 86 |
| Mean | −0.61% | −1.21% | 2.04% | 4.14% | −6.21% |
| Median | −0.19% | 0.01% | 4.59% | 8.96% | −7.52% |
| Min | −12.81% | −49.98% | −45.99% | −42.88% | −29.89% |
| Max | 13.65% | 18.89% | 24.56% | 25.49% | 31.41% |
| Standard deviation | 5.16% | 7.98% | 13.01% | 14,92% | 14.16% |
| Skewness | −0.02 | −1.45 | −1.00 | −1.38 | 0.85 |
| Kurtosis | −0.18 | 5.91 | 1.65 | 2.23 | 0.09 |
| JB | 165.83 | 815.24 | 43.43 | 31.03 | 40.85 |
| % of days with price falls | 51.40 | 50.00 | 34.08 | 37.36 | 74.42 |
| % of days with price increases | 48.60 | 50.00 | 65.92 | 62.64 | 25.58 |
| Variant | Category of Implied Volatility | |||||
|---|---|---|---|---|---|---|
| 0–20 | 20–80 | 80–90 | 90–95 | 95–100 | ||
| Net debit spread | Bull Call Spread (0.5; +1) | over 100.88% | over 101.13% | over 101.36% | over 101.71% | over 101.86% |
| Bull Call Spread (1; +2) | over 101.65% | over 102.14% | over 102.60% | over 103.30% | over 103.58% | |
| Bull Call Spread (0.5; +2) | over 101.35% | over 101.74% | over 102.11% | over 102.66% | over 102.85% | |
| Bear Put Spread (−1; −0.5) | under 99.13% | under 98.87% | under 98.62% | under 98.25% | under 98.04% | |
| Bear Put Spread (−2; −1) | under 98.27% | under 97.76% | under 97.27% | under 96.52% | under 96.12% | |
| Bear Put Spread (−2; −0.5) | under 98.60% | under 98.17% | under 97.75% | under 97.12% | under 96.74% | |
| Net credit spread | Bull Put Spread (−1; −0.5) | over 99.13% | over 98.87% | over 98.62% | over 98.25% | over 98.04% |
| Bull Put Spread (−2; −1) | over 98.27% | over 97.76% | over 97.27% | over 96.52% | over 96.12% | |
| Bull Put Spread (−2; −0.5) | over 98.60% | over 98.17% | over 97.75% | over 97.12% | over 96.74% | |
| Bear Call Spread (0.5; +1) | under 100.88% | under 101.13% | under 101.36% | under 101.71% | under 101.86% | |
| Bear Call Spread (1; +2) | under 101.65% | under 102.14% | under 102.60% | under 103.30% | under 103.58% | |
| Bear Call Spread (0.5; +2) | under 101.35% | under 101.74% | under 102.11% | under 102.66% | under 102.85% | |
| Unlimited | Bull Put Ladder (−2; −1; −0.5) | under 96.57% | under 95.01% | under 93.16% | under 91.54% | under 87.84% |
| Bear Call Ladder (0.5; +1; +2) | over 104.65% | over 106.64% | over 108.95% | over 111.13% | over 115.33% | |
| Variant | Result | Implied Volatility Category | |||||
|---|---|---|---|---|---|---|---|
| 0–20 | 20–80 | 80–90 | 90–95 | 95–100 | |||
| Net debit spread | Bull Call Spread (0.5; 1) | profit | 41.73% | 42.49% | 63.69% | 59.34% | 23.26% |
| loss | 1.53% | 1.90% | 0.56% | 1.1% | 1.16% | ||
| maximum loss (cost) | 56.74% | 55.61% | 35.75% | 39.56% | 75.58% | ||
| Bull Call Spread (1; 2) | profit | 35.11% | 35.49% | 58.66% | 56.04% | 20.93% | |
| loss | 3.05% | 4.75% | 2.23% | 3.3% | 1.16% | ||
| maximum loss (cost) | 61.83% | 59.76% | 39.11% | 40.66% | 77.91% | ||
| Bull Call Spread (0.5; 2) | profit | 37.15% | 38.17% | 60.89% | 59.34% | 20.93% | |
| loss | 6.11% | 6.22% | 3.35% | 1.1% | 3.49% | ||
| maximum loss (cost) | 56.74% | 55.61% | 35.75% | 39.56% | 75.58% | ||
| Bear Put Spread (−1; −0.5) | profit | 41.48% | 37.22% | 30.73% | 28.57% | 65.12% | |
| loss | 3.31% | 3.63% | 0,00% | 3.3% | 1.16% | ||
| maximum loss (cost) | 55.22% | 59.15% | 69.27% | 68.13% | 33.72% | ||
| Bear Put Spread (−2; −1) | profit | 45.55% | 42.49% | 30.73% | 35.16% | 67.44% | |
| loss | 3.31% | 2.68% | 0.56% | 1.1% | 3.49% | ||
| maximum loss (cost) | 51.15% | 54.84% | 68.72% | 63.74% | 29.07% | ||
| Bear Put Spread (−1; −0.5) | profit | 42.49% | 39.29% | 30.73% | 30.77% | 65.12% | |
| loss | 6.36% | 5.87% | 0.56% | 5.49% | 5.81% | ||
| maximum loss (cost) | 51.15% | 54.84% | 68.72% | 63.74% | 29.07% | ||
| Net credit spread | Bull Put Spread (−1; −0.5) | profit | 54.45% | 57.51% | 69.27% | 64.84% | 32.56% |
| loss | 7.38% | 9.76% | 7.82% | 9.89% | 6.98% | ||
| maximum loss (cost) | 38.17% | 32.73% | 22.91% | 25.27% | 60.47% | ||
| Bull Put Spread (−2; −1) | profit | 58.52% | 62.78% | 69.27% | 71.43% | 34.88% | |
| loss | 8.14% | 6.74% | 6.7% | 7.69% | 5.81% | ||
| maximum loss (cost) | 33.33% | 30.48% | 24.02% | 20.88% | 59.3% | ||
| Bull Put Spread (−1; −0.5) | profit | 57.51% | 60.71% | 69.27% | 69.23% | 34.88% | |
| loss | 6.87% | 9.5% | 5.59% | 10.99% | 5.81% | ||
| maximum loss (cost) | 35.62% | 29.79% | 25.14% | 19.78% | 59.3% | ||
| Bear Call Spread (0.5; 1) | profit | 58.27% | 57.51% | 36.31% | 40.66% | 76.74% | |
| loss | 9.41% | 5.87% | 12.29% | 16.48% | 5.81% | ||
| maximum loss (cost) | 32.32% | 36.61% | 51.4% | 42.86% | 17.44% | ||
| Bear Call Spread (1; 2) | profit | 64.89% | 64.51% | 41.34% | 43.96% | 79.07% | |
| loss | 6.36% | 5.87% | 10.06% | 5.49% | 4.65% | ||
| maximum loss (cost) | 28.75% | 29.62% | 48.6% | 50.55% | 16.28% | ||
| Bear Call Spread (0.5; 2) | profit | 62.85% | 61.83% | 39.11% | 40.66% | 79.07% | |
| loss | 8.65% | 8.38% | 11.17% | 13.19% | 5.81% | ||
| maximum loss (cost) | 28.5% | 29.79% | 49.72% | 46.15% | 15.12% | ||
| Unlimited | Bull Put Ladder (−2; −1; −0.5) | profit | 42.24% | 30.4% | 27.93% | 12.09% | 43.02% |
| loss | 51.15% | 62.52% | 69.83% | 78.02% | 54.65% | ||
| maximum loss (cost) | 6.62% | 7.08% | 2.23% | 9.89% | 2.33% | ||
| Bear Call Ladder (0.5; 1; 2) | profit | 27.74% | 20.98% | 39.11% | 50.55% | 12.79% | |
| loss | 63.87% | 69.26% | 54.19% | 46.15% | 83.72% | ||
| maximum loss (cost) | 8.4% | 9.76% | 6.7% | 3.3% | 3.49% | ||
© 2020 by the authors. Licensee MDPI, Basel, Switzerland. This article is an open access article distributed under the terms and conditions of the Creative Commons Attribution (CC BY) license (http://creativecommons.org/licenses/by/4.0/).
Share and Cite
Łamasz, B.; Iwaszczuk, N. The Impact of Implied Volatility Fluctuations on Vertical Spread Option Strategies: The Case of WTI Crude Oil Market. Energies 2020, 13, 5323. https://doi.org/10.3390/en13205323
Łamasz B, Iwaszczuk N. The Impact of Implied Volatility Fluctuations on Vertical Spread Option Strategies: The Case of WTI Crude Oil Market. Energies. 2020; 13(20):5323. https://doi.org/10.3390/en13205323
Chicago/Turabian StyleŁamasz, Bartosz, and Natalia Iwaszczuk. 2020. "The Impact of Implied Volatility Fluctuations on Vertical Spread Option Strategies: The Case of WTI Crude Oil Market" Energies 13, no. 20: 5323. https://doi.org/10.3390/en13205323
APA StyleŁamasz, B., & Iwaszczuk, N. (2020). The Impact of Implied Volatility Fluctuations on Vertical Spread Option Strategies: The Case of WTI Crude Oil Market. Energies, 13(20), 5323. https://doi.org/10.3390/en13205323