Article

Remuneration of Distribution Grids for Enhanced Regenerative Electricity Deployment—An Analysis and Model for the Analysis of Grid Structures in Southern Germany Using Linear Programming

1
Department of Mechanical and Process Engineering, Offenburg University of Applied Sciences, Badstr. 24, 77652 Offenburg, Germany
2
Forest Research Institute Baden-Württemberg (FVA), 79106 Freiburg, Germany
*
Author to whom correspondence should be addressed.
Energies 2020, 13(20), 5385; https://doi.org/10.3390/en13205385
Submission received: 16 September 2020 / Revised: 1 October 2020 / Accepted: 8 October 2020 / Published: 15 October 2020
(This article belongs to the Section A1: Smart Grids and Microgrids)

Abstract

:
Ecological concerns on the climatic effects of the emissions from electricity production stipulate the remuneration of electricity grids to accept growing amounts of intermittent regenerative electricity feed-in from wind and solar power. Germany’s eager political target to double regenerative electricity production by 2030 puts pressure on grid operators to adapt and restructure their transmission and distribution grids. The ability of local distribution grids to operate autonomous of transmission grid supply is essential to stabilize electricity supply at the level of German federal states. Although congestion management and collaboration at the distribution system operator (DSO) level are promising approaches, relatively few studies address this issue. This study presents a methodology to assess the electric energy balance for the low-voltage grids in the German federal state of Baden-Württemberg, assuming the typical load curves and the interchange potential among local distribution grids by means of linear programming of the supply function and for typical seasonal electricity demands. The model can make a statement about the performance and development requirements for grid architecture for scenarios in 2035 and 2050 when regenerative energies will—according to present legislation—account for more than half of Germany’s electricity supply. The study details the amendment to Baden-Württemberg’s electricity grid required to fit the system to the requirements of regenerative electricity production. The suggested model for grid analysis can be used in further German regions and internationally to systematically remunerate electricity grids for the acceptance of larger amounts of regenerative electricity inflows. This empirical study closes the research gap of assessing the interchange potential among DSO and considers usual power loads and simultaneously usual electricity inflows.

1. Introduction

Climatic change and global warming threaten the ecological balance of our planet. Growing human-induced emissions of carbon dioxide and noxious gases are central causes for global warming in the industrial age and disturb the balance of radiation absorbed by and emitted from the atmosphere. Cumulating noxious gases in the stratosphere preserve solar radiation and warmth (greenhouse effect). Global warming contributes to novel climatic phenomena: the desertification of areas near the equator, as well as the melting of polar ice, storms, fires, and floods. Human civilization in affected areas is threatened, which stimulates political unrests, wars, and international migration [1].
Industrialized nations are in demand to change this self-enforcing cycle and have repeatedly committed to reduce CO2 and other emissions in international conventions e.g., the Brundtland Report (1987), the conference of Rio (1992), the Kyoto Protocol (1997), and recently, at the climate change conference of Madrid in December 2019 [2]. Germany attempts to be a frontrunner in ecological reorientation. The country has cut its CO2 emissions by 27.7% since 1990 and according to the climate protection plan 2050 is committed to further diminish emissions by 55% between 1990 and 2030. The climate protection plan defines targets by sector to reach this eager objective.
The energy sector, and in particular electricity generation, have a central position in this plan: Energy is used by the most successive economic sectors, and these sectors depend on a sustainable supply of electricity to reduce their environmental footprint [3]. Extensive legislation, particularly the EnWG (Energiewirtschaftsgesetz) established in 2011, has pushed the ecological restructuring of Germany’s electricity sector. In June 2011, Germany decided to phase out nuclear energy production by 2022 [4]. In January 2020, the German Cabinet drafted a law to phase out coal-fired electricity generation [5]. Germany has increased the share of green energies in the energy mix to 33.3% already, which comprises 16.1% wind energy and 6.1% photovoltaics [6].
German photovoltaic plants are largely decentral: more than 1.6 million of feeders produced 45 GWh of electricity in 2018. Wind energy holds the largest share and growth potential among Germany’s regenerative energy resources. By 2018, 52.5 and 6.4 GW offshore installations were available and generated 110 TWh altogether. By 2030, the German Government plans to triple offshore wind energy plants to realize an installed capacity of 15 GW [6]. The total supply of regenerative energies is planned to increase to 65% of total demand [7].
Other than fossil fuel combustion, wind and solar energy resources are intermittent. Solar energy is available during the daytime and particularly during sunshine hours. Wind energy is available when wind blows only.
The transition of electricity generation from centralized nuclear and coal-fired plants, which are located centrally in all German federal states, toward fully decentralized small-scale photovoltaic plants and large off-shore wind energy plants located in the Baltic and North Sea is a challenge to electricity grid infrastructure:
Germany’s grid infrastructure has grown over decades and comprises two domestic layers: the high-voltage transmission networks transports with voltages up to 380 kV across huge distances and in between the transmission grids of different areas or countries. Regional distribution grids usually located within individual federal states are partly supplied by this transnational infrastructure and partly are self-sufficient due to supply from smaller local power plants [8].
The restructuring of energy supplies requires changes in high-voltage transmission and low-voltage distribution grid architecture:
  • High-distance grids must be strengthened to transfer wind electricity produced in the northern seas to southern areas.
  • Low-distance (distribution) grids must be remunerated to accept growing inputs of energy from local photovoltaic and wind energy production.
Presently, Germany’s supply in regenerative resources is growing significantly faster than grid infrastructure is adapted and developed. If electricity grids are unable to transfer temporary large regenerative supplies, these cannot be used in Germany but must be re-dispatched to foreign grids at unattractive conditions or are curtailed [9].
In 2020, there are still high conventional centralized production capacities, mainly hard coal and to some extend nuclear capacities. Figure 1 shows a map of Baden-Württemberg with its major production capacities including the planned time of phase-out for the coal and nuclear power plants, interconnection points to the neighboring transmission grids, and the planned two high-voltage direct current converter locations. Over time, the local production from centralized power plants will decline more and more. To compensate for this decline two high-voltage, direct current (HVDC) power lines will be constructed to transport the electricity from the large offshore power plants to Baden-Württemberg. So far, the integration of large offshore wind power stations into large transmission grids entails significant operative risks. German off-shore wind farms are connected to three on-shore electrical substations by a limited number of converters and cables. One of the three stations (Dörpen-West) manages about 50% of wind capacity produced in the North Sea [10]. For instance, in the third and fourth quarter of 2019, large proportions of the production capacity were not available several times over a period of several weeks due to technical problems with the sea cables. The inflow of regenerative electricity from large transmission grids to distribution grids accordingly is rather fluctuating depending on the availability of regenerative on- and off-shore electricity resources, particularly in the South of Germany. When large conventional power plants are shut down, distribution grid operators could face an electricity shortage, unless they manage autonomous local supplies in regenerative electricity successfully. The remuneration and development of distribution grids to the acceptance of locally produced regenerative electricity is essential to adapt Germany’s grid system to future requirements.
To accomplish the development necessities resulting from German legislation and the growing supply of regenerative electricity resources, grid operators develop grid infrastructures based on annual and long-term grid development plans [7]. These comprise new grid planning, grid remuneration and grid extension projects, and their implementation. Due to the lengthy processes for planning, approval, and finally construction, the plans usually cover a period of 10 years [11]. Distribution system operators (DSOs) have to supply information on necessary development and remuneration projects early to consider these in the comprehensive planning of grid infrastructure.
Different approaches of modeling distribution grids are analyzed profoundly in many publications. Kriechbaum et al. [21] highlight the different modeling approaches and show use cases for them.
In addition, distribution grid modeling techniques are of major importance in grid developing planning processes to evaluate the extent of future investments, as the BMWI [22] shows in their publication.
However, few publications present and discuss models to analyze dynamic inflows to electricity grids in order to develop grid capacities systematically and support distribution grid operators in the remuneration of their grids given typical grid loads.

2. Previous Research in Clustering or Classification of Distribution Grids

The following paragraphs provide a review of previous publications in electricity grid analysis aimed to support the expansion or adaption of distribution grids in the context of increasing installed capacities of renewables. A classification of distribution grids is of major importance to get an understanding of the large influence that external factors have on the design of different distribution grids. The outcome of this is that unbalances (between supply, feed-in of renewables, and demand) can be quantified, and a strategy for utilizing the resulting potential can be developed. This investigation considers studies in distribution grid optimization in journals and conference papers published in the period from 2000 to 2019. Altogether, 16 studies corresponding with these requirements have been identified from eligible databases. Two-thirds have been published after 2013, and two are from 2018 or 2019, which illustrates the increasing relevance of and consciousness for distribution grid development for the reasons explained above.
The retrieved studies cover different issues.
  • A first set of studies identifies feeders with remuneration requirements. Based on cluster analysis, DSOs with a low correspondence of requirements and infrastructural conditions are retrieved.
  • A second set of studies proposes the optimization of network architecture by means of linear optimization algorithms to minimize investment and operation costs.
Table 1 summarizes the results for both study types in electricity grid design.

2.1. Clustering Algorithms to Identify Grid Remuneration Requirements

Broderick et al. [23] suggest a k-means clustering algorithm to classify Californian feeders and identify remuneration requirements for PV inflows on that basis. Clustering criteria comprise feeder characteristics, e.g., primary voltage, type, and number of phases and served customers. Outliers from the core cluster face development needs.
To enhance the Dutch electric grid in the face of a growing number of small PV feeders, Nijhuis et al. [24] cluster DSO referring to the parameters of impedance, cable length, number of branches, branch depth, and number and type of connected customers using a k-means algorithm. An analysis of capacity and voltage deviation allows to identify DSOs with high default risk for further development. Similarly, Rösch and Treffinger [25] assess distribution system operators in the German federal state of Baden-Württemberg concerning the fit of demographic requirements and grid-construction status to remunerate local grids for regenerative electricity inflow from decentral producers. They test different algorithms and find the Gauss–Newton algorithm superior to k-means. To classify the status and development requirement of Italy’s electric grid, Bracale et al. [26] refer to reference networks in other countries. Although the study does not apply noteworthy statistical methodology, it is of interest by drawing a connection line from the present network status analysis to the draft of concrete future development options. To assess the hosting capacity constraints of low-voltage feeders, Bletterie et al. [27] classify Austrian feeders using a k-means clustering algorithm to determine their hosting capacity for regenerative energy inflows. They identify several significant clustering factors—among them, maximum and average inflow, cable length/load, and sum impedance—and find the classification algorithm superior to adequately consider the large diversity of constraints. The study illustrates that grid analysis and optimization require the inclusion of a broad range of factors.

2.2. Linear Programming to Optimize Grid Architectures

The empirical section of this study amends earlier models and uses linear programming offers for grid analysis and development, which allow considering different constraints to determine optimal parameter designs.
Linear programming techniques for DSO optimization have undergone significant development, from few to a high number of constraints and from single to multi-target models in recent years.
Early studies consider a single target—the cost of distribution grid reconfiguration and operation—and refer to newly planned grids or select technical components of grids only, which dispose of a moderate number of constraints:
Miguez et al. [28] suggest a general optimization model to minimize fixed investment and variable (operation) costs of medium-voltage grids for greenfield investments in electricity network architecture. The location of the plants, investment and operation costs, plants’ voltage drop constraints, maximum number of annual outages, and minimum supply levels are given as input parameters, while the set of nodes and interconnections between the plants is calculated by minimizing the cost function. The algorithm is generally applicable for newly designed networks but does not consider varying consumption patterns or existing restrictions, and it does not prioritize electricity supply depending on sustainability; it only assesses cost aspects.
Similarly, Navarro and Rudnick [29] draft a greenfield plan for the design of a transformer network in a new Chilenean urbanization. The study minimizes network investment and operation costs considering transformer capacities, the number of consumers, and street restrictions. However, this study considers location restrictions, and—similar to Miguez et al. [28]—targets costs only. It refers to transformers alone, which have only capacity restrictions. For feeders and total grids, further parameters such as voltage, line capacity, and consumer type would have to be assessed.
Lavorato et al. [30] focus on the minimization of energy losses on the grid by targeted planning.
They present an algorithm for radial distribution grid planning and suggest that the neglect of radiality constraints compromises the optimization of grids so far. The radius of distribution grids has to be chosen so that losses are minimized. In addition to previous models that use genetic algorithms or radial operation constraints in graph theory [31,32], Lavorato et al. [30] present a path-based connectivity model, recognizing that individual connection paths have to be planned depending on the location of the grid participants. The suggested algorithm design presupposes that the grid is newly defined and flexible to optimization.
The analysis and remuneration of previously established grids imposes more complex constraints. Two studies use linear programming for cost minimization in existing grids comprising several technical components.
Díaz-Dorado et al. [33] present a dynamic optimization algorithm for rural low and medium-voltage distribution grids with the target of total (investment maintenance and operation) cost minimization. Conductor capacity, voltage drop restraints, and power losses in the lines are considered, and deterministic loads are assumed. Drawing on an example of a rural area with 1530 customers, the study illustrates that the split of distribution areas into small part segments is optimal and minimizes the cost of distribution and operation.
In a follow-up study, the authors [34] additionally differentiate customer types located in the distribution grid area, three-phase industrial–commercial and single-phase residential and rural areas, and grids comprising either single or three phase lines. Additionally, different conductor types, papering, power losses in lines, capacities, and voltage drop constraints are controlled for, while assumed loads are deterministic on all lines. Cost surfaces are optimized in a three-dimensional model for a small exemplary area of 230,000 m² and 36 customers. The application illustrates the difficulty of optimizing cost functions for variations of several control parameters.
Cruz et al. [35] suggest a dynamic algorithm for network reconfiguration, which targets minimizing operation costs. A radial network topology is a necessary condition to implement the optimization. Further constraints are maximum voltage level. The costs of the feeders are assumed as a polynomial function of the installation price per unit-hour. Six scenarios are calculated to exemplify how the grid operation costs and power losses can be reduced simultaneously by grid reorganization. The study admits or restricts suppliers from the grid, in order to realize the optimization objective.
Using a predictive model of Scheidler et al. [36] and a stochastic local search metaheuristics, local and rural distribution grids can be optimized under voltage constraints to integrate further new transformers, additional regenerative plants, or substitute lines. The model minimizes transportation lengths and thus reduces transportation losses and grid operation costs. For reasons of calculation and input data complexity, the approach is limited to small grids. It does not include the impact of different supply and demand scenarios.
Azizvahed et al. [37] combine the analysis of distribution grids and energy storage systems to improve the stability and operation scheme of existing grids. The study includes supplied and non-supplied energy resources and minimizes non-supplied energy to enhance grid stability and lifetime. The optimization targets the voltage stability index and includes the cost and revenues of operation; balanced and unbalanced distribution grids are considered. The optimization considers the individual storage and production units in a small-scale grid, e.g., diesel generators and battery chargers. The radial structure of the grids, production limits (diesel generators and solar units’ output limits), battery constraints, and current and voltage limitations are included in the optimization model. To assess the financial profitability, the study includes stochastic uncertainty factors for market prices and regenerative power output. The algorithm delivers several possible grid alignments and assesses the power supply and demand for the utilization hours on a prototypical day, which enables the grid operator to adapt the grid structure flexibly by switches to adjust supply to demand. The application of Azizvahed’s et al. [37] algorithm is complex due to the large range of required input parameters by the producer, and thus, its application is limited to smaller rural or local grids.
None of the so far cited studies in the field of grid remuneration explicitly consider ecological targets, e.g., the maximization of regenerative power inflows; instead, they only consider the management of technical constraints (maximum voltage and current) and the management of cost constraints. A similar recent review of radial distribution grids [38] with distributed power generation confirms that topical studies mainly apply cost and efficiency targets.
While the above studies assess grid design under technical cost aspects only, Zidan et al. [39] integrate additional environmental targets. They suggest an optimization algorithm for existing distribution grids to minimize overall costs, including reconfiguration expenses and gas emissions. The network comprises PV modules, wind turbines, and gas turbines, and it prefers sustainable energy if possible. The probabilistic nature of renewable energy inflow to distribution grids, maximum grid power capacity, bus-interconnection restrictions, and a prescribed unity power factor of more than 0.95 are limiting factors. A mix of residential, commercial, and industrial consumers is assumed. The study compares the outcomes for a baseline scenario to reconfiguration options in Ontario, Canada in a case study and can assess the economic and ecological impact of remuneration measures. Table 2 gives a summary of the above mentioned studies.

2.3. Limitations of Previous Research

Comparing the studies classified in Section 2.1 and Section 2.2, the limitations of clustering methods as applied in Section 2.1 are apparent. Clustering allows the identification of grids with remuneration requirements, based on a comparison of their development status with other grids referring to two or three indicator parameters at a time. Rösch and Treffinger [25] put grid development in relation to local requirements, based on an analysis of population density, and they have been the first to conduct cluster analysis for German DSO. However, this approach does not allow setting clear standards for further development based on the factual requirements of feeders and consumers.
Studies classified in Section 2.2 use linear programming to optimize grid design parameters with the target of minimizing total costs of development and operation. Only a single study (Zidan et al. [39] additionally considers the ecological target of minimizing emissions from the grid’s gas power plants.
Only two studies (in Section 2.1) include possible concrete future scenarios in their analysis ([25] and [26]). Only Scheidler et al. [36] consider future development scenarios for grid architecture in the case of expectable future higher PV and wind energy inflows. However, this study is limited to small-scale grids and does not consider different load scenarios.
Further research using linear programming algorithms for the ecological optimization of German grids is important. It has to consider concrete future development scenarios to make German DSO fit to integrate PV and wind resources in the face of present sustainability legislation and has to enhance DSO independence from over-burdened transmission grids (compare Section 1). Ecological targets should be the central objective of grid remuneration.

3. Grid Analysis in the Federal State of Baden-Württemberg

This empirical study closes the research gap of assessing the interchange potential among DSO and considers usual power loads and simultaneously usual electricity inflows. The present situation as well as future scenarios for 2035 and 2050, when the amount of regenerative energy inflows will have increased significantly, are compared to determine grid development requirements to ensure further supply security.

3.1. Selection of Region and Local Problem Set

The study refers to the German federal state of Baden-Württemberg, the third largest German state. With a population of 11.8 million inhabitants and a surface are of 36,000 km², population density is moderate as compared to other German states. Baden-Württemberg comprises urbanized agglomerations e.g., the Rhine-Area in the northwest and the central area around the capital of Stuttgart (more than 484 inhabitants/km²) as well as rural regions in the northeast and southwest with less than 92 inhabitants/km². Electricity consumption differs strongly in between these regions, and balancing supply and demand across the regions is a key challenge to stabilize supply grids.
Baden-Württemberg lends itself for the analysis of its supply grids within the framework of an academic study since—other than most federal states—its surface area corresponds to the supply area of a single Transmission System Operator (TSO), TRANSNET BW. Transnet provides comprehensive data on supply and demand by region, which facilitates data aggregation and evaluation.
Due to the ecological restructuring of Germany’s electricity supply chain, Baden-Württemberg faces particular challenges.
Before 2017, the majority of Baden-Württemberg’s energy originated from nuclear power plants; however, these will have to be shut down by 2022. Four out of the originally five nuclear power plants do not produce electricity any longer; in January 2020, Philippsburg 2 was closed, and by December 2022, Neckarwestheim II will be unplugged [40].
To compensate for nuclear energy, Baden-Württemberg has partly expanded its seven combustion power plants, the majority of which are coal fired: the biomass power plant in Ulm opened in 2011/12, Block 8 in Karlsruhe (gas-fired) opened in 2014, and Unit 3 in Stuttgart-Gaisburg (gas-fired) opened in 2018 [16]. According to an agreement of the coal commission of the German government and German grid operators, Germany will phase out coal-fired electricity until 2038 [41].
To date (most recent data: 2018), Baden-Württemberg’s gross electricity production originates from nuclear energy (34.3%) and coal (29.2%), mainly. Gas accounts for 6.3% only. Renewable energy makes out 28.2% of the gross supply [42]. However, regenerative energy makes out only 22.7% of total consumption so far [43], which means that additional energy not produced in Baden-Württemberg has to be imported to cover electricity demand.
To meet the requirements of the nuclear and coal energy phase-out, Baden-Württemberg’s energy supply will have to be significantly reorganized further. To cover the basic grid load, the supply of regenerative energy will have to be increased, while peak power will have to be buffered by additional flexible gas-fired plants. Until 2050, the share of regenerative electricity is planned to increase to 80% of total consumption [44].
However, the flexibility to increase local supply in regenerative electricity is limited. In 2018, the production of photovoltaic energy increased by 8.6% on the previous year (to a share of 8.6% of total supply). Production from wind energy increased by 27% to a share of 4.2% from total supply. Biomass energy increased by 1.7% only to 8.2%, and waterpower diminished to 5.2% of total supply (for climatic reasons) [44]. Although wind energy expansion is the regenerative resource with the highest growth potential, it is about to reach its limits: out of the 1200 wind energy plants planned in 2012, only 725 are in operation in 2020. Increasingly, residents as well as environmentalists themselves oppose the installation of new plants, which destroy animal habitats and unnerve dwellers [45].
If this trend keeps up, the required share of 80% of regenerative energy from consumption will hardly be available in Baden-Württemberg until 2050. Additional—ideally regenerative—electric energy will have to be imported to Baden-Württemberg to reach electricity reorganization objectives. Off-shore windfarms in the Northern and Baltic Sea could compensate for local deficits in regenerative production, but the grid remuneration to transport electricity from sea to shore and further from Germany’s far North to the Southern country of Baden-Württemberg is a challenge: The off-shore grid operator TeneT is authorized to transport off-shore electricity produced in German and Dutch sites to the shore via cables. Today, the installed capacity is 6.5 GW, and it is planned to increase to 15 GW by 2030 [46]. Assuming that Baden-Württemberg would obtain 1:8 of this planned power production (corresponding to its share from Germany’s total population, i.e., 1.875 GW), this input could just substitute the equivalent power output of one larger local power plant (Rheinhafen-Dampfkraftwerk Karlsruhe of 1818 MW electric power) [16].
Transmission is an additional problem to off-shore sources. To date, off-shore supply cables are liable to defects and face high transmission losses, which are particularly poignant for southern countries [47]. Presently, the North Sea is supplied by 15 converters and 12 cables via three substations. The paucity of alternative transmission lines is a significant supply chain risk.
Transmission losses in European electricity grids amount to 6% of grid power performance and result from the ohmic resistance of transmission lines. Transmission losses increase exponentially with the length of the transmission distance and account for about 1% per 100 km depending on the voltage and type of transmission line [48]. Thus, the efficiency of remote supply is limited by the distance to the plant.
Thus, sourcing regenerative energy inflows from offshore or abroad locations sources is no comprehensive sustainable solution to Baden-Württemberg’s emerging electricity supply problem.
Regenerative resources, no matter of what origin, are intermittent, i.e., they are available only when the sun shines and wind blows. Even if the power installed in the form of nuclear and coal plants would be replaced by power from regenerative resources completely, this installed power would not suffice to substitute classical plants—at least not in the present grid infrastructure.
The future of regenerative electricity moreover is uncertain: Germany’s regenerative power plants are profitable due to government subsidies only. Based on the Erneuerbare Energie Gesetz (EEG) law, the state today pays a compensation of up to 0.506 €/kWh for electricity complying with EEG regulations e.g., from PV plants [49]. However, the European Energy Exchange (EEX) market price is 0.025 €/kWh only [50]. The subsidized electricity payment according to EEG law is limited to the first 20 years of plant operation. After the phase-out of the subsidy, the electricity producer must self-distribute her production via the EEX or conclude bilateral OTC agreements, which causes additional transaction costs. These are prohibitively high for smaller plant operators. Moreover, the costs for PV and wind plant maintenance and repair that incur after the subsidy phase-out are not covered by revenues anymore, which could in the mid and long term force suppliers to shut down sustainable energy production. Wind power plants face the additional problem that efficiency advancements in already highly refined wind power technology depend on the construction of always larger wind turbines [51]. However, the replacement of existing wind turbines by equally large plants or even larger ones is frequently impossible due to the sharpening of regulations concerning size and distance from inhabited areas [52].
Baden-Württemberg’s energy supply problems due to the German “Energiewende” in sum originate in two major difficulties:
  • Regenerative electricity supply of any origin is scarce, intermittent, and too costly compared to European spot-market prices.
  • Remote (offshore or foreign) regenerative electricity supply is limited due to limitations of grid infrastructure and transmission power losses.
Both problems could be mitigated if electric grids were utilized more efficiently. Most regenerative electricity resources—biogas, solar, and wind power—originate from small power plants that are distributed across the country. By 2017, EnBW operated 16 wind farms, each comprising several wind turbines and 22 photovoltaic systems (across Baden-Württemberg). Lots of private photovoltaic supply systems are installed on the roofs of plants and private houses and feed on the electric grid. These decentral power units are in closer proximity to local energy consumers than large centralized coal and nuclear energy fired plants, since they cause less pollution and are perceived to be less noisy, impairing, and disruptive [53]. The local production and consumption of energy saves transmission losses and the construction of expensive high-voltage lines. However, Baden-Württemberg’s grids must be analyzed and possibly adapted to manage regenerative local instead of centralized conventional power flows in the future.

3.2. Compilation and Evaluation of Grid Data

3.2.1. Future Scenarios for Power Inflow and Demand to the BW Grid

The following assumptions made are based on political targets that are defined by “Gesetz zur Förderung des Klimaschutzes in Baden-Württemberg“ [54] and “Monitoring Bericht der Energiewende in Baden-Württemberg“ [55]. Additionally, the climate protection program of 2030 of the German federal government to implement the climate protection plan of 2050 [56] are considered, which also take the planed future development of electric mobility into consideration.
Accordingly, regenerative energies are intended to cover 80% of electricity supplies. Generation in the transmission grid area will be less diversified in the future. Nuclear power will no longer contribute to Germany’s energy supply in 2022, and coal will also be gradually phased out by 2038. An expansion of large-scale hydropower is also not to be expected in Germany; there is simply not enough potential left. As a result, expansion in the transmission grids will only be pursued in wind power generation with the problems already described.
A similar picture emerges in the high-voltage grid with the result that generation in the lower voltage levels is becoming increasingly important. To achieve the defined goals of reducing CO2 emissions, the lower voltage levels must be expanded to a defined extent.
The present analysis shows how these targets could be achieved for decentralized energy production, which as detailed above is more resilient to intermittent energy inflows than centralized production in large plants.
The study collects power supply and consumption data for the 109 local part grids in Baden-Württemberg under different conditions and for altogether 36 scenarios of power inflows and loads on the BW grid. The central documents underlying these future scenario assumptions are the “Gesetz zur Förderung des Klimaschutzes in Baden-Württemberg“ [54] and “Monitoring Bericht der Energiewende in Baden-Württemberg“ [55]. The scenarios additionally include the climate protection program of 2030 of the German federal government to implement the climate protection plan of 2050 [57,58].
The present analysis shows how these goals could be achieved under the premise of decentralized generation. There are two criteria that must be met: first, the increase of local production until 2050, and secondly, the reduction of energy consumption. The state government of Baden-Württemberg has responded to these criteria with a wide range of programs [59,60,61].
The scenarios are based on the political targets and guidelines for the ecological remuneration and reorganization of the electricity grid of the government of Baden-Württemberg.
Three time points are compared:
(a)
Present situation
(b)
Scenario in 2035
(c)
Scenario in 2050.
The time points represent major steps in the conversion of the energy system from the present situation to 2035 to 2050 (see Figure 1).
The present supply and consumption values (scenario a) are compiled from local grid operators’ homepages and partly are collected manually upon direct e-mail contact with the local providers. Daily values differ significantly due to the frequent extraordinary supply and demand events (e.g., technical problems, shutdown of large consumers, revision of supply units). To eliminate these disturbances to regular electricity supply and demand, the loads and demand values are aggregated to a cumulative supply–demand curve for three intervals—summer, winter, and transit (spring/autumn) period—for each part grid. These three seasons are assessed for both future scenarios, which results in six relevant future time points.
The substitute value was calculated based on the regulations from the Metering Code VDE Application Rule AR 4400 [62]. In the event of system failure, whether on the supply or demand side, the scaling comparative value procedure according to the Metering Code was applied: Accordingly, values from reference plants in the area (comparable concerning energy source, customer behavior, geographical location, and weather situation, etc. as available from the plant or grid operator) are applied. These are based on operational measurements and historical values, as work bands are unavailable.
In this case, the historical values are used as a basis, which is the most obvious and simplest approach. The median value of the 3 years was used to form the aggregated load profile.
{ ¯ { x } } _ { m e d } = x _ { ( { n + 1 } { 3 ) } }
Scenarios b and c are designed for each part grid and the three time points (summer, winter, transit) according to the present plans for supply restructuring according to the EEG and based on the required CO2 reductions until 2050. The analysis considers altogether six scenarios for the development of demand and supply on the regional grids for each future time point (2035 and 2050, summer, winter, and transit):
a.
An increase of grid load of 5% until 2035 and another 5% until 2050.
b.
A decrease of grid load of 5% until 2035 and another 5% until 2050.
And at the same time:
c.
A decrease of decentral regenerative feed-in on the grid of 20% until 2035 and another 20% until 2050.
d.
Constant decentral regenerative feed-in on the grid in 2035 and 2050.
e.
An increase of the decentral regenerative feed-in on the grid of 20% until 2035 and another 20% until 2050.
This estimate for the future growth of grids according to a and c refers to Rösch and Treffinger (2019). Scenario e assumes that PV and wind energy feed-in will decrease due to the phase-out of the subsidy for these technologies after 20 years of operation and the consecutive lacking profitability from an operator perspective. The scenarios are combined in a 2 (a, b) × 3 (c, d, e) matrix to assess altogether six possible supply–demand situations for the six time points of summer, transit, and winter in 2035 and 2050: altogether, 36 future supply and consumption scenarios. The following table (Table 3) summarizes the relevant future scenarios:

3.2.2. Description of the Optimization Problem

The study is based on the following framing model assumptions. In Baden-Württemberg, there are m grid operators who have sufficient generation capacity within the distribution network to cover their own demand and also to provide capacity a i to neighboring distribution networks. On the other hand, there are n grid operators, which do not have sufficient power generation capacity within the distribution network to cover their own demand. This results in a demand for capacity b j , which is open to be covered. To make this capacity available, the distance d i j needs to be overcome for the transportation from i to j . The sum of the available capacity a i is lower than the required capacity b j :
j = 1 n b j > i = 1 m a i .
To remedy this undersupply, the upstream grid level requires an “infinite grid”, which covers all gaps that cannot be covered by the operator’s own production.
a ( n + 1 ) = j = 1 n b j i = 1 m a i = R i
Ideally, the necessary import of electricity from outside of Baden-Württemberg, e.g., from regenerative sources in the North Sea, is possibly low, since Baden-Württemberg should operate self-reliantly to reduce dependency on external providers and minimize the distance of energy transportation and consecutive losses and costs.
The task is now to find a capacity delivery plan in form of a transportation matrix
X = ( x i j ) R m n
that constrains the capacity deliveries x i j from production side i to consumer site j and minimizes the total capacity kilometers. Capacity kilometers are defined as the product MW × k m = D following the definition of the payload distance in logistics and transportation measurement.
Minimize D = i = 1 m j = 1 n d i j x i j + R i
Subject to
j = 1 m x i j + R i = a i , j = 1 , , m ,
i = 1 n x i j = b i , i = 1 , , n ,
x i j 0 , i = 1 , , n , j = 1 , , m ,
The minimization job delivers three interesting results:
  • The optimal transportation amount from suppliers j = 1 to n to consumers i = 1 m as a matrix and the total electricity deficit for Baden-Württemberg in each case, which must be imported.
  • Distributions of the DSOs, which require a certain capacity on the grid. These required capacities are often located in a short range. This abets a local approach and thereby contributes to the aim of minimizing the needed amount of infrastructure (e.g., avoid the construction high-voltage lines, substations, and transformers).
  • The necessary energy flows in between the regions are summarized visually in the form of maps illustrating the required main energy flows in between the areas. These are useful to assess which grid lines must be developed further. The energy flow charts are created for the 2050 scenario only, since this represents the target for grid transformation according to Gesetz zur Förderung des Klimaschutzes in Baden-Württemberg [63] in Baden-Württemberg.
The three result categories are presented in Section 4.

4. Results

For a better understanding of the results of the optimizations, four different key numbers were developed, which are shown in Table 4.

4.1. Necessary Electricity Imports from Outside Baden Württemberg for the Scenarios

Based on the linear optimization model, the difference of supply and demand in Baden-Württemberg electricity grids for the 36 possible future scenarios has been calculated, if it is operated according to the results of the linear programming problem in the way suggested by the linear model; i.e., transportation distances are minimized. It shows to what extent the Baden-Württemberg grid can operate independently outside of electricity imports for the future scenarios. Independence from outside imports is desirable to reduce supply uncertainty and energy losses for transportation. Table 4 summarizes the absolute energy inflows Ei in the basic year 2020 and for the scenarios including an increasing load or decreasing load and decreasing, constant, and growing feed-in of regenerative energies for the years 2035 and 2050 in MW (summer, transit, and winter period).
The scenarios are described in detail in Table 5. Table 6 illustrates that today, Baden-Württemberg cannot cope without electricity imports; these are highest in the winter season (497.62 MW) and lowest in summer (337.87 MW). For most future states, Baden-Württemberg is dependent on external electricity imports; Baden-Württemberg could become independent only in 2050 (or even export electricity, if at the same time feed-in is increased and load on the grid diminished according to the scenarios described in Section 3.2).
However, some future scenarios mean a positive development as compared to the present state, since outside dependencies are diminished, while other scenarios imply increased dependency. Table 6 illustrates the future change in required external inflows to the Baden-Württemberg grid for the 36 scenarios as compared to the present situation. Developments toward lower dependency on external inflows are marked in green, while higher dependencies are in red:
According to Table 6, a decrease in regenerative feed-ins will always cause growing deficits for growing grid loads. Diminishing grid loads contribute to balance Baden-Württemberg’s energy supply and demand, but this effect does not lead to independence if at the same time regenerative energy feed-ins diminish.
In addition, the degree of autonomy Ap for Baden-Württemberg is determined. The degree of autonomy of the respective scenario puts the generation capacities in relation to the consumption capacities:
A p = j = 1 n a i i = 1 m b j .
The degree of autonomy indicates the extent to which the regional generation capacities are sufficient to cover demand and includes the prospective development for the future scenarios. Obviously, only a combination of increasing decentralized feed-in and increasing energy efficiency resulting in lower loads meets the targets of Gesetz zur Förderung des Klimaschutzes in Baden-Württemberg.
Table 7 illustrates that for a diminution of load and an increase of feed-in until 2050, 100% autonomy can be achieved.
Furthermore, the number of the respective connections (or the degree of meshing) GoIp in the scenarios that is necessary to calculate the model is determined for each scenario. This key figure indicates the number of interconnections O. These have been calculated in the optimization. The degree of interconnectedness corresponds to the actual line connections that would be necessary to raise the potentials of increased regenerative energy supply:
G o I p = j = 1 n O i i = 1 m C j .
GoIp calculates the share of realized interconnections from the maximal number of interconnections C (which is 13,225), when each location is interconnected with each other. Table 8 lists the GoIp for the different scenarios.
Table 8 is interpreted as follows. The basic share of interconnections is around 5%. With growing feed-in on the grid, the number of interconnections increases. The reduction of load has obtained a similar effect. The share of interconnectedness increases when feed-in increases and load diminishes. With growing numbers of feeding-in participants and diminishing loads until 2050, the grade of interconnectedness increases. Table 9 makes the same point and contains the absolute number of connections in the BW grid for the different scenarios.
The number of interconnections results from the optimal linkage of each grid participant to its neighbors. The model aims at finding the shortest possible connections to keep the transportation effort as low as possible. The shortest connection leads to the direct neighbor (first degree neighbor). However, in some cases, the potential of first-degree neighbor capacity is insufficient, and a connection to a second-degree neighbor must be established (compare illustration Figure 2).
To calculate the number of long connections, the absolute number of connections TC (A to B and A to C) refers to the number of connections bridging the larger distance LC (from A to C). This ratio results in the RCt coefficient. The optimization problem is formulated so that—if possible—brief connections are preferred.
R C t = j = 1 n L c i i = 1 m T c j
The following Table 10 shows that the number of long connections diminishes in low load and high feed-in scenarios until 2050: to around 180 from a baseline number of long-distance connections of about 200 and depending on the development of feed-in and loads.
Table 11 illustrates the development of RCt. With growing loads and diminishing feed-ins, the number of long-distance connections has to increase. However, with diminishing loads and growing numbers of feed-ins, the number of long-distance connections reduces; this stabilizes the local grid and results in increased independence of BW from outside inflows.
For constant regenerative feed-ins on the grid—a probable situation in the phase of growing resistance to wind power plants—load increases would only reduce dependence in the transit periods, while dependency would aggravate in summer and winter periods. This result equally proves that grid optimization according to the model disposes of a positive potential: At constant regenerative supplies, the negative effects of a load increases are fully compensated by collaboration between neighbors in the transit period and partly compensated in the summer and winter period.
The degree of collaboration between immediate neighbors increases with the share of regenerative feed-in. Grid optimization is even more effective if regenerative feed-in increases as planned. Even if grid loads increase under these conditions, an independence of Baden-Württemberg from Germany’s high-distance grid can be realized. Load decreases in Baden-Württemberg lead to the independence of Baden-Württemberg from the German grid if its own regenerative energy feed-ins remain constant or increase.
(Collaboration between neighbors could improve) Grid optimization according to the scheme of the linear model will in any case improve Baden-Württemberg’s self-reliance in electricity supply as well as reduce external inflows, supply chain risks, and transportation losses. The necessity of constructing new high-voltage lines in Baden-Württemberg will be reduced, since low-voltage lines usually suffice to distribute electricity in regional grids.

4.2. Transportation Capacities for the Scenarios

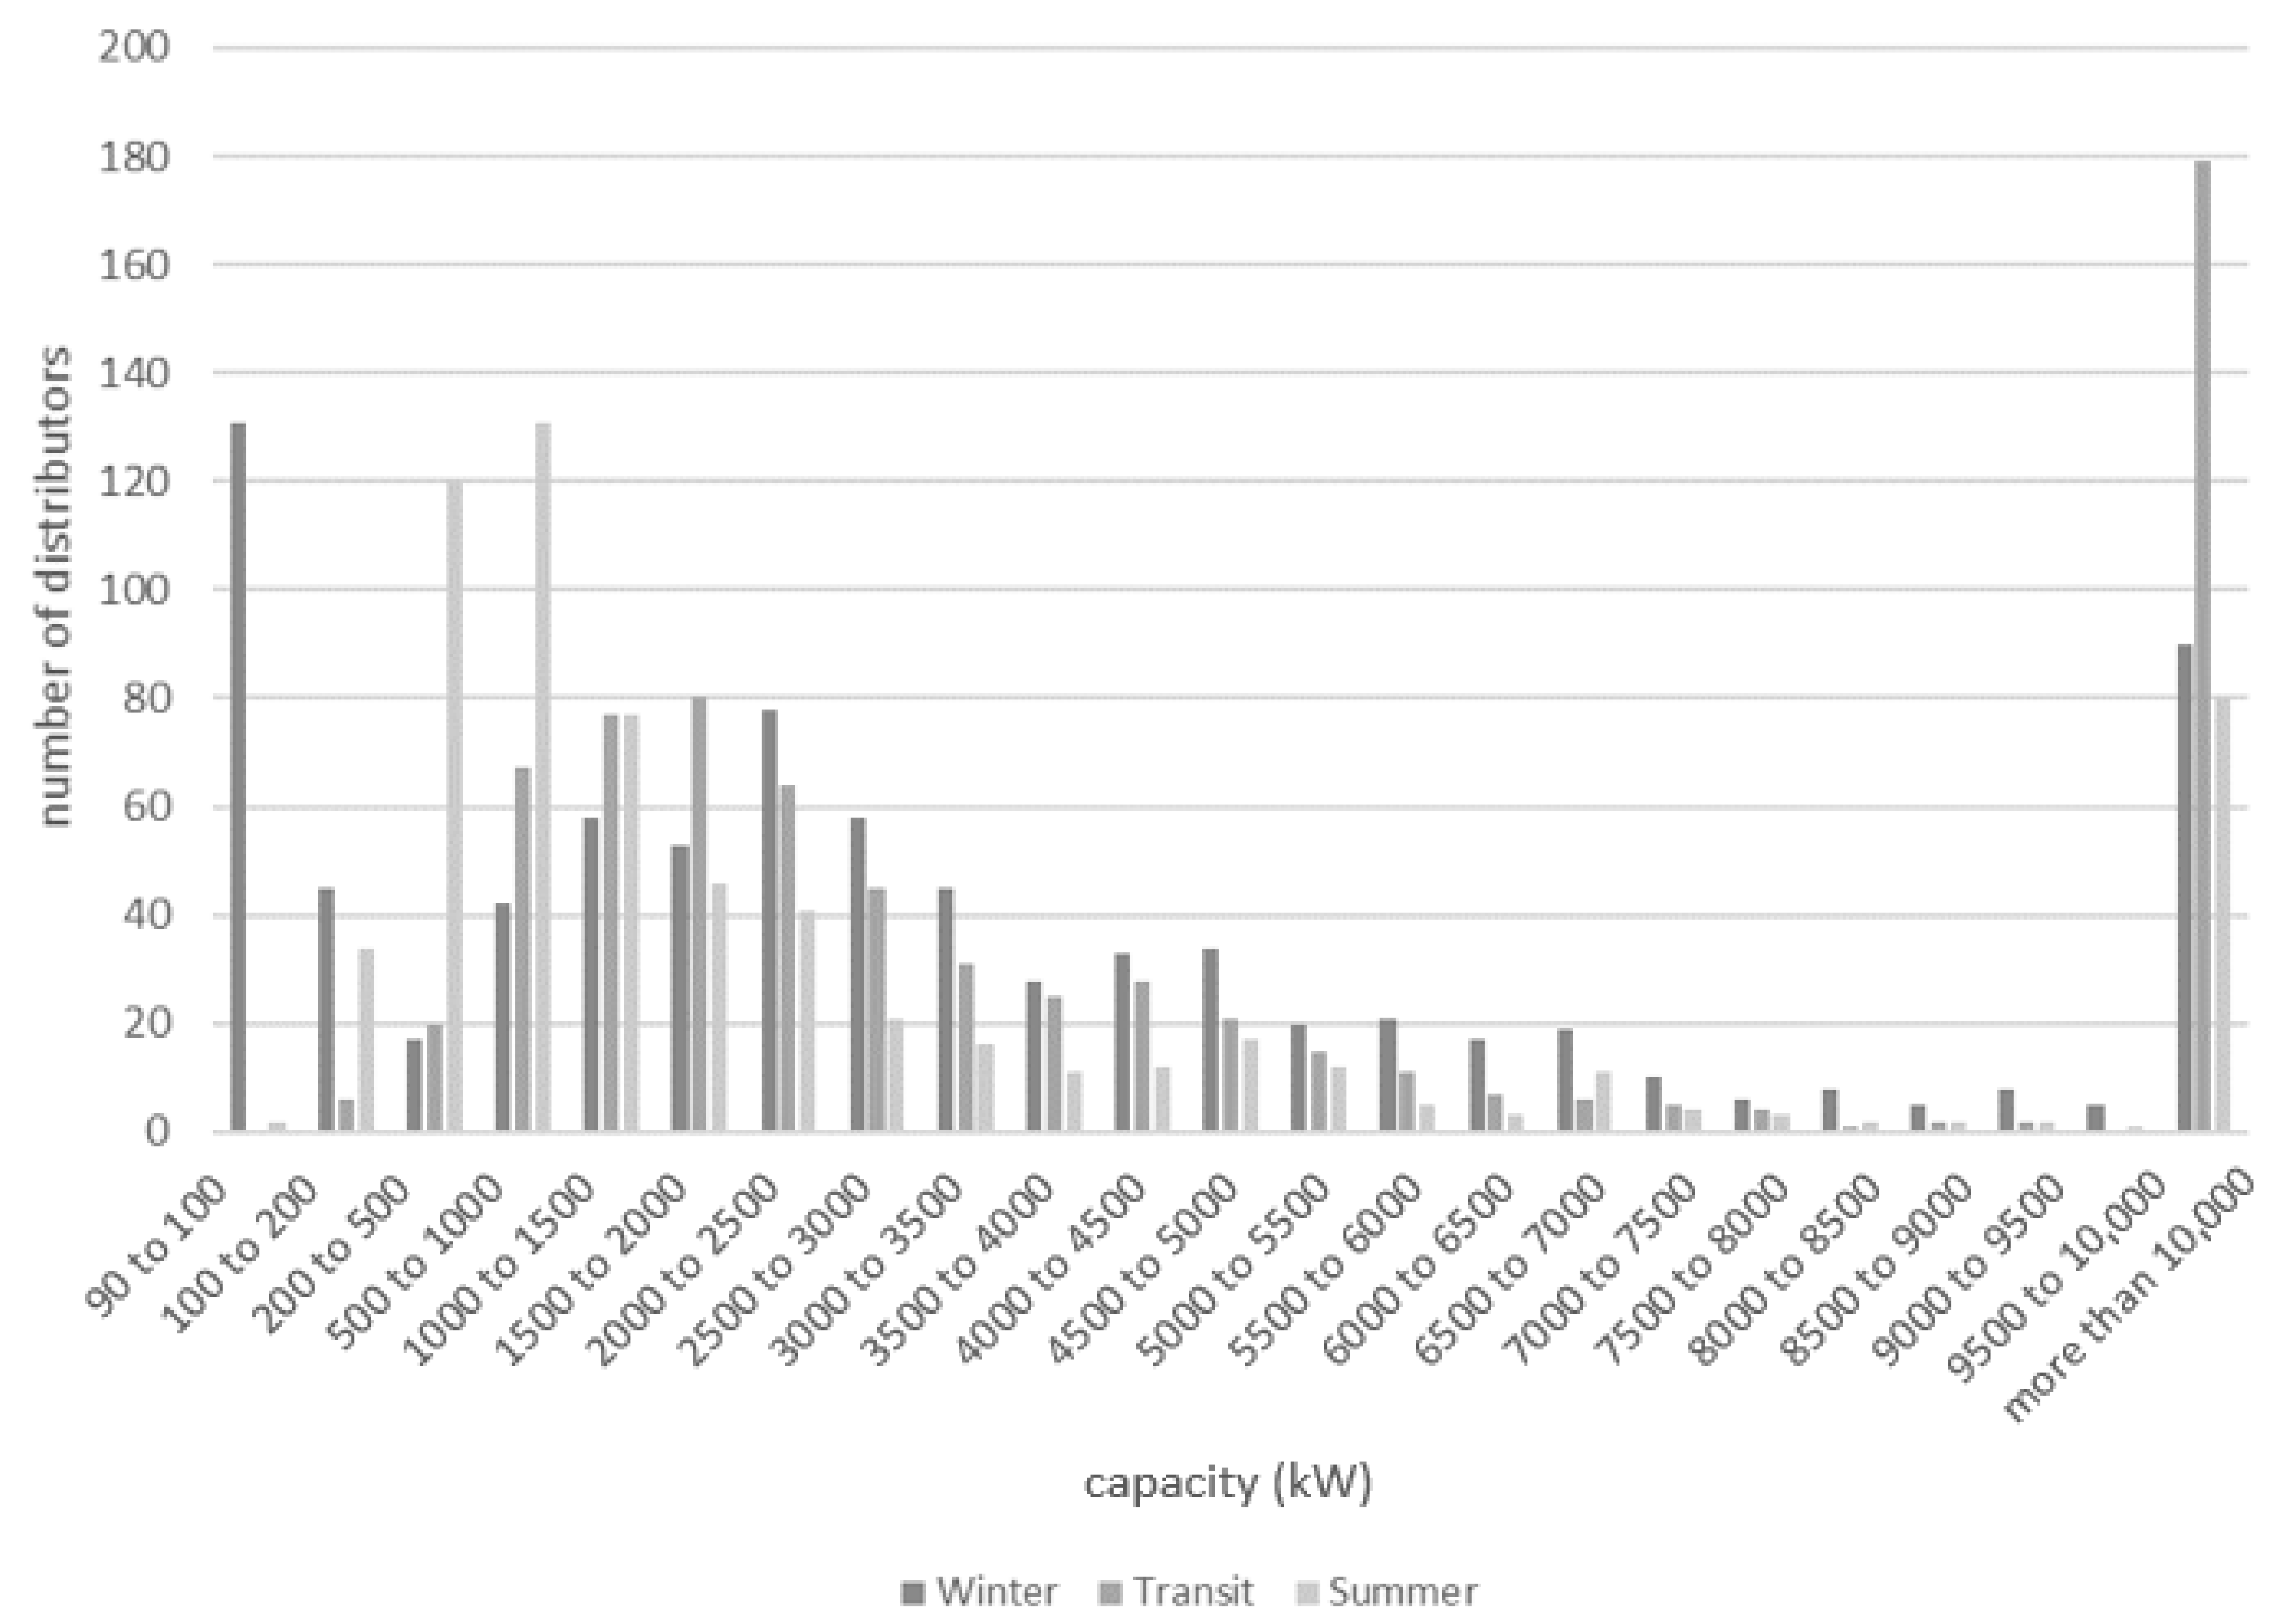
Required transportation capacities on the Baden-Württemberg grid are analyzed in more detail by assessing the necessary distribution of low, medium, and high-voltage lines for the different scenarios. To illustrate the principle of analysis, Figure 3 shows the distribution of distributors by capacity sizes.
This is the available capacity that is free to cover a shortfall in a neighboring network area. If there is not enough installed capacity in the grid area of grid operator A to cover demand, A takes recourse to a neighboring network B, which has higher capacity available than required at this time point to cover our own demand and hence can make capacity available. It must be considered that the actual capacity differs considerably from the installed capacity, as the installed capacity for renewable plants is only a theoretical value that is usually not reached in practice. Real capacity is calculated as follows:
C real = C inst E ist E max
Eist = power output from installed capacity at time interval Δ t.
Emax = maximum possible power output = Cinst * t.
Cinst = installed capacity.
In the present (2020) situation and for the three seasons of winter, transit, and summer, the following real capacities are calculated.
Figure 3 shows that the distribution of electricity distributors varies between the winter, transit, and summer seasons. The number of very small distributors below 100 kW capacity is high in the winter period. The number of very large distributors (of more than 10,000 kW) in the transit period is more than double that in the summer and winter period. The number of distributors of 200 to 1000 kW in summer is more than double that in the winter and transit period.
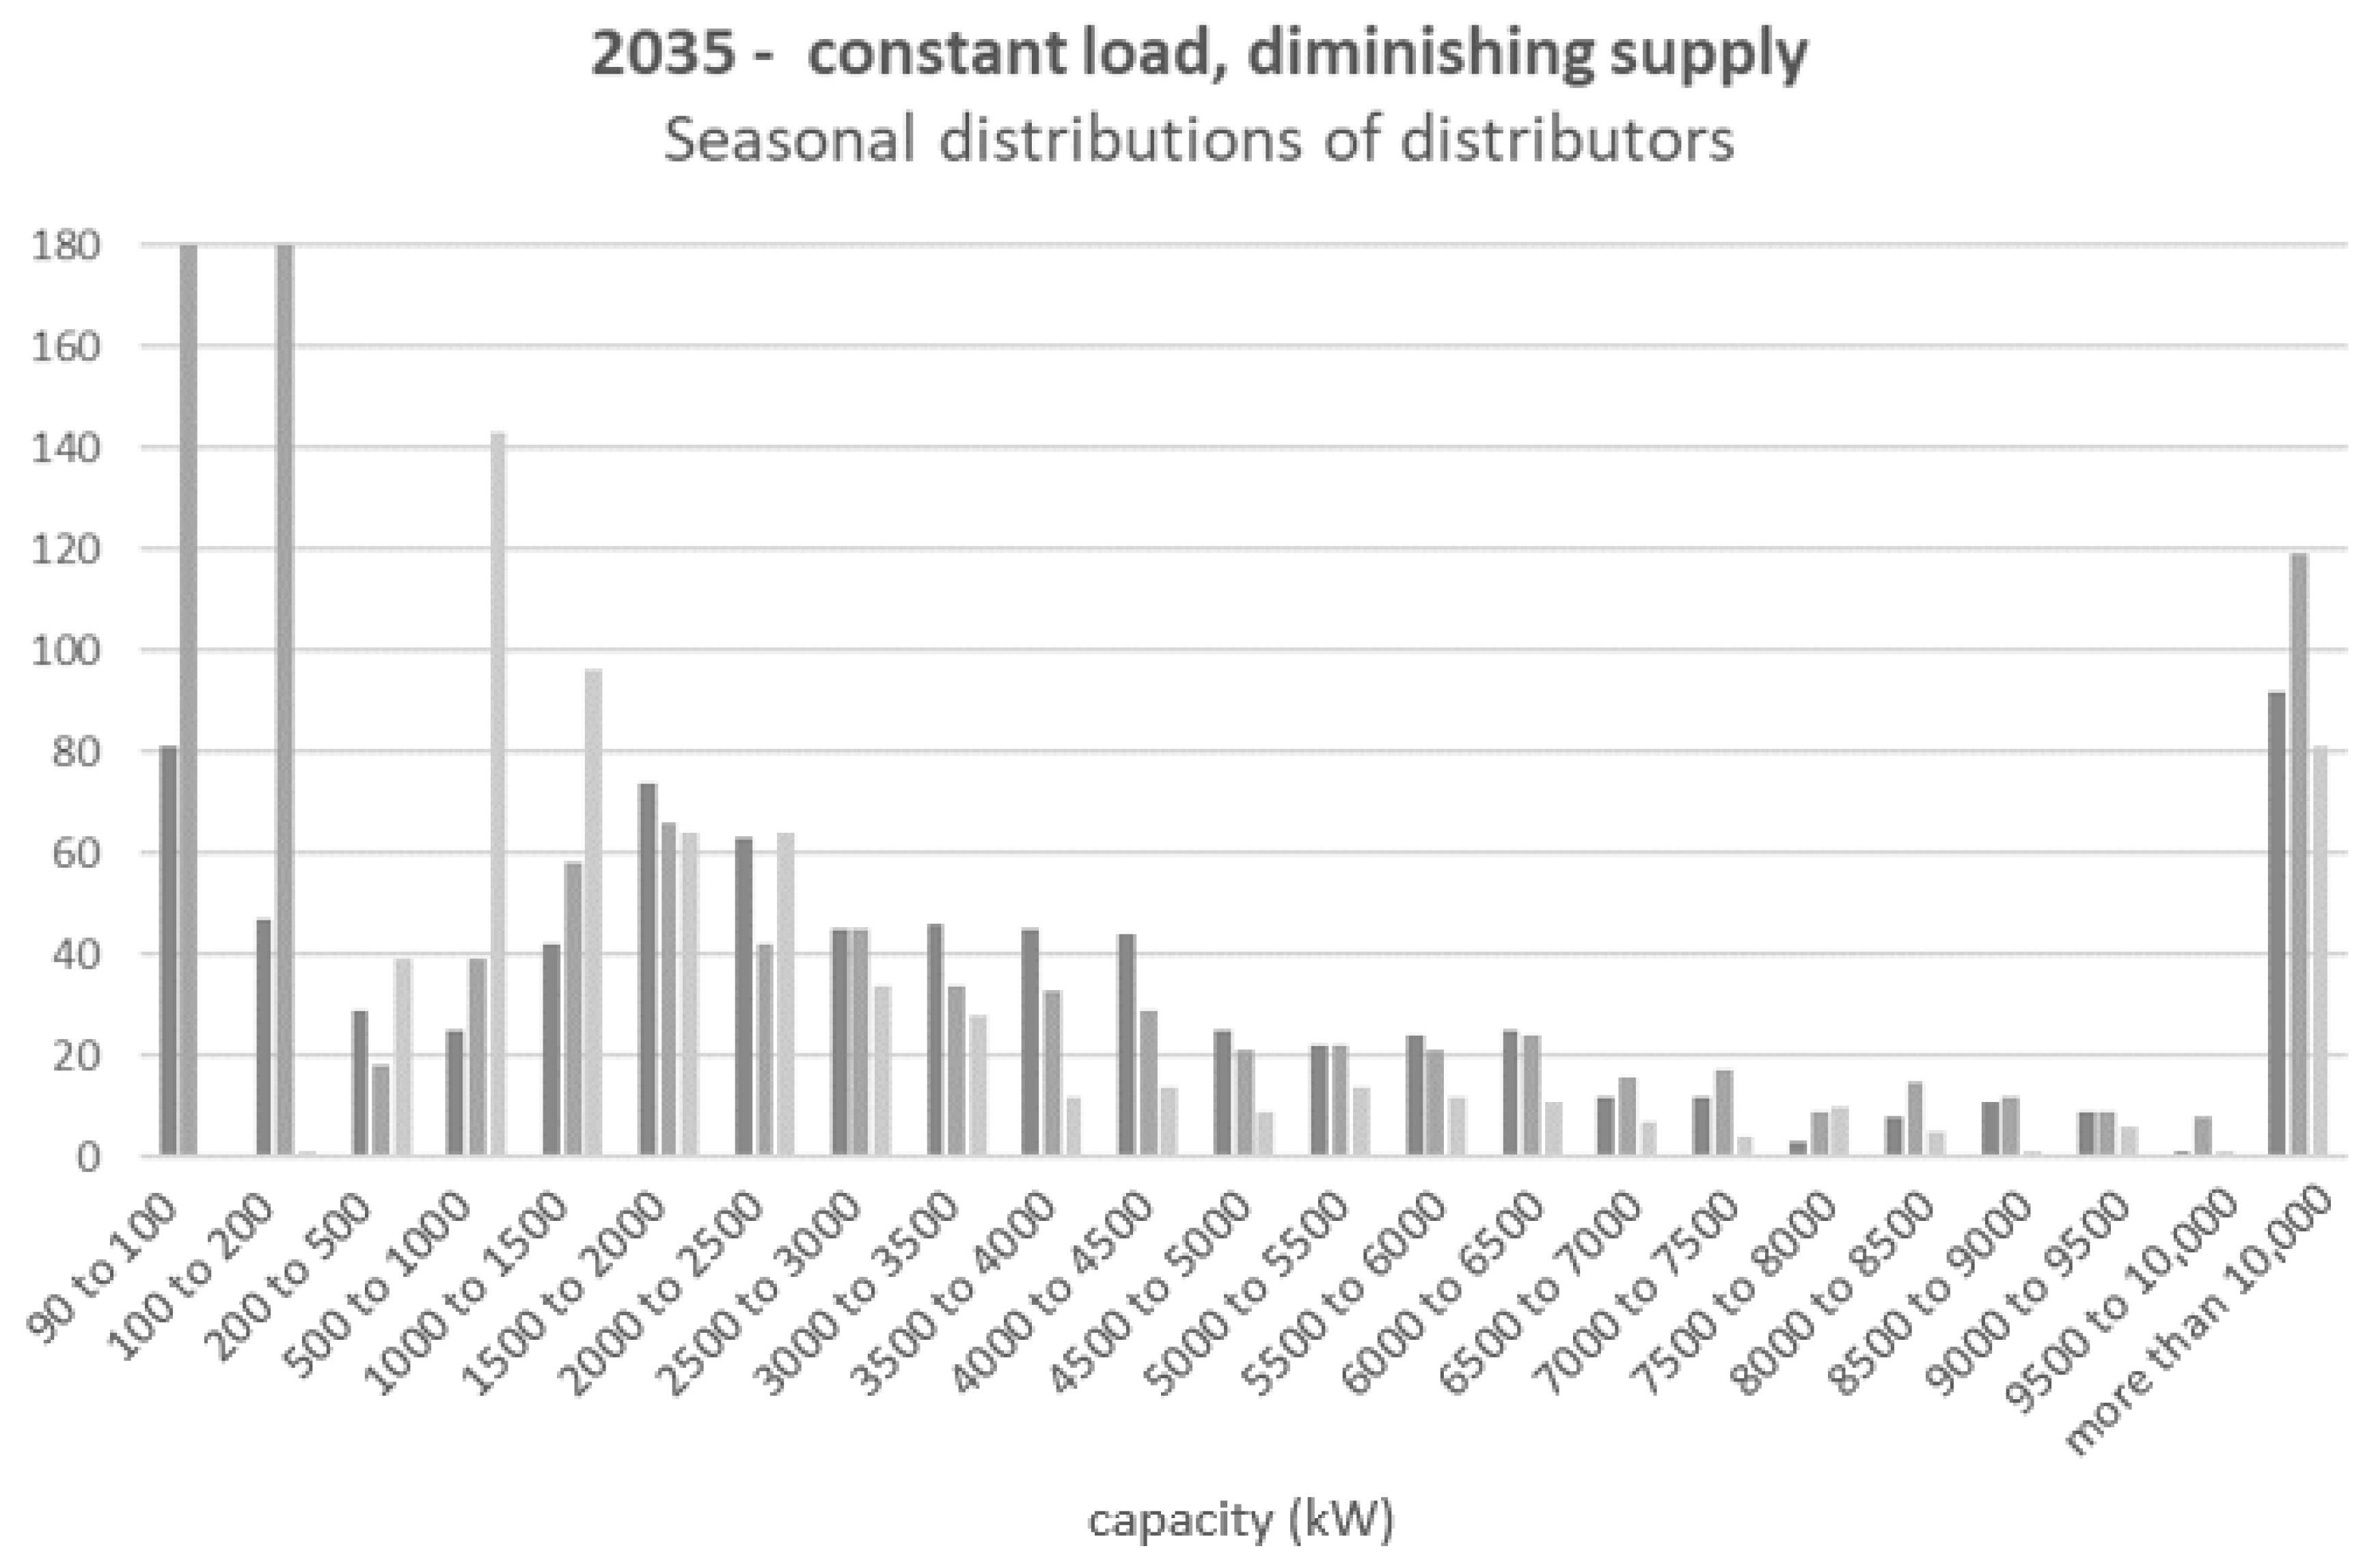
As illustrated, grid capacity in 2035 and 2050 will be transgressed mainly in case of higher grid loads and for lower and constant feed-ins. These critical situations must be assessed in more detail concerning the distribution of distributors by sizes. Figure 3 illustrates the distribution of distributors for this critical scenario in 2035, and Figure 4 illustrates the distribution for a continuously diminishing supply at constant load for 2050.
Comparing the distribution of distributors in the present (2020) and in 2035 first, the number of distributors with very low capacities (below 200 kW) in the winter/transit period and 500 to 2000 kW in summer will increase strongly to almost 600 in the transit and summer period due to an increased share of small-scale regenerative energy producers (PV and wind). At the same time, the share of very large distributors of more than 10,000 kW will remain constant in the summer and winter period, but it will diminish in the transit period. Comparing 2020 and the critical situation in 2035 as a whole, the distribution of distributors will further deviate from the desirable normal distribution until 2035.
In summary, grids will have to be remunerated to accept a larger amount of small-scale inflows of less than 200 kW providers in the winter and transit periods and 500 to 2000 kW providers in the summer period, while at the same time, high-voltage capacities for large providers will have to be maintained until 2035, since, particularly in winter, electricity provision cannot cope without large centralized providers.
Comparing the distribution of distributors by (real) capacities for 2035 and 2050, it is obvious that very small providers—i.e., private PV and wind electricity producers—will widely disappear, since subsidies for the installation of small-scale regenerative plants run out and the profitability of maintaining aging small-scale plants is questionable. Larger providers of a capacity of 500 to 2500 kW will take their place in the grid. The relevance of very large providers of more than 10,000 kW will remain constant.
In the period of 2035 to 2050, the Baden-Württemberg grid will accordingly have to be reorganized again, and now, a higher capacity of medium-sized transmission lines will be required to ease access for the small-to-medium capacity regenerative energy providers. The dense small-scale grid infrastructure required for the acquisition of low-capacity providers (e.g., private households with rooftop PV units or single community wind plants) will become obsolete when these entities disappear from the market due to a phase-out of subsidies and raising maintenance efforts.

4.3. Energy Flow Charts for the 2050 Scenarios

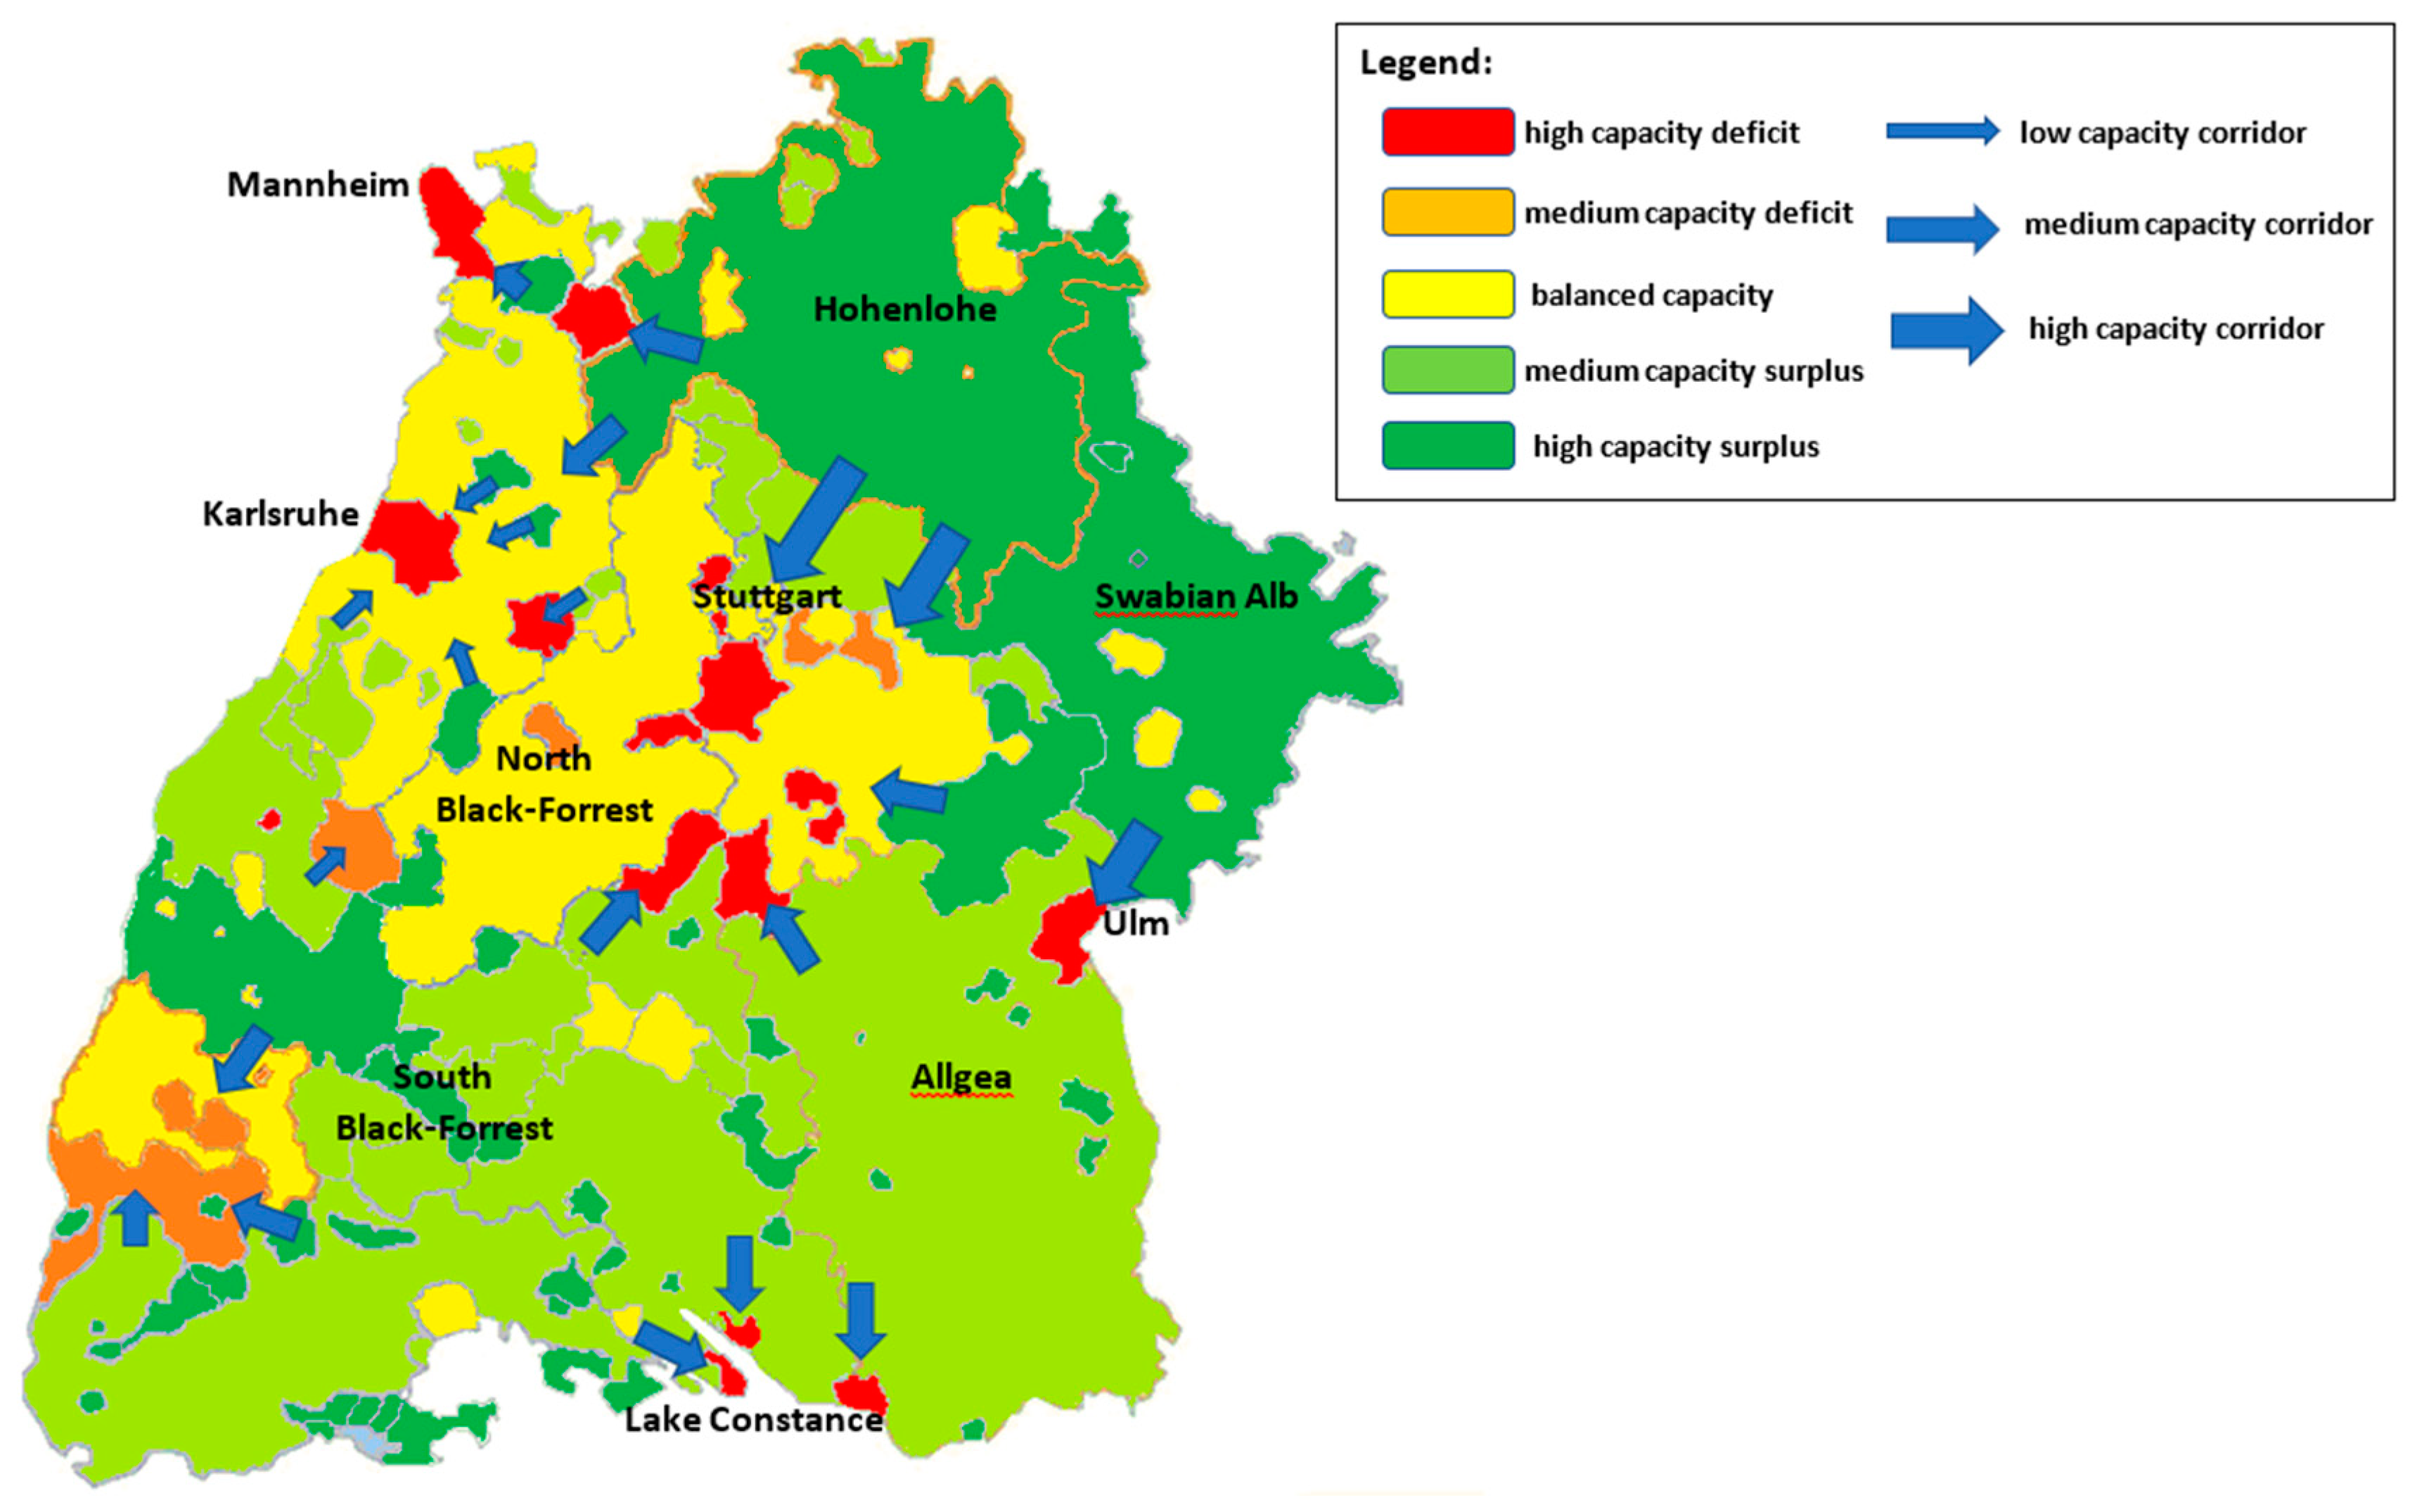
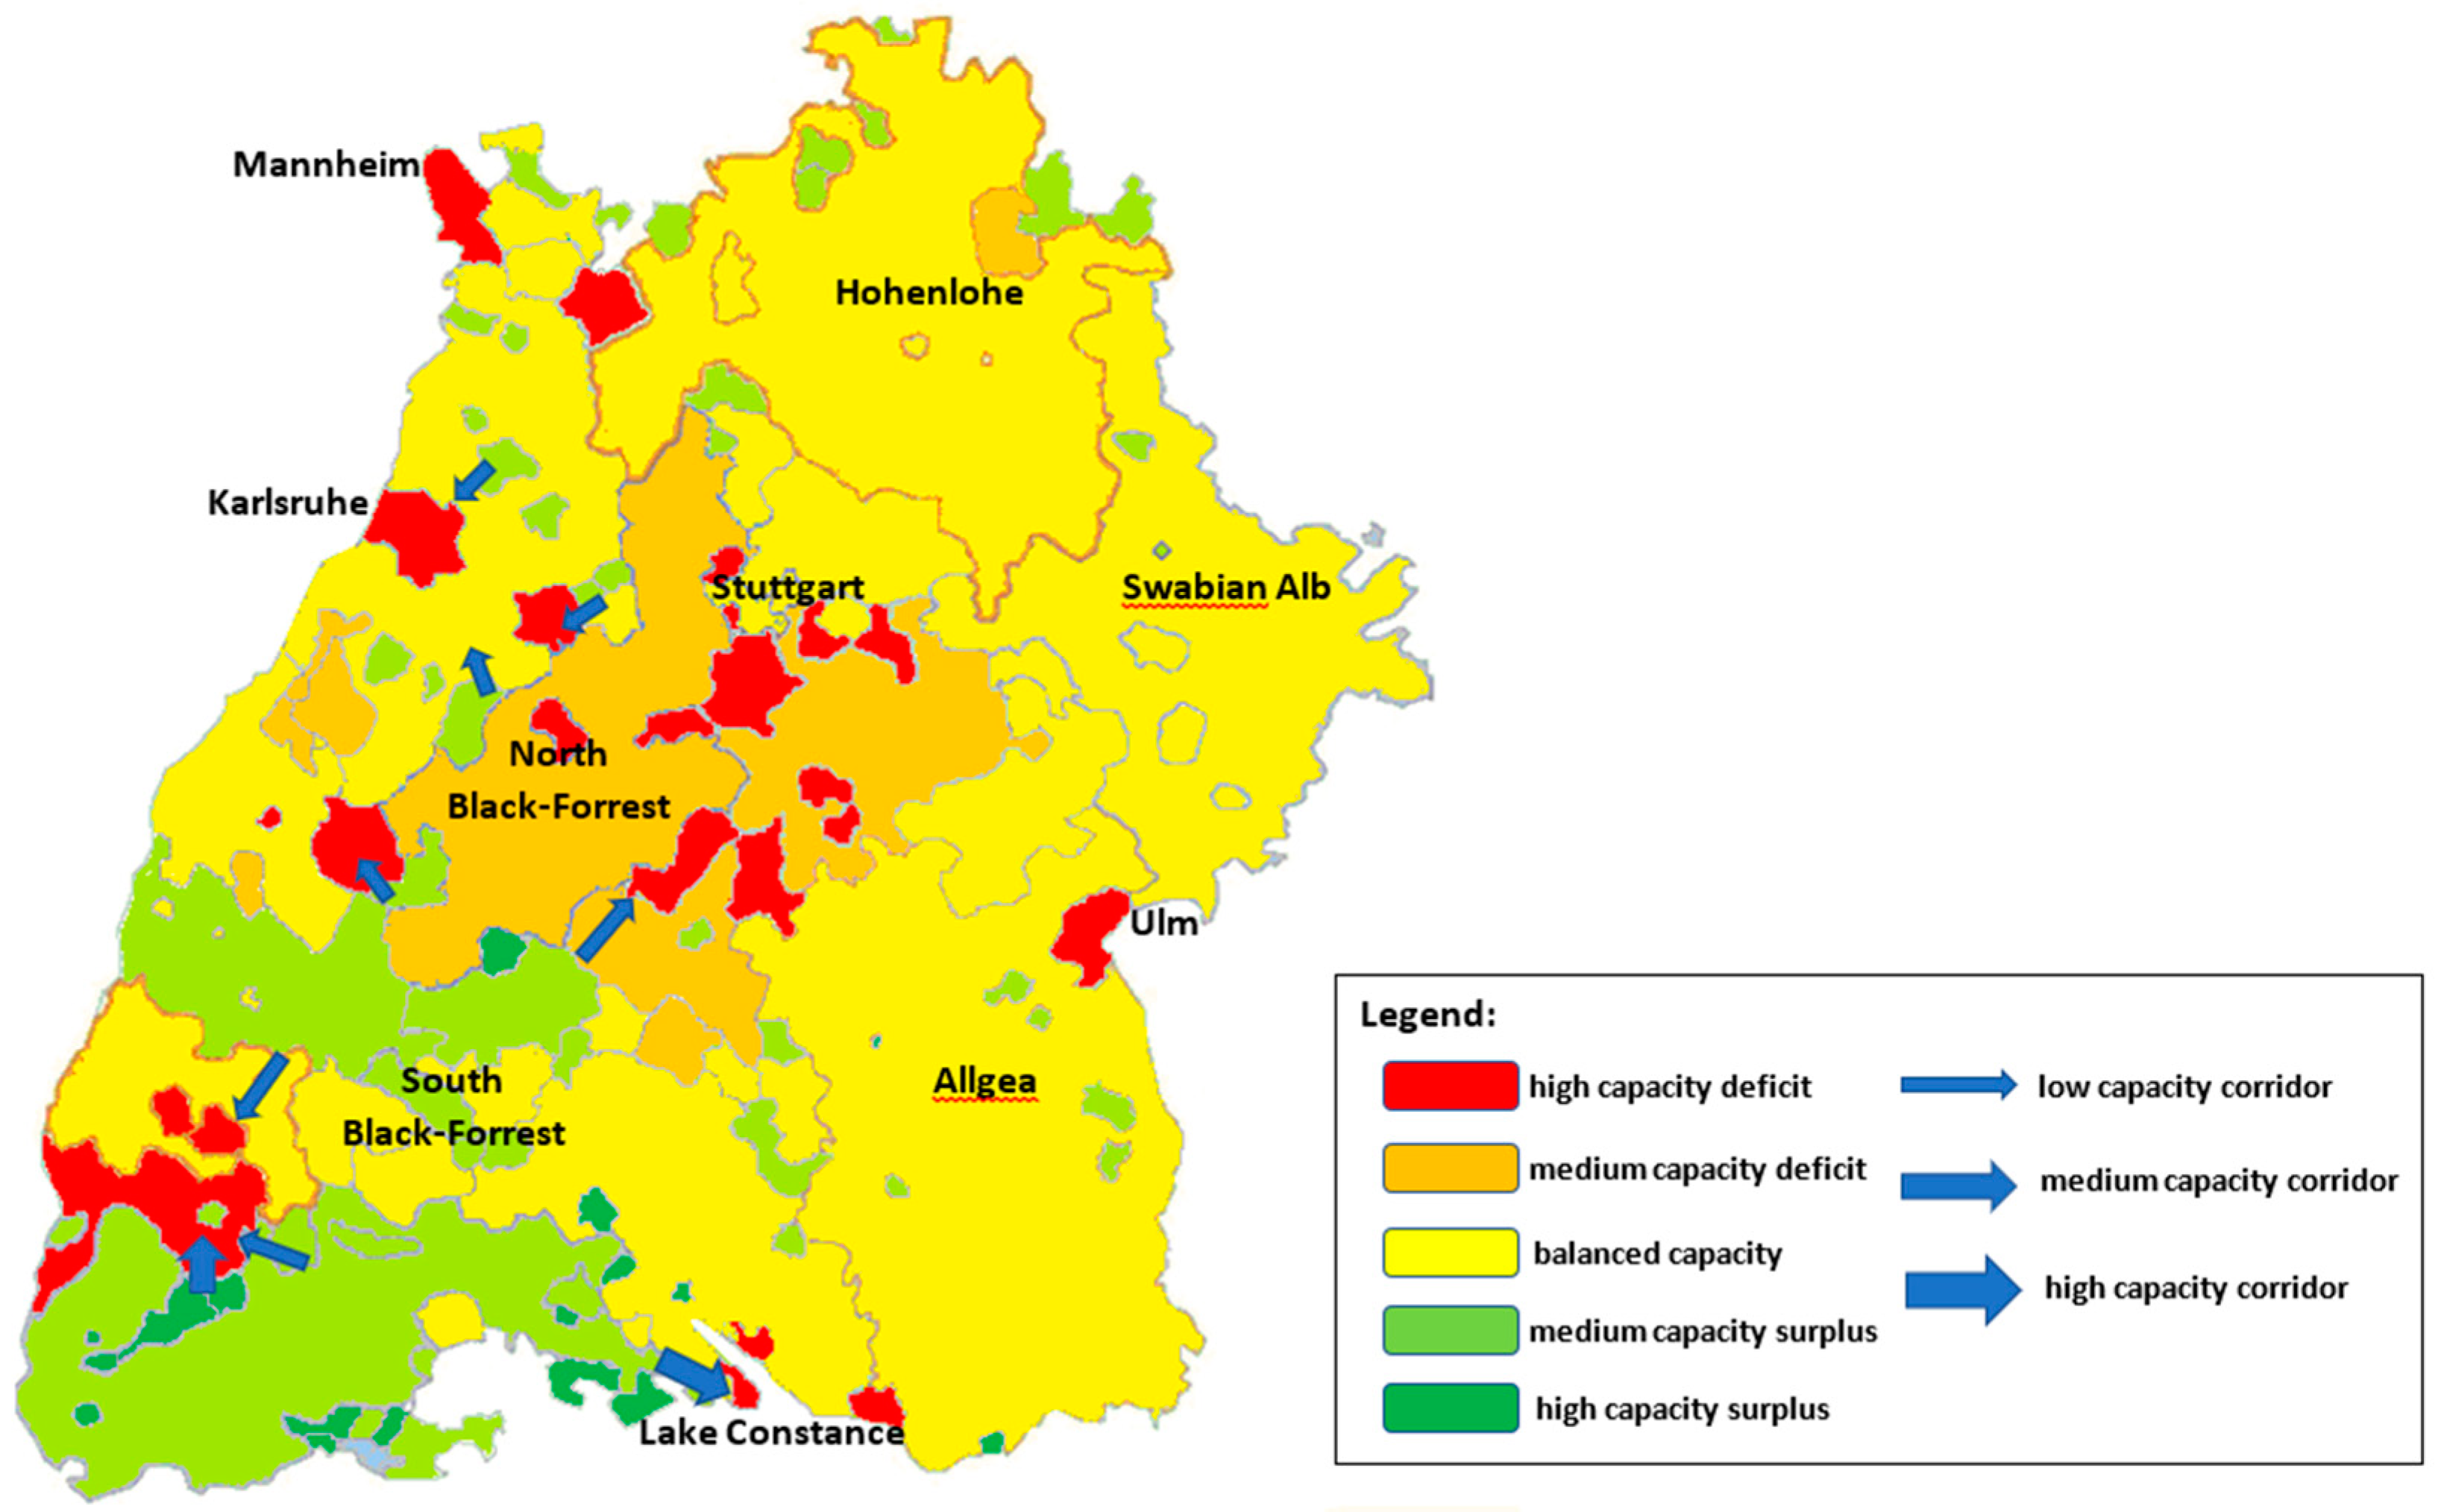
Based on the distributions of the distributors in 2050 flow charts illustrating development, lines for grid infrastructure are derived. Two scenarios are exemplified here:
(a)
Positive scenario: growing supply of regenerative energy at diminishing load (Figure 4).
(b)
Negative scenario: diminishing supply of regenerative energy (Figure 5).
To (a) (Figure 6) Positive Scenario: In the case of growing regenerative energy supply and ideally diminishing consumption, the rural areas of Hohenlohe, Swabian Alb, and South Black Forest realize energy surpluses due to the high availability of solar and wind energy in these regions of low population density. Then, these resources can be redistributed to the densely settled urban areas of Stuttgart, Karlsruhe, and Mannheim, where little free space for the installation of PV and wind power plants is available. Grid infrastructure in Baden-Württemberg must be remunerated so that transmission lines from peripheral regions to urban centers are installed and newly built to redistribute regenerative electricity resources from rural areas of high production to urban centers of high consumption.
To (b) (Figure 7) Negative Scenario: On the other hand, in a situation of diminishing regenerative energy production and growing energy demand, the peripheral regions of Hohenlohe, Swabian Alb, and Allgea (German Alpine region) dry up as sources for regenerative energy, since operation of solar and wind plants becomes unprofitable due to the phase-out of subsidies and growing maintenance and repair costs. In this situation, only the more prolific wind and solar plants in the sunnier and windier regions of the South Black Forest remain in operation to supply the Basel area. In this situation, local small-scale transmission grids from the northeast to the central and northern urban areas of Baden-Württemberg become superfluous, and a large amount of electricity has to be bought from other German countries or in the European electricity market.

5. Conclusions

5.1. Summary of Results

Summarizing these results, three important insights on the status and development requirements of the Baden-Württemberg grid until 2035 and 2050 have been gained:
  • Independence from external supply will be reached by 2050 only if at the same time load on the grid is diminished while the feed-in of regenerative resources increases. However, if load on the grid increases while regenerative feed-ins remain constant or diminish, the dependence on external electricity resources will increase. In any case, a remuneration of the Baden-Württemberg grid infrastructure is useful to diminish dependency from external electricity inflows and in this way enhance supply security and diminish transmission losses and costs.
  • The distribution of required grid capacities will change until 2035 and further until 2050 due to the reorganization of electricity supply toward significantly higher regenerative inflows. Until 2035, the capacity of small-scale grids will have to be increased due to the growing number of small-scale electricity producers feeding on the grid. Until 2050, this situation could change again since—given the present subsidy allocation—subsides will run out, and today, newly established small regenerative plants will age so that their number will decrease. Then, the supply will be covered by medium-sized providers and grids. Thus, Baden-Württemberg’s grid infrastructure will have to be continuously reorganized until 2050.
  • Regenerative energy in Baden-Württemberg is produced in peripheral regions mainly, but energy consumption is focused in urban areas. The increase of regenerative inflows due to the EEG implies a remuneration of grids interconnecting peripheral and urban areas. With the phase-out of small regenerative plants from the grid, this infrastructure could turn obsolete, and Baden-Württemberg would depend on large transmission lines feeding in electricity from other German countries or other nations increasingly.

5.2. Policy Recommendations

To prevent Baden-Württemberg from increasingly depending on external electricity acquisitions and instead remaining possibly self-reliant even after the closure of its established coal fired and nuclear power plants, the following political developments steps are desirable:
(a)
Efficient, regenerative energy resources in the medium segment that are affordable even after the phase-out of government subsidies should be developed and step-by-step installed by medium-sized commercial operators and communities.
(b)
Small-scale regenerative energy producers, e.g., households and small communities, should be clearly informed on the profitability of their investments after the phase-out of the subsidy to avoid misallocations. Investing these funds in more efficient community projects could be more effective.
(c)
The federal government should invest in large-scale transmission grids and supply chain security to ensure regenerative energy supply for the Southern Federal Countries even after the end of the subsidy payments for regenerative plants and the closure of conventional power plants.

5.3. Limitations and Further Research Needs

The study has evaluated the present and prospective grid infrastructure of Baden-Württemberg with regard to potential supply–demand scenarios using a linear optimization model and has derived suggestions for further grid development in compliance with EEG regulations, e.g., the phase-out of coal and nuclear electricity generation until 2022 and 2038.
The results are predictive, since the inputs are based on assumptions concerning the development of supply and demand under the present legal conditions. These assumptions could change, when, e.g., in the situation of an economic depression, the existing regulations would be altered or subsidies for PV and wind energy plant be prolonged or extended. Then, the calculations would have to be adjusted.
The analysis is based on seasonal mean values and does not consider daily or extraordinary spikes in demand or supply, which are usual and frequent. This simplification is admissible, since Baden-Württemberg’s grid infrastructure is connected to the larger European grid system and can compensate for temporary variations by electricity imports. The paper has not intended to realize complete autonomy of the region but rather to optimize electricity flows in order to enhance local grid infrastructure and save transmission costs and losses.
Baden-Württemberg is a comparatively easy to assess case for grid planning, since data are available from a comprehensive set of DSO. More extensive research would be required to make similar simulations for the necessary development of grid infrastructure for Germany or Europe as a whole. More intense collaboration of academic research and electricity providers is desirable to enhance knowledge on grid interdependencies in future and thus improve the efficiency of regenerative resource allocation globally.

Author Contributions

Conceptualization, T.R., P.T. and B.K.; methodology, T.R., P.T. and B.K.; software, T.R.; validation, T.R.; formal analysis, T.R.; investigation, T.R.; resources, T.R.; data curation, T.R.; writing—original draft preparation, T.R.; writing—review and editing, T.R., P.T. and B.K.; visualization, T.R.; All authors have read and agreed to the published version of the manuscript.

Funding

This study was funded by the Baden-Württemberg Ministry of Science, Research and Arts and Offenburg University of Applied Sciences. More information at https://www.dene.uni-freiburg.de/.

Conflicts of Interest

The authors declare no conflict of interest.

References

  1. IPCC. Klimaänderung 2013: Naturwissenschaftliche Grundlagen. Häufig Gestellte Fragen und Antworten—Teil des Beitrags der Arbeitsgruppe I zum Fünften Sachstandsbericht des Zwischenstaatlichen Ausschusses für Klimaänderungen (IPCC); Stocker, T.F., Qin, D., Plattner, G.-K., Tignor, M., Allen, S.K., Boschung, J., Nauels, A., Xia, Y., Bex, V., Midgley, P.M., Eds.; Deutsche Übersetzung Durch Die Deutsche IPCC-Koordinierungsstelle und Klimabüro für Polargebiete und Meeresspiegelanstieg: Bonn, Germany, 2017. [Google Scholar]
  2. UN. Climate Change. 2020. Available online: https://unfccc.int/ (accessed on 8 February 2020).
  3. BMWi (Bundesministerium für Wirtschaft und Energie). Was Bedeutet Sektorkopplung? Energiewende Direkt, 2020, Contribution of July 11, 2016. Available online: https://www.bmwi-energiewende.de/EWD/Redaktion/Newsletter/2016/14/Meldung/direkt-erklaert.html (accessed on 8 February 2020).
  4. Lpb Landeszentrale für Politische Bildung Baden Württemberg. Die Energiewende 2011. Available online: https://www.lpb-bw.de/energiewende (accessed on 8 February 2020).
  5. BMWi (Bundesministerium für Wirtschaft und Energie). Kabinett Beschließt Kohleausstiegsgesetz, Gemeinsame Pressemitteilung of Jan 29, 2020. Available online: https://www.bmwi.de/Redaktion/DE/Pressemitteilungen/2020/20200129-kabinett-beschliesst-kohleausstiegsgesetz.html (accessed on 8 February 2020).
  6. BMWi (Bundesministerium für Wirtschaft und Energie). Erneuerbare Energien. 2020. Available online: https://www.bmwi.de/Redaktion/DE/Dossier/erneuerbare-energien.html (accessed on 8 February 2020).
  7. Bundesnetzagentur. Stromnetz Zukunftssicher Gestalten. 2020. Available online: https://www.netzausbau.de/bedarfsermittlung/2022/archiv/de.html;jsessionid=D6CE223B06F56187A2AAEE74A3894EAE (accessed on 8 February 2020).
  8. Troester, E. New German grid codes for connecting PV systems to the medium voltage power grid. In 2nd International Workshop on Concentrating Photovoltaic Power Plants: Optical Design, Production, Grid Connection; 2009; pp. 1–4. Available online: https://www.google.com/url?sa=t&rct=j&q=&esrc=s&source=web&cd=&ved=2ahUKEwj576Gn17PsAhUQzqQKHU1zD5EQFjAAegQIAhAC&url=https%3A%2F%2Fwww.researchgate.net%2Ffile.PostFileLoader.html%3Fid%3D56fcd7b848954c26780b2de1%26assetKey%3DAS%3A345608402554880%401459410872390&usg=AOvVaw1L4I9zatibUcmn75zdN5aj (accessed on 14 September 2020).
  9. Netzentwicklungsplan Strom. Stromnetze. 2020. Available online: https://www.netzentwicklungsplan.de/de/wissen/stromnetze (accessed on 8 February 2020).
  10. TEnnet. Making the Connection, Integrated Annual Report 2014, Tennet Holding B.V. Available online: https://www.tennet.eu/fileadmin/user_upload/Company/Investor_Relations/Annual_Report/TenneT-AR14_UK.pdf (accessed on 8 February 2020).
  11. Ferreira, H.L.; Costescu, A.; L’Abbate, A.; Minnebo, P.; Fulli, G. Distributed generation and distribution market diversity in Europe. Energy Policy 2011, 39, 5561–5571. [Google Scholar] [CrossRef]
  12. Integrierter Geschäftsbericht 2016 Unsere Standorte. EnBW. 2016. Available online: https://www.enbw.com/integrierter-geschaeftsbericht-2016/ueberblick/unsere-standorte/ (accessed on 14 September 2020).
  13. Liste der Bestehenden Windkraftanlagen in Baden-Württemberg, Landesanstalt für Umwelt Baden-Württemberg, Daten und Kartendienst der LUBW. Available online: https://udo.lubw.baden-wuerttemberg.de/public/api/processingChain?ssid=805065c3-e98a-4d43-b3b7-c85cf0ee136e&selector=energie_wind.energie%3Aeebw_wind_best_anl.sel (accessed on 14 September 2020).
  14. Liste der Bestehenden Biomasseanlagen in Baden-Württemberg, Landesanstalt für Umwelt Baden-Württemberg, Daten und Kartendienst der LUBW. Available online: https://udo.lubw.baden-wuerttemberg.de/public/api/processingChain?ssid=2ea6b46c-172a-41ab-a594-0a4e577c9e10&selector=energie_biomasse.energie%3Aeebw_biomasse_holzfeuerung.sel (accessed on 14 September 2020).
  15. Liste der Bestehenden Freiland PV-Anlagen in Baden-Württemberg, Landesanstalt für Umwelt Baden-Württemberg, Daten und Kartendienst der LUBW. Available online: https://udo.lubw.baden-wuerttemberg.de/public/pages/map/default/index.xhtml?mapId=6e7b50a8-842a-436c-8bf2-a78201c5653f&overviewMapCollapsed=false&mapSrs=EPSG%3A25832&mapExtent=202379.18489065603%2C5240158%2C796026.815109344%2C5525631 (accessed on 14 September 2020).
  16. Erzeugung EnBW, Fossile Energien EnBW. 2020. Available online: https://www.enbw.com/unternehmen/konzern/energieerzeugung/fossile-energie/standorte.html (accessed on 14 September 2020).
  17. Erzeugung EnBW, Kernenergie EnBW. 2020. Available online: https://www.enbw.com/unternehmen/konzern/energieerzeugung/kernenergie/standorte.html (accessed on 14 September 2020).
  18. Erzeugung EnBW; Wasserkraft EnBW. 2020. Available online: https://www.enbw.com/erneuerbare-energien/wasser/standorte.html (accessed on 14 September 2020).
  19. Werkübersicht Großkraftwerk Mannheim, GKM. 2020. Available online: https://www.gkm.de/unternehmen/werkuebersicht/ (accessed on 14 September 2020).
  20. HKW Magierusstraße, FUG Fernwärme Ulm. 2020. Available online: https://www.fernwaerme-ulm.de/kraftwerke/hkw-magirusstrasse.html (accessed on 14 September 2020).
  21. Kriechbaum, L.; Scheiber, G.; Kienberger, T. Grid-based multi-energy systems—Modelling, assessment, open source modelling frameworks and challenges. BMC Energy Sustain. Soc. 2018. [Google Scholar] [CrossRef] [Green Version]
  22. Bundes Ministerium für Wirtschaft an Electricity Grid for the Energy Transition. Available online: https://www.bmwi.de/Redaktion/EN/Dossier/grids-grid-expansion.html (accessed on 14 October 2020).
  23. Broderick, R.J.; Williams, J.R. Clustering methodology for classifying distribution feeders. In Proceedings of the 2013 IEEE 39th Photovoltaic Specialists Conference (PVSC), Tampa, FL, USA, 16–21 June 2013; pp. 1706–1710. [Google Scholar]
  24. Nijhuis, M.; Gibescu, M.; Cobben, S. Clustering of Low Voltage Feeders form a Network Planning Perspective; CIRED: Belgium, UK, 2015. [Google Scholar]
  25. Rösch, T.; Treffinger, P. Cluster Analysis of Distribution Grids in Baden-Württemberg. Energies 2019, 12, 4016. [Google Scholar] [CrossRef] [Green Version]
  26. Bracale, A.; Caldon, R.; Celli, G.; Coppo, M.; Dal Canto, D.; Langella, R.; Scalari, S. Analysis of the Italian distribution system evolution through reference networks. In Proceedings of the 2012 3rd IEEE PES Innovative Smart Grid Technologies Europe (ISGT Europe), Berlin, Germany, 14–17 October 2012; pp. 1–8. [Google Scholar]
  27. Bletterie, B.; Kadam, S.; Renner, H. On the classification of low voltage feeders for network planning and hosting capacity studies. Energies 2018, 11, 651. [Google Scholar] [CrossRef] [Green Version]
  28. Míguez, E.; Cidrás, J.; Díaz-Dorado, E.; García-Dornelas, J.L. An Improved Branch-Exchange Algorithm for Large-Scale Distribution Network Planning. IEEE Trans. Power Syst. 2002, 17, 931. [Google Scholar] [CrossRef]
  29. Navarro, A.; Rudnick, H. Large-scale distribution planning—Part I: Simultaneous network and transformer optimization. IEEE Trans. Power Syst. 2009, 24, 744–751. [Google Scholar] [CrossRef]
  30. Lavorato, M.; Franco, J.F.; Rider, M.J.; Romero, R. Imposing radiality constraints in distribution system optimization problems. IEEE Trans. Power Syst. 2011, 27, 172–180. [Google Scholar] [CrossRef]
  31. Hong, Y.Y.; Ho, S.Y. Determination of network configuration considering multiobjective in distribution systems using genetic algorithms. IEEE Trans. Power Syst. 2005, 20, 1062–1069. [Google Scholar] [CrossRef]
  32. Ramirez-Rosado, I.J.; Bernal-Agustin, J.L. Genetic algorithms applied to the design of large power distribution systems. IEEE Trans. Power Syst. 1998, 13, 696–703. [Google Scholar] [CrossRef]
  33. Díaz-Dorado, E.; Pidre, J.C.; García, E.M. Planning of large rural low-voltage networks using evolution strategies. IEEE Trans. Power Syst. 2003, 18, 1594–1600. [Google Scholar] [CrossRef]
  34. Díaz-Dorado, E.; Pidre, J.C. Optimal planning of unbalanced networks using dynamic programming optimization. IEEE Trans. Power Syst. 2004, 19, 2077–2085. [Google Scholar] [CrossRef]
  35. Cruz, M.R.; Fitiwi, D.Z.; Santos, S.F.; Catalão, J.P. Flexibilizing Distribution Network Systems via Dynamic Reconfiguration to Support Large-Scale Integration of Variable Energy Sources Using a Genetic Algorithm. In Doctoral Conference on Computing, Electrical and Industrial Systems; Springer: Cham, Germany, 2017; pp. 72–80. [Google Scholar]
  36. Scheidler, A.; Thurner, L.; Braun, M. Heuristic optimisation for automated distribution system planning in network integration studies. IET Renew. Power Gener. 2018, 12, 530–538. [Google Scholar] [CrossRef] [Green Version]
  37. Azizivahed, A.; Arefi, A.; Ghavidel, S.; Shafie-khah, M.; Li, L.; Zhang, J.; Catalão, J.P. Energy management strategy in dynamic distribution network reconfiguration considering renewable energy resources and storage. IEEE Trans. Sustain. Energy 2019, 11, 662–673. [Google Scholar] [CrossRef]
  38. Gupta, A.; Thakur, R. Review on Radial distribution Network BY Dg Planning Using Optimization Approaches. Tathapi ISSN 2320-0693 UGC CARE J. 2020, 19, 1–7. [Google Scholar]
  39. Zidan, A.; Shaaban, M.F.; El-Saadany, E.F. Long-term multi-objective distribution network planning by DG allocation and feeders’ reconfiguration. Electr. Power Syst. Res. 2013, 105, 95–104. [Google Scholar] [CrossRef]
  40. EnBW Kernkraft. 2020. Available online: https://www.enbw.com/unternehmen/konzern/energieerzeugung/kernenergie/ (accessed on 1 April 2020).
  41. Die Bundesregierung Der Einstieg in den Kohleausstieg, Abschussbericht der Kohlekommission. 2019. Available online: https://www.bundesregierung.de/breg-de/aktuelles/der-einstieg-in-den-kohleausstieg-1574264 (accessed on 1 April 2020).
  42. Statistisches Landesamt Baden-Württemberg. 28% des Erzeugten Stroms aus Erneuerbaren Energien Baden-Württemberg: Mehr Strom aus Kernenergie und Windkraft, Rückgänge bei Erdgas und Wasserkraft/2019. Available online: https://www.statistik-bw.de/Presse/Pressemitteilungen/2019314 (accessed on 1 April 2020).
  43. Agentur für Erneuerbare Energien Anteil Erneuerbarer Energien am Bruttostromverbrauch. 2020. Available online: https://www.foederal-erneuerbar.de/landesinfo/bundesland/BW/kategorie/strom/auswahl/772-anteil_erneuerbarer_/#goto_772 (accessed on 1 April 2020).
  44. Ministerium für Umwelt, Klima und Energiewirtschaft Baden-Württemberg. Available online: https://um.baden-wuerttemberg.de/de/energie/erneuerbare-energien/windenergie/ (accessed on 1 April 2020).
  45. Goetz, U. Das Dilemma der Grünen beim Klimaschutz, Deutschlandfunk Kultur, Beitrag vom 12.11.2019. 2019. Available online: https://www.deutschlandfunkkultur.de/windkraft-in-baden-wuerttemberg-das-dilemma-der-gruenen.1001.de.html?dram:article_id=463284 (accessed on 1 April 2020).
  46. TenneT 2020. Offshore Porjekte Deutschland. Available online: https://www.tennet.eu/index.php?id=2130&L=2 (accessed on 1 April 2020).
  47. Bundesministerium für Wirtschaft und Energie, Netzanbindung. Available online: https://www.erneuerbare-energien.de/EE/Navigation/DE/Technologien/Windenergie-auf-See/Technik/Netzanbindung/netzanbindung.html (accessed on 1 April 2020).
  48. Mehlhorn, K.; Liemt, J. Bestimmung der Elektrischen Verluste im NETZ Eines Städtischen Netzbetreibers. ew Magazin für Energiewirtschaft 2004, Jg 103, Heft 1-2, 20–23. [Google Scholar]
  49. EEG (Gesetz für den Ausbau Erneuerbarer Energien (ErneuerbareEnergien-Gesetz—EEG 2017), § 20. Available online: https://www.gesetze-im-internet.de/eeg_2014/EEG_2017.pdf (accessed on 14 April 2020).
  50. Eurostat 2020. Electricty Price Statistics. Available online: https://ec.europa.eu/eurostat/statistics-explained/index.php/Electricity_price_statistics#Electricity_prices_for_non-household_consumers (accessed on 14 April 2020).
  51. Hau, E. Windkraftanlagen—Grundlagen, Technik, Einsatz, Wirtschaftlichkeit, 5th ed.; Springer: Berlin/Heidelberg, Germany, 2014; p. 86. [Google Scholar]
  52. Witsch, K.; Stratmann, K. Ausbau der Windkraft Bricht Dramtisch ein, Handelsblatt, Contribution of July 25, 2019. Available online: https://www.handelsblatt.com/unternehmen/energie/erneuerbare-energien-ausbau-der-windkraft-bricht-dramatisch-ein/24696524.html?ticket=ST-4348315-ey9fJI0fkupmYQap64KM-ap1 (accessed on 14 April 2020).
  53. Forsa. Stimmungsbild Windkraft in Brandenburg, Ergebnisbericht, Study for EnBW. 2018. Available online: https://www.enbw.com/erneuerbare-energien/windenergie/unsere-windparks-an-land/bau-und-planung.html (accessed on 1 April 2020).
  54. Ministerium für Umwelt, Klima und Energiewirtschaft Baden-Württemberg, Klimaschutzgesetz Baden-Württemberg. Available online: https://um.baden-wuerttemberg.de/de/klima/klimaschutz-in-baden-wuerttemberg/klimaschutzgesetz/#:~:text=Gesetz%20zur%20F%C3%B6rderung%20des%20Klimaschutzes%20in%20Baden%2DW%C3%BCrttemberg&text=Es%20ist%20am%2031.%20Juli%202013%20in%20Kraft%20getreten.&text=Des%20Weiteren%20sieht%20das%20Gesetz,landesweiten%20Anpassungsstrategie%20zu%20begrenzen%20sind (accessed on 5 July 2020).
  55. Ministerium für Umwelt, Klima und Energiewirtschaft Baden-Württemberg 2020. Monitoring der Energiewende in Baden-Württemberg, Statusbericht 2019. Available online: https://um.baden-wuerttemberg.de/fileadmin/MinisteriumfürUmwelt,KlimaundEnergiewirtschaftBaden-Württemberg (accessed on 1 October 2020).
  56. Monitoring der Energiewende in Baden-Württemberg, Statusbericht 2019. Available online: https://um.baden-wuerttemberg.de/fileadmin/redaktion/m-um/intern/Dateien/Dokumente/2_Presse_und_Service/Publikationen/Energie/Monitoring-der-Energiewende-2019.pdf (accessed on 5 July 2020).
  57. Deutsche Bundesregierung. Klimaschutzprogramm 2030 der Bundesregierung zur Umsetzung des Klimaschutzplans 2050. 2020. Available online: https://www.bundesregierung.de/resource/blob/975226/1679914/e01d6bd855f09bf05cf7498e06d0a3ff/2019-10-09-klima-massnahmen-data.pdf?download=1 (accessed on 5 July 2020).
  58. Deutsche Bundesregierung. Stellungnahme Zum Zweiten Monitoring-Bericht der Bundesregierung für das Berichtsjahr 2012. 2012. Available online: https://www.bmwi.de/Redaktion/DE/Downloads/M-O/monitoringbericht-energie-der-zukunft-stellungnahme.pdf?__blob=publicationFile&v=3 (accessed on 5 July 2020).
  59. Ministerium für Umwelt, Klima und Energiewirtschaft Baden-Württemberg. 2020. Energieeffizienz. Available online: https://um.baden-wuerttemberg.de/de/energie/energieeffizienz/ (accessed on 5 July 2020).
  60. Ministerium für Umwelt, Klima und Energiewirtschaft Baden-Württemberg. 2020. Erneuerbare Energien. Available online: https://um.baden-wuerttemberg.de/de/energie/erneuerbare-energien// (accessed on 5 July 2020).
  61. Ministerium für Umwelt, Klima und Energiewirtschaft Baden-Württemberg. 2020. Zuverlässige und Stabile Energieversorgung. Available online: https://um.baden-wuerttemberg.de/de/energie/versorgungssicherheit/ (accessed on 5 July 2020).
  62. Regelungen aus der Messwesen Strom (Metering Code) VDE-Anwendungsregel AR 4400; VDE Verlag: Munich, Germany, 2019.
  63. Gesetz zur Förderung des Klimaschutzes in Baden-Württemberg. 2013. Landtag von Baden -Württemberg, Gesetzesbeschluss des Landtages, Drucksache 15/3842. Available online: https://um.baden-wuerttemberg.de/fileadmin/redaktion/m-um/intern/Dateien/Dokumente/4_Klima/Klimaschutz/Klimaschutzgesetz/Gesetzesbeschluss_Klimaschutzgesetz.pdf (accessed on 22 April 2020).
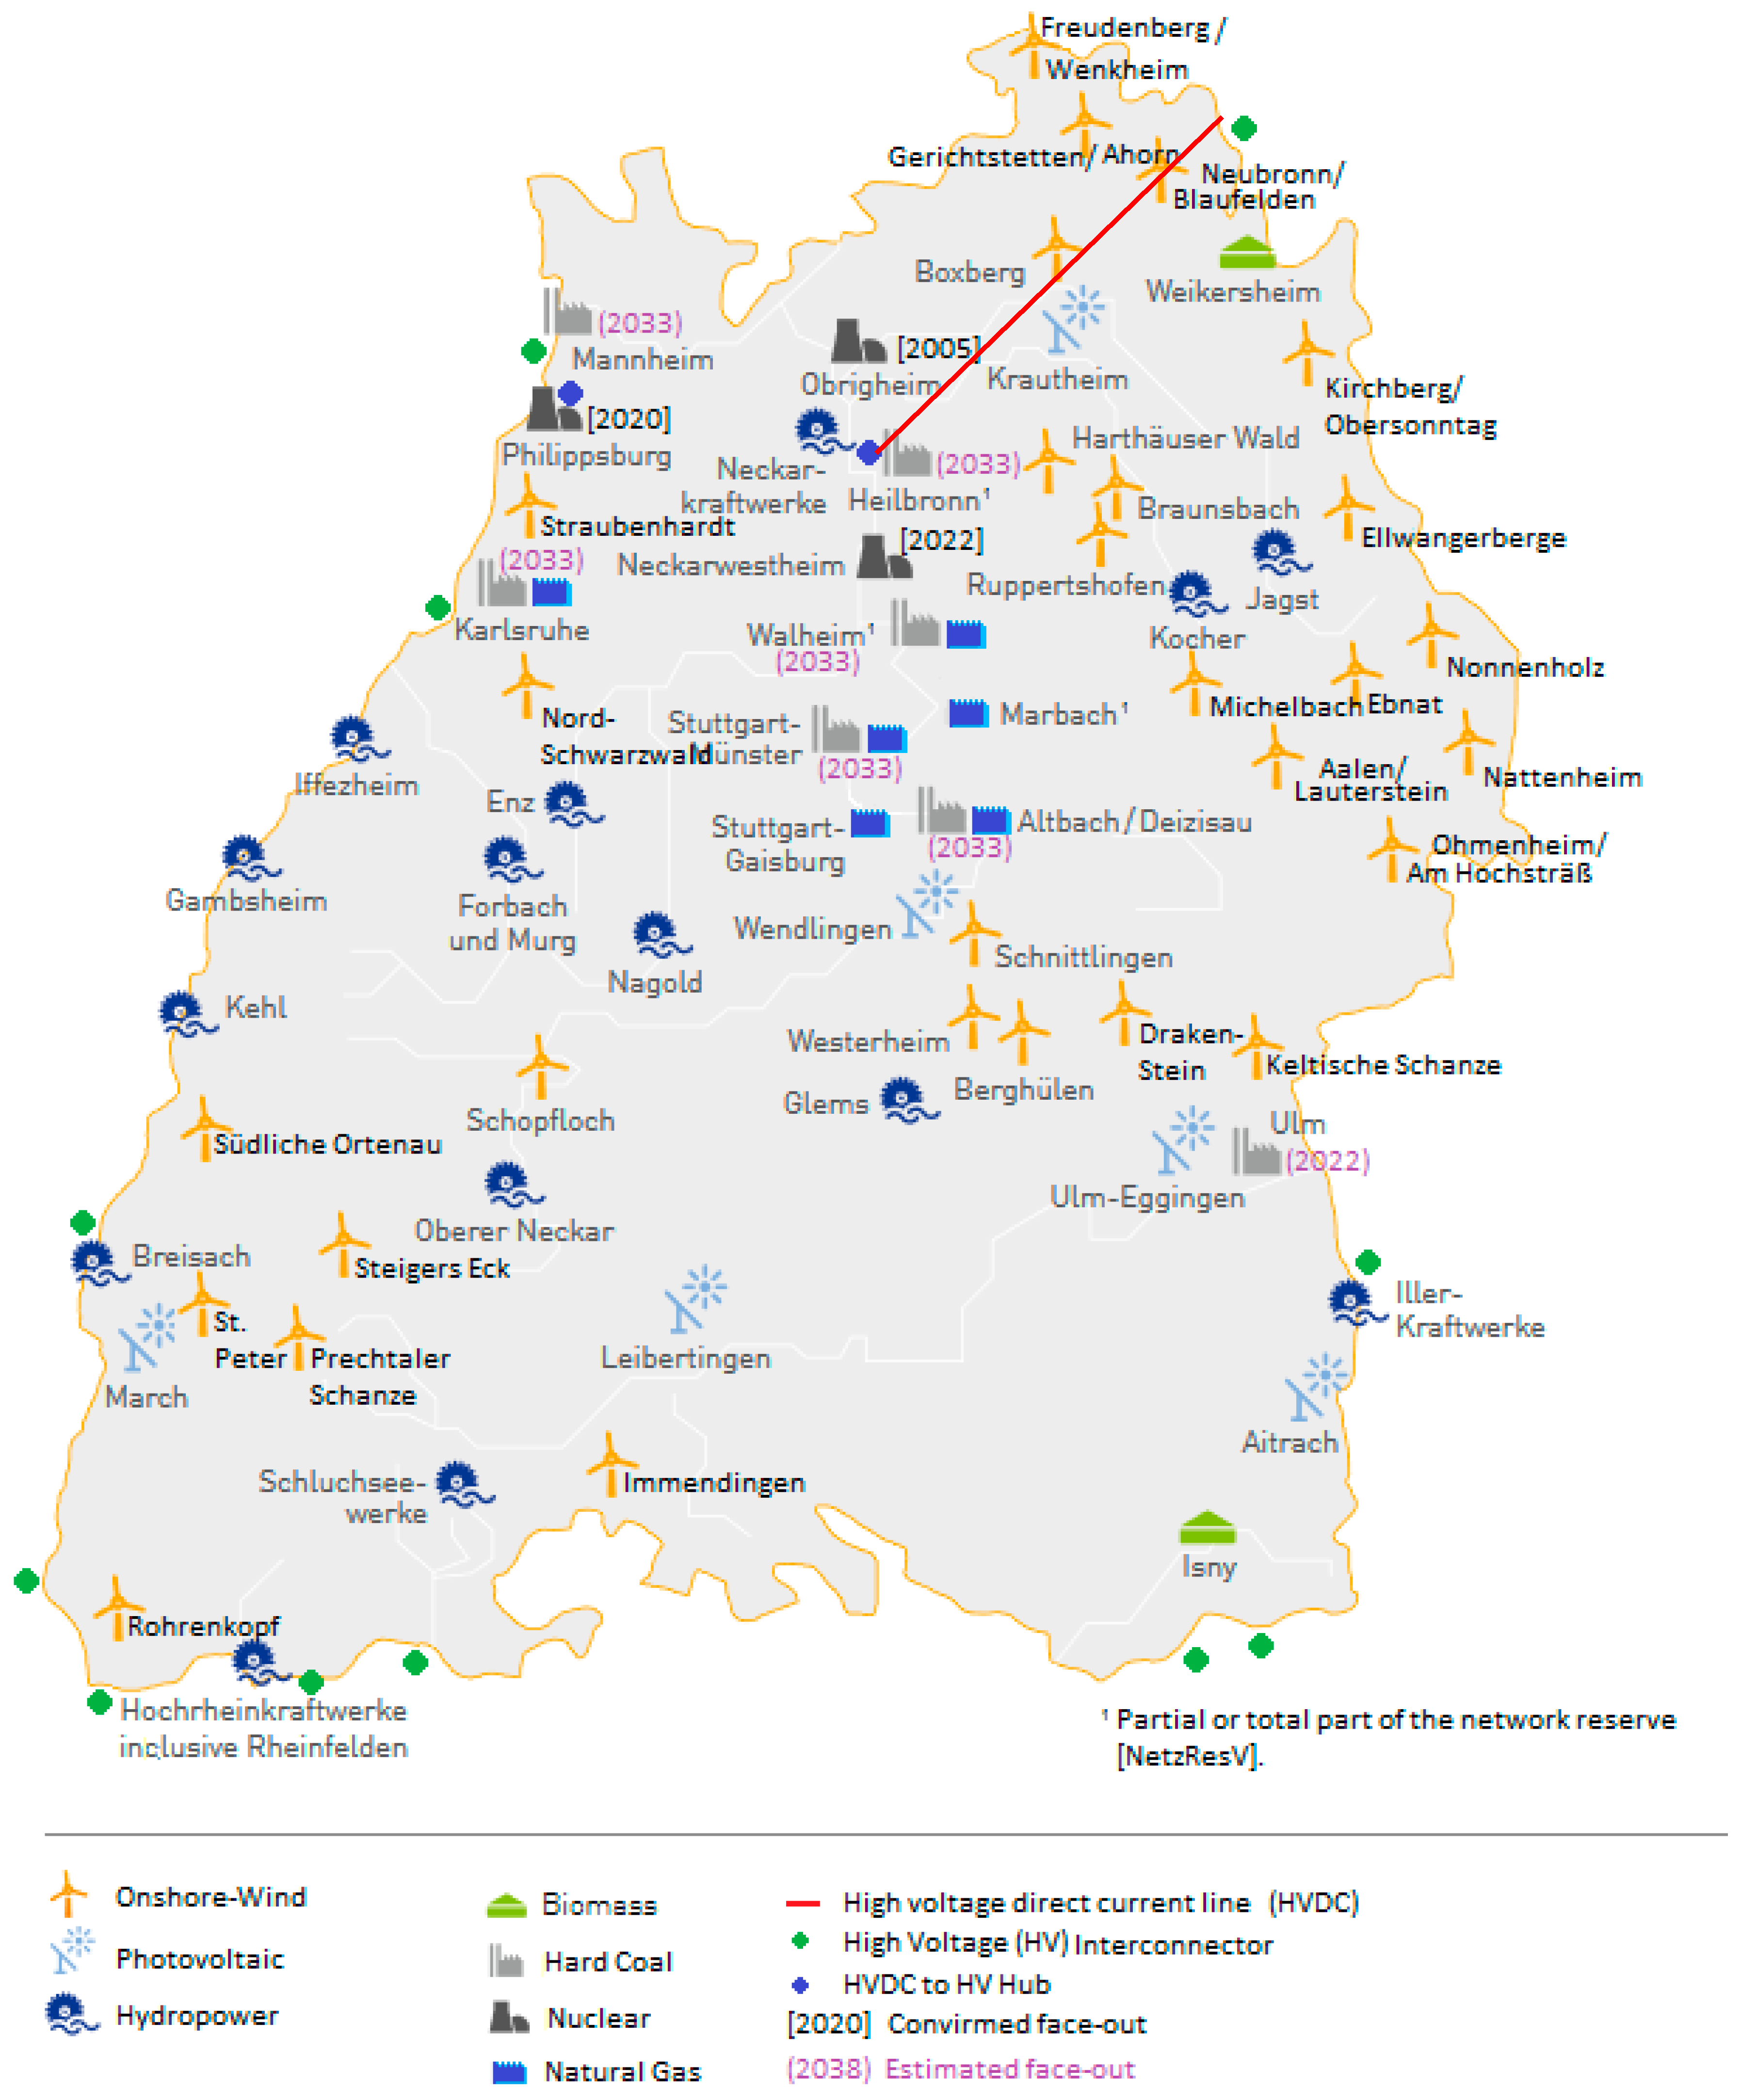
Figure 1. Map of Baden-Württemberg with the major production sides and face out times including high-voltage interconnector sides and high-voltage, direct current (HVDC) to HV hub sides [12,13,14,15,16,17,18,19,20].
Energies 13 05385 g001
Figure 2. Illustration of relevant interconnections to first- and second-degree neighbors for grid model planning.
Energies 13 05385 g002
Figure 3. Distribution of distributors by sizes for 2020 in the winter, transit, and summer periods.
Energies 13 05385 g003
Figure 4. Distribution of distributors by sizes for 2035: critical scenario higher load and lower feed-in in the winter, transit, and summer periods.
Energies 13 05385 g004
Figure 5. Distribution of distributors by sizes for 2050: critical scenario higher load and lower feed-in in the winter, transit, and summer periods.
Energies 13 05385 g005
Figure 6. Scenario 2050 for diminishing consumption and increasing regenerative energy supply.
Energies 13 05385 g006
Figure 7. Scenario 2050 for growing consumption and decreasing regenerative energy supply.
Energies 13 05385 g007
Table 1. Summary of previous studies using clustering algorithms for grid analysis.
Clustering Algorithms to Identify Grid Remuneration Requirements
YearConceptDataObjective
2013
Broderick and Williams
Clustering of Californian feeders
By k-means algorithm
Voltage
Type and number of phases
Served customers
Remuneration of grid architecture for PV inflows
2015
Nijhuis et al.
Clustering of Dutch feeders using k-means algorithmCable length
Number of branches
Brand depth
Number and type of customers
Identification of feeders with high default risk
2015
Bracale et al.
Descriptive statistics for ItalyDevelopment status in Italy and other countriesDevelopment scenarios for Italy under increasing regenerative resource inputs
2019
Bletterie et al.
Austrian feeders, clustering with k-meansSum impedance
Maximum/average inflow,
cable length/load
Classify DSO for regenerative hosting capacity
2019
Rösch and Treffinger
Clustering of Baden-Württemberg DSO by k-means and Gauss-NewtonDemographic requirements
Grid construction status
Remuneration of DSO for expanding regenerative energy inflow
Table 2. Summary of previous studies using linear programming for grid optimization.
Linear Programming to Optimize Grid Architectures
YearSituationInputControlsTarget
2003
Miguez et al.
Greenfield model optimal grid design Location
Costs
Fixed demand
Minimum supply
Number of outages
voltage drop
Minimize investment and operation costs
2009
Navarro and Rudnick
Greenfield transformer station design, rural ChileCosts
Street arrangement
Fixed demand
Transformer capacityMinimize investment and operation costs
2014
Navarro
Conductor capacity design for residential consumers in UKConsumed loads as a timeline
Load shifting effects
Voltage drop
Power loss
Conductor capacity
Minimize conductor costs
2003
Díaz-Dorado et al.
Existing rural medium and low-voltage networks
Location
Costs
Voltage
Deterministic demand
Conductor capacity
Voltage drop
Power loss
Minimize investment, maintenance and operation costs
2004
Díaz-Dorado et al.
Existing rural low-voltage networks with single and three-phase consumersConsumer type
Costs
Voltage
Deterministic demand per consumer
Conductor type
Papering
Power loss in lines
Capacities
Voltage drop
Minimize investment, maintenance and operation costs
2012
Lavorato et al.
Greenfield planning of distribution grid Radiality of grid
Total number of nodes
Distributed generation
Minimize energy losses on grid
2013
Zidan et al.
Grid remuneration in Ontario CanadaGas/PV/wind
Intermittent regenerative inflows
Mixed consumers
Max. grid load
Power factor = 0.95
Bus interconnection restrictions
Minimize total including remuneration costs
Minimize gas emissions
2016
Scheidler et al.
Automated distribution system planning approach for network reconfigurationFeeder lengths
of small agglomerations
Voltage constraintReduction of feeder length to reduce transportation losses
Expected cost of grid remuneration
2017
Cruz et al.
Distribution grid remunerationEnergy supplied and retrieved
Admission of suppliers and consumers to the grid
Production costs
Radial closed network
Minimize losses
Minimize costs of operation
2019
Azizvahed et al.
Distribution grid reconfiguration in dynamic modelEnergy supplied and retrievedBalance and unbalanced distribution grids
State of health constraint
Voltage stability index
Minimize non supplied energy
Grid lifetime prolongation
2020
Gupta et al.
Review of studies in distribution grid optimizationsDispersed generators
Deregulated environment
Costs
Technical constraints
Table 3. Summary of future supply–load scenarios.
Future Scenarios
Basis20352050
Load+5%+5%
−5%−5%
0%0%
Feed-in+20%+20%
−20%−20%
0%0%
Table 4. Summary of key numbers.
EAbsolute energy inflow into Baden-Württemberg
ApDegree of autonomy of Baden-Württemberg
GoIpDegree of meshing of the different scenarios
RCtRelation of large distance connections to total connections
Table 5. External inflows Ei to the Baden-Württemberg grid for different future scenarios.
In MW 20352050
Basic 2020 337.87370.83497.62337.87370.83497.62
LoadFeed-inSummerTransitWinterSummerTransitWinter
+381.88469.44508.68391.07479.92519.74
+c354.47351.57521.47219.53332.94547.64
++274.52294.70445.33218.87227.76399.77
363.56352.00473.49360.32334.68463.99
c322.15284.23313.2366.37109.50128.84
+111.87109.14249.51000
Table 6. Change of external inflows to the Baden-Württemberg grid for different future scenarios.
Change on 2020 in%20352050
Basic 2020 0%0%0%0%0%0%
LoadFeed-inSummerTransitWinterSummerTransitWinter
+13.0%26.6%2.2%15.7%29.4%4.4%
+c4.9%−5.2%4.8%−35.0%−10.2%10.1%
++−18.7%−20.5%−10.5%−35.2%−38.6%−19.7%
7.6%−5.1%−4.8%6.6%−9.7%−6.8%
c−4.7%−23.4%−37.1%−80.4%−70.5%−74.1%
+−66.9%−70.6%−49.9%−100.0%−100.0%−100.0%
Table 7. Degree of autonomy for the different scenarios Ap.
Rate of Autonomy%SummerWinterTransit
Basic 202044.85%46.94%32.53%
2035 2050
LoadFeed-InSummerTransitWinterSummerTransitWinter
+38.59%33.82%32.05%38.03%33.31%31.58%
+c42.21%40.77%43.37%78.31%68.66%65.06%
++55.85%58.45%40.51%65.32%68.36%47.37%
48.45%45.34%42.42%52.86%56.06%49.88%
c54.01%62.85%45.51%76.46%62.01%68.41%
+75.63%79.16%54.86%100%100%100%
Table 8. Grade of interconnected GoIp.
Grade of InterconnectednessSummerTransitWinter
Basic 2020 4.9%5.2%6.2%
20352050
LoadFeed-InSummerTransitWinterSummerTransitWinter
+4.9%9.2%5.9%4.9%5.0%5.0%
+c8.2%6.2%6.0%6.7%5.3%7.3%
++5.2%5.3%5.0%9.4%8.9%8.8%
5.7%5.9%5.8%5.6%5.8%8.2%
c8.0%5.0%5.0%6.8%6.4%8.2%
+9.4%9.3%8.8%18.0%16.6%17.4%
Table 9. Number of interconnections for different scenarios.
Number of ConnectionsSummerTransitWinter
Basic 2020 653696831
20352050
LoadFeed-InSummerTransitWinterSummerTransitWinter
+6561217785657662659
+c1085821791891709972
++686705664124811871173
7537847717467721082
c10626616579068441093
+124412291160239022202306
Table 10. Number of long-distance connections.
Number of Long-Distance ConnectionsSummerTransitWinter
Basic 2020 228195233
20352050
LoadFeed-InSummerTransitWinterSummerTransitWinter
+230231235231234234
+c228209219167210222
++207206233180182214
230209226230210233
c210234233167177177
+181180179199188192
Table 11. RCt ratio of long-distance connections.
Ratio of Long to Total ConnectionsSummerTransitWinter
Basic 2020 35.0%28.0%28.0%
20352050
LoadFeed-InSummerTransitWinterSummerTransitWinter
+35.1%19.0%29.9%35.1%35.3%35.5%
+c21.0%25.5%27.7%18.7%29.6%22.8%
++30.0%29.2%35.1%14.4%15.3%18.2%
30.5%26.7%29.3%30.8%27.2%21.3%
c19.8%35.4%35.5%18.4%20.9%16.2%
+14.5%14.6%15.4%8.3%8.4%8.3%
Publisher’s Note: MDPI stays neutral with regard to jurisdictional claims in published maps and institutional affiliations.