1. Introduction
Nowadays, coal provides more than 27% of the energy worldwide, while about 40% of the global electricity generation comes from coal, and the share is estimated to increase to 43% in 2030 dramatically, it is believed that coal is an important guarantee of human energy security [
1,
2]. Coal is anisotropic rock developed by plant remains undergone long and complicated biological, chemical, and geological processes, contains complex pore and fracture. It is widely, though not universally, accepted that coal could be summarized into three components: organic component (coal matrix), inorganic component (mineral matter) and defect (pore and fracture) [
3,
4,
5]. The discontinuous, inhomogeneous, anisotropic and nonlinear elastic characteristics(DIANE) of coal distinguishes it from other porous material, which is the internal factor that induces dynamic disasters, such as coal burst, coal, and gas outburst. Thus, comprehensive study on pore and fracture of coal is extremely important [
6,
7,
8,
9,
10,
11].
Sedimentary fabric determines the microstructure of coal, including coal matrix particles, mineral particles, pore, and fracture distribution. Recently, mercury intrusion porosimetry (MIP), low temperature nitrogen adsorption/desorption (LTNAD), small-angle X-ray scattering (SAXS), nuclear magnetic resonance (NMR), and other means have been used to detect the pore and fracture, and achieved fruitful results. Okolo et al. [
12] compared the application of MIP gas adsorption and SAXS in the measurement of porosity and pore surface area, and considered that these methods could be used to obtain the pore distribution information of different diameter sections, however, the result of MIP would be distorted due to the compressibility of coal matrix. Firouzi et al. [
13] thought gas adsorption and NMR could be used to determine the coal pore size distribution, and they complemented each other. Sakurovs et al. [
14] successfully used SAXS and small-angle neutron scattering (SANS) to test the pore distribution from 10
to 20 μm in diameter. Radlinski et al. [
15] studied the pore distribution through SAXS and SANS, and concluded that they could be used for any type of coal sample, from a thin slice to a representative sample of a thick seam. The size of coal sample used in the above experimental means are small, so they belong to destructive test methods, which indicates the results are hardly compatible with mechanical properties, more research means are essential to accurately characterize the pore and fracture of coal [
16,
17].
In recent years, it is benefit from the rapid development of computer science, digital image correlation (DIC) has been gradually applied to the characterization of coal pore and fracture. Roslin et al. [
18] calculated coal permeability by scanning electron microscopy (SEM), X-ray microcomputed tomography (X-ray CT), and image processing technology, and achieved great feedback. Karimpouli et al. [
19] constructed a random model based on X-ray CT, and characterized the fracture network in coal. Liu et al. [
20] analyzed the relationship between fractal characteristics of coal and CH
4 adsorption based on SEM. Kwiecińska et al. [
21] considered that SEM and TEM scanning could well describe the characteristics of solid particles in coal.
Coal is complex anisotropic porous medium, contains a large number of randomly distributed and multi-scale pore and fracture. The pore and fracture destroy the continuity and integrity of coal, and influence its physical and mechanical properties, so they are potential source of dynamic disasters. In this study, we select coal samples with different bursting proneness, and describe the pore distribution by MIP and LTNAD. To obtain the pore distribution characteristics, the MIP results are modified by LTNAD results. Then, the pore and fracture of coal is qualitatively described by SEM and X-ray CT test, and the fractal characteristics of coal are analyzed by DIC, get a systematically study on the pore and fracture of coal with different bursting proneness.
2. Experimental Work and Monitoring Plan
2.1. Samples and Proximate Analysis
The coal samples prepared for the experiments were taken from coal seams of different depths and regions in China, as shown in
Figure 1. All the samples were elaborately enclosed and immediately sent to laboratory. Samples of high bursting proneness were obtained and examined from No. 9 coal seam of Hongqinghe Coal Mine (HQH), and the average buried depth was about 760 m subsurface. Structurally, HQH is a monoclinal structure with dip of 1°–3°, folds and faults are not developed. The main strata in this district include Yanchang Formation of Upper Triassic, Yan’an Formation of middle and lower Jurassic, Zhilo Formation of middle Jurassic, Anding Formation of middle Jurassic, Zhidan Group of lower Cretaceous, Quaternary, and the working face belongs to unstable layer, which can be mined locally. Samples of medium bursting proneness were obtained and examined from No. 3 coal seam of Nalinhe Coal Mine (NLH), and the average buried depth was about 600 m subsurface. NLH is located in the north Ordos Basin, close to HQH. The macro components of coal are mainly composed of bright coal and less dark coal, maceral components of coal mostly include vitrinite, followed by fusinite, and the metamorphic stage is bituminous coal stage I. Samples of no bursting proneness were obtained and examined from No. 9 coal seam of Pingshuo Coal Mine (PS), and the average buried depth was 150 m subsurface. PS is situated in the north of Ningwu coalfield, with Ningwu syncline as the main structure, associated with lower graded fold structure, and the integrity of coal seam is damaged in a certain extent. The main strata contain Majiagou Formation of middle Ordovician, Benxi Formation of Middle Carboniferous, Taiyuan Formation of Upper Carboniferous, Shanxi Formation and Lower Shihezi Formation of Lower Permian, Middle-Pleistocene, and Upper-Pleistocene. The coal samples were divided into three groups: Group 1 were cubes with side length of 10–20 mm and mass of about 5 g, which were prepared for MIP and LTNAD, as shown in
Figure 2a,b; Group 2 were cylinders with diameter of 50 mm and height of 100 mm, the two ends were ground flat, the side was smooth, and the unevenness was less than 0.01 mm, which were prepared for X-ray CT, as shown in
Figure 2c; Group 3 were volumes with dimension of
, and the smoothest surface of sample was chosen as the observation surface in SEM, as shown in
Figure 2d. Proximate analysis was conducted according to Chinese National Standard GB/T 212-2008, and the results were shown in
Table 1.
2.2. MIP
MIP were conducted by Micromeritics’ AutoPore IV 9500 and according to Chinese National Standard GB/T 21650.3–2011, the maximum test pressure was 60,000 psi (414 MPa), and the test pore diameter range was 3 nm–1000 um, as shown in
Figure 3a. Before MIP, the sample was dried at 373 k for 12 h, and then evacuated at 50 umHg for 8 min to discharge the residual gas and moisture. According to the suggestions of Gan et al. [
22] and Zhao et al. [
23], the contact angle between mercury and pore surface was set as 130° and the mercury surface tension was set as 0.485 J/m
2.
2.3. LTNAD
LTNAD were performed by ASAP 2460 and followed Chinese National Standard GB/T 21650.3–2011 and GB/T19587–2017, and the test pore diameter range was 1300 nm, as shown in
Figure 3b. The residual gas and moisture in the sample were removed by the same method as MIP. During the test, the temperature was 77 K and the relative pressure (P/P0) was less than 0.996. The surface area of coal sample was determined by Brunauer-Emmett-Teller (BET) method, while the pore size distribution and pore volume were determined by Barrette-Joyner-Halenda (BJH) method [
24,
25].
2.4. SEM
SEM were completed by JSM-5410 LV and according to Chinese National Standard GB/T 20307-2006, as shown in
Figure 3c. The observation precision could reach 3.5 nm, and magnification range was 35–200,000. The sample was fixed on the stage with conductive tape in the dry and oil-free state, then coated film in the ion sputtering equipment, and put into the observation room. In order to improve the observation effect, the following measures were implemented: (1) shorten sample storage time of the intermediate process; (2) scientific selection of representative areas (determined by consultation of 3 experimenters); (3) repeatedly attempts to select reasonable working voltage (15 KV was selected eventually). The magnification of every representative area was 35, 50, 100, 200, 500, 750, 1000, 1500, 2000, respectively.
2.5. X-ray CT
X-ray CT were finished by ACTIS300320–/225 under Chinese National Standard GB/T26593-2011. The equipment included the cone beam source of X-ray, rotating table, X-ray detector, data processing unit for calculation, visualization, and analysis of observation results, as shown in
Figure 3d. The equipment could scan samples quickly with an interval of 50
from top to bottom, and the minimum resolution was 10
.The pretreated sample was fixed on the working platform, which was not incline or displaced during scanning. The height of the worktable was adjusted to make the center line of the collimating hole the same as the cross section of the sample. The position of the sample was determined by the pre-scanning method, and the scanning mode selected was translation and rotation at the same time.
3. Results
3.1. Characterization of Pore Based on MIP and LTNAD
MIP and LTNAD could measure the distribution of pore with different size, however the coal matrix deformed under high mercury injection pressure during the MIP, which would lead to distortion of result and needed to be corrected [
26].
According to Li [
27], the pore volume increment of porous compressible media measured by MIP could be described as Equation (1):
Equation (1) takes the derivative of
to get Equation (2):
where
refers to intrusion mercury volume;
is filled pore volume, it is well known that there are lots of micropore and super-micropore in coal, some of which can’t be filled even under maximum pressure, and needed to corrected by LTNAD;
is increment of pore volume caused by compressibility of coal matrix;
represents the pore volume with 317
in radius and measured by LTNAD (corresponding to the pressure of 60–410
);
equals increment of mercury injection pressure during MIP, it needs to be pointed out that
can be approximately regarded as a constant equals
under high pressure, calculated by plotting pressure vs. cumulative pore volume, as shown in
Figure 4 (Data from [
28]). The similar result also appeared in the work of predecessor [
29].
By integrating the fitting results of
Figure 4 (
) and LTNAD test data (
) into Equation (2), the cumulative pore volume measured by MIP under high pressure can be corrected. The results before and after correction are shown in
Figure 5 (Data from [
28]). The 317
pore volume measured by MIP and LTNAD are shown in
Table 2. It should be noted that high pressure brings different degrees of compression deformation to samples, and the largest compression deformation occurs on sample from PS.
Coal is a kind of natural fossil fuel with complex weak planes, and the pore size range is wide, fracture network is developed. According to previous studies [
28,
30,
31,
32], the pore in this study is classified to six types: microfracture (d > 10,000 nm), macropore (1000 < d < 10,000 nm), mesopore (100 < d < 1000 nm), transition pore (10 < d < 100 nm), micropore (2 < d < 10 nm). and super-micropore (d < 2 nm), where d is pore diameter. Thereinto, microfracture provides access for gas migration and passing through the coal seam, macropore and mesopore belongs to seepage pore, where gas occurs laminar flow, while transition pore, micropore, and super-micropore are called adsorption pore, where gas diffusion and physical adsorption occurs. The pore size distribution of sample can be obtained by MIP and LTNAD, as shown in
Figure 6. In HQH, the development of pore and fracture is comparatively balanced, microfracture and various types of pore distribution is relatively average, seepage pore and adsorption pore coexist. In NLH, the pore distribution is discrete, and there are more adsorption pore and less seepage pore. While in PS, the total pore volume is largest, the number of micropore and microfracture is large, the integrity of coal is damaged.
3.2. Characterization of Pore and Fracture Based on SEM
According to the information below, the gray scale image obtained by SEM, the quantitative relationship between pixels and spatial scale can be established. If the magnification is 2000, every pixel equals the spatial length of 100 nm (seepage pore), and if the magnification is 20,000, every pixel means the spatial length of 10 nm (adsorption pore). With the increase of magnification, the scanning area of the equipment gradually decreases, so the results can only characterize the pore and fracture in a statistical sense.
The scanning results of micro geological structure of the samples are shown in
Figure 7. Thereinto, in the result HQH granular structure and layered structure coexist, the fact shows that the coal seam has experienced geological structure disturbance, compression, and break occur inside the coal seam, and the coal seam is easy to release energy, which is consistent with the high bursting proneness. As shown in
Figure 7b, granular structure and shell structure coexist, also there are extrusion cross-section, which indicates the coal seam have been subjected to brittle deformation and easy to be damaged. All of these conform to the coal seam with medium bursting proneness. The scanning result of PS demonstrates that there are many granular structures and few massive structures, and no fold and edge shape, these signifies that the coal seam has experienced less geological disturbance and external force, and the destruction process is relatively moderate, which coincides with no bursting proneness coal seam.
It is well accepted that the micro fracture in coal includes both the fracture inside the solid particles (coal matrix and minerals) and between the solid particles. Fracture is a kind of mechanical response, which closely related to the mechanical properties of coal. Fracture can be generally divided into primary fracture and secondary fracture. The former is produced by the uneven shrinkage of solid particles from the influence of temperature, pressure, and other factors during coal-forming process, and the surface is relatively flat and smooth. While, the latter is the result of external force, and the surface is irregular [
33]. The result of micro fracture structure by SEM are shown in
Figure 8. In the result of HQH, the fracture width is larger. The secondary fracture can be clearly seen under 200 times magnification, and the fracture is well developed. While at 2000 times magnification, mineral filling can be seen inside the fracture, and the geological effect is also very obvious. In NLH, the fracture density is relatively large. When the magnification was 350 times, multiple secondary fractures can be clearly seen and distributes irregularly. At 2000 times magnification, mineral filling can be seen in the fracture. The geological effect is obvious, and the fracture development is not the same as HQH. In the scanning results of PS, fracture can be seen at 750 times magnification. The fracture is basically consistent with the texture direction and can be regarded as primary fracture, which indicates that the geological effect is weak.
Pore in coal are divided into two types based on formation mechanism, matrix pores (including pores caused by gas accumulation and migration and residual pores of plant cells) and cleat pores (caused by geological structure and external load) [
34,
35]. The scanning results of pore structure are shown in
Figure 9. In HQH, the result shows that the pore is well developed, the pore size distribution is relatively balanced. Matrix pore and cleat pore coexist, the gas storage capacity is poor, and the gas content is low. The pore size distribution range in NLH is smaller than that of HQH, and there are more mesopore, transition pore, and micropore, and most of them are matrix pores. While, in PS, the content of micropore and microfracture is larger than the others, and the distribution of pores with different size are quite different, and the content of super micropore is very small, which indicates that PS has good gas storage capacity and belongs to gas mine.
3.3. Characterization of Pore and Fracture Based on X-ray CT
3D reconstruction technology expands the research field of X-ray CT from 2D to 3D, and also builds a bridge from micro scale to laboratory scale, which obtains fruitful results in the study of pore and fracture in coal [
36,
37,
38,
39,
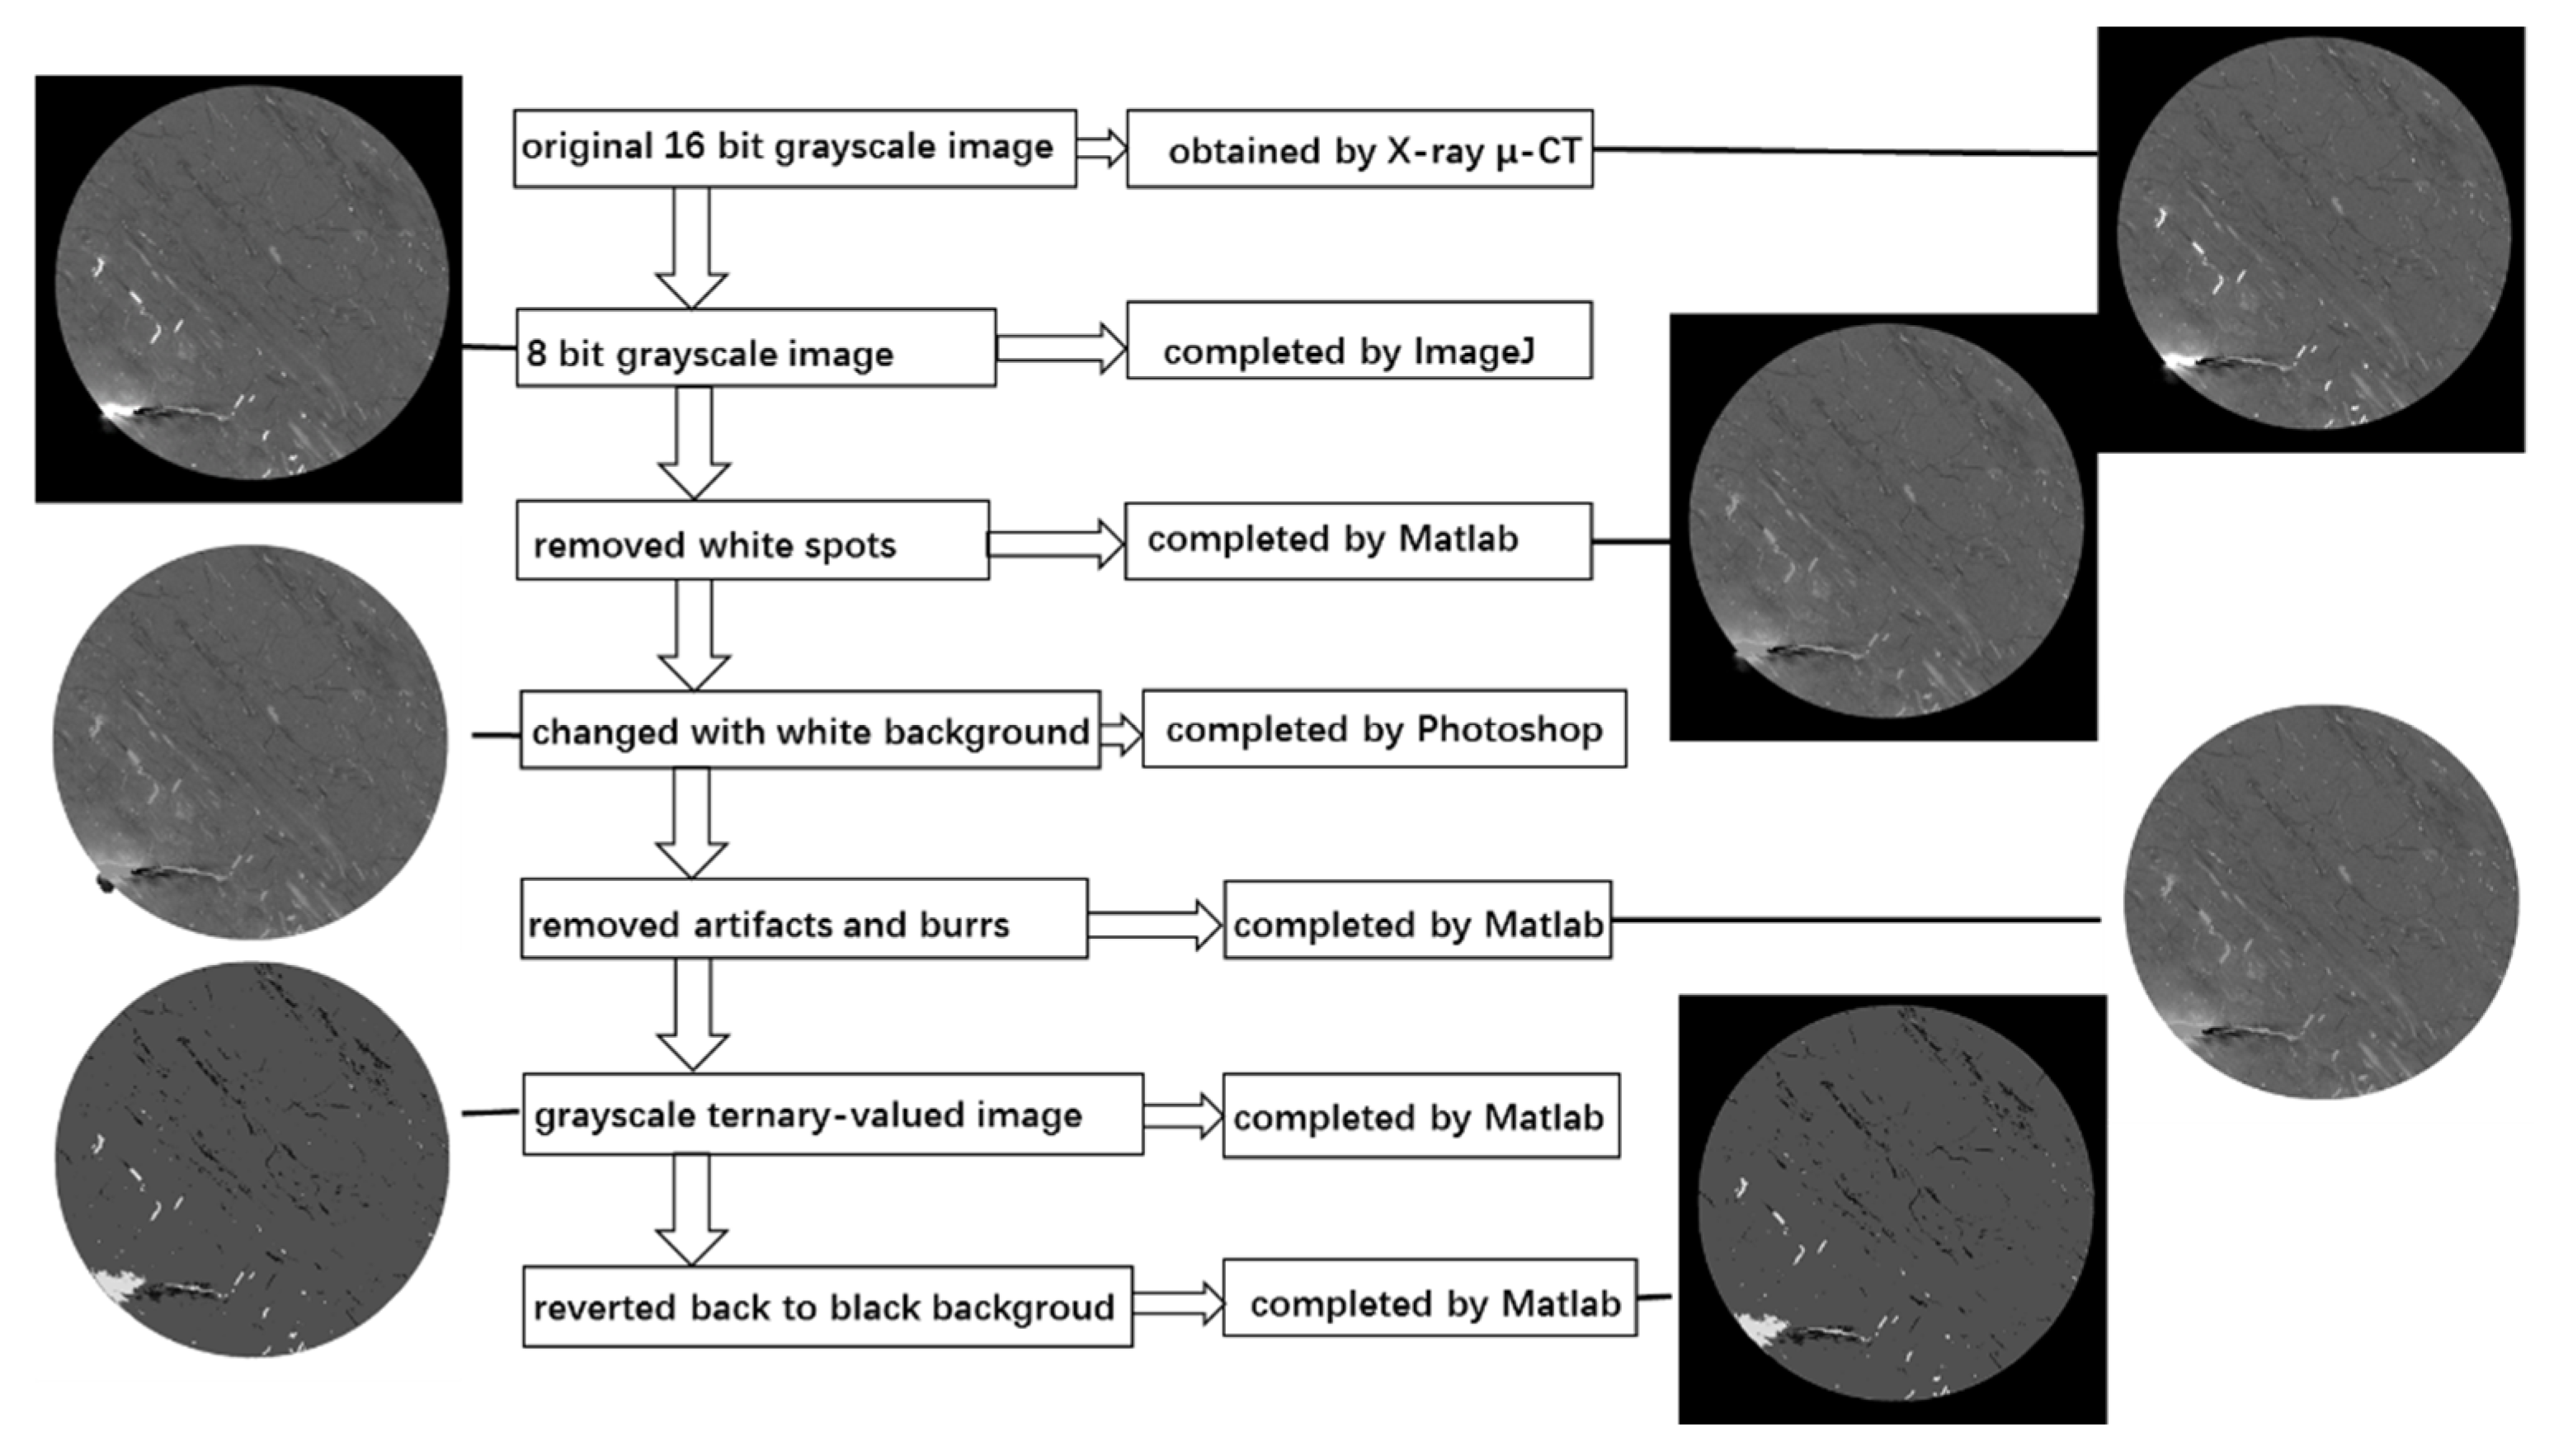
40]. However, it is found that the 16-bit gray scale image formed by X-ray CT have some problems requires further processing before 3D reconstruction, such as low recognizable identity of different components, coexistence of artifacts and noises, fuzzy edges. In this paper, coal is treated based on three components: coal matrix, mineral, pore and fracture. In the gray scale image, heavy gray represents coal matrix, bright gray and white stands for mineral, while black refers to the fractures. Taking PS for example, the treatment process and effect are shown in
Figure 10. It should be noted that the resolution of the gray scale images used in this paper was 50
, so only the fracture can be analyzed after reconstruction.
Many software can be used to 3D reconstruction such as MATLAB, mimics, and Avizo. In this paper, Avizo is chosen due to the advantages of simple image processing, clear gray threshold division, picture, and convenient analysis. As is known, the spatial distribution of the three components in coal is random, which is the result of the combined action of geological structure and biochemical reaction during the complex coal-forming process. The results of 3D reconstruction are shown in
Figure 11. The study shows that the regularity of fracture distribution in HQH is not strong, the fracture apertures is small, and the gas drainage channel is not smooth. While the regional characteristics of fracture distribution of samples from NLH are obvious, the fracture apertures increase, which is conducive to gas drainage. It is worth noting that the direction of fracture is basically parallel to the bedding, and there are many approximate horizontal fracture zones near the top, which probably causes by human error during processing. The fracture distribution of coal samples in PS is relatively uniform, bedding and cleat coexist, which is conducive to gas drainage.
3.4. Fractal Characteristics of Pore and Fracture of Coal with Different Bursting Proneness
Fractal theory was put forward by Mandelbrot in 1942, which could be used to describe complex pore and fracture information. Fractal dimension used most frequently includes topological fractal, Hausdorff dimension, box dimension fractal, and self-similar fractal, etc. [
41,
42]. The calculation methods of fractal dimension cover box-counting method, Fourier-counting method, and probability statistics method. Everyone has its own advantages and weaknesses [
43,
44]. In this paper, various methods are used to analyze the fractal of pore and fracture.
3.4.1. Fractal Dimension Value Based on MIP
According to the principle of MIP and Washburn Formula, the pore radius (r) and mercury injection pressure (P) can be obtained, and satisfies the Equation (3):
where P represents the mercury intrusion pressure;
refers to surface tension of mercury (the value in the experiment is 0.485 J/m
2);
stands for the contact angle of mercury (130° in this test); r is the pore radius.
Based on the definition of fractal dimension, if the pore volume (V) in coal is determined by the small ball with r in radius, the number of small balls required (N) would satisfy the Equation (4) and Equation (5). And the volume of pore (V) and pressure (P) conforms to Equation (6).
where c is constant; D refers to volume fractal dimension.
Both sides of Equation (6) are differentiated and logarithm, the Equation (7) is obtained,
The result of MIP indicates that linear relationship exists between
and
, while the slope of the straight line is (D-4), so the volume fractal dimension(D
1) of coal can be calculated, as shown in
Table 3.
The data fitting curve is shown in
Figure 12, and the detailed calculation process is introduced in the paper of Li [
28]. It is known that the larger the fractal dimension, the more complex the pore structure. The volume fractal dimension of coal samples in this paper are all greater than 3, which did not meet the fractal characteristics of coal reservoirs under natural conditions, however it qualitatively indicate that the pore is very complex, and the fractal dimension distortion is caused by the compression deformation of coal matrix [
45,
46].
3.4.2. Fractal Dimension Value Based on LTNAD
In order to characterize the surface irregularity of coal, the data from LTNAD is processed following Frenkel-Halsey-Hill (FHH) model, and then used to calculate fractal dimension [
20]. The calculation method is expressed in Equation (8):
where V equals volume corresponding to equilibrium pressure; V
m refers to the volume of monolayer coverage; A is the power-law exponent, which is decided by the surface fractal dimension (D
2) and the adsorption mechanism; P
0 represents the gas saturation pressure; The value A is the slope of fitting line of plotting lnV vs. ln(ln(P
0/P)), which are derived from LTNAD, and the surface fractal dimension(D
2) is computed by Equation (9).
The measurements of FHH model are shown in
Figure 13. According to the Kelvin equation, capillary condensation cannot occur when P/P
0 < 0.5, thus it is selected to divide the adsorption process into two parts, 0.5 < P/P
0 < 1 and P/P
0 < 0.5, respectively [
47]. The adsorption capacity of the former is related to internal structure of pore. The fractal dimension (D
3) represents the structure fractal dimension of pore. While the adsorption capacity of the latter depends mainly on Van Der Waals force, and the adsorption capacity is related to the surface roughness of pore. The fractal dimension value (D
2) represents the surface fractal dimension of the pore. As shown in
Table 4, the research suggests that positive correlation appears between the structure fractal dimension (D
3) and the degree of bursting proneness, but the correlation between the surface fractal dimension (D
2) and the degree of bursting proneness does not occur.
3.4.3. Fractal Dimension Value from SEM
The gray scale image from SEM can show the surface micro morphology characteristics of sample, and the observation scales reaches
or even
, which plays an important role in the further study of the micro mechanism of dynamic disaster in coal. Generally, the gray scale image obtained by SEM needs to be processed before they are used for fractal dimension calculation, such as label clipping and image binarization, as shown in
Figure 14a–c. In this paper, the global threshold method is used to determine the gray threshold, the porosity of coal is used to check the validity of threshold, and then the image is binarized. In the processed binary image, the gray value of pore and fracture is relatively small and the color is relatively dark, while the gray value of solid surface is relatively large and the color is relatively light. The classical box-counting method is selected for the calculation of fractal dimension. The box with side length of δ is used to cover the binary picture (as shown in
Figure 14d, and the required number of boxes N(δ) for completely covers the pore and fracture (dark part) is calculated. The fractal dimension value (D
4) is calculated by Equation (10), and the calculation process is shown in
Figure 14e. In order to avoid the dispersion of fractal dimension caused by different pictures, three gray scale images with magnification of 750 are selected, and then take the average value as the final value. The results are shown in
Table 5.
3.4.4. Fractal Dimension Value Calculated by X-ray CT
The 16-bit gray scale image from X-ray CT can clearly show the micro morphological characteristics of coal, includes coal matrix, mineral, pore and fracture, and the observation scales reaches
. It is generally accepted that X-ray CT belongs to non-destructive detection, but the image should be pretreated and then used for the calculation of fractal dimension, like the image from SEM. The pretreatment includes: (1) original image denoising; (2) separation of fracture and image background because they both are black; (3) determination of gray threshold; (4) image binarization; (5) calculation of the fractal dimension value with box-counting method. In the step (3), the gray threshold is determined by the porosity inversion method based on the gray distribution, According to the suggestion of Zhong et al. [
48]. The calculation process is shown in
Figure 15, it can be seen that the determination of gray threshold is important, and all the steps should be strictly implemented to obtain accurate fractal dimension. In order to better show the CT characteristics of the coal with bursting proneness, three images (the 100th, 1000th, and 1900th included) of every coal sample are selected, and analyzed following the steps in
Figure 15, then take their average fractal dimension value as the final value. The calculation result is shown in
Table 5, and it shows that the fractal dimension of
scale (calculated by SEM) is close to that of
scale (obtained by CT), and these samples have good self-similarity.
4. Discussion
Coal burst is a common form of dynamic disasters, and the inducements include fault instability, mining, etc. [
49]. Further analysis of pore and fracture characteristics is the foundation to study the micro mechanism of coal burst. In this paper, experiments (include MIP, LTNAD, SEM, X-ray CT methods), DIC and fractal theory are all used to explore the pore and fracture characteristics of coal samples with different bursting proneness. MIP test and LTNAD test can be used to measure the distribution of different pore sizes, and the results of former are modified by latter. It is considered that the pore distribution of HQH (high bursting proneness) is relatively balanced, adsorption pores and seepage holes coexist, there are more adsorption pores in NLH (medium bursting proneness), while PS (no bursting proneness) has the largest total amount of pores and the worst integrity of coal sample. The results of SEM and X-ray CT with different magnification show that HQH has experienced serious geological structure damage, and is easy to release energy. Also, there are large fracture width and uneven distribution, obvious secondary fracture, and unsmooth gas migration channel. The extrusion section exits in NLH, which is prone to brittle failure and high fracture density, but the regularity of distribution is not strong, and the local fracture width is large, which is conducive to gas migration. PS experiences less geological disturbance, fractures are basically parallel to bedding, mostly belong to primary fractures, the capacity of gas storage and migration is good.
Fractal dimension has proven to be an important tool to effectively characterize the complexity and surface roughness of the coal [
50]. When the mercury injection pressure is greater than 60 MPa, the coal matrix will have a large compression deformation, and the fractal dimension of pore volume greater than 3, which did not meet the fractal characteristics of coal reservoirs under natural conditions. The results of LTNAD show that the correlation between surface fractal dimension and the bursting proneness is not high, but structure fractal dimension is positively correlated with bursting proneness. The stronger bursting proneness correspond to the larger the volume fractal dimension. The fractal dimension values of the samples calculated by SEM and X-ray CT have a positive correlation with bursting proneness, and the fractal dimension values of
scale (obtained from SEM) and
scale (obtained from X-ray CT) are approximate, i.e., they have self- similarity.
5. Conclusions
Four different test methods (including MIP, LTNAD, SEM, and X-ray CT) and fractal theory were used to analyze the pore and fracture characteristics of coal with bursting proneness, and the differences of pore and fracture in coal were analyzed by DIC. The following conclusions were drawn:
(1) The result of LTNAD could be used to modify the MIP result, and the corrections truly reflected the distribution of pore and fracture in coal. The distribution of pore and fracture in HQH (high bursting proneness) was balanced, the seepage pore of NLH (medium bursting proneness) was less and the adsorption pore was more, and the distribution of pore and fracture in PS (no bursting proneness) was unbalanced, and the integrity of sample was most seriously destroyed.
(2) The gray scale images from SEM with different magnifications and 3D reconstruction technology based on X-ray CT could show the geological structure, fracture structure, and pore structure characteristics of coal in nm, um, and mm scales. The coexistence of granular structure and layered structure in HQH (high bursting proneness) showed that the coal seam was apt to energy release after geological structure disturbance, there were mineral fillings in the fracture, which indicated that the gas storage capacity of coal seam was poor, and the gas content was low, The granular structure and shell structure coexisted in NLH (medium bursting proneness), including extrusion fracture, which suggested that the coal seam was prone to brittle failure, the fracture density was large, and the distribution was irregular, the pore size distribution range was small. In PS (no bursting proneness), sample had lots of granular structure and small amount of massive structure, which showed that the coal seam experienced less geological disturbance and external force influence, the failure process was moderate, the fracture direction was basically consistent with the texture direction, and the gas storage and migration ability was good.
(3) Fractal dimension was an important approach to characterize the pore and fracture of coal. The fractal dimension from LTNAD, SEM, and X-ray CT were calculated successfully, and the results showed that the methods complemented each other, the coal had good fractal property. The fractal dimension had a positive correlation with the degree of bursting proneness.
(4) Several theoretical and experimental methods are used to study the characteristics of coal pore and fracture, it is proved that the pore and fracture of coal with bursting proneness conform to fractal theory, and the internal structure of coal is complex. However, the research is unable to characterize the connectivity and percolation degree, more efforts should be made on the lacunarity and succolarity of coal with bursting proneness.
Author Contributions
Conceptualization and original draft writing, Y.L. and Y.J.; formal analysis and data curation, Y.Z. and B.Z.; experimental work and monitoring plan, H.S. and B.L.; software and investigation, Y.L. and Y.Z.; image manipulation, Y.L. and B.L. All authors have read and agreed to the published version of the manuscript.
Funding
This research was funded by the National Natural Science Foundation of China, grant number U1910206, 51874312, 51861145403, 41872205, the Yue Qi Distinguished Scholar Project, China University of Mining & Technology (Beijing), grant number 2017 JCB02, the Beijing Natural Science Foundation, grant number 8202041. These sources of supports are gratefully acknowledged.
Acknowledgments
The research was supported by State Key Laboratory of Coal Resources and Safe Mining, China University of Mining and Technology Beijing. These supports are gratefully acknowledged.
Conflicts of Interest
The authors declare no conflict of interest.
References
- Khatri, D.; Gopan, A.; Yang, Z.; Adeosun, A.; Axelbaum, R.L. Characterizing early stage sub-micron particle formation during pulverized coal combustion in a flat flame burner. Fuel 2019, 258, 115995. [Google Scholar] [CrossRef]
- Xu, M.; Yu, D.; Yao, H.; Liu, X.; Qiao, Y. Coal combustion-generated aerosols: Formation and properties. Proc. Combust. Inst. 2011, 33, 1681–1697. [Google Scholar] [CrossRef]
- Opluštil, S.; Šimůnek, Z.; Pšenička, J.; Bek, J.; Libertín, M. A 25 million year macrofloral record (Carboniferous-Permian) in the Czech part of the Intra-Sudetic Basin; biostratigraphy, plant diversity and vegetation patterns. Rev. Palaeobot. Palynol. 2017, 244, 241–273. [Google Scholar] [CrossRef]
- Bednarz, M.; McIlroy, D. Organism-sediment interactions in shale-hydrocarbon reservoir facies—Three-dimensional reconstruction of complex ichnofabric geometries and pore-networks. Int. J. Coal Geol. 2015, 150–151, 238–251. [Google Scholar] [CrossRef]
- Yao, Y.; Liu, D.; Che, Y.; Tang, D.; Tang, S.; Huang, W. Non-destructive characterization of coal samples from China using microfocus X-ray computed tomography. Int. J. Coal Geol. 2009, 80, 113–123. [Google Scholar] [CrossRef]
- Keneti, A.; Sainsbury, B.A. Review of published rockburst events and their contributing factors. Eng. Geol. 2018, 246, 361–373. [Google Scholar] [CrossRef]
- Zhao, Y.; Liu, S.; Zhao, G.; Derek, E.; Jiang, Y.; Han, J. Failure mechanisms in coal: Dependence on strain rate and microstructure. AGU J. Geophys. Res. Solid Earth 2014, 120, 1195–1209. [Google Scholar] [CrossRef]
- Sainoki, A.; Mitri, H.S.; Yao, M.; Chinnasane, D. Discontinuum Modelling Approach for Stress Analysis at a Seismic Source: Case Study. Rock Mech. Rock Eng. 2016, 49, 4749–4765. [Google Scholar] [CrossRef]
- Wang, H.; Jiang, Y.; Xue, S.; Pang, X.; Lin, Z.; Deng, D. Investigation of Intrinsic and External Factors Contributing to the Occurrence of Coal Bumps in the Mining Area of Western Beijing, China. Rock Mech. Rock Eng. 2017, 50, 1033–1047. [Google Scholar] [CrossRef]
- Wang, H.; Xue, S.; Shi, R.; Jiang, Y.; Gong, W.; Mao, L. Investigation of Fault Displacement Evolution During Extraction in Longwall Panel in an Underground Coal Mine. Rock Mech. Rock Eng. 2020, 53, 1809–1826. [Google Scholar] [CrossRef]
- Wang, H.; Shi, R.; Deng, D.; Jiang, Y.; Wang, G.; Gong, W. Characteristic of stress evolution on fault surface and coal bursts mechanism during the extraction of longwall face in Yima mining area, China. J. Struct. Geol. 2020, 136, 104071. [Google Scholar] [CrossRef]
- Okolo, G.N.; Everson, R.C.; Neomagus, H.W.J.P.; Roberts, M.J.; Sakurovs, R. Comparing the porosity and surface areas of coal as measured by gas adsorption, mercury intrusion and SAXS techniques. Fuel 2015, 141, 293–304. [Google Scholar] [CrossRef]
- Firouzi, M.; Rupp, E.C.; Liu, C.W.; Wilcox, J. Molecular simulation and experimental characterization of the nanoporous structures of coal and gas shale. Int. J. Coal Geol. 2014, 121, 123–128. [Google Scholar] [CrossRef]
- Sakurovs, R.; He, L.; Melnichenko, Y.B.; Radlinski, A.P.; Blach, T.; Lemmel, H.; Mildner, D.F.R. Pore size distribution and accessible pore size distribution in bituminous coals. Int. J. Coal Geol. 2012, 100, 51–64. [Google Scholar] [CrossRef]
- Radlinski, A.P.; Mastalerz, M.; Hinde, A.L.; Hainbuchner, M.; Rauch, H.; Baron, M.; Lin, J.S.; Fan, L.; Thiyagarajan, P. Application of SAXS and SANS in evaluation of porosity, pore size distribution and surface area of coal. Int. J. Coal Geol. 2004, 59, 245–271. [Google Scholar] [CrossRef]
- Zhou, H.; Zhong, J.; Ren, W.; Wang, X.; Yi, H. Characterization of pore-fracture networks and their evolution at various measurement scales in coal samples using X-ray μCT and a fractal method. Int. J. Coal Geol. 2018, 189, 35–49. [Google Scholar] [CrossRef]
- Karacan, C.O.; Okandan, E. Adsorption and gas transport in coal microstructure: Investigation and evaluation by quantitative X-ray CT imaging. Fuel 2001, 80, 509–520. [Google Scholar] [CrossRef]
- Roslin, A.; Pokrajac, D.; Zhou, Y. Cleat structure analysis and permeability simulation of coal samples based on micro-computed tomography (micro-CT) and scan electron microscopy (SEM) technology. Fuel 2019, 254, 115579. [Google Scholar] [CrossRef]
- Karimpouli, S.; Tahmasebi, P.; Ramandi, H.L.; Mostaghimi, P.; Saadatfar, M. Stochastic modeling of coal fracture network by direct use of micro-computed tomography images. Int. J. Coal Geol. 2017, 179, 153–163. [Google Scholar] [CrossRef] [Green Version]
- Liu, X.; Nie, B. Fractal characteristics of coal samples utilizing image analysis and gas adsorption. Fuel 2016, 182, 314–322. [Google Scholar] [CrossRef]
- Kwiecińska, B.; Pusz, S.; Valentine, B.J. Application of electron microscopy TEM and SEM for analysis of coals, organic-rich shales and carbonaceous matter. Int. J. Coal Geol. 2019, 211, 103203. [Google Scholar] [CrossRef]
- Gan, H.; Nandi, S.P.; Walker, P.L. Nature of the porosity in American coals. Fuel 1972, 51, 272–277. [Google Scholar] [CrossRef]
- Zhao, D.; Guo, Y.; Wang, G.; Mao, X. Characterizing nanoscale pores and its structure in coal: Experimental investigation. Energy Explor. Exploit. 2019, 37, 1320–1347. [Google Scholar] [CrossRef] [Green Version]
- Clarkson, C.R.; Freeman, M.; He, L.; Agamalian, M.; Melnichenko, Y.B.; Mastalerz, M.; Bustin, R.M.; Radliński, A.P.; Blach, T.P. Characterization of tight gas reservoir pore structure using USANS/SANS and gas adsorption analysis. Fuel 2012, 95, 371–385. [Google Scholar] [CrossRef]
- Han, H.; Guo, C.; Zhong, N.; Pang, P.; Gao, Y. A study on fractal characteristics of lacustrine shales of Qingshankou Formation in the Songliao Basin, northeast China using nitrogen adsorption and mercury injection methods. J. Pet. Sci. Eng. 2020, 193, 107378. [Google Scholar] [CrossRef]
- Zhang, Z.; Qin, Y.; Yi, T.; You, Z.; Yang, Z. Pore Structure Characteristics of Coal and Their Geological Controlling Factors in Eastern Yunnan and Western Guizhou, China. ACS Omega 2020, 5, 19565–19578. [Google Scholar] [CrossRef]
- Li, Y.; Lu, G.; Rudolph, V. Compressibility and fractal dimension of fine coal particles in relation to pore structure characterization using mercury porosimetry. Part. Part. Syst. Charact. 1999, 16, 25–31. [Google Scholar] [CrossRef]
- Li, Y.; Jiang, Y.; Zhang, B.; Song, H.; Dong, W.; Wang, P. Investigation on the pore characteristics of coal specimens with bursting proneness. Sci. Rep. 2019, 9, 16518. [Google Scholar] [CrossRef]
- Kaufmann, J.; Loser, R.; Leemann, A. Analysis of cement-bonded materials by multi-cycle mercury intrusion and nitrogen sorption. J. Colloid Interface Sci. 2009, 336, 730–737. [Google Scholar] [CrossRef]
- Zheng, S.; Yao, Y.; Liu, D.; Cai, Y.; Liu, Y. Characterizations of full-scale pore size distribution, porosity and permeability of coals: A novel methodology by nuclear magnetic resonance and fractal analysis theory. Int. J. Coal Geol. 2018, 196, 148–158. [Google Scholar] [CrossRef]
- Li, W.; Liu, H.; Song, X. Multifractal analysis of Hg pore size distributions of tectonically deformed coals. Int. J. Coal Geol. 2015, 144–145, 138–152. [Google Scholar] [CrossRef]
- Wang, Z.; Cheng, Y.; Zhang, K.; Hao, C.; Wang, L.; Li, W.; Hu, B. Characteristics of microscopic pore structure and fractal dimension of bituminous coal by cyclic gas adsorption/desorption: An experimental study. Fuel 2018, 232, 495–505. [Google Scholar] [CrossRef]
- Wu, H.; Dong, S.; Li, D.; Huang, Y.; Qi, X. Experimental study on dynamic elastic parameters of coal samples. Int. J. Min. Sci. Technol. 2015, 25, 447–452. [Google Scholar] [CrossRef]
- Yu, S.; Bo, J.; Pei, S.; Jiahao, W. Matrix compression and multifractal characterization for tectonically deformed coals by Hg porosimetry. Fuel 2018, 211, 661–675. [Google Scholar] [CrossRef]
- Guan, J.; Hou, R. Coal pore properties of matrix & cleat and their porosity measurement methods. J. North China Inst. Water Conserv. Hydroelectr. Power 1999, 1–8. [Google Scholar] [CrossRef]
- Yao, Y.; Liu, D.M.; Cai, Y.D.; Li, J.Q. Advanced characterization of pores and fractures in coals by nuclear magnetic resonance and X-ray computed tomography. Sci. China Earth Sci. 2010, 53, 854–862. [Google Scholar] [CrossRef]
- Zhao, Y.; Sun, Y.; Liu, S.; Chen, Z.; Yuan, L. Pore structure characterization of coal by synchrotron radiation nano-CT. Fuel 2018, 215, 102–110. [Google Scholar] [CrossRef]
- Mathews, J.P.; Campbell, Q.P.; Xu, H.; Halleck, P. A review of the application of X-ray computed tomography to the study of coal. Fuel 2017, 209, 10–24. [Google Scholar] [CrossRef]
- Shi, X.; Pan, J.; Hou, Q.; Jin, Y.; Wang, Z.; Niu, Q.; Li, M. Micrometer-scale fractures in coal related to coal rank based on micro-CT scanning and fractal theory. Fuel 2018, 212, 162–172. [Google Scholar] [CrossRef]
- Wang, G.; Shen, J.; Liu, S.; Jiang, C.; Qin, X. Three-dimensional modeling and analysis of macro-pore structure of coal using combined X-ray CT imaging and fractal theory. Int. J. Rock Mech. Min. Sci. 2019, 123, 104082. [Google Scholar] [CrossRef]
- Wu, H.; Zhou, Y.; Yao, Y.; Wu, K. Imaged based fractal characterization of micro-fracture structure in coal. Fuel 2019, 239, 53–62. [Google Scholar] [CrossRef] [Green Version]
- Kravchenko, A.N.; Boast, C.W.; Bullock, D.G. Multifractal analysis of soil spatial variability. Agron. J. 1999, 91, 1033–1041. [Google Scholar] [CrossRef]
- Song, H.; Min, L.; Jun, X.; Lushi, S.; Peisheng, L.; Sheng, S.; Xuexin, S. Fractal characteristic of three Chinese coals. Fuel 2004, 83, 1307–1313. [Google Scholar] [CrossRef]
- Sarkar, N.; Chaudhuri, B.B. An efficient approach to estimate fractal dimension of textural images. Pattern Recognit. 1992, 25, 1035–1041. [Google Scholar] [CrossRef]
- Fu, H.; Tang, D.; Xu, T.; Xu, H.; Tao, S.; Li, S.; Yin, Z.Y.; Chen, B.; Zhang, C.; Fu, H.; et al. Characteristics of pore structure and fractal dimension of low-rank coal: A case study of Lower Jurassic Xishanyao coal in the southern Junggar Basin, NW China. Fuel 2017, 193, 254–264. [Google Scholar] [CrossRef]
- Novo, M.F.; Marı, M. The use of fractal analysis in the textural characterization of coals. Fuel 2008, 87, 222–231. [Google Scholar] [CrossRef]
- Nie, B.; Liu, X.; Yang, L.; Meng, J.; Li, X. Pore structure characterization of different rank coals using gas adsorption and scanning electron microscopy. Fuel 2015, 158, 908–917. [Google Scholar] [CrossRef]
- Zhong, J.; Zhou, H.; Ren, W.; Wang, Z.; Chen, J. A three-value-segmentation method of coal containing inclusion based on gray distribution of computed tomography image. Mech. Eng. 2018, 40, 140–147. [Google Scholar] [CrossRef]
- Wang, H.; Shi, R.; Lu, C.; Jiang, Y.; Deng, D.; Zhang, D. Investigation of sudden faults instability induced by coal mining. Saf. Sci. 2019, 115, 256–264. [Google Scholar] [CrossRef]
- Xia, Y.; Cai, J.; Perfect, E.; Wei, W.; Zhang, Q.; Meng, Q. Fractal dimension, lacunarity and succolarity analyses on CT images of reservoir rocks for permeability prediction. J. Hydrol. 2019, 579, 124198. [Google Scholar] [CrossRef]
Figure 1.
Geographical location of the coal samples.
Figure 1.
Geographical location of the coal samples.
Figure 2.
Schematic diagram of the coal specimen.
Figure 2.
Schematic diagram of the coal specimen.
Figure 3.
Instrument and equipment diagram. (a) mercury intrusion porosimeter instrument; (b) nitrogen adsorption and desorption instrument; (c) scanning electron microscope instrument; (d) X-ray CT scanner instrument.
Figure 3.
Instrument and equipment diagram. (a) mercury intrusion porosimeter instrument; (b) nitrogen adsorption and desorption instrument; (c) scanning electron microscope instrument; (d) X-ray CT scanner instrument.
Figure 4.
Plots of cumulative volume of every specimen as a function of pressure and linear regression of pore volume versus pressure. (a) specimen from HQH; (b) specimen from NLH; (c) specimen from PS.
Figure 4.
Plots of cumulative volume of every specimen as a function of pressure and linear regression of pore volume versus pressure. (a) specimen from HQH; (b) specimen from NLH; (c) specimen from PS.
Figure 5.
Comparison of observed mercury intrusion volume before and after correction. (a) specimens from HQH; (b) specimens from NLH; (c) specimens from PS.
Figure 5.
Comparison of observed mercury intrusion volume before and after correction. (a) specimens from HQH; (b) specimens from NLH; (c) specimens from PS.
Figure 6.
Histogram of coal sample pore size distribution.
Figure 6.
Histogram of coal sample pore size distribution.
Figure 7.
Images of geological structure from SEM. (a) image from HQH; (b) image from NLH; (c) image from PS.
Figure 7.
Images of geological structure from SEM. (a) image from HQH; (b) image from NLH; (c) image from PS.
Figure 8.
Fracture structure comparison of images from SEM. (a) images from HQH; (b) images from NLH; (c) images from PS.
Figure 8.
Fracture structure comparison of images from SEM. (a) images from HQH; (b) images from NLH; (c) images from PS.
Figure 9.
Pore structure comparison of images from SEM. (a) images from HQH; (b) images from NLH; (c) images from PS.
Figure 9.
Pore structure comparison of images from SEM. (a) images from HQH; (b) images from NLH; (c) images from PS.
Figure 10.
CT image processing flow and effect sketch.
Figure 10.
CT image processing flow and effect sketch.
Figure 11.
Reconstruction of images from CT. (a-1) coal matrix of HQH; (a-2) minerals of HQH; (a-3) fractures of HQH;(a-4) the model of HQH; (b-1) coal matrix of NLH; (b-2) minerals of NLH; (b-3) fractures of NLH;(b-4) the model of NLH; (c-1) coal matrix of PS; (c-2) minerals of PS; (c-3) fractures of PS;(c-4) the model of PS.
Figure 12.
Data fitting curve and fractal dimension calculation diagram. (a–c) data of HQH; (d–f) data of NLH; (g–i) data of PS.
Figure 12.
Data fitting curve and fractal dimension calculation diagram. (a–c) data of HQH; (d–f) data of NLH; (g–i) data of PS.
Figure 13.
Fractal dimension calculation results from LTNAD. (a–c) results of HQH; (d–f) results of NLH; (g–i) results of PS.
Figure 13.
Fractal dimension calculation results from LTNAD. (a–c) results of HQH; (d–f) results of NLH; (g–i) results of PS.
Figure 14.
Process chart of fractal dimension calculation by box-counting method from SEM. (a) SEM original grayscale image; (b) SEM original grayscale image removed information label; (c) binary image; (d) box covering; (e) fractal dimension numerical calculation diagram.
Figure 14.
Process chart of fractal dimension calculation by box-counting method from SEM. (a) SEM original grayscale image; (b) SEM original grayscale image removed information label; (c) binary image; (d) box covering; (e) fractal dimension numerical calculation diagram.
Figure 15.
Process chart of fractal dimension calculation by box-counting method from X-ray CT. (a) original gray scale image of X-ray CT; (b) original grayscale image denoising; (c) fracture structure and image background separation; (d) binary image; (e) box covering; (f) fractal dimension numerical calculation diagram.
Table 1.
Results of proximate analysis.
Table 1.
Results of proximate analysis.
| Sampling Location | Fixed Carbon (%) | Ash Content (%) | Volatile Matter (%) | Moisture (%) |
|---|
| HQH | 56.59 | 7.17 | 28.20 | 8.05 |
| NLH | 37.26 | 18.11 | 38.57 | 6.05 |
| PS | 45.62 | 6.60 | 36.84 | 10.94 |
Table 2.
Comparison of 317 nm pore volume between MIP and LTNAD.
Table 2.
Comparison of 317 nm pore volume between MIP and LTNAD.
| Sample ID | Data of MIP(mL/g) | Data of LTNAD (mL/g) |
|---|
| Before Correction | After Correction |
|---|
| HQH-1-1 | 0.046 | 0.018 | 0.011 |
| HQH-2-1 | 0.059 | 0.013 | 0.011 |
| HQH-3-1 | 0.040 | 0.006 | 0.014 |
| NLH-1-1 | 0.039 | 0.013 | 0.012 |
| NLH-2-1 | 0.058 | 0.023 | 0.025 |
| NLH-3-1 | 0.038 | 0.015 | 0.016 |
| PS-1-1 | 0.062 | 0.007 | 0.002 |
| PS-2-1 | 0.024 | 0.003 | 0.002 |
| PS-3-1 | 0.043 | 0.008 | 0.002 |
Table 3.
Linear fitting parameters and volume fractal dimension of coal samples.
Table 3.
Linear fitting parameters and volume fractal dimension of coal samples.
| Sample ID | Fitting Parameters | Volume Fractal Dimension (D1) |
|---|
| Intercept | Slope | Calculated Value | Average Value |
|---|
| HQH-M-1 | −2.056 | −0.787 | 3.213 | 3.359 |
| HQH-M-2 | −2.348 | −0.620 | 3.380 |
| HQH-M-3 | −2.738 | −0.517 | 3.483 |
| NLH-M-1 | −2.458 | −0.664 | 3.336 | 3.462 |
| NLH-M-2 | −2.864 | −0.406 | 3.594 |
| NLH-M-3 | −2.704 | −0.544 | 3.456 |
| PS-M-1 | −3.273 | −0.211 | 3.789 | 3.733 |
| PS-M-2 | −3.531 | −0.252 | 3.748 |
| PS-M-3 | −3.108 | −0.338 | 3.662 |
Table 4.
Structure fractal dimension and surface fractal dimension of coal sample.
Table 4.
Structure fractal dimension and surface fractal dimension of coal sample.
| Sample ID | Fitting Parameters | Surface Fractal Dimension (D2) | Fitting Parameters | Structure Fractal Dimension (D3) |
|---|
| Intercept | Slope | Calculated Value | Average Value | Intercept | Slope | Calculated Value | Average Value |
|---|
| HQH-A-1 | 2.559 | −0.574 | 2.426 | 2.455 | 2.786 | −0.094 | 2.906 | 2.857 |
| HQH-A-2 | 2.386 | −0.597 | 2.403 | 2.651 | −0.108 | 2.892 |
| HQH-A-3 | 2.012 | −0.465 | 2.535 | 2.098 | −0.228 | 2.772 |
| NLH-A-1 | 2.025 | −0.700 | 2.300 | 2.306 | 2.369 | −0.198 | 2.802 | 2.829 |
| NLH-A-2 | 2.918 | −0.637 | 2.363 | 3.255 | −0.138 | 2.862 |
| NLH-A-3 | 2.397 | −0.745 | 2.255 | 2.667 | −0.177 | 2.823 |
| PS-A-1 | 0.402 | −0.640 | 2.360 | 2.433 | 0.520 | −0.335 | 2.665 | 2.613 |
| PS-A-2 | −1.585 | −0.536 | 2.464 | −1.862 | −0.430 | 2.570 |
| PS-A-3 | −1.277 | −0.524 | 2.476 | −1.418 | −0.396 | 2.604 |
Table 5.
Fractal dimension from SEM (D4) and X-ray CT (D5).
Table 5.
Fractal dimension from SEM (D4) and X-ray CT (D5).
| Sample ID | Fractal Dimension from SEM (D4) | Fractal Dimension from CT (D5) |
|---|
| Calculated Value | Average Value | Calculated Value | Average Value |
|---|
| HQH-1 | 1.823 | 1.811 | 1.979 | 1.957 |
| HQH-2 | 1.805 | 1.945 |
| HQH-3 | 1.804 | 1.948 |
| NLH-1 | 1.749 | 1.758 | 1.883 | 1.850 |
| NLH-2 | 1.753 | 1.811 |
| NLH-3 | 1.773 | 1.855 |
| PS-1 | 1.720 | 1.665 | 1.683 | 1.695 |
| PS-2 | 1.640 | 1.712 |
| PS-3 | 1.634 | 1.691 |
| Publisher’s Note: MDPI stays neutral with regard to jurisdictional claims in published maps and institutional affiliations. |
© 2020 by the authors. Licensee MDPI, Basel, Switzerland. This article is an open access article distributed under the terms and conditions of the Creative Commons Attribution (CC BY) license (http://creativecommons.org/licenses/by/4.0/).


