1. Introduction
The technological restraints of the 20th century did not allow a wide-scale application of thermal gas meters, however, the solution used in the first prototypes of the thermal gas meter has been upgraded and improved over the years [
1]. Diaphragm gas meters are most commonly employed for billing individual customers [
2], with ultrasonic gas meters used less and thermal gas meters the least frequently [
3]. It should also be noted that diaphragm gas meters equipped with electronic indexes can be called smart meters with full confidence.
Diaphragm gas meters are fitted with mechanical indexes, and have a number of advantages, which include low price, no need for power supply, low operating costs, resistance to flow disturbances, resistance to liquid and solid pollutants in gas, good metrological properties and high level of operating safety. Another asset of such gas meters is their durability, that is, the possibility of many years of operation while maintaining metrological properties within the maximum permissible limits. Diaphragm gas meters have been operated within gas systems for a number of years, and individual units that had exhibited durability over 20 or 30 years of operation can be encountered. The disadvantages of diaphragm gas meters include the inability to record, convert or remotely transmit various types of metering data (e.g., on the instantaneous gas consumption, maximum gas flow rate, system tightness condition or tampering with the metering system). The downsides also include large dimensions and a high noise level, as well as the significant pressure loss coming with the measurement.
Ultrasonic gas meters, used for billing individual customers, have a number of positives that are not exhibited by diaphragm gas meters with a mechanical counter, while maintaining similar metrological properties. Above all, they have a number of functionalities characteristic for smart meters. Ultrasonic gas meters have electronic indexes that enable recording gas volume and temperature, and come with a possibility to convert gas volume to reference conditions (T conversion) or to correct gas meter indication errors. They can also have a built-in gas valve and data transmission modules. The advantages of such gas meters also include minor dimensions, low pressure loss and quiet operation. A further significant asset of ultrasonic gas meters is accurate calibration when the composition of measured gas is known which contributes to minimising measurement errors. The drawbacks of ultrasonic gas meters include a relatively high price, need for a power supply and the hitherto prevailing lack of their confirmed durability in operating conditions for such long operating periods as in the case of diaphragm gas meters.
The advantages of thermal gas meters are similar to those of ultrasonic gas meters. It is worth adding that a huge advantage of such gas meters is the gas mass flow measurement taken by the gas meter without the requirement for installing additional pressure and gas sensors, when the gas composition is known. Moreover, these gas meters can be fitted with an advanced gas composition identification function, which can improve their metrological characteristics. The downsides of thermal gas meters, apart from those characteristic for ultrasonic gas meters include the impact of pollutants contained in the measured gas on measurement accuracy, speed profile disturbances and the lack of measuring consistency upon a significantly variable composition of the measured gas.
Diaphragm gas meters equipped with electronic indexes can be confidently dubbed as smart meters, combining the advantages of traditional diaphragm gas meters with modern ultrasonic and thermal electronic gas meters. They can have indexes acting as gas volume converters (T correction), data transmission modules, indication error correction or a built-in valve. Their measurement accuracy and durability have been confirmed in the course of previous, long-term operation of traditional diaphragm gas meters, since the mechanical metering unit therein is similar. Of course, the durability of an entire measuring device is impacted by all its elements, and not only the external parts associated with the metering unit, therefore, the durability of the sole electronic indexes will also have to be verified in the course of many years of operation. The price, the lowest among all smart meters, is also a benefit of these gas meters. The disadvantages of diaphragm gas meters fitted with electronic indexes include the ones distinctive for traditional diaphragm gas meters, that is, large dimensions, high noise level and pressure loss, as well as the need for a power supply. The power battery replacement frequency depends on a number of factors, but the recurrence of implementing functions associated with energy-consuming remote communication is important in this regard.
The measuring principle of a thermal mass flow meter is based on ascertaining medium flow rate, using changes in heating or heat absorption resulting from its flow [
4,
5]. According to ISO 14511 [
6], thermal gas meters fall into two basic design categories:
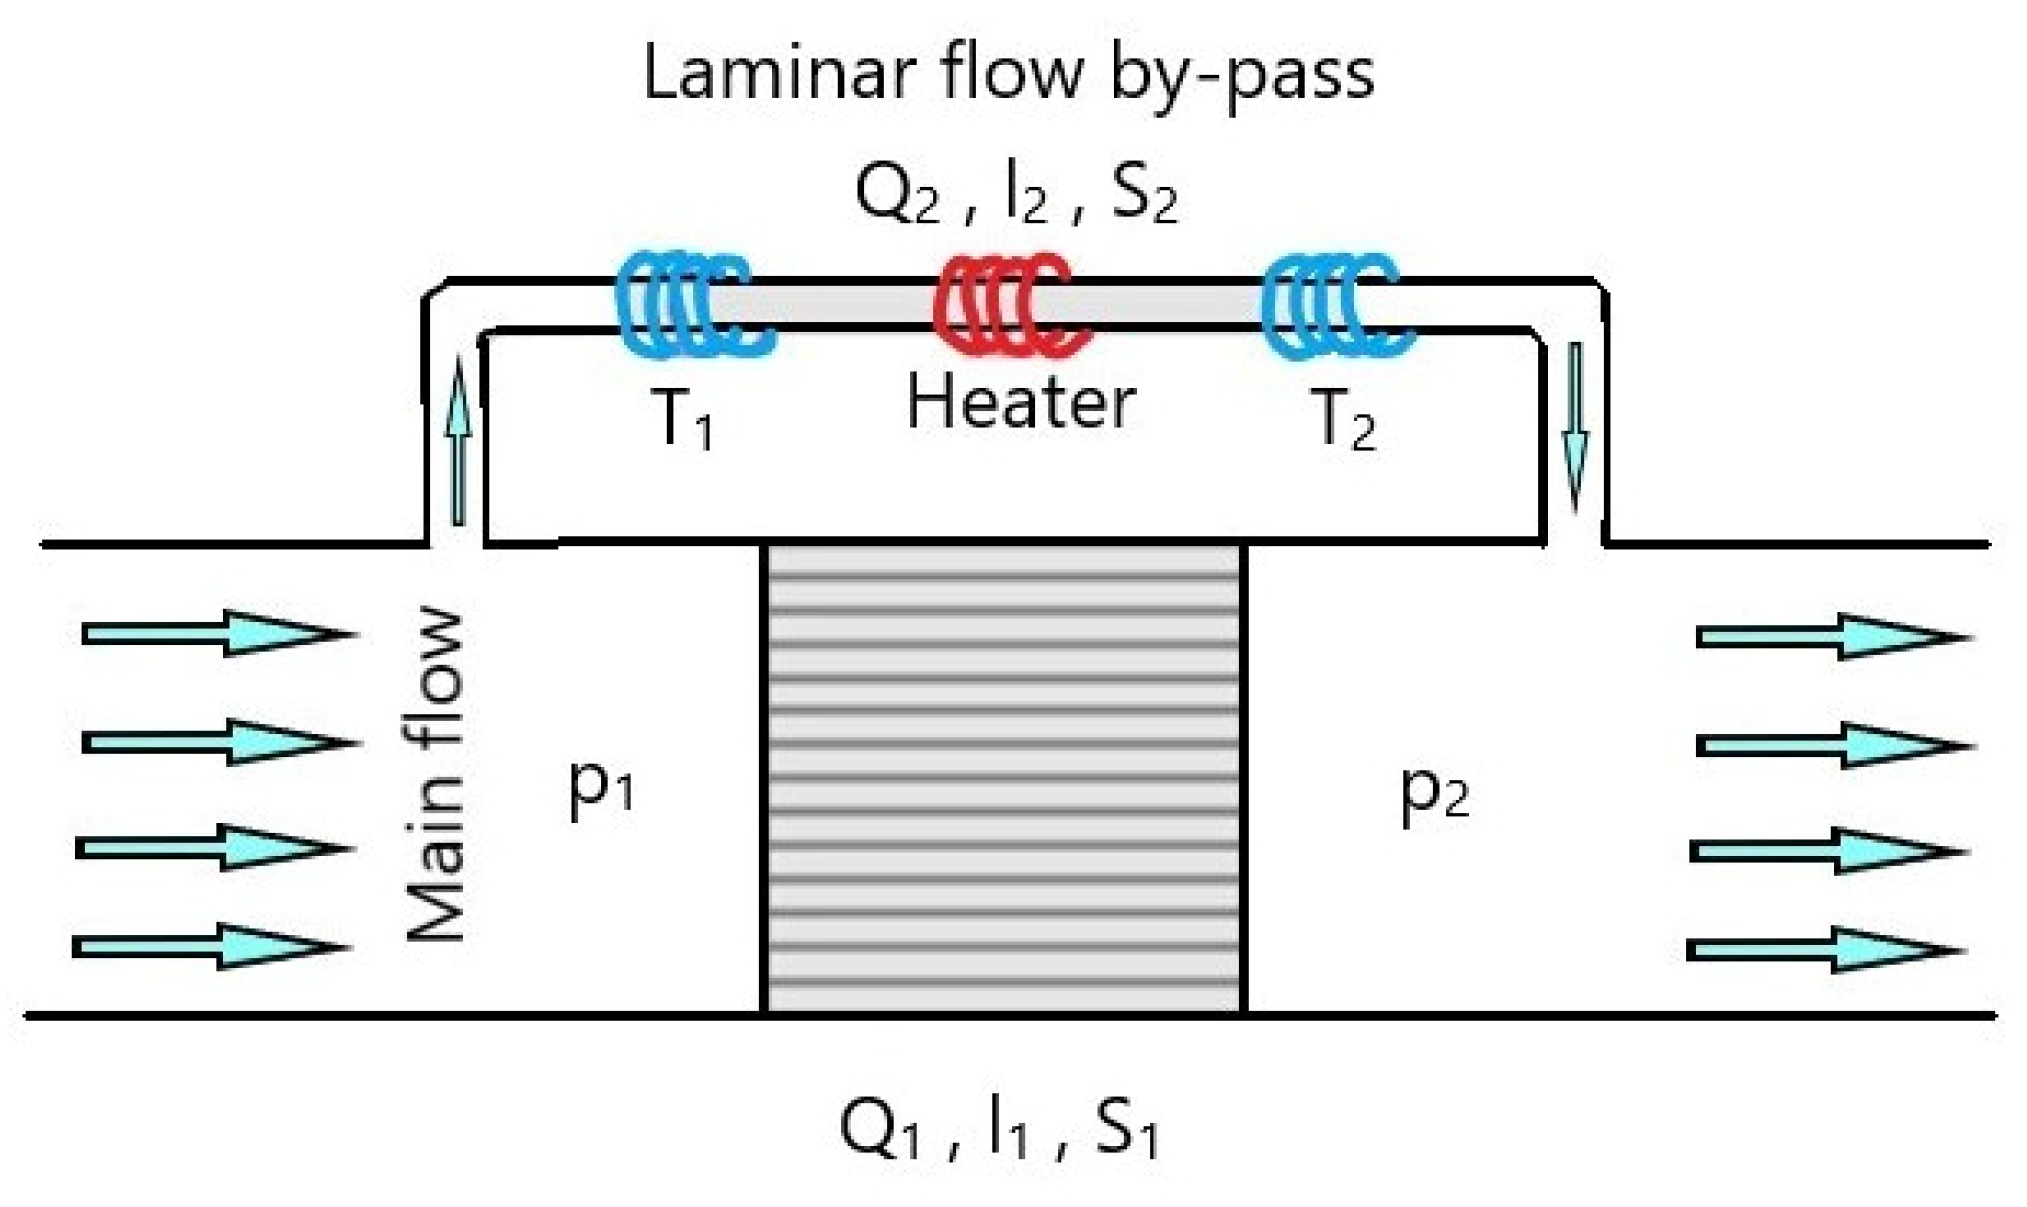
The design of a capillary thermal flow meter (
Figure 1) involves splitting the flow into two parts:
The main flow;
The by-pass flow.
A specific part of the flow is directed through a specially designed capillary (by-pass) tube fitted with a micro-electromechanical system (MEMS). The heater placed between two temperature sensors generates a temperature difference between the sensors by heating the flowing medium. At a zero volume flow through the by-pass (Q2), the temperature (T1) at the first sensor is equal to that (T2) at the second sensor, and a thermal symmetry effect is observed. The increase in the flow rate causes asymmetry of the temperature profile along the heated capillary tube with the parameters: length capillary (l2) and section capillary (S2). Therefore, T2 increases, reaching a higher value than T1. The temperature difference is then proportional to the gas volume flow (Q2) in the capillary tube. The constant ratio between the main flow rate (Q1) and that of the capillary tube (Q2) ensures correct measurement of the gas volume flow.
In actuality, factors including changes in the gas composition, significantly affect the dynamic viscosity, while pressure losses on the flow straightener and flow disturbances (turbulent flow) in the system, are factors that are responsible for changing the ratio between flow in the capillary tube and the flow in the main tube. Therefore, assuming of a constant value of the ratio of the main flow rate to the capillary tube flow for all types of gases may cause considerable measurement errors [
7,
8,
9,
10], which in turn can affect the total unsettled amount of gas (
UAG). These amounts have been taken into account in the gas network balancing equation [
11]. The
UAG amounts are generally understood as the difference between the measured amount of the entered gas and the measured amount of gas delivered to end users, i.e., the difference between that measured amount of gas introduced to the gas system and the amount of gas sold from the system to end users [
12].
Thermal flow meters using thermal dispersion [
13] (
Figure 2) are equipped with two sensors placed in an open “tube”. The first (
T1) measures the medium temperature. The second (
T2) is heated by the supplied electricity to a constant higher temperature than that of the first one. Here, the greater the flow, the more intense the cooling/heating of the sensor. The energy required to hold a constant temperature difference between the sensors is a function of the mass flow. According to ISO 14511 [
6], there are two measurement methods available for that type of a thermal flow meter: by holding either the power or the temperature difference at a constant level. Compared to thermal gas meters using the by-pass for gas measurement, this design is more resistant to gas contamination and humidity [
7,
8].
In recent years, a number of tests of thermal gas meters were carried out to study and verify them most effectively. In the publication [
14], a team of Indian researchers presented the results of their study which involved building two capillary thermal flow meters that they calibrated and then tested for the effects of ambient temperature (20, 25, 32 and 40 °C) and installation position on measurement errors. The influence of the temperatures in the tested range on the accuracy of the thermal gas meters was found to be negligible. Nevertheless, it was demonstrated that the installation position of the thermal gas meters had a significant impact on their measurement errors.
In [
15], the structure of the sensor, the effect of the sensor insertion length and design of its insertion point into the flow pipe were examined, together with the effect of the measurement process conditions on the performance of the mass flow gas meters with thermal dispersion. It was found that the overall effect of the factors analysed on the measurement accuracy of the tested gas meters could amount to as much as 7%. The publication [
16] considers the use of the capillary thermal flow meters for measuring natural gas consumption in households, where the flow rates are extremely low. The results of temperature distribution simulation for different inlet and outlet diameters of the flow meter capillary tube, different lengths and methane flow rates were presented. Based on the presented results, sensitivity increases noticeably with the increase in the capillary tube internal diameter, yet the linearity range of the temperature difference is shortened. The length of the by-pass tube can also have a significant effect on the measuring range of the flow meter (maximum flow rate). Test results demonstrate that shorter sensor tubes are more sensitive to changes in gas flow velocity.
Capillary tube mass flow meters are also considered suitable devices for measuring low flow rates. In publication [
16], their performance was analysed by a comprehensive numerical simulation of heat transfer. The simulation inputs were verified by an accurate numerical analysis of the nitrogen measurement and by comparing the simulation results with the experimental data available in the literature. Simulations were then conducted with the use of methane and high-methane natural gas (94%). The measurement uncertainty in the entire measurement range for the simulation with methane was 1.56%, and for natural gas—1.83%, which proves that the model is correct.
Publication [
8] evaluates the factors affecting thermal gas meters. The authors conducted a study on the influence of gas composition changes on the metrological characteristics of capillary thermal gas meters and thermal dispersion gas meters. The study was carried out with the use of air as the reference medium and with five gas mixtures. The main conclusions from the study are as follows:
Errors of indications of the capillary thermal gas meters considerably exceed the permissible values when the sensor output signal is not adjusted to the gas composition;
The errors of indications of the thermal dispersion gas meters are influenced by flow disturbances, even if they are equipped with flow straighteners;
Changes in gas composition and, in particular, the thermodynamic properties of the measured gas (such as viscosity, density, specific heat), affect the accuracy of the capillary thermal gas meters;
Thermal gas meters with sensors placed in the main flow stream require stringent installation procedures which must be carefully followed to prevent severe flow disturbances.
At the IMEKO Worldwide Conference, Chinese researchers presented the results of a study on the impact of changes in the composition of natural gas on the measurement errors of thermal gas meters [
17]. The tests were performed on two thermal gas meters available on the Chinese market. Six gas mixtures and air (as the reference medium), were selected for the tests. The results allowed for the formulation of the following conclusions:
The maximum value of the measurement error, without the gas composition identification function, was 35.43% for the mixture 3 (CH4 = 79.39%; C2H6 = 9.95%; C3H8 = 3.00%; CO2 = 3.02%; N2 = 4.64%);
After inclusion of the gas composition identification function, the maximum measurement error for the same test mixture amounted to 4.78%;
Although the identification of the gas composition may improve the metrological characteristics of the thermal gas meters, it causes problems related to the increased energy consumption and the need to introduce new correction factors for the composition of the measured gas, thus impeding the widespread use of the thermal gas meters.
“Power to Gas” (P2G) projects have been extremely popular in the recent years in Europe and around the world. Here, attempts are made to use hydrogen as an energy carrier. The access to hydrogen in the environment is almost unlimited. Nevertheless, it is one of the most readily flammable gases. Therefore, its use on a large scale requires extraordinary security measures to be adopted. One of the key features of the P2G technology is the possibility of generating hydrogen in the process of electrolysis powered by electricity from renewable sources (e.g., solar, water or wind energy). Hydrogen derived in that way can then be injected into the natural gas transmission or distribution network. Injecting hydrogen into the gas network is, however, quite challenging due to its physicochemical properties and has been the subject of research on a global scale. Hence, studies are underway to determine the sensitivity of individual components of the gas system to the hydrogen content in natural gas [
18,
19,
20,
21,
22,
23,
24,
25,
26,
27,
28]. Those components include, for example, compressors, piping, gas fittings, pressure control equipment, as well as metering equipment for measuring the amount of gaseous fuel supplied or devices for burning gaseous fuels.
The publication [
18] describes the research on the effect of adding 17% hydrogen to natural gas on diaphragm gas meters (both with leather and synthetic diaphragms), which prove that the errors of indications practically did not change. The initial errors were determined with the use of natural gas, and then successively with natural gas with the addition of 17% hydrogen. Finally, the tests with natural gas alone were repeated. The deviations from the measurement errors were less than 0.1%. According to the studies presented in [
19], for up to 30% hydrogen content in natural gas, no issues related to the materials used in the construction of ultrasonic, diaphragm and turbine gas meters should be expected. These studies also clarify that e diaphragm, turbine and ultrasonic gas meters should be considered insensitive to high hydrogen content in natural gas. Moreover, for up to the hydrogen concentration of 30% in natural gas, no problems can be expected in the (steel) structural materials of the gas networks. The authors of the publication also underline the need to perform tests to determine the measurement accuracy of ultrasonic gas meters in variable gas properties, as well as long-term metrological stability study.
The publication [
20] presents the effects of 100% hydrogen on the metrological properties of turbine, rotary and diaphragm gas meters. In the study, a field stand was used in which the flow was forced with airtight blowers when working with hydrogen. The tests of the diaphragm gas meters were carried out at a pressure of 20 mbar. It was found that after 340 working days of exposure to hydrogen, there was no effect on the metrological characteristics of the tested gas meters. The only issue was that the turbine meter sealing required modification.
The results presented in [
21] demonstrate that there were no operational problems with conventional (diaphragm, rotary, turbine) gas meters up to 10% of hydrogen content in natural gas. Above that value, recalibration and evaluating changes in the design of the flow meters might be required.
However, the authors of [
22] clearly state that the variability of the gas composition, resulting from the injection of gases from renewable sources into the gas system, affects the measurement uncertainty, in particular, where the billing accuracy relies on the thermodynamic properties of the medium. Therefore, in case of billing natural gas with a 10% hydrogen content, measurement errors of up to 7% can be expected in thermal gas meters.
Poland’s Oil and Gas Institute—National Research Institute has, for the longest time, been conducting research on the influence of hydrogen addition to natural gas on the components of gas system in Polish industry. In 2016, tests were carried out to compare various methods for determining the gas compressibility coefficient with an increased hydrogen content in natural gas. Both, the SGERG-88 and AGA8-DC92 methods have application limitations in terms of hydrogen content in natural gas of up to 10% (mol/mol). Nevertheless, the research proved that the AGA8-DC92 method delivers satisfactory results when the content of that component increases up to 40% (mol/mol) [
23]. However, according to study [
24], the maximum hydrogen content that can be added to natural gas in order to meet the regulatory and standard requirements regarding the quality of gaseous fuels (e.g., Wobbe number) delivered to customers in Poland amounts to a maximum of 36% (mol/mol) for gas from LNG regasification, and up to 26% (mol/mol) for group 2E gas.
The publication [
25] describes the results of a study on the effect of hydrogen addition to the group’s natural gas on the performance of selected gas-supplied equipment for domestic and commercial use (cookers, instantaneous water heaters, boilers, fireplaces, radiators, etc.). Based on the studies performed, it can be concluded that the maximum amount of hydrogen that can be added to group 2E natural gas for the resulting mixture to burn safely, without alterations made to the design of the equipment, is about 23% (V/V). Still, for the resulting mixture to burn safely and effectively, no more than 15% (V/V) hydrogen should be added. Those studies were crucial for the research that followed at the Oil and Gas Institute-National Research Institute. Guidelines for further research on the effects of hydrogen addition to natural gas on components of the gas system were defined based on it. The value of 15% hydrogen addition was assumed as the maximum in further studies. The following projects involved tests aimed at establishing whether the addition of hydrogen to natural gas will have an impact on the operational safety of medium gas pressure reducers and the safety and metrological stability of diaphragm gas meters. New as well as used meters removed from the gas network after approximately ten years of operation were tested. Based on the research carried out so far, it can be concluded that the mixture of natural gas with a 15% hydrogen addition has no negative impact on the tested gas meters and reducers [
26].
The publication [
27] describes the methods of testing the durability of the diaphragm gas meters, the inputs, test benches used, and the exemplary results of testing the durability and external tightness of the meters. Based on the results obtained, metrological and statistical analyses were performed to establish whether the addition of hydrogen affects the durability of gas meters. For the gas meters tested, no significant metrological difference was found between the average errors of indications after the durability test using natural gas mixtures with different hydrogen content (from 0% to 15%). In contrast, significant impact in the long-term operation of gas meters on their metrological properties (errors of indications) was discovered, but it should be related to the wear of the gas meter internal parts as a result of long-term use, rather than to the hydrogen content in the gas mixture. No damage was found that would pose a threat to the operational safety. The gas meters tested remained tight during and after the durability tests.
The issue of changes in the physicochemical parameters of natural gas after mixing with hydrogen is also discussed in [
28]. The authors point out that the addition of hydrogen to natural gas can have a positive effect on the gas transmission conditions, since the transmission distance can be increased due to the pressure drop. It is also noted that the hydrogen content cannot exceed 15–20%, as higher figures will result in a decrease in the heat of combustion of the gas below the permissible value and, consequently natural gas might not meet the quality standards.
The carried out literature analysis shows that thermal gas meters were tested with the aim to determine the impact of a number of factors (e.g., gas pollutants, gas humidity, ambient temperature, assembling orientation, sensor design, gas speed, or changes of gas composition with respect to hydrocarbon components content) on their metrological properties. However, so far, no studies have been carried out on the impact of natural gas composition, resulting from the hydrogen addition, on metrological characteristics of such gas meters. This issue is particularly important in the context of potential hydrogen addition to the natural gas network. All parties to gas settlements, both gas sellers, distribution system operators, consumers, and appropriate State Authorities, should be sure that the settlements will be carried out precisely and safely. Moreover, studies on the ambient temperature impact on the accuracy of thermal gas meters indications were carried out so far in relatively narrow ranges, from 20 to 40 °C, which for many countries featuring wider ambient temperature ranges and the tradition of gas meters installation outside houses, may be insufficient. Therefore the authors made an attempt to determine the impact of both natural gas composition changes caused by the hydrogen addition, as well as of extreme ambient temperatures, characteristic of the climate of Poland and of many other countries, on metrological characteristics of thermal gas meters.
2. Materials and Methods
As part of the research, the influence of changes in the composition of natural gas due to hydrogen addition on the errors of indications of thermal gas meters was studied. The validity of the calibration of thermal gas meters intended for measuring natural gas with air was also tested. Moreover, the influence of ambient and gas temperature (−25 °C and 55 °C, respectively) on metrological characteristics (errors of indications) of thermal gas meters was studied.
2.1. Gas Meters Used in the Research
Upon analysing the technical documentation of thermal gas meters available on the Polish market, the meters of one manufacturer were selected for tests. The choice was also affected by parallel tests of the durability of diaphragm and thermal gas meters with regard to the use of natural gas with hydrogen addition, in which thermal gas meters of the same type were tested [
26,
27]. It is our view that research using gas meters with the same specifications delivers more comprehensive knowledge of the changes in their metrological properties.
Specifications of the gas meters tested:
Nominal size: G4;
Minimum flow rate Qmin: 0.04 m3/h;
Maximum flow rate Qmax: 6.0 m3/h;
Ambient and gas temperature range: –25 to 55 °C;
Accuracy class: 1.5;
Communication protocol: Radio/M-Bus;
Temperature correction: yes;
Type of approval: Metering Instrument Directive (MID).
The gas meters in question use a semiconductor Complementary Metal-Oxide-Semiconductor (CMOS) sensor placed in the by-pass tube. The measuring system is based on a microthermal measuring principle and comprises a heating element with two temperature sensors. The heater, heating the gas flowing through the by-pass, generates the temperature difference measured by the sensors, which is directly proportional to the mass flow rate.
The resulting measuring signal is converted by a microprocessor into volume flow and the volume. Moreover, the gas meters selected for testing have temperature correction, i.e., they convert the measured gas volume from the measuring to standard conditions (0 °C, 1013.25 mbar). According to the manufacturer data, the gas meters are designed to assess air, nitrogen and 2E gases (group E of the second family) in accordance with EN 437 [
29]. In addition, the manufacturer allows the measurement of 2E gas with a maximum of 5% hydrogen content (H
2 ≤ 5%). The gas meters do not support error curve calibration based on the calorific value of the gas.
2.2. Inputs of the Study
The level of hydrogen content in mixtures with 2E natural gas, which were used to determine the metrological characteristics of thermal gas meters, had to be determined before commencing the research. When determining the hydrogen content in mixtures with natural gas, the following aspects were taken into account:
Quantities of 2%, 4% and 5% of hydrogen addition in the test mixture—this results from the specifications of the gas meters in question, where 5% of hydrogen is the maximum value allowed by the manufacturer;
Amounts of 10% and 15% hydrogen in the test mixture results from the research strategy adopted by the Oil and Gas Institute-National Research Institute on the basis of the research work carried out so far [
26,
27].
The test with the use of gas mixtures containing 10% and 15% hydrogen, although they exceed the manufacturer’s limit values, was aimed at a preliminary verification of the suitability of that type of gas meter for billing natural gas with a higher hydrogen content when the P2G projects are implemented in the Polish gas industry.
During the tests, errors of indications were determined based on the test methodology provided in EN 1359:1998 [
30] and EN 1359:2017 [
31] for the gas meter flow rates 0.1
Qmax; 0.2
Qmax; 0.4
Qmax; 0.7
Qmax;
Qmax (3 repetitions in each of the flow rates). The error of indication is the value defined as the ratio of the difference between the gas volume indicated by the gas meter and the volume of gas that has actually flowed through the meter to the latter volume, expressed as a percentage [
30]. The testing methodology, the sequence of tests performed and the gas mixtures employed are described in
Table 1. The initial errors of indications
E0 using air were determined at first.
Gas meters used for billing gas volumes in households or industrial plants are installed not only indoors, but also outside buildings where they are exposed to fluctuations in ambient and gas temperatures, even in the range from ‒25 to 55 °C [
32]. The authors indicate that the diaphragm gas meters for billing households are effective heat exchangers and that the ambient temperature affects the internal components of the gas meters. Hence, errors of indications of the diaphragm gas meters may largely depend on the ambient and gas temperature.
Therefore, the tests also include checking the errors of indications in the ambient and gas temperature range declared by the manufacturer (‒25 to 55 °C), in accordance with the test methodology set out in EN 1359:1998 [
30] and EN 1359:1998/A1:2006 [
33]. The errors of indications of gas meters were determined for the flow rates of 0.1
Qmax; 0.2
Qmax; 0.4
Qmax; 0.7
Qmax;
Qmax (3 repetitions for each of the flow rates). The sequence of tests and test conditions are presented in
Table 2.
2.3. Test Bench for Determining Errors of Indications of Thermal Gas Meters with the Use of Gases of Different Composition
The test bench (
Figure 3) works in a loop cycle with a continuous supply of gas mixture (test medium) and release of the gas. The volume flow of the test medium is forced by means of an explosion-proof Ex blower. The volume flow was adjusted with an accuracy of ±5% by controlling the blower speed and valve settings. In order to ensure the proper composition of the gas mixture, the test bench is continuously supplied (at the blower inlet) with gas with an overpressure of ca. 20 mbar, prepared in a multi-component gas mixing plant. The test medium was released (at approx. 600 dm
3/h) downstream the tested gas meters and the reference meter, and it was burnt with a gas burner or a cooker. The composition of the gas used in the test bench, after each change of the test mixture, was verified in a chromatographic analysis performed by the accredited Laboratory of Analytical and Physical Chemistry of Hydrocarbon Fuels at the Oil and Gas Institute-National Research Institute. The test bench also includes an inlet of fresh air from the laboratory, used for purging (cleaning) the system before each change of the test mixture. Moreover, this is employed to supply the bench with the test medium during the tests using air.
During the tests, the parameters of the gas test medium and the environment are measured, i.e., the gas temperature of the meters tested, gas temperature of the reference gas meter, as well as the ambient temperature. To this end, intrinsically safe Pt100 sensors are used, together with a recorder, ensuring continuous reading and recording of gas parameters (uncertainty of temperature measurement ±0.1 °C). The atmospheric pressure is measured with a digital barometer, and the overpressure in the tested gas meters and the reference meter is measured with digital pressure gauges (also in Ex version) (uncertainty of pressure measurement ±0.135 mbar). In order to take into account the differences between the thermodynamic conditions in the tested and reference gas meters, the gas pressure and temperature values are reduced to common conditions.
The critical component of the test bench is the reference gas meter that has to be selected bearing in mind the measurement accuracy when working with various test mixtures, in particular, natural gas containing hydrogen. Furthermore, the reference gas meter has to meet operational safety requirements. The test bench, designed according to the authors’ guidelines, uses a rotary gas meter size G16 (
Qmin = 0.5 m
3/h,
Qmax = 25 m
3/h), provided with seals suitable to the medium containing hydrogen. The reference gas meter is shown in
Figure 4.
The reference gas meter, after being tested and calibrated by the manufacturer, was calibrated with air at the SG17 test bench (calibration uncertainty ±0.28%), which is part of the Calibration Laboratory of the Oil and Gas Institute—National Research Institute (PCA Accreditation Certificate No. AP 152). The error curve of the reference gas meter indications was determined from the results obtained.
Based on the authors’ experience, as well as a literature review [
34], additional tests were carried out to determine the impact of disturbances in the test medium velocity profile on the errors of indications of the thermal gas meters. The reference gas meter with or without pulsation dampers was first installed both upstream and downstream of the tested meters. As a result of preliminary testing, the reference gas meter without dampers was placed downstream of the thermal gas meters in order to exclude disturbances induced by its rotors that might affect the tested thermal gas meters. Their metrological characteristics were then successively determined. Flexible hoses were used to make connections between the blower, the reference gas meter and the tested gas meters. These also act as mechanical vibration compensators. Moreover, the test bench is composed of a number of other elements, including flexible stainless-steel pipes dedicated to natural gas containing hydrogen, PE piping, steel pipes and fittings, as well as shut-off and control valves.
The test bench was located in a conditioned room, where the ambient temperature is held between 19 and 23 °C. The calibration and measurement capability (CMC) (the lowest measurement uncertainty the laboratory is able the achieve in the course of routine testing) measurement uncertainty of the measuring station is within ±0.28%.
2.4. The Bench for Testing the Effect of Ambient and Gas Temperature on the Errors of Indications of Thermal Gas Meter
The gas meter errors of indications in the declared range of ambient and gas temperature (−25 to 55 °C) were determined on the test bench designed for testing the influence of ambient and gas temperature on the metrological properties of household and industrial gas meters (diaphragm, ultrasonic, smart meters, etc.). The bench is a part of the accredited Laboratory of Flow Metrology of the Oil and Gas Institute—National Research Institute (PCA Accreditation Certificate No. AB 041).
The layout of the test bench is shown in
Figure 5. The main components of the bench include:
A gas drying unit to a dew point temperature of approx. −50 °C;
An assembly of reference drum gas meters with a measuring range of 0.015 to 17 m3/h;
A thermal chamber with a temperature range from −70 to 180 °C;
Set of transducers and measuring sensors;
A computer controller with the test bench control software.
The test bench is located in a conditioned room, where the ambient temperature is held between 15 and 25 °C. The CMC measurement uncertainty of the measuring station is within ±0.18%.
While determining the errors of indications, the ambient temperature is maintained with the accuracy of ±1 °C in the thermal chamber. The reference gas meter is supplied with pre-dried air from the central compressed air system at the temperature 20 ± 3 °C applied in the laboratory which, after flowing through the pressure regulator, reaches the values of 1.5 ± 0.15 kPa. The heat exchanger is placed in the thermal chamber, through which the supplied air flows, so that the temperature of the air flowing into the gas meters is the same as the ambient temperature in the chamber. Determination of the gas meter errors of indications at a given temperature consists in setting the required temperature value in the chamber and effecting temperature stabilisation of the gas meters. The temperature in the chamber with the tested sample is stabilised until both the required value within the working section of the temperature chamber, as well as the temperature of the gas flowing through the tested gas meter are reached. Nevertheless, stabilisation cannot take less than 4 h. The temperature chamber temperature in the immediate vicinity of the tested gas meter and the temperature of the medium flowing through its ports are measured. The tests begin with a declared negative ambient temperature (−25 °C). After temperature stabilisation, the measurements are started by setting the appropriate flow rate and air quantity that the tested gas meter is to measure. The flowing air volume is measured continuously, thus eliminating the temperature fluctuations.
In the following step, at the same ambient and gas temperature as above, the volume flow Qmax of the meter is passed through the tested gas meter for 22 h, and then the determination of the gas meter errors of indications begin. The errors of indications at the declared positive temperature (55 °C) are then determined in the same way as for the negative temperature.
During the tests, the parameters of the measured air dose and the ambient parameters are measured, i.e., air gas temperature of the meters tested, air temperature of the reference gas meter, as well as the ambient temperature of the meters. To this end, Pt100 sensors with measuring transducers are used. The measurement of atmospheric pressure and overpressure in the tested gas meters and the reference gas meter is performed with pressure transmitters. Electric signals from the pressure- and temperature-measuring transducers and from impulse transmitters of the tested and reference gas meters are processed in a computer controller supported by special software. In order to take into account the differences between the thermodynamic conditions in the tested and reference gas meters, the gas pressure and temperature values are reduced to common conditions. The test bench allows for testing simultaneously from one to six gas meters of the same size and with the same flow rates Qmin and Qmax.
3. Results
Table 3 presents the results of testing errors of indications (
E) of four thermal gas meters (serial numbers 42089119, 42089121, 42089125 and 42089126), determined using all gas mixtures specified in
Table 1 (air, 2EH0, 2E/H2, 2E/H5, 2E/H10 and 2E/H15). The errors of indications were determined with the use of air, natural gas without the addition of hydrogen, and natural gas with the addition of hydrogen (2%, 4%, 5%, 10% and 15%), in the sequence presented in
Table 1. The results that do not meet the maximum permissible error (
MPE) requirements are marked with red font. The errors of indications using air are considered as reference values. The uncertainty of the measurements while determining the errors of indications is ±0.4 ÷ 0.82%, in the range of flow rates from 0.1
Qmax to
Qmax.
Figure 6 presents the results of the tests of the initial errors of indications (
E0) and average initial errors of indications (
Em0), errors of indications (
E) and average initial errors of indications (
Em), along with the confidence interval (
u), of 4 thermal gas meters (serial numbers 42089119, 42089121, 42089125 and 42089126), determined using air and natural gas without hydrogen (2E/H0), respectively, as a function of the relative flow rate (
Q/Qmax).
Figure 7, however, presents the average initial errors of indications (
Em0) and average errors of indications (
Em), along with the confidence interval (
u), of four thermal gas meters determined with the use of all test mixtures, as a function of the relative flow rate (
Q/Qmax).
Figure 8 shows the average drift of the errors of indications (
Em) between the average errors of indications (
Em) determined with the use of individual test mixtures and the average initial errors determined with the use of air.
Initial errors of indications (
E0), errors of indications (
E), average initial errors of indications (
Em0) and average errors of indications (
Em) together with the confidence interval (
u) of thermal gas meters (serial numbers 42089119, 42089121, 42089125 and 42089126) adjudged at the ambient and gas temperature of −25 °C and 55 °C, respectively, are shown in
Table 4,
Figure 8 and
Figure 9. The errors of indications were determined with the use of air for individual test variants given in
Table 2. The uncertainty of the measurements while assessing the errors of indications is ±0.20 ÷ 0.50% in the range of flow rates from 0.1
Qmax to
Qmax.
Figure 10 presents the average drift of the errors of indications (
Em) between the average errors of indications (
Em) in the subsequent stages of temperature tests (−25 °C, −25 °C/22 h, 55 °C and 55 °C/22 h) and the average initial errors determined at 20 °C (
Em0).
4. Discussion
For the evaluation of gas meter errors of indications (
Table 3), determined for various gas mixtures, three evaluation criteria were used. The first criterion embraced is normative, yet due to the lack of a respective standard for thermal gas meters, the requirement was adopted as for the diaphragm gas meters according to EN 1359:1998 [
30], EN 1359:1998/A1:2006 [
33] and EN 1359:2017 [
31]; therefore, the values of gas meter errors of indications, determined with the use of individual gas mixtures, should be within the initial maximum permissible errors (
MPE), given in
Table 5.
The second criterion taken on results from the requirements of Art. 5.4 OIML Recommendations R 137—1 & 2 [
36] and refers to the weighted mean error (
WME):
The third criterion adopted is the metrological one, which evaluates the nature and size of the shift of individual curves of errors of indications in relation to the reference curve, i.e., determined with the use of air.
According to the analysis of the study results presented in
Table 3, the
MPE requirements were met for both air and natural gas (2E/H0). The difference between the average error values ranges from −0.44% to 0.54%, which points out to a certain potential of calibrating with air of thermal gas meters designed to measure Group 2E natural gas.
In the case of gas mixtures containing 2% and 5% hydrogen, the readings of individual gas meters were also within the MPE limits. In the case of a 4% hydrogen addition, the MPE values were exceeded to a small extent (0.23% and 0.69%) and only for two gas meters and only for one flow rate, i.e., 0.2 Qmax. In the range of up to a 5% of hydrogen addition, the most considerable impact of changes in gas composition on the errors of indications was observed in relation to the sample (2E/H4), with regard to the flow rates 0.1 Qmax and 0.2 Qmax, where the maximum change in relation to the initial errors (Air) amounted to 2.49%. For the same flow rates, the difference in errors obtained for air and natural gas with a 5% hydrogen addition (2E/H5) was only 1.06%. In case of gas mixtures containing 10% and 15% of hydrogen, the errors of indications of individual gas meters exceeded the MPE values. During the tests with natural gas with 10% and 15% hydrogen content, the errors of indications of all gas meters significantly shifted into the zone of negative errors, reaching the maximum value of −10.41%. The difference between the average error values for the use of natural gas with 15% hydrogen (2E/H15) and air, ranges from −6.81% at Qmax to −10.05% at 0.1 Qmax.
Changes in the chemical composition of the gas mixtures used alter their thermodynamic properties, e.g., thermal conductivity, density, specific heat or dynamic viscosity. A change in the dynamic viscosity of gas causes a change in the Reynolds number and the ratio of the main flow rate to the flow velocity through the capillary tube in a gas meter affecting the output of the measuring instrument. Thus, changes the metrological properties of the thermal gas meter are seen as a change in its errors of indications [
8].
The scope of thermo-dynamic property changes applied in gas mixture tests was shown in
Figure 11 and
Figure 12. Adding hydrogen to natural gas resulted in a decrease in its density by 13.27% in the case of the 2E/H15 mixture. Moreover, adding hydrogen to natural gas caused the specific heat to increase by 11.88%, and the volumetric heat capacity to decrease by 2.96% in the case of the 2E/H15 mixture.
Table 6 shows the weighted mean errors (
WME) determined for the tested gas meters with the use of all gas mixtures.
WME is also shown in
Figure 13. The
WME calculations were made according to OIML R 137—1 & 2.
Pursuant to art. 5.4 OIML R 137—1 & 2, the weighted mean error (
WME) for class 1.5 gas meters should be within ±0.6%. Analysing the calculated values presented in
Table 6, it can be concluded that the requirements for
WME were met with regard to the results obtained with both, air and natural gas with the addition of 2% hydrogen (2E/H2). With regard to the gas mixture without the addition of hydrogen (2E/H0), a slight increase in
WME (from 0.17% to 0.36%) was observed in relation to the values determined with the use of air. This exceeded the permissible value. The increase in the
WME value beyond the permissible limit results from the change in the physicochemical properties of the medium, but it should be noted that if the gas meters had been initially adjusted during the verification so as to ensure lower
WME values for air, the
WME would not have been exceeded for natural gas. It should also be understood that the highest share in the
WME value is attributed to indication errors determined at large volume flows, i.e., 0.4
Qmax, 0.7
Qmax and
Qmax, for which the weight value flows, used to calculated the weighted mean value are 0.4, 0.7 and 0.4, respectively. For the volume flows 0.1
Qmax and 0.2
Qmax, the weights are smaller and are 0.1 and 0.2, respectively. Furthermore, indication errors determined using natural gas (2E/H0), in the range from 0.4
Qmax to
Qmax fall within the area of positive errors, above the errors determined using air (for example, at
Qmax, the value
Em = 1.24%). Whereas the indication errors determined using the 2E/H2 mixture shifted primarily below the errors determined using air.
For gas mixtures containing 4%, 5%, 10% and 15% hydrogen, the WME requirements were exceeded. In the first and second case, a slight increase in WME is observed in relation to natural gas without the addition of hydrogen. For the 10% and 15% hydrogen addition, there is a significant increase in the WME value and its sign changes from positive to negative.
The errors of the indications of the thermal gas meters determined at the ambient and gas temperature of −25 °C and 55 °C, respectively, presented in
Table 4, as with the previously discussed test results obtained with the use of various gas mixtures, were assessed using two criteria. The first criterion adopted is normative, yet due to the lack of a respective standard for thermal gas meters, the requirement was adopted as for the diaphragm gas meters according to EN 1359:1998 and EN 1359:2004/A1, therefore:
The values of gas meter errors of indication, determined at ambient and gas temperatures (−25 °C and 55 °C, respectively) after temperature stabilisation, should be within the initial permissible maximum error (
MPE) given in
Table 5.
The values of gas meter errors of indications, determined at ambient and gas temperatures (−25 °C and 55 °C, respectively) after 22 h of gas meter operation at the
Qmax flow rate, should be within the
MPE range during the durability tests presented in
Table 5.
Another criterion adopted is the metrological one, which evaluates the nature and size of the shift of individual curves of errors of indications in relation to the reference curve, i.e., determined at 20 °C.
With regard to the analysis of the study results presented in
Table 4, the
MPE requirements were met for all results obtained at 55 °C (sample 55 °C and 55 °C/22 h). The results of tests at −25 °C (sample −25 °C and −25 °C/22 h) also meet the requirements of
MPE.
According to the analysis of the results obtained, both the temperature 55 °C and −25 °C caused, in most cases, the shift of individual errors in the indications towards negative errors. The exceptions are the results corresponding to the temperature −25 °C at the flow rate
Qmax, and some of the results at 0.1
Qmax. The average drift of the errors of indications
EmT (
Figure 9), in relation to the series −25 °C/22 h, for
Qmax equal to 0.63%. It should be noted that, taking into account both the accuracy class equal to 1.5 and the
MPE values (±3.5% and ±7.0%), those values are low in the metrological sense. A slight difference was noticed between the results of the errors of indications obtained at the temperature −25 °C after achieving temperature stabilisation and after 22 h of operation at
Qmax, which indicates that the operation time of the gas meters at that temperature does not change the errors of the tested gas meters.
The positive temperature of 55 °C caused a shift of the errors of indications towards the negative values, while the greater shifts are true for the 55 °C series after temperature stabilisation. An average drift of the errors of indications
EmT (
Figure 9), in relation to the series at 55 °C, was from −0.27% at 0.2
Qmax, to −1.12% at
Qmax. However, the average drift of the errors of indications
EmT, in relation to the series at 55 °C/22 h, was from −0.51% at 0.1
Qmax, to −1.15% at
Qmax. Such drift should also be considered as minor, which indicates that the metrological properties of the tested thermal gas meters are only slightly dependent on the ambient and gas temperature. Using them for billing measurements will not involve significant errors of indications, and thus will not significantly increase the
UAG.


