Abstract
We present the concept of a novel thermal power plant process in conjunction with low-temperature selective catalytic reduction (SCR). This process can be employed to achieve modern standards for NOx emissions and solve problems related to post-gas cleaning processes, such as thermal fatigue, catalyst damage, and an increase in differential pressure in the boiler. Therefore, this study is aimed at evaluating the performance of a novel flue-gas cleaning process for use in a thermal power plant, where a low-temperature SCR is implemented, along with the existing SCR. We developed a process model for a large-scale power plant, in which the thermal power plant was divided into a series of heat exchanger block models. The mass and energy balances were solved by considering the heat transfer interaction between the hot and cold sides to obtain the properties of each material flow. Using the process model, we performed a simulation of the new process. New optimal operating conditions were derived, and the effects that the new facilities have on the existing process were evaluated. The results show that the new process is feasible in terms of operating stability and cost, as well as showing an increase in the boiler thermal efficiency of up to 1.3%.
1. Introduction
Power generation systems using fossil fuels have played an important role in producing electricity, despite a recent rapid increase in the share of energy produced by renewable sources. The flue gas generated by combustion in a thermal power generation system contains nitrogen oxides (NOx). Nitrogen oxides are the main contributors to air pollution, such as acid rain, building corrosion, soil and water pollution [1], and pollutants that threaten human health [2]. Therefore, NOx must be removed from the system before discharge from the stack. Among the sources that generate NOx, the percentage generated by fossil fuel combustion in the United States and Europe is 54.6% and 20%, respectively, which are relatively high values [3]. Therefore, in a coal-fired power plant system, two methods are used to remove nitrogen oxides in the flue gas. The first is using a low NOx burner as a primary removal technology, where NOx formation is prevented by controlling the oxygen concentration and flame temperature in the combustion zone of the furnace. As per the second method, selective non-catalytic reduction (SNCR) involves a reducing agent, such as ammonia, which is sprayed into the flue gas stream to reduce NOx. Meanwhile, selective catalytic reduction (SCR) uses a catalyst to reduce NOx [4]. As the SNCR method does not have a high NOx reduction efficiency, the low NOx burner method and SCR are applied simultaneously in large boilers.
SCR technology has been widely developed and used owing to its efficiency and selectivity, showing the best reduction efficiency for NOx at approximately 300–400 °C [5,6]. As shown in Figure 1, SCR can be installed at the exit of the boiler system to conform to the optimum operating temperature. When SCR is installed at the front of the flue gas desulfurization (FGD) unit, problems occur with thermal fatigue of the catalyst and increases in the differential pressure of the boiler due to changes in the operating conditions. In addition, the catalyst may be damaged due to the deterioration of the quality of the coal [7]. Meanwhile, when installing the SCR unit at the rear of the FGD unit, as the desulfurization process is a wet reaction, there is a significant decrease in the temperature of the flue gas [6,8]. Accordingly, achieving the optimal SCR operating temperature requires an additional heat source to heat the flue gas, which increases the operating costs. Moreover, NOx emissions regulations are gradually becoming stricter and reinforced worldwide. Table 1 lists the current emissions standards for NOx from power plants in several countries [9,10]. In particular, the emissions standards for NOx emissions in Korea have recently been restricted to under 15 ppm, which is an aggressive standard compared with other countries. To conform to this regulation, previous studies have widely considered adding one more catalyst layer to the existing SCR unit [11]. However, there are growing concerns with respect to the operational stability, such as problems associated with broken catalysts and increases in differential pressure, which may be caused by the deterioration of the quality of the coal introduced to the plants due to supply issues. We must develop a low-temperature SCR that can be installed at the rear of the FGD unit to solve these problems and conform to enforced pollutant regulations. Low-temperature SCR technology has recently attracted increasing attention due to its potential capacity to reduce NOx emission from power plants [12]. Several studies have been performed to design catalysts with excellent low-temperature activity for low-temperature SCR, such as MnOx-TiO2 [13,14,15], CuTiO2 [16,17], and Cu-zeolites [18,19,20,21,22]. Wang et al. [12] reported a comprehensive mechanism describing the formation, deposition, and reaction of NH4HSO4 on a V2O5/TiO2 catalyst for applying low-temperature SCR. Previous studies have focused on a low-temperature catalyst that has an optimal operating temperature of 150–200 °C [8,11,23,24]. Therefore, no additional fuel consumption should be required to increase the temperature of the flue gas at the rear of the FGD.
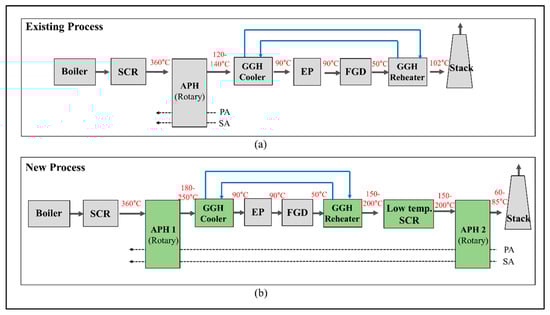
Figure 1.
Schematic diagram of the new process for a coal-fired power plant with a low-temperature selective catalytic reduction (SCR): (a) existing process and (b) new process.

Table 1.
Reinforced emissions standards for NOx from power plants in Korea compared with other countries. (* The ppm limits have been converted into mg/m3 under the assumption that 1 ppm = molecular weight of NO + NO2 (46.01 g/mol) divided by a constant (22.41), that is, ppm × 2.05 [9].)
To use low-temperature SCR, the existing flue gas treatment system, with only the high-temperature SCR, must be modified to enable the optimum operating temperature of each component. Figure 1 shows the process diagrams of the existing and new flue gas treatment systems with low-temperature SCR in the latter case. In a general boiler system, the exit temperature of the boiler system is ~300–400 °C, which satisfies the operating range of the high-temperature SCR. However, in a low-temperature SCR unit, there is a risk of damaging the catalyst when exposed to these high temperatures and a problem associated with the NOx reduction rate when the temperature is too low [7,25]. Therefore, the inlet flue gas temperature of the low-temperature SCR should be controlled in the range of 150 to 200 °C to obtain economic efficiency and NOx reduction. As shown in the existing process in Figure 1a, the flue gas that passes through the SCR heats the air in the air preheater (APH) and is discharged with a temperature of 120–140 °C. The cooler of the gas–gas heater (GGH_C) cools the discharged flue gas from the APH to 90 °C, which is the optimum operating temperature of the FGD. The cooled flue gas undergoes a desulfurization reaction in the FGD. The amount of heat in the flue gas decreases due to the wet reaction, and the flue gas is discharged at 50 °C. For even dispersion of the flue gas from the stack into the atmosphere, the flue gas discharged from the FGD is reheated to ~100 °C in the reheater of the gas–gas heater (GGH_R). Water is used as a heat source for the GGH_C and GGH_R, where the water circulates between these two heat exchanger systems. The water in the existing process cools and heats the flue gas at a temperature difference of ~50 °C in the GGH_C and the GGH_R.
In the new process shown in Figure 1b, a low-temperature SCR is installed at the exit of the FGD, along with the existing high-temperature SCR. The capacity of the GGH_R must be increased to support the 150–200 °C optimum operating temperature of the low-temperature SCR. Therefore, to heat the flue gas from 50 to 200 °C in the GGH_R, we must increase the heat capacity of the water in the GGH. More heat should be transferred to the waterside of the GGH than in the existing process, such that reducing the amount of the heat transferred to the airside in the APH 1 (Figure 1b) sufficiently secures the required amount of heat. Therefore, in the existing process, the exit temperature of the flue gas from the APH is 120–140 °C, while, for the new process, it increases to 180–250 °C. The flue gas from APH 1 is cooled from 180 to 250 °C to 90 °C in the GGH_C such that more heat is transferred to the water in the GGH_C. Meanwhile, the installation of an additional APH 2 at the rear of the post flue gas flow system provides an insufficient supply of heat to the airside. As a result, the new process recovers more heat from the flue gas discharged to the stack than the existing process and a decrease in the exit temperature of gas from the stack. This leads to an increase in the thermal efficiency of the boiler.
As mentioned above, since changing the post-gas flow system is compulsory to support the use of low-temperature SCR, it is essential to evaluate the feasibility of the new process by showing that the operating data from the GGH and APH systems conform to the optimum operating temperature range of each component. In addition, the impacts of the new process on existing equipment should be evaluated. However, there has been a focus on experimental studies to achieve optimum efficiency of low-temperature catalysts. As a result, there is no predictive performance model for process simulation of a large-scale thermal power plant with the application of low-temperature SCR. The objective of this study is to confirm the feasibility of the new process and propose new optimal performance values for the post-gas flow system based on various operating conditions from the predictive performance model. We evaluate the effects that the new facilities have on the existing process, as well as demonstrate the effectiveness of the new process via improved boiler thermal efficiency. This paper presents performance models for the existing and new processes for an 870 MWe supercritical pulverized coal-fired power plant. The performance model consists of a boiler system model and a post-gas flow system model. The proposed model is a lumped parameter model, where the power plant is divided into several heat exchanger blocks, with 0-dimensional material flow. Each heat exchanger block is integrated into the material, heat flow, and heat transfer [26]. In the boiler system, the flue gas flow and supercritical steam flow are integrated via heat transfer, whereas, in the post-gas flow system, the flue gas is integrated with the air and water flows via heat transfer. The mass and energy balances are applied to obtain the flow properties in each heat exchanger block, which are solved by considering the heat transfer mechanism between the hot and cold sides. For simulations under the various operating conditions, we perform the process analysis based on five load conditions.
In this paper, we simulate the performance of the existing process based on various load conditions, followed by a comparison of the simulation results with the design data for the model verification. We suggest several main considerations for modeling the new process and a methodology for deriving the new operating conditions. Operating conditions for the new process, for each load, were derived through an analysis, followed by an evaluation of the impact of the new process facility via comparisons with the existing process. In addition, we present and analyze the improved boiler thermal efficiency that characterizes the new process.
2. Model Descriptions for the Process Analysis
2.1. Target Power Plant
A supercritical pulverized coal-fired power plant was selected as the target plant for the process analysis. Table 2 summarizes the main operating conditions of the target plant at the boiler maximum continuous rating (BMCR) load condition. The plant capacity is 870 MWe, and the boiler is operated at supercritical pressure. The main steam conditions are 2664 t/h, 25.4 MPa, at 569 °C while the reheat steam conditions are 2174 t/h, 4.5 MPa, and 596 °C. The boiler heat duty is 1944 MW and the fuel flow rate is 97.9 kg/s, with an excess air ratio (EAR) of 1.2. The temperature at the boiler exit is 360 °C, and the inlet and outlet temperatures of the FGD are 90 and 50 °C, respectively. The exhaust gas temperature discharged to the stack is 102 °C, and the thermal efficiency of the boiler system is 89%.
Table 2.
Main operating conditions of the target plant at boiler maximum continuous rating (BMCR) load conditions.
Figure 2 presents the material flows and components of the target power plant, consisting of the boiler system and post-gas flow system. In the boiler system, there is a series of heat exchangers, including a once-through evaporator (EVA) in the furnace, an economizer (ECO), three superheaters (SH), and two reheaters (RH). The post-gas flow system is composed of the SCR, rotary type APH, GGH_C, electrostatic precipitator (EP), FGD, and a tube-type GGH_R. The flue gas generated by combustion in the furnace is discharged from the boiler after transferring heat to the heat exchangers. In the target boiler, the convective heat exchanger section has a 2-pass gas flow. The discharged flue gas flow from the boiler flows into the post-gas flow system. Nitrogen oxides in the flue gas are removed by the SCR and the flue gas transfers its heat to the air in the APH. The flue gas is then cooled to conform to the optimum operating temperature of the FGD in the GGH cooler. The cooled flue gas flows into the EP and FGD, where dust and sulfur dioxide are removed, respectively. Finally, to disperse the flue gas from the stack to the atmosphere, the flue gas is reheated in the GGH reheater and is discharged to the stack.
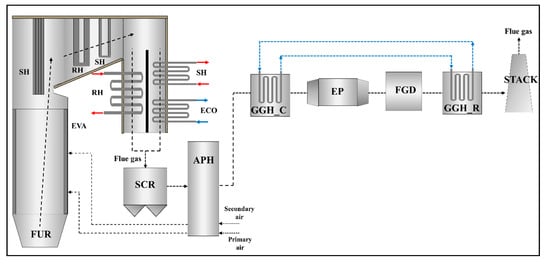
Figure 2.
Schematic configuration of components and material flows in the target supercritical coal-fired power plant system (plant capacity: 870 MWe).
2.2. A Lumped Parameter Model for a Power Plant Heat Exchanger Block
Figure 3 presents a model description of a lumped parameter model for a heat exchanger block. The heat exchanger block model is divided into the hot side of the flue gas and the cold side of the water-steam or air, where each side is connected via heat transfer. In each material side of a heat exchanger block, we define the flow rate, pressure, temperature, and properties, such as the density, specific heat, thermal conductivity, and viscosity. The heat transfer rate between the hot and cold sides is closely related to these flow properties for each material side. Therefore, to obtain the flow parameters, such as the mass flow rate, temperature, and pressure, we must solve the mass, momentum, and energy balances by considering the heat transfer interaction between the hot and cold sides.
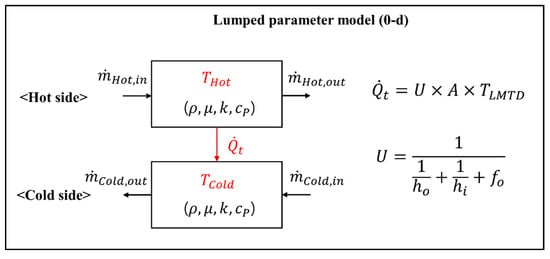
Figure 3.
Model outline of the lumped parameter model for a heat exchanger block.
The mass, momentum, and energy balances, as well as the heat transfer equation, in this model, are as follows. The mass balance of the gas or airside is calculated as follows:
where is the generated (subscript k: CO2, H2O, and SO2) and consumed (subscript k: O2) amount of flue gas of each gas species in the furnace or the mass transfer rate due to leaks from the air into the flue gas side of the APH. The energy equation of the flue gas or airside is as follows:
In the energy balance, we consider the inflow and outflow of the heat, the combustion heat rate (), and the heat transfer rate (). Here, the specific heat () is assumed based on the linear equation for temperature.
The mass balance (Equation (3)), momentum (Equation (4)), and energy balances (Equation (5)) of the water-steam side are as follows:
where Ffric (=) is the pressure drop due to friction and f is the friction coefficient, which is calculated via the correlation. In this model, we apply the correlation for the friction coefficient, which is suitable for supercritical pressure [27].
The heat transfer rate between the hot and cold sides is calculated using the following equation:
where A is the heat transfer area and TLMTD is the logarithmic temperature difference between the hot and cold sides. The conduction resistance of the tube is neglected in this model. Here, U is the overall heat transfer coefficient (HTC), calculated as follows:
where ho is the outer HTC from the flue gas side to the wall side, hi is the inner HTC from the wall side to the steam side, and fo is a fouling factor, which generally represents a decrease in the heat transfer rate due to fouling, but was used here as a tuning parameter to match the HTC of the design data in the model. The outer HTC includes radiation and convective heat transfer mechanisms. In the furnace, the radiation heat transfer is dominant and is calculated using Hottel’s equation [28]. In the convective heat exchanger section, including the ECO, SH, RH, and GGH, the radiative heat transfer equation for the flame gas [29] and the convective heat transfer equation for the tube bank [30] were applied to calculate the outer HTC. The inner HTC was determined by separating the supercritical pressure and subcritical pressure. In this model, the Dittus–Bolter equation [30] was applied at subcritical pressure. At supercritical pressure, we used the Swenson equation [31], which is an improved form of the Dittus–Bolter equation that accounts for a rapid change in the water-steam properties at the pseudo point of the supercritical pressure.
There is a correlation for the HTC of a rotary APH, but there are limitations on the information concerning the geometry of the APH for the calculation of the HTC using the correlation with a physical meaning. Table 3 summarizes the design HTC of the APH for the target plant according to the flue gas flow rate. As listed in Table 3, the HTC of the rotary APH has a linear relationship with the flue gas flow rate. Therefore, in this model, the HTC of the rotary APH is calculated using the fitting equation based on the flue gas flow rate as follows:
where the unit of a is s/kg W/m2/°C and that of b W/m2/°C.
Table 3.
Design values of heat transfer coefficient (HTC) for the air preheater (APH) according to the boiler load.
Table 4 summarizes these heat transfer mechanisms and related references. To solve the mass, energy balances, and heat transfer rate, we applied these mechanism calculation models. The properties of the flue gas were calculated using the Refprop code [32] developed by the National Institute of Standards and Technology, and the properties of water-steam from supercritical pressure to subcritical pressure were calculated using a calculation model [33], which is based on the correlations of the IAPWS-IF97 [34].
Table 4.
Calculation methods for the heat transfer mechanism and properties.
2.3. Modeling Methodology for the New Process
Figure 4 shows the flow diagram of the flue gas and water in the heat exchange system, including the GGHs. The main purpose of the GGH is to match the required temperature of the cooled gas of the GGH_C and the heated gas of the GGH_R. To control the flue gas temperature of each GGH, the water inlet conditions are controlled according to the flue gas flow conditions for each load. During the operation of the GGH, as the water circulates through the GGH_C and GGH_R, the outlet conditions of one should be nearly identical to the inlet conditions of the other for efficient and stable operation. However, when the required amount of heat in the GGH_C and GGH_R vary because of changes in the operating conditions, the inlet flow rate of the water must be controlled via the flow valve while the inlet temperature must be increased and decreased via the heater. Therefore, based on the process simulation, we must derive new operating conditions for each load to conform to the required flue gas temperature of the GGH_C and GGH_R in the new process. The model will allow us to suggest the degree of the flow control of the valve and the required heat duty of the heater.
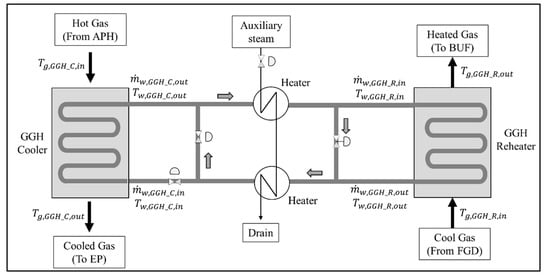
Figure 4.
Schematic configuration for flue gas and water flow in a general gas–gas heater, cooler, and reheater.
As shown in Figure 1, as the mass and heat flows of the flue gas, water, and air, in the post gas flow model, are mutually connected by heat transfer, the process simulation must be performed by considering these heat transfer interactions. The new heat transfer area of the GGHs should be determined to match the increase in the GGH capacity required in the new process. To obtain the operating conditions for the new process, the mass and heat balances of the APH 1, APH 2, GGH_C, and GGH_R were calculated, which are presented in Appendix B. The main assumptions of these calculations are described as follows.
- (1)
- The energy balances for the APH 1, APH 2, GGH_C, and GGH_R were calculated in the post-gas flow system model. The exit temperature of the FGD has a constant value based on the design data of 50 °C for all load conditions.
- (2)
- The newly added APH 2 has the identical heat transfer area as the existing APH 1 and uses the suggested fitting equation for the HTC. The air leak rate from the design data was used for APH 1 and APH 2, and is listed in Table A2.
- (3)
- The exit temperature of the flue gas in the GGH_C should be near 90 °C, which is the optimum operating temperature in the FGD. The flue gas temperature at the exit of the GGH_R should range from 150 to 200 °C, which is the optimum operating temperature of the low-temperature SCR.
- (4)
- To minimize the use of the heat medium heater in the GGH, the operating conditions of the waterside of the GGH ensure the minimization of the temperature difference in the circulating water through the GGH_C and GGH_R. The water temperature of the GGH should be maintained below the saturation temperature at the working pressure to prevent steam generation.
- (5)
- The heat transfer area in the GGH for the new process was calculated using the required heat duty, TLMTD, and HTC values from the existing design data.
Based on the assumptions above, Figure 5 shows the derivation of the GGH operating conditions for the new process. The calculation process for the GGH_C to obtain the new operating conditions is as follows. We set Tg,GGH_C,in to the calculated exit temperature of the APH 1. Then, Tw,GGH_C,in and were initialized to calculate the energy balance of the GGH_C. The calculations of the HTC and energy balances of the flue gas and water in the GGH_C were iterated until they satisfied the convergence conditions shown in Figure 5. The variables () of the convergence condition were the exit temperature of the flue gas and water. When the convergence condition of the energy balance for the GGH_C was satisfied, Tg,GGH_C,out and Tw,GGH_C,out were obtained. The above calculation process was repeated while adjusting Tw,GGH_C,in and until Tg,GGH_C,out was approximately 90 °C. Once the required flue gas temperature of the GGH_C was satisfied, the calculation of the GGH_R was performed to obtain the new operating conditions for the GGH_R. Here, Tg,GGH_R,in was entered as the FGD outlet temperature of 50 °C, such that Tw,GGH_R,in receives Tw,GGH_C,out, which was obtained from the calculation of the GGH_C. In the calculation of the GGH_R, was initialized. The calculations of the HTC and energy balances of the flue gas and water in the GGH_R were iterated until they satisfied the convergence condition shown in Figure 5. When the convergence condition of the energy balance of the GGH_R was satisfied, both Tg,GGH_R,out and Tw,GGH_R,out were obtained. The above calculation process was repeated while adjusting until Tg,GGH_R,out was in the range of 150 to 200 °C and Tw,GGH_R,out was near Tw,GGH_C,in, which is the adjusted value of the calculated GGH_C. These calculation processes were performed for each load. Finally, the new operating conditions were derived through these calculation processes. Therefore, we can determine the degree of the valve flow control and the required heat duty for the heater in the GGH.
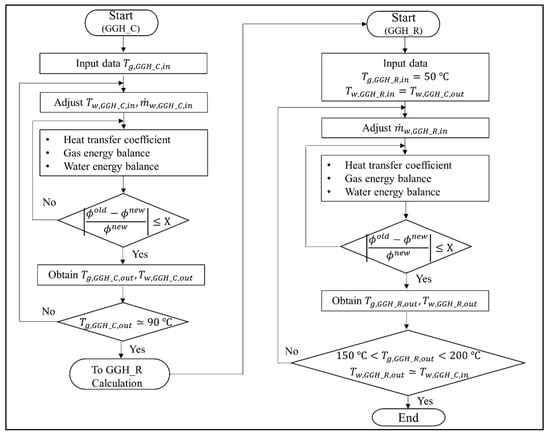
Figure 5.
Calculation process to derive the operating conditions for the gas–gas heater (GGH) cooler and reheater in the new process.
2.4. Process Analysis Model for the Existing and New Processes for the Target Power Plant
The target plant was divided into the boiler system model and the post gas flow model, where the heat exchanger block models of each component in the target thermal power plant were developed based on the lumped parameter model described in the previous section. Figure 6 shows the model outline of the target power plant system, with the developed heat exchanger blocks. In the boiler system model, there are six lumped models for the flue gas flow (i.e., FUR(Furnace), RH2, SH3, RH1, SH1, and ECO) and eight lumped models for the water-steam flow (i.e., ECO, EVA, SH, SH1, SH2, SH3, RH1, and RH2). In the post gas flow model, there are nine lumped models for the flue gas flow (i.e., SCR, APH 1, GGH_C, EP, FGD, GGH_R, Low temp. SCR, APH 2, and Stack), four lumped models for the airflow (i.e., APH 1_PA (Primary Air) and APH 1_SA (Secondary Air), APH 2_PA, and APH 2_SA), and two lumped models for the water flow (i.e., GGH_C and GGH_R). These heat exchanger blocks are integrated with the mass and heat flows. As shown in Figure 6, each model is connected by the material flow while the flue gas side and water-steam side are integrated with heat transfer rates of . In the post gas flow model, the flue gas side is integrated into the airside with heat transfers of while the waterside is integrated with . The simulation input conditions for this integrated model are the inlet conditions of the fuel, air, feedwater, and reheat steam. With these input conditions, this model calculates the flue gas flow rate; flue gas composition; overall heat transfer coefficient; heat transfer rate; water-steam pressure; and temperatures of the flue gas, air, and water-steam. Appendix A presents descriptions of the calculation process for the integrated model.
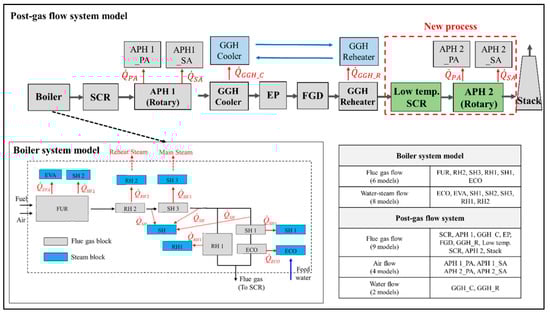
Figure 6.
Process simulation model outline of previous and new processes in the target power plant (including post-gas flow and boiler system models).
3. Process Simulation Results and Discussion
3.1. Validation of the Model for the Existing Process
To evaluate the existing process in the target plant under various operating conditions, we conducted the performance simulation using five load conditions, i.e., the BMCR (Boiler Maximum Continuous Rating), TMCR (Turbine Maximum Continuous Rating), 75% TMCR, 50% TMCR, and 30% TMCR. We compare the calculation results with the design data to verify the model. For each load condition, Table A1 summarizes the simulation input conditions. The simulation input conditions of the post-gas flow model are the air leak rate of the rotary type APH, the inlet conditions of the primary and secondary air in the APH, and the inlet conditions of the water in the GGH_C and GGH_R. The water flow rate in the GGH was obtained via the energy balances based on the temperature information from the design data. Table A2 summarizes these simulation input conditions for the post-gas flow model.
Figure 7 represents the simulation results of the existing process based on the input load conditions. The simulation results for the BMCR, 75% TMCR, and 30% TMCR are shown and compared with available design data. The main simulation results are for the flue gas temperature, steam temperature, and heat transfer rate of each heat exchanger component. As shown in Figure 7, the furnace exit temperature for each load is 1293 °C (BMCR), 1208 °C (75% TMCR), and 978 °C (30% TMCR). This shows that the furnace exit temperature decreases with a decrease in the boiler load (a decrease in the fuel supply rate). The flue gas transfers the heat energy to the heat exchanger inside the boiler, such that the flue gas temperatures at the boiler exit are 381 °C (BMCR), 348 °C (75% TMCR), and 382 °C (30% TMCR), which are the simulation input conditions for the flue gas of the post-gas flow model. The feedwater receives heat from the flue gas side, where the main and reheat steam temperatures are 573 and 593 °C (BMCR), 577 and 600 °C (75% TMCR), and 571 and 574 °C (30% TMCR), respectively. Therefore, the total boiler heat duties, including the APH, are 1935, 1438, and 639 MW for each load. As shown in Figure 7, the heat duty of the EVA is the greatest in the boiler system model while the heat duties for the SH2, RH1, and RH2 also have significant values. We consider these heat exchanger blocks as the most important components of performance prediction. The APH is also an important heat exchanger block because its heat duty accounts for approximately 10–12% of the total heat load. When comparing the simulation results with the design data for the verification of this model, a maximum of 5.6% error occurs in the flue gas temperature for the 30% TMCR load. Other calculation points for the flue gas temperature, steam temperature, and heat transfer rate for each load show similar values as the design data. We can therefore confirm the validity of the proposed model.
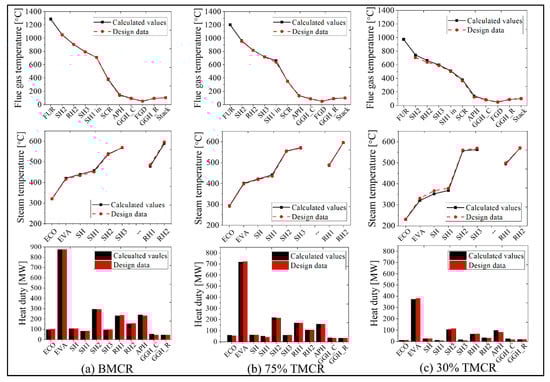
Figure 7.
Representative simulation results (flue gas temperature, steam temperature, and heat duty) for mass and heat balances in the target power plant system, using the load conditions: (a) BMCR, (b) 75% Turbine Maximum Continuous Rating (TMCR), and (c) 30% TMCR (black color indicates calculated values, red color indicates design data).
The simulation results for the GGH_C and GGH_R are as follows. As specified in the design data, the heat transfer surface areas of the existing GGH_C and GGH_R are 68,600 and 44,600 m2, respectively. Figure 8 shows the heat transfer coefficient and the water outlet temperature for the GGH_C and GGH_R at each load point. In the GGH, the convective heat transfer mechanism is dominant because the flue gas temperature is relatively low. As shown in Figure 8a, the heat transfer coefficients are 30–50 W/m2/°C for the GGH_R and 20–35 W/m2/°C for the GGH_C. The gas velocity in the GGH_R is greater than that in the GGH_C. As shown in Figure 8, the water exit temperature of the GGH_R is nearly identical to the design data, but that of the GGH_C has an error of ~5% based on the design value. Despite this minor discrepancy, our model accurately represents the operation of the existing process with good accuracy.
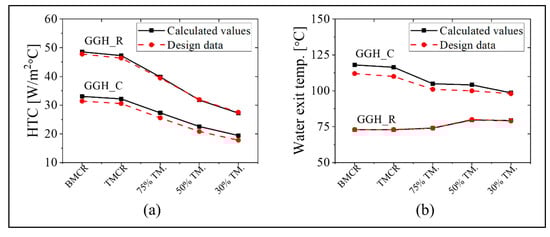
Figure 8.
The (a) HTC and (b) exit temperature of the water in the cooler of the gas–gas heater (GGH_C) and the reheater of the gas–gas heater (GGH_R) using the five load conditions (black color indicates calculated values; red color indicates design data).
3.2. New Process Simulation Results
Based on the proposed new process model and the derivation approach for the new operating conditions, we perform the process simulation at five load conditions (BMCR, TMCR, 75% TMCR, 50% TMCR, and 30% TMCR). We compare the simulation results for the new process with the existing process to evaluate the impact of the low-temperature SCR on the existing process.
The calculation results for the APH 1 and APH 2 in the new process are as follows. Figure 9 and Figure 10 show the exit temperatures of the flue gas and air, the mass flow rate of the flue gas and air, and the oxygen concentration. The calculated exit temperatures of the flue gas are 180–207 °C, which is within the range of 180 to 250 °C, as proposed for the new process concept in Figure 1. Therefore, the heat energy can be assured to conform to the increased heat that is transferred to the water in the GGH_C. The exit temperature of the flue gas in the APH 2 ranges from 60 to 82 °C, which is within the target value range of 60 to 85 °C in the new process. The primary and secondary air flows through the two APHs and enters the furnace at a temperature of 320 to 360 °C, which is similar to the values of the existing process, such that there is no loss in the boiler thermal efficiency. Meanwhile, as shown in Figure 10, since the new process uses two APHs, there is an increase in the amount of air leakage, increasing the flue gas flow rate. This leads to an increase in the oxygen concentration at the exit of the stack.
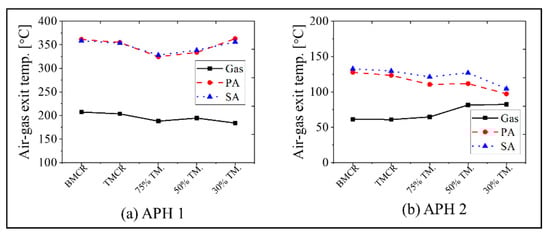
Figure 9.
Simulation results for the flue gas and air temperature at the exit of the APH 1 and APH 2 based on the five load conditions: (a) APH 1 and (b) APH 2.
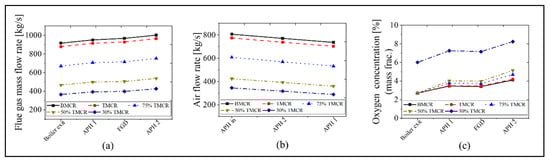
Figure 10.
Mass flow rate of flue gas and air, and the oxygen concentration in the new process based on the five load conditions: (a) flue gas mass flow rate, (b) air flow rate, and (c) oxygen concentration.
The calculation results for the GGH are as follows. As a result of calculating the required heat transfer area based on the increased heat duty of the GGH, the required heat transfer area increased 2.7-fold compared with the existing GGH heat transfer area. The required heat transfer areas for the GGH_C and GGH_R are 185,220 and 120,420 m2, respectively. Table 5 and Table 6 list the representative simulation results for the GGH. The exit temperature of the flue gas in the GGH_C is nearly 90 °C for all load conditions, which satisfies the optimum operating temperature of the FGD. In addition, the exit temperature of the flue gas in the GGH_R is between 150 and 168 °C, also satisfying the target range of 150 to 200 °C. This quantitatively shows the feasibility of the new process. The temperature difference between the inlet and outlet flue gas in each GGH is approximately 110 °C such that the heat duty of the GGH is approximately 120 MW for BMCR and 40 MW for 30% TMCR. The results for the inlet flow rates of the water in the GGH_C and GGH_R are as follows. At the BMCR and TMCR load conditions, the water flow rates in the GGH_C and GGH_R are nearly identical, but below the 75% TMCR, where the water flow rate of the GGH_C is ~20 kg/s more than that of the GGH_R, we must control the flow rate of the circulating water through the valve. It should also be noted that relatively small water flow rates of 130 to 170 kg/s are required for 50% and 30% TMCR load conditions.
Table 5.
New operating conditions for the GGH cooler in the new process based on the load conditions.
Table 6.
New operating conditions for the GGH reheater for the new process based on the load conditions.
Figure 11 shows the HTC as well as inlet and outlet temperatures of the water in the GGH. As shown in Figure 11a, since the temperature of the circulating water is nearly identical, there is a significant decrease in the heat duty of the heater. This can ensure stability during GGH operation. As shown in Figure 11b, the HTC is 20–35 W/m2/°C in the GGH_C and 28–50 W/m2/°C in GGH_R, which are similar values to the existing process. In addition, the TLMTD shows similar values as the existing process.
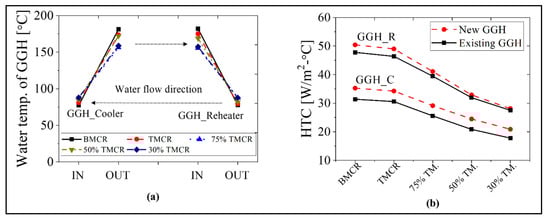
Figure 11.
Water temperature at the inlet and outlet, and the HTC of the GGH for the new process based on the load conditions: (a) water temperature of the GGH and (b) HTC of the GGH.
3.3. Comparison of the Existing and New Process
As the boiler system in the new process is identical to that in the existing process, we compare the simulation results for the post-gas flow systems in this section. We will focus on the simulation results for the maximum BMCR load and minimum 30% TMCR load cases. In Figure 12, we compare the flue gas temperature, heat transfer rate, flue gas flow rate, oxygen concentration, and inlet and outlet temperatures of the water in the GGH for the BMCR load condition. As the heat transfer rate of the APH 1 in the new process decreases by ~25%, the exit temperature of the flue gas in the APH 1 increases by ~60 °C, as compared with the existing process. Due to the increased flue gas temperature, the heat transfer rate to the waterside of the GGH_C increased by ~124%. Therefore, even though the inlet temperature of the flue gas in the GGH_C is high in the new process, the exit temperature of the flue gas remains at 90 °C due to the increase in the heat transfer to the waterside of the GGH_C. The water receives more heat in the GGH_C in the new process, which is then transferred to the flue gas side of the GGH_R. Therefore, the exit temperature of the flue gas in the GGH_R is 172 °C, which is ~80 °C higher than the existing process. This temperature satisfies the operating temperature range for the low-temperature SCR. The discharged flue gas from the GGH_R transfers 70 MW of the heat to the airside of the APH 2. As shown in Figure 12c,d, the exit gas temperature of the stack is ~30 °C lower than the existing process. In the new process, the flue gas flow rate increases by 3.6% while the oxygen concentration increases by 0.7% due to the two rotary type APHs. As shown in Figure 12e, the inlet temperature of the GGH_C is similar to the existing process while the outlet temperature of the GGH_C is ~80 °C higher due to the increased heat transfer. Therefore, the inlet temperature of the GGH_R also increased by 80 °C.
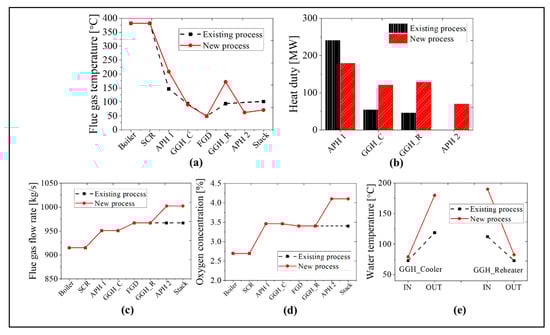
Figure 12.
Comparison results between the existing and new processes at the BMCR load condition: (a) flue gas temperature, (b) heat duty, (c) flue gas flow rate, (d) oxygen concentration, and (e) the water temperature of the GGH.
Figure 13 shows a comparison of the results for the new and existing process at the 30% TMCR load. As the heat transfer rate decreases by ~16% in the APH 1 for the new process, the exit temperature of the flue gas in the APH 1 increases by ~40 °C. Due to the increased temperature of the flue gas, the heat transfer rate of the GGH_C increases by ~60%. Therefore, the inlet temperature of the FGD is ~90 °C in both processes. Like the BMCR load, the flue gas receives 150% more heat in the GGH_R than the existing process due to the increased water temperature. Therefore, the exit temperature of the flue gas in the GGH_R is 151 °C, which satisfies the minimum operating temperature of the low-temperature SCR. The flue gas discharged from the low-temperature SCR transfers 79 MW of heat to the airside of the APH 2, such that the exit gas temperature of the stack is ~14 °C lower than the existing process. As with BMCR, there is an increase in the flue gas flow rate and oxygen concentration. The flow rate of the flue gas increases by ~7.1% and the oxygen concentration increases by 1.0%. As shown in Figure 13e, the inlet temperature of the GGH_C is similar to the existing process while the outlet temperature of the GGH_C is ~60 °C higher. Therefore, the inlet water temperature of the GGH_R increased by 60 °C.
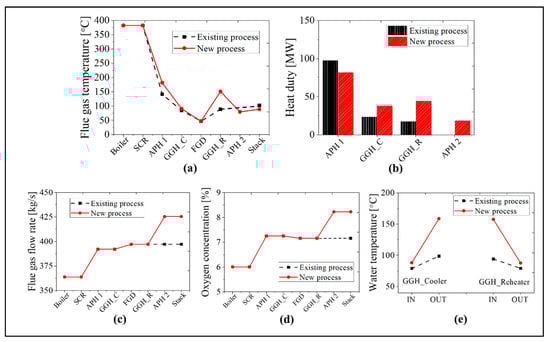
Figure 13.
A comparison of the results for the existing and new processes at 30% TMCR load condition: (a) flue gas temperature, (b) heat duty, (c) flue gas flow rate, (d) oxygen concentration, and (e) the water temperature of the GGH.
In the new process, the exit temperature of the flue gas in the stack decreased by 30 °C at the BMCR and 14 °C at the 30% TMCR due to heat recovery in the additional APH 2. Therefore, as there is a reduction in the heat loss of the flue gas discharged to the stack, with a corresponding increase in the thermal efficiency of the boiler. Figure 14 presents the boiler thermal efficiency of the existing and new processes as a function of boiler load. The boiler thermal efficiency is calculated using the bottom ash heat loss, unmeasured heat loss, radiation of the convective heat loss, and the sensible heat of the discharged flue gas from the stack. The thermal efficiency increases by 1.3% at the BMCR and 0.4% at the 30% TMCR. Therefore, this plant can save 5.1 tons of coal per hour under the BMCR load condition. At the same time reducing its NOx emissions by 10 ppm, because of the addition of the low temperature SCR.
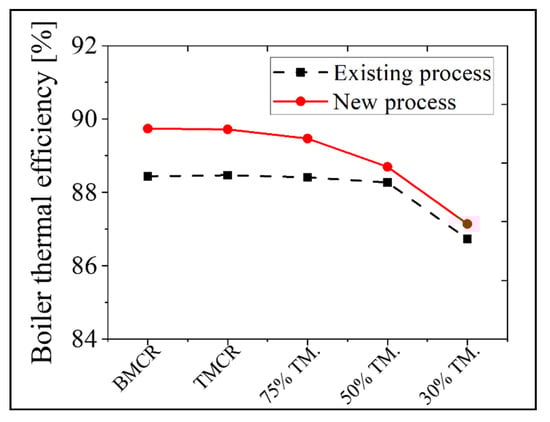
Figure 14.
A comparison of the results for the thermal efficiency of the boiler in the existing and new processes based on the load conditions.
4. Conclusions
In this study, we presented the concept of a new thermal power plant process with the addition of low-temperature SCR. This process can be used to achieve the reinforced standards of NOx emissions and solve problems related to existing post-gas cleaning processes. To achieve stable and efficient operation of the new process, we proposed a method for deriving new operating conditions and performed a process simulation of the new process. The performance model was developed by integrating a number of heat exchanger blocks, in which a lumped parameter model is applied and the mass and heat balances are solved by considering the heat transfer interaction between the hot and cold sides. A process analysis of the new and existing processes was performed to evaluate the various operating conditions under five load conditions. A comparison of the calculated results with the design data for the existing process yielded a range of error of up to 5.6%, confirming the validity of the model. To conform to the optimum operating temperatures of the FGD and low-temperature SCR in the new process, we proposed a method to derive the new operating conditions for the GGH, followed by an evaluation of the flow rate and inlet temperature of the water in the GGH. We verified the feasibility of the new process by obtaining a temperature of 90 °C at the FGD inlet and 150–200 °C at the low-temperature SCR inlet, within the optimal operating parameters for both units. The proposed operating conditions for the water in the GGH exhibited negligible differences in the flow rate and temperature of the circulating water through the GGH_C and GGH_R, representing the stability of the GGH operation. We presented the flow rate, oxygen concentration, and temperatures of the primary and secondary air in the APH 1 and APH 2 for the new process. The inlet temperature of the air as it passes into the furnace for each load was calculated at 320–360 °C, which is in the range of the air temperature used for the existing process, representing the feasibility of heat distribution between the two APHs in the new process. The boiler thermal efficiency increased by 1.3% with the new process, and there was a decrease in the gas temperature discharged to the stack by up to 30 °C due to additional heat recovery from the flue gas in the APH 2. Based on this process analysis, we derived the optimal operating conditions for various boiler loads. Based on our evaluation, the new process is viable with increased thermal efficiency, decreased NOx emissions, and relatively minor additional equipment. This study proves that a coal-fired power plant can contribute to electricity production while also achieving good environmental outcomes and improved economic efficiency.
Author Contributions
S.K.: Term, Conceptualization, Methodology, Software, Validation, Formal analysis, Writing-Original draft, Data Curation; T.C.: Investigation, Writing-Original draft, Investigation, Visualization; Y.L.: Conceptualization, Writing—Review & Editing, Supervision; W.Y.: Conceptualization, Writing—Review & Editing, Supervision; S.H.: Resources, Project administration, Funding acquisition. All authors have read and agreed to the published version of the manuscript.
Funding
This research was funded by the Korea Institute of Energy Technology Evaluation and Planning (KETEP) grant number [20193410100050].
Acknowledgments
This work was supported by the Korea Institute of Energy Technology Evaluation and Planning (KETEP) grant funded by the Korean government (MOTIE) (20193410100050, development of new process for low temperature denitrification from coal combustion exhaust gas treatment).
Conflicts of Interest
The authors declare no conflict of interest.
Nomenclature
| Heat transfer surface area [m2] | |
| Specific heat [kJ/kg/°C] | |
| Pressure drop [MPa] | |
| Friction coefficient [-] | |
| Fouling factor [-] | |
| Gravity [m/s2] | |
| Enthalpy [kJ/kg] | |
| Outer heat transfer coefficient [kW/m2/°C] | |
| Inner heat transfer coefficient [kW/m2/°C] | |
| Thermal conductivity [kW/m-°C] | |
| Tube length [m] | |
| Mass flow rate [kg/s] | |
| Pressure [MPa] | |
| Heat transfer rate [kW] | |
| Temperature [°C] | |
| Overall heat transfer coefficient [kW/m2/°C] | |
| Velocity [m/s] | |
| Greek | |
| Viscosity [N∙s/m2] | |
| Density [kg/m3] | |
| Subscript | |
| g | Gas side |
| i | In |
| k | Gas species (CO2, N2, O2, H2O, and SO2) |
| o | Out |
| w | Water side |
| ws | Water-steam side |
| Abbreviation | |
| APH | Air preheater |
| BMCR | Boiler maximum continuous rating |
| BUF | Booster up fan |
| EAR | Excess air ratio |
| ECO | Economizer |
| EP | Electrostatic precipitator |
| FGD | Flue gas desulfurization |
| FUR | Furnace |
| FW | Feedwater |
| GGH_C | Gas–gas heater cooler |
| GGH_R | Gas–gas heater reheater |
| LMTD | Logarithmic mean temperature difference |
| HTC | Heat transfer coefficient |
| NR | Normal rating |
| PA | Primary air |
| RH | Reheater |
| SA | Secondary air |
| SCR | Selective catalyst reduction |
| SNCR | Selective non-catalyst reduction |
| SH | Superheater |
| TMCR | Turbine maximum continuous rating |
Appendix A. Calculation Process and Simulation Input Conditions
This model consists of a boiler system model and a post-gas flow system model. First, the heat exchanger block models of the flue gas side and water-steam side of the boiler system model were evaluated. The RH2, SH3, RH1, SH1, and ECO block models of the flue gas side were calculated in order such that the calculation result of each block was the input value of the next block. When the calculation of the flue gas side was complete, the ECO, EVA, SH, SH1, SH2, SH3, and RH1 block models of the water-steam side were calculated. As the flue gas side was connected to the water-steam side in terms of heat transfer, the heat exchanger models for the flue gas and water steam sides were frequently calculated until the exit temperature of each heat exchanger block satisfied the convergence condition, as shown in Figure A1. Once the calculation of the boiler system model was complete, the post-gas flow system model was evaluated. In the post-gas flow model, the heat exchanger blocks of the flue gas, air, and water were calculated. The SCR, APH, GGH_C, EP, FDG, and GGH_R block models were determined for the flue gas while the APH_PA and APH_SA block models were calculated for air, followed by the calculation of the GGH_C and GGH_R for the water block. Similar to the boiler system model, as the flue gas, air, and watersides were connected via heat transfer, the above calculations were repeated until the temperature of each block model satisfied the convergence condition, as shown in Figure A1. The right side of Figure A1 shows the balance calculation process of each heat exchanger block model. First, the properties, such as the density, viscosity, specific heat, and thermal conductivity, were calculated based on the temperature and pressure, while the heat transfer coefficient was calculated via the correlation based on the calculated properties. Subsequently, the mass, momentum, and energy balances were calculated, which was repeated until the exit temperature satisfied the convergence condition shown in Figure A1.

Figure A1.
Calculation process for the entire process simulation model including each heat exchanger block model.
Figure A1.
Calculation process for the entire process simulation model including each heat exchanger block model.

The input conditions for the simulation of the boiler system model were the fuel flow rate, excess air ratio, and inlet conditions of the feedwater and reheat steam (the mass flow rate, pressure, and temperature). Table A1. lists these input conditions for the five load conditions. In the target system, the boiler was operated at a subcritical pressure under the 50% TMCR load.
Table A1.
Input conditions for the boiler system based on the five load conditions.
Table A1.
Input conditions for the boiler system based on the five load conditions.
| Operating Conditions | BMCR | TMCR | 75% TMCR | 50% TMCR | 30% TMCR |
|---|---|---|---|---|---|
| Fuel [kg/s] | 97.93 | 93.87 | 71.53 | 49.80 | 32.54 |
| EAR | 1.15 | 1.15 | 1.15 | 1.15 | 1.4 |
| FW (Feed Water) mass flow [kg/s] | 710.5 | 674.2 | 488.8 | 320.2 | 201.5 |
| FW Temperature [] | 294 | 290 | 269 | 245 | 220 |
| FW Pressure [MPa] | 28.89 | 28.36 | 22.35 | 10.35 | 9.15 |
| RH mass flow [kg/s] | 604 | 574.6 | 428.2 | 287.7 | 184.4 |
| RH Temperature [] | 326 | 321 | 319 | 327 | 331 |
| RH Pressure [MPa] | 4.76 | 4.53 | 3.35 | 2.21 | 1.36 |
The simulation input conditions for the post-gas flow system model were the air leak rate of the APH, the inlet temperature and mass flow rate of the primary and secondary air, and the inlet temperature of the water in the GGH_C and GGH_R. Table A2 lists these input conditions for the five load conditions in the existing process.
Table A2.
Input conditions for the APH and GGH based on the five load conditions in the existing process.
Table A2.
Input conditions for the APH and GGH based on the five load conditions in the existing process.
| Operating Conditions. | BMCR | TMCR | 75% TMCR | 50% TMCR | 30% TMCR | |
|---|---|---|---|---|---|---|
| Air leakage rate of APH [%] | 3.9 | 4.1 | 5.5 | 6.9 | 7.8 | |
| Air inlet Temperature [°C] | PA | 50 | 50 | 50 | 49 | 51 |
| SA | 45 | 44 | 43 | 51 | 43 | |
| Air flow rate [kg/s] | PA | 162 | 160 | 145 | 111 | 82 |
| SA | 645 | 614 | 461 | 313 | 263 | |
| Water inlet Temperature [°C] | GGH_C | 73 | 73 | 74 | 80 | 79 |
| GGH_R | 112 | 110 | 101 | 100 | 94 | |
| Water flow rate [kg/s] | GGH_C | 282 | 280 | 282 | 289 | 202 |
| GGH_R | 279 | 277 | 279 | 286 | 219 | |
Appendix B. Governing Equations for the New Process in the Post-Gas Treatment System
In the post-gas flow system model, we solved the energy balances for the APH 1, GGH_C, GGH_R, and APH 2. Figure A2 shows the material flows of the flue gas, air, and water in the post-gas flow system. The flow properties of each material were determined by connecting each flow via heat transfer. The energy balances of each material flow in each component are as follows.
- APH 1 energy balance
- GGH_C energy balance
- GGH_R energy balance
- APH 2 energy balance

Figure A2.
Material flows of the flue gas, air, and water of the APH 1, GGH_C, GGH_R, and APH 2 in the post-gas flow system.
Figure A2.
Material flows of the flue gas, air, and water of the APH 1, GGH_C, GGH_R, and APH 2 in the post-gas flow system.

References
- Dolanc, G.; StrmcÏnik, S.; PetrovcÏic, J. NOX selective catalytic reduction control based on simple models. J. Process Control 2001, 11, 35–51. [Google Scholar] [CrossRef]
- Price, D.; Birnbaum, R.; Mccullouh, M.; Smith, R. Nitrogen Oxides: Impacts on Public Health and the Environment; EPA-452/R-97-002 (NTIS PB98-104631, August); Environmental Protection Agency: Washington, DC, USA, 1997. [Google Scholar]
- Boningari, T.; Smirniotis, P.G. Impact of nitrogen oxides on the environment and human health: Mn-based materials for the NOx abatement. Curr. Opin. Chem. Eng. 2016, 13, 133–141. [Google Scholar] [CrossRef]
- Xu, Y.; Zhang, Y.; Wang, J.; Yuan, J. Application of CFD in the optimal design of a SCR–DeNOx system for a 300 MW coal-fired power plant. Comput. Chem. Eng. 2013, 49, 50–60. [Google Scholar] [CrossRef]
- Lietti, L.; Nova, I.; Camurri, S.; Tronconi, E.; Forzatti, P. Dynamics of the SCR-DeNOx reaction by the transient-response method. AIChE J. 1997, 43, 2559–2570. [Google Scholar] [CrossRef]
- Sloss, L.L.; Hjalamasson, A.K.; Soud, H.N.; Campbell, L.M.; Stome, D.K.; Shareef, G.S.; Emnel, T.; Maibodi, M.; Livengood, C.D.; Markussen, J. Nitrogen Oxides Technology Fact Book; Noyes Data Corporation: Park Ridge, NJ, USA, 1992. [Google Scholar]
- Niu, Y.; Zhang, X.; Zhang, H.; Liang, Y.; Li, S.; Yao, Q.; Wang, D. Performance of Low-temperature SCR of NO with NH3 over MnOx/Ti-based catalysts. Can. J. Chem. Eng. 2019, 97, 1407–1417. [Google Scholar] [CrossRef]
- Park, T.; Jeong, S.; Hong, S.; Hong, S. Selective catalytic reduction of nitrogen oxides with NH3 over natural manganese ore at low temperature. Ind. Eng. Chem. Res. 2001, 40, 4491–4495. [Google Scholar] [CrossRef]
- IEA Clean Coal Centre. Emission Standards. Available online: https://www.iea-coal.org/library/emission-standards/ (accessed on 22 October 2020).
- Improving Emission Regulation for Coal-fired Power Plants in ASEAN, ERIA Research Project Report. Available online: https://www.eria.org/RPR_FY2016_02.pdf (accessed on 22 October 2020).
- Gao, F.; Tang, X.; Yi, H.; Zhao, S.; Li, C.; Li, J.; Shi, Y.; Meng, X. A review on selective catalytic reduction of NOx by NH3 over Mn–based catalysts at low temperatures: Catalysts, mechanisms, kinetics and DFT calculations. Catalysts 2017, 7, 199. [Google Scholar] [CrossRef]
- Wang, W.; Du, X.; Liu, S.; Yang, G.; Chen, Y.; Zhang, L.; Tu, X. Understanding the deposition and reaction mechanism of ammonium bisulfate on a vanadia SCR catalyst: A combined DFT and experimental study. Appl. Catal. B Environ. 2020, 260, 118168. [Google Scholar] [CrossRef]
- Thirupath, B.; Smirniotis, P.G. Nickel-doped Mn/TiO2 as an efficient catalyst for the low-temperature SCR of NO with NH3: Catalytic evaluation and characterizations. J. Catal. 2012, 288, 74–83. [Google Scholar] [CrossRef]
- Deng, S.; Meng, T.; Xu, B.; Gao, F.; Ding, Y.; Yu, L.; Fan, Y. Advanced MnOx/TiO2 catalyst with preferentially exposed anatase {001} facet for low-temperature SCR of NO. ACS Catal. 2016, 6, 5807–5815. [Google Scholar] [CrossRef]
- Kim, Y.J.; Kwon, H.J.; Nam I-SChoung, J.W.; Kil, J.K.; Kim, H.-J.; Cha, M.-S.; Yeo, G.K. High deNOx performance of Mn/TiO2 catalyst by NH3. Catal. Today 2010, 151, 244–250. [Google Scholar] [CrossRef]
- Gao, X.; Du, X.; Cui, L.; Fu, Y.; Luo, Z.; Cen, K. A Ce–Cu–Ti oxide catalyst for the selective catalytic reduction of NO with NH3. Catal. Commun. 2010, 12, 255–258. [Google Scholar] [CrossRef]
- Ali, S.; Chen, L.; Li, Z.; Zhang, T.; Li, R.; Bakhtiar, S.u.H.; Leng, X.; Yuan, F.; Niu, X.; Zhu, Y. Cux-Nb1.1-x (x = 0.45, 0.35, 0.25, 0.15) bimetal oxides catalysts for the low temperature selective catalytic reduction of NO with NH3. Appl. Catal. B Environ. 2018, 236, 25–35. [Google Scholar] [CrossRef]
- Yang, G.; Ran, J.; Du, X.; Wang, X.; Chen, Y.; Zhang, L. Different copper species as active sites for NH3-SCR reaction over Cu-SAPO-34 catalyst and reaction pathways: A periodic DFT study. Microporous Mesoporous Mater. 2018, 266, 223–231. [Google Scholar] [CrossRef]
- Jangjou, Y.; Wang, D.; Kumar, A.; Li, J.; Epling, W.S. SO2 poisoning of the NH3-SCR reaction over Cu-SAPO-34: Effect of ammonium sulfate versus other S-containing species. ACS Catal. 2016, 6, 6612–6622. [Google Scholar] [CrossRef]
- Wang, A.; Arora, P.; Bernin, D.; Kumar, A.; Kamasamudram, K.; Olsson, L. Investigation of the robust hydrothermal stability of Cu/LTA for NH3-SCR reaction. Appl. Catal. B Environ. 2019, 246, 242–253. [Google Scholar] [CrossRef]
- Kim, Y.; Lee, J.; Min, K.; Hong, S.; Nam, I.; Cho, B. Hydrothermal stability of Cu-SSZ13 for reducing NOx by NH3. J. Catal. 2014, 311, 447–457. [Google Scholar] [CrossRef]
- Ryu, T.; Kim, H.; Hong, S. Nature of active sites in Cu-LTA NH3-SCR catalysts: A comparative study with Cu-SSZ-13. Appl. Catal. B Environ. 2019, 245, 513–521. [Google Scholar] [CrossRef]
- Zhang, S.; Zhang, B.; Liu, B.; Sun, S. A review of Mn-containing oxide catalysts for low temperature selective catalytic reduction of NOx with NH3: Reaction mechanism and catalyst deactivation. RSC Adv. 2017, 7, 26226–26242. [Google Scholar] [CrossRef]
- Krishnan, A.; Boehman, A. Selective catalytic reduction of nitric oxide with ammonia at low temperatures. Appl. Catal. B 2017, 18, 189–198. [Google Scholar] [CrossRef]
- Damma, D.; Ettireddy, P.R.; Reddy, B.M.; Smirniotis, P.G. A review of low temperature NH3-SCR for Removal of NOx. Catalysts 2019, 9, 349. [Google Scholar] [CrossRef]
- Kim, T.; Choi, S.; Kim, J. Performance prediction of a large-scale circulating fluidized bed boiler by heat exchangers block simulation. Proc. Inst. Mech. Eng. Part A J. Power Energy 2015, 229, 298–308. [Google Scholar] [CrossRef]
- Pioro, I.L.; Duffey, R.B.; Dumouchel, T.J. Hydraulic resistance of fluids flowing in channels at supercritical pressures (survey). Nucl. Eng. Des. 2004, 231, 187–197. [Google Scholar] [CrossRef]
- Hottel, H.C. Radiation from Carbon Dioxide, Water Vapor and Soot; American Flame Committee: California, USA, 1985. [Google Scholar]
- Kakac, S. Boilers, Evaporators, and Condensers; Chap. 6; John Wiley & Sons, Inc.: Hoboken, NJ, USA, 1991. [Google Scholar]
- Incropera, F.P.; Dewitt, D.P.; Bergman, T.L.; Lavine, A.S. Fundamentals of Heat and Mass Transfer; Wiley: New York, NY, USA, 2008. [Google Scholar]
- Sallevelt, J.L.H.P.; Withag, J.A.M.; Bramer, E.A.; Brilman, D.W.F.; Brem, G. One-dimensional model for heat transfer to a supercritical water flow in tube. J. Supercrit. Fluids 2012, 68, 1–12. [Google Scholar] [CrossRef]
- NIST. Reference Fluid Thermodynamic and Transport Properties Database (REFPROP): Version 10. Available online: https://www.nist.gov/srd/refprop (accessed on 22 October 2020).
- Kim, S.; Choi, S. Practical suggestion for calculating supercritical water-steam properties. Trans. Korean Soc. Mech. Eng. B 2016, 40, 809–814. (In Korean) [Google Scholar] [CrossRef]
- Wagner, W.; Kretzschmar, H.J. Release on the IAPWS (The International Association for the Properties of Water-Steam Properties). In Industrial Formulation 1997 for the Thermodynamic Properties of Water and Steam; IAPWS Meeting: Erlangen, Germany, 1997. [Google Scholar]


Publisher’s Note: MDPI stays neutral with regard to jurisdictional claims in published maps and institutional affiliations. |
© 2020 by the authors. Licensee MDPI, Basel, Switzerland. This article is an open access article distributed under the terms and conditions of the Creative Commons Attribution (CC BY) license (http://creativecommons.org/licenses/by/4.0/).