Abstract
This paper surveys cross-border oil and gas mergers and acquisitions (M&A) transactions in recent years using a large sample of 18,179 transactions announced over the period 2000–2018. M&A activities depend on economic fundamentals, but also on sector specifics and this particularly holds true for the oil and gas industry. Therefore, we have added sector specific to the standard economic explanations of mergers and acquisitions by accounting for institutions, resources, and politics. Indeed, our outputs show that industry-specific factors seem much more important in motivating M&A in the oil and gas industry than the familiar and researched economic conditions. In particular, the pattern of cross-border M&A is almost unrelated to opportunities offered by the resource base in different countries while political, institutional, and legal constraints shape the directions of cross-border M&A. The research covers the recent trends in the oil and gas M&A transactions, strengthens the understanding of various dynamics and sheds light on the potential future directions of the M&A market in the oil and gas industry.
1. Introduction
The oil and gas industry provides more than half of the world’s primary energy needs, Reddy and Xie and Bos et al. [1,2]. Crude oil and natural gas are among the most traded commodities (In 2017, the volume of world crude oil exports was about USD 844 billion, and the export of natural gas reached USD 432 billion after a strong increase over the past decades. (International Trade Center, 2018)) [1,3,4]. Improvements in exploration and production activities during recent years, in particular of the United States (the U.S.), in hydraulic fracturing, horizontal drilling, drilling fluids and other techniques, shale oil and gas exploration and production have changed the industry substantially, Reddy and Xie and Hsu et al. [1,5]; Recent growth in supply (reaching 95 million barrels per day in 2018, BP plc (2019)) is mainly driven by high-cost producers, especially in the U.S. and Canada, while demand growth mainly comes from emerging economies, as a result of their rising prosperity. Natural gas production reached 3309 million tons of oil equivalents in 2018. The strong growth is broad-based—increases in low-cost supplies to react to increasing supplies of liquefied natural gas (LNG) [3].
Overall, this growth in oil and gas supply also enhances the investments in the industry. Particularly, inorganic growth strategies such as mergers and acquisitions are commonly applied corporate investments by the oil and gas companies.
Although the industry receives more than its fair share of attention from the media and represents a significant share of the global mergers and acquisitions (M&A) market (according to Thomson Reuters (2018), the oil and gas industry is in the top ten industries in terms of M&A deals and it has the highest total transaction value, which reached more than USD 4 trillion in 2017), researchers have paid much less attention to oil and gas investments such as M&A transactions, Hsu et al. [5]. To the best of our knowledge, academic reviews of M&A studies in oil and gas industries are rare. Therefore, our motivation is to offer a better understanding of cross-border oil and gas M&A drawing on economic theories and sector specifics. Since the world’s resources and reserves are unequally allocated and firms need advanced technologies, cross-border M&A play an important role to gain access to resources, increase market share, boost profitability, foster corporate growth or to acquire certain capabilities, e.g., advanced technology and know-how. That means it is expected that M&A will remain as one of the key investment strategies of oil and gas companies.
Cross-border M&A transactions are challenging, Shimizu et al. [6], and often fail due to involving two or more countries and the different cultural, economic, political, institutional, and regulatory environments. Specific for the oil and gas industry is that the choice of the target firm and target country must depend above all on the availability of resources and much less on other conditions, favorable or unfavorable, regulatory uncertainty, risk of nationalization and other kinds of financial, political, and institutional uncertainties.
To date, research focusing on the oil and gas industry and cross-border M&A mostly concentrates on the U.S., the UK, Canada, China, Norway, or Gulf countries (Gulf Cooperation Council: Bahrain, Oman, Kuwait, Qatar, Saudi Arabia, and United Arab Emirates, (http://www.gcc-sg.org/en-us/AboutGCC/MemberStates/Pages/Home.aspx)) and Organization of the Petroleum Exporting Countries (OPEC) (for OPEC countries: (https://www.opec.org/opec_web/en/about_us/25.htm)). Most of the earlier studies analyze the relationship between energy prices, volatility of oil prices and M&A activity, the relationship between stock performance and announcement of M&A deals or a review of the oil and gas industry in a specific country, e.g., in Kazakhstan, Kaiser and Pulsipher [7] but not directly cross-border oil and gas M&A investments, e.g., see, [2,8,9,10]. Therefore, a comprehensive investigation of this topic is lacking.
This study is based on global oil and gas M&A data covering transactions from 2000 to 2018 and in this respect complementary to the study of Reddy and Xie [1]. First, our analysis is based on a more granular data set. Second, we review the M&A literature and various motives of oil and gas M&A transactions to trigger certain trends. The paper makes several contributions: (i) it provides statistics for various patterns of the M&A transactions during the last two decades; (ii) it discusses the underlying motives of oil and gas M&A transactions; (iii) it addresses the relationship between industry-specific events, trends, other factors and cross-border M&A flows. Our findings have implications for practitioners and policy makers. A major finding is that oil and gas M&A are less driven by the availability of resources and other economic opportunities (taxes, low costs of extraction, etc.) instead by institutional, political, and sector-specific considerations. In other words, the oil and gas industry differs substantially from other industries. Although we cannot address the dramatic effect of the current crisis due to an almost world-wide temporary economic lockdown due to the COVID-19 virus and we conjecture that this will have an effect beyond the relatively brief economic interruption, many of our observations should apply to a post-coronavirus world oil and gas market.
The paper proceeds as follows. The next section briefly presents the literature review. Section 3 and Section 4 follows with a discussion on M&A investment in the oil and gas industry along various noteworthy arguments. Section 5 presents the data and methodology to collect and integrate M&A transactions from the database. We then provide results based on analysis of M&A transactions in Section 6. The last section concludes and provides policy implications and recommendations for future studies.
2. Literature Review
The literature on mergers and acquisitions that focuses on a specific sector, particularly focusing on the oil and gas industry, is fragmented, and has not thrived yet. This is perhaps due to the complexity of the industry and the fact that there are various theories and a set of theoretical models that can explain the underlying motivation and drivers of such investments from different aspects.
In our attempt to explain oil and gas M&A and its various patterns and underlying motivation, we decide to cover a review on foreign direct investment (FDI), M&A and other multinational enterprises (MNEs) studies in general and recent research on M&A in the extracting, energy and oil and gas industry.
Considering that it is difficult to distinguish multiple motives of such investments, particularly for cross-border investments that have a multinational context, analysis of cross-border M&A might present divergent outcomes. According to Kang and Johansson [11], the driving forces and trends of cross-border M&A across various sectors may differ. Their empirical research based on cross-border M&A in the pharmaceuticals, petroleum, steel, automobiles, and telecommunications sectors show that the drivers are mostly government related, macro-level, firm-level, technology-driven and industry-level factors. However, the significant impact of those factors also depends on the trends in sectors and other specific issues. Therefore, a sector-specific study of M&A is crucial and needed for future direction.
In the previous literature, Shimizu et al. [6] conducted a research to examine the theoretical foundations of M&A, particularly for cross-border M&A. Their research was based on prior studies that grouped the cross-border M&A investment strategy into three perspectives: M&A as a mode of entry to a foreign country/market, M&A as a strategic value-adding investment, M&A as a dynamic learning process. These perspectives summarize that cross-border M&A are commonly applied to enter new geographies and are an opportunity to share cost and risk in the foreign markets. The factors such as local experience, cultural similarities, technological intensity, due diligence process, target home country characteristics, integration process, taxation, currency fluctuation all have an impact on the transactions. Moreover, those factors direct the decision of M&A, number of deals and the patterns of cross-border M&A flows from one country to another.
To explain the underlying incentives, patterns and drivers, theories such as transaction cost economics (TCE), resource-based view (RBV), property rights, agency theories, institutional economics and organizational learning are commonly applied. Our review frames the most related ones and promotes a new link for the better understanding of oil and gas cross-border M&A. Our summary of the key findings of the M&A literature are summarized in Table 1.

Table 1.
Summary of the literature review. Source: authors’ research/interpretation.
Hence, these papers show some common results, but there are also various and inconclusive findings. Overall, the motivation of M&A can be explained by the incompleteness of contracts, transaction costs, corporate governance, internalization. On the other hand, sector-specific events, trends, resources, macroeconomic uncertainties, and institutional environment also have a strong impact. Although, it provides an important outcome, there is a need for more theoretical and empirical development, particularly for a sector-specific approach, where the recent research has not kept pace with the increasing number of transactions. In the light of previous literature, we aim to cover a sector-specific discussion through M&A in the oil and gas industry and potential drivers of the deals from various theoretical perspectives.
3. M&A in the Oil and Gas Industry
The oil and gas industry operates in three main segments (IHS Markit [20]): upstream (exploration and production), midstream (transportation and pipelines) and downstream (refining and marketing) (according to IHS Markit/Connect (2019), the integrated oil and gas, and oil field services and equipment are also presented as another sub-segment of the industry). Although each segment plays an important role in the supply chain, the upstream industry is the essential one. It encompasses exploring and producing oil and gas, recovering reserves, drilling wells. New technologies have caused booms in exploration and production activities during the recent years (yet this year, 2020, seems to be vastly different due to the COVID-19 epidemy). Figure 1 and Figure 2 show the most recent distribution of transactions (from our sample dating back to 2000) by different industry segments and deal levels (such as asset and corporate) (asset deals generally include straight acquisition of (or farming-into) assets (e.g., acquisition of a complete or partial interest in an oil and gas field) from a parent company, acquisitions from parent companies of subsidiaries or regional affiliated entities that hold ownership in assets, and may include the acquisition of minor corporate entities that only hold ownership in a single significant asset (https://connect.ihs.com/home). As an important distinction, different than the asset deals, the corporate deals are classified as the mega-size M&A transactions, which have a deal value above USD 10 billion and are mostly mergers (determined by IHS Markit)).
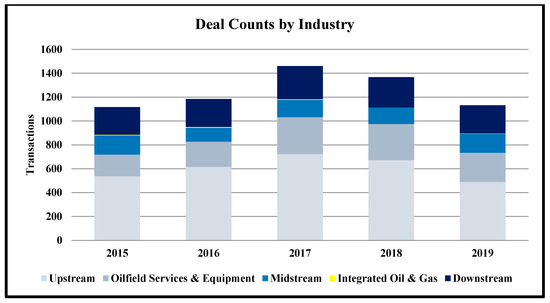
Figure 1.
Mergers and acquisitions (M&A) trends by industry segment in recent years. Source: IHS Markit Transaction Analysis, 2019, authors’ interpretation.
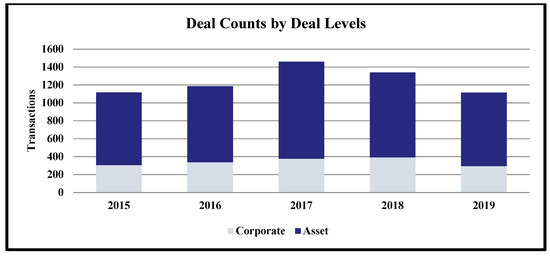
Figure 2.
M&A trends by deal levels in recent years. Source: IHS Markit Transaction Analysis, 2019, authors’ interpretation.
Among the major triggers of M&A in the oil and gas industry are reserve replacement, the pursuit of cost efficiency, pressure by investors, difficult and challenging market conditions during the last few years, e.g., oil price volatility, considerations of acquisitions to supplement growth and the emergence of adjustments to portfolio investment cycles, according to IHS Markit Transaction Analysis [20]. Increasing transactions in the upstream sector fosters alliances, strategic partnerships, and integrations all to support production and to enlarge the global reserve base of an acquiring company.
4. Reasons for M&A in Oil and Gas Facilities
What explains cross-country M&A in the oil and gas industry? This requires a benchmark. For instance, the alternative to buying an upstream firm is to enter a delivery contract, long or medium term. This applies if the acquirer owns a refinery or it is the part of another upstream company whose only interest is to use the extracted oil for products. Of course, there are economic constraints on such contracts, even in a very liquid and huge market such as the world oil market. By the law of no arbitrage, the contract prices are linked to the spot, more precisely, futures prices. That is, any discount associated with long-term contracts must be more or less zero, because otherwise we could sign a long-term contract and resell on the spot market and make a profit while the producers would leave money on the table. This is not likely except for special favors that some give to their associates (e.g., Venezuela to Cuba and other “friends”) (even if fixed price contracts existed, they will face ex-post opportunism if prices get far beyond the contracted level, e.g., due to a shortage crisis. In such a situation, the supplier may ask for extra remuneration to compensate for “losses” from the contract (see opposite example about consumers below). The supplier may pretend that there are technical problems, transport bottlenecks, etc. to extort extra payments. The energy market is littered with corresponding examples, e.g., Algeria’s demand for extra payments (“exploration fees”) for its gas sales to Europe during the high energy prices in the first half of the 1980s, while Norway stuck to its contract. Of course, Algeria had to pay a price for this ex-post opportunism by losing its European customers except for France. In this respect, owning a field (completely or partially as a part of a joint venture) seems more promising). A possible advantage of a long-term contract with strategic suppliers is that it is easier to get marginal barrels, or to cancel them.
4.1. Economic Reasons
It is one of the puzzling features of neoclassical economics that the crucial role of the firm and the entrepreneur (except for the role of the hero and revolutionary in Schumpeter’s theory of creative destruction [21]) is reduced to that of a production function. That is, the boundaries of a firm, what should be organized within a firm and what should be bought from the market, are not determined. Ronald Coase [22] was the first to address what seems to be an obvious question, which was nevertheless ignored for a long time, at least in the traditional textbooks. Oliver Williamson [23], who, the same as Coase, received the Nobel Prize for his insight, suggested that transaction costs are crucial. Buying from/selling to the market can be costly due to the potentially opportunistic behavior of contract partners given the unavoidable incompleteness of contracts. Therefore, the integration of activities with high transaction costs can be efficient even if an in-house provision is more costly. However, the acquisition of crude oil by a refiner seems to involve little or no transaction costs given the nature of oil as commodity. A third approach stresses the role of the entrepreneur, more precisely, the role of property rights, for which Oliver Hart received the Nobel Prize. What is a property right? A property right allows the owner to decide about all issues that are not specified in contracts, Hart [24]. That is, in a world with incomplete contracts (same assumption as in the transaction cost theory), the owner can fill these holes according to his own needs. In the case of “acquiring” an oil field with say average production of 100,000 b/d compared to a contract for the delivery of 100,000 b/d is that the control over the oil field allows the extraction of extra barrels in case of tight supply or even shortages or, vice versa, to lower output in case of a glut, or to be able to extract when contracts are not honored due to an embargo, political turmoil (i.e., similar to an inventory, but below ground). A crucial implication of the theory of property rights is that (i) integration makes only sense for substantial synergies since exploiting synergies often destroys incentives on the other side and (ii) whether the party that has to make the crucial investment decisions should own the property.
4.2. Industry Specific
What does one acquire with an upstream investment or any M&A investment in the oil and gas industry? This depends to a large account on the specific conditions of the target country. In the U.S. and in a few other countries, the “owner” can have the oil whenever they want and can use it for whatever they want, of course paying all the taxes and royalties. In many other countries, the owners are restricted to a certain, often rather limited, take from each barrel extracted and do not have full control over production. Given the differences across countries, their regulatory regime, and the political risks, it makes a big difference between acquiring an oil field with the same potential of cumulative production, e.g., of say one million barrels, in Texas or Alberta or in Nigeria or Libya where the revenue is restricted to a fixed and rather small share or to you can keep only a fraction of the extracted oil and may face restrictions on the quantities produced. This suggests that country specifics such as the regime of taxing oil production, the economic, regulatory, and political environment all play a crucial role, and M&A investment is not only dependent on resource availability and costs of extraction.
As mentioned, the gain from acquiring an upstream facility must be compared with a benchmark, either acquisition on the spot market or via long term contracts. Regarding the first point, being able to swing production according to specific needs and circumstances, an inventory coupled with forwards and futures contracts should be able to achieve this too. The second case of being able to extract and have access to oil in case of serious political troubles depends on where the oil is located. More precisely, owning an oil field in Saudi Arabia (if that were possible) will provide little insurance in times of serious political turmoil (e.g., in the above examples, a revolution in Saudi Arabia, or Russia using its energy supply as a political weapon). Only fields in secure locations (e.g., where? in the U.S.?) can provide this kind of insurance while a proper portfolio of owning/controlling fields and contracts can mitigate such political threats. However, as the recent financial crisis and to a lesser extent the past energy crisis documented, apparently uncorrelated events may become correlated.
The potential benefits depend on the details. For example, a long-term contract linked to market prices—either following the netback scheme of the late 1980s or at spot or even future prices—will not provide a hedge against oil price volatility. In contrast, a fixed price contract would ensure the buyers against oil price increases and the sellers against declines. However, we are not aware that any fixed oil price contracts exist, let alone a significant number, and even if they existed, they would face upside and downside risks due to ex-post opportunism and political intervention (fixed heating oil price contracts with residential consumers reveals two things. First, the downside risk, since these consumers locked themselves into fixed price heating oil contracts offered by Standard Oil during the period of high oil prices in 2008. By the nature of the contract, these customers would lose money as oil prices have declined. Yet given the public pressure (“poor” consumers are suffering), Standard Oil “generously” decided to deliver oil from now on (i.e., since May 2009) at the market price. This verifies the limited range of private monopolies well expressed by Adelman [25] some time ago—that any expropriation of consumers creates powerful pressure groups, which demand short work of them). If spot prices got far beyond the contracted level, e.g., due to a shortage or a crisis, the supplier may ask for extra remuneration to compensate for “losses” from the contract (see opposite example about consumers).
Portfolio considerations and, as a means of hedging supply uncertainties, economic, but in particular, political risks are the other considerations of oil companies, parallel to their national interest, e.g., for a national oil company with a broader mandate such as guaranteeing a reliable supply. First, one must have an idea about what kind of risk: a physical shortfall (e.g., accident or terror attacks as on Abqaiq and Khurais in Saudi Arabia on 14 September 2019, etc.) or another conflict in the Middle East (between Israel and Arabs, a revolution, another Arab Spring), or unanticipated high future oil prices (after all who dared to predict an oil price of USD 140 billion during 2008 or even during 2007).
Nevertheless, those arguments for physical, instead of contractual, entitlements are not convincing. Starting with the first point, markets have proven to accommodate temporary supply disruptions including those during the two Iraq wars and other accidents and reported problems such as the aftermath of Katrina were due to upstream/refining capacity shortages. Thinking about political conflicts, contracts are presumably insufficient anyway. Since most, if not all, contracts have a price clause that links the contract to the spot or futures price, in such a way that there is truly little speculative gain from these contracts. Therefore, in the absence of fixed price long term contracts and the limited time frame financial markets (futures, options, derivatives) offer, investment in the physical barrel is the only way to hedge (or speculate) over the long term, because the investor is entitled (with all the caveats of course) to equity oil (varying across countries) and has to pay taxes and royalties from that share.
Therefore, upstream investments can provide a somehow more reliable supply and a financial hedge against higher future prices since the investor owns a share of the output. However, even this entitlement is less certain than it appears on paper. The reason for this is that substantial gains for the contractor will attract domestic politicians and rent seekers to renegotiate the favorable terms (of course, favorable from a pure ex-post perspective). This will apply to long term contracts and to physical investment and related property titles. Examples are the nationalization of the Petrobras gas fields in Bolivia, the forced selling of Shell’s share to Gazprom from the joint operation in Sakhalin, the ousting of BP from the joint venture with TNK (it is one of the largest Russian oil companies, “TNK MEZHREGIONEFT”) in Russia, etc. Furthermore, the amount of financial hedge can be substantially diminished by ex-post negotiations, if, ex post, the terms result in being too favorable to the investor, as the oil companies did in Venezuela in 2008. This principle applies across the board and includes even law-abiding countries such as the UK, whose price caps contracted under a Conservative government were lowered after observing profits and then Labour went further (of course) and introduced ex-post a windfall tax on past profits). Of course, these degrees of possible ex-post exploitation differ. Owning an oil field in Texas will be less risky to this kind of ex-post expropriation than an oil field in Russia, Venezuela, or Libya. On the other hand, a big player such as the China National Offshore Oil Corporation (CNOOC) may have leverage over small developing countries such as Uganda, particularly if the deal is two-sided making the oil-supplying partner dependent on Chinese expertise, for example. Indeed, the case of national oil companies seems to be vindicated by the CNOOC and its broad range of acquisition all over the world. Companies rather than governments undertake this and (smart) governments often even refuse direct involvement since that always includes political extortion. A well-known example is Helmut Schmidt’s (former German chancellor) refusal of an offer from Colonel Ghaddafi, Revolutionary Chairman of the Libyan Arab Republic, after the energy crisis in the mid-seventies, even arguing that this is the business of the oil companies, not the government. However, national oil companies and their governments do not always exercise the noble attitude of Helmut Schmidt, but try or have tried to help their national champions, as was the case with Total and Elf-Aquitaine (major French oil companies which were merged) in France, ENI (which is an Italian multinational oil and gas company headquartered in Rome) in Italy, OMV (OMV Aktiengesellschaft is one of Austria’s largest listed industrial companies) in Austria, CNOOC and others.
4.3. Additional Characteristic of M&A
Acquiring a firm in the oil and gas industry can be also linked to the following factors:
- Horizontal integrations (e.g., upstream–upstream/downstream–downstream) (in addition, M&A transactions between firms that are operating in other segments of the industry, such as midstream or oilfield services and equipment, e.g., midstream–midstream acquisitions or oilfield services and equipment–oilfield services and equipment could be driven by similar factors): according to the property rights theory, this makes only sense if the acquiring firm provides substantial synergy gains, e.g., from its superior knowledge in engineering and maybe marketing (but selling crude oil requires presumably not much of that). The question is how to approximate the technical gain and know-how of the acquiring firm? Is the overtaking firm being part of a more advanced economy (GDP per capita, but this is wrong for countries such as Kuwait, Qatar that have higher per capita incomes than most highly developed countries, and therefore, share of tertiary education).
- Vertical integrations (e.g., downstream–upstream/integrated oil and gas–upstream) (vertical integrations refer to investments between companies that are operating in a different segment of the industry or different sectors, e.g., midstream oil and gas company invest into a firm that operates in the upstream industry): synergies as well as hedging arguments can explain this activity, but if this is the case, then vertically integrated companies must be more profitable than disintegrated ones.
- Full control (say over a Texas oil field) versus no control in many oil producing countries where the “property” title is restricted to a production sharing agreement. The type of the acquirer (e.g., upstream, integrated oil and gas firm, investors) and a firm focusing on either upstream or downstream investments, a firm at least to some extent integrated (i.e., active in upstream and downstream), and a special role for (foreign) national oil companies.
- Facing political reasons, the extraction of natural resources is in many countries, if not most, heavily restricted and limited to national monopolies. This includes many risks from changes in regulations, taxation, up to expropriation. Given the differences across countries and their regulatory regime and the political risk, there is a big difference between acquiring an oil field with a cumulative production, e.g., capacity of say one million barrels, in Texas or Alberta or in Nigeria or Libya.
- Hedging arguments make sense only for downstream–upstream mergers and only if the target company is in a reliable country. In short, if one is willing to pay a premium, or only agrees to the contract if the target company is in a country in which the rule of law applies and economic liberty is guaranteed (corresponding indices exist)—less obvious is the role of democracy and political freedom.
- Finally, CEOs striving for empires provide an explanation for M&A, at least inter alia, if the above economic reasons fail.
5. Data
M&A transactions deal level data are obtained from IHS Markit, Connect. The transaction analysis database contains detailed information about various key indicators of M&A transactions announced between 1 January 2000 and 31 December 2018 (the deals contain the following given key indicators: year, buyer, seller (target), buyer and seller country, deal type, deal style, deal value, industry segment, region, key assets, reserve value and deal summary. Add to that the integration type. Our sample covers more than 23,855 transactions between 2000 and 2018. However, some of the deals have no given information on some of the certain key indicators, which makes them difficult to analyze. Those deals are excluded from the sample). Our final data set contains 18,179 observations including both domestic and cross-border transactions (summary statistics are shown in Table 2 and Table 3). Our selection criteria according to IHS Markit categories is as follows: announced deals with deal types such as “acquisition/joint venture, acquisition, merger, acquisition/farm in” (according to IHS Markit, acquisition joint venture is purchase/sale of partial ownership in assets (such as upstream acreage, upstream producing properties/fields, pipelines, refineries, etc.) and the transaction parties joint venture/joint partner together further develop that transacted asset or set of assets. Acquisition is a purchase/sale of partial or full ownership in assets (such as upstream acreage, recoverable reserves/resources, producing properties/fields, pipelines, refineries, etc.), including purchase of, or from, incorporated subsidiary entities (of a parent company) that holds above assets. Acquisition/farm in is the purchase/sale of an interest in undeveloped acreage/field/project without estimated reserves where the seller retains an interest and the farm in buyer contributes exploratory/development cost funding in return for a specific working interest in the acreage/field project. Merger is for corporate takeover transactions with a total transaction value >=USD 10 billion. It is important to remind that IHS Markit defines the merger transactions differently to traditional definitions of a merger). Different to traditional definitions of merger and acquisition, we add two further deal styles, which are commonly applied methods in the oil and gas industry.
Table 2.
M&A transactions based on total deal counts and average (avg.) deal value in USD million (MM). Source: final data produced based on IHS Markit Transaction Analysis, authors’ interpretation.
Table 3.
Summary statistics of final sample. Source: final data produced based on IHS Markit Transaction Analysis, authors’ interpretation.
The separation between domestic and cross-border transactions are done as follow: if the buyers’ headquarters is in a different country than the target/primary country the deal is a cross-border deal. In other words, deals that happen beyond the buyer country’s border [6,16,26] (according to IHS Markit [20], the primary country, i.e., target country, indicates the location where the buyer purchases or invests in assets, fields, or the entire business. It is common in the oil and gas industry that the assets, resources (e.g., reserves, refinery, petrol stations and similar) are located somewhere different than the firm’s headquarters, (e.g., European integrated oil and gas firm might have a refinery or other assets in Malaysia but the headquarters might be located in Europe). In this case, the headquarter information of sellers can be misleading to define transaction type as domestic versus cross-border. Therefore the primary location, i.e., target country, is a more accurate form of information for our analysis to define the purchased, acquired assets and their geographic location). The deals are defined as domestic if the buyer and target are in the same country and the deal is done within the borders (see Appendix A for the allocation of the sample). M&A deals refer to the number of deals and M&A transaction values were not applied to explain any patterns as they are sensitive to the oil price, and large variations in governments’ take. In addition to that, the transaction value information is missing for 40.3% of the deals of our sample due to the deals not being disclosed.
6. Results
Natural resources, particularly oil and gas, are highly unevenly distributed. Therefore, the interaction between companies and countries is essential. In addition to points discussed in earlier sections, for instance, the different fiscal regimes for oil and gas in each country also impact oil and gas investments, particularly for cross-border investments (Natural Resource Governance Institute [27]). In addition to that, tax rates, contracts, royalties, bonus payments or quality of the field or production volumes, regulatory/legislative structures, environmental and safety concerns, macroeconomic environment and microeconomic factors impact the decisions of oil and gas investors at both the international and domestic level, Beer and Loeprick [28]. Similarly, national oil and gas companies (often monopolies) play a special role and have recently showed an increase in their M&A investments, [29].
6.1. Domestic Deals
Domestic M&A transactions represented 64% during the last two decades, or 11,675 deals with an average deal value of USD 373 MM. Most of them, i.e., more than 90% of all domestic deals (10,561 with an average transaction value of USD 363 MM) occurred in the U.S., Australia, Canada, United Kingdom, Russia, and China, see Figure 3. The first four countries offer good legal protection and infrastructure and are rich in natural resources, but not compared to the big reserve owners, particularly of low-cost oil reserves. Norway, Brazil, Indonesia, India, Nigeria, Argentina, and New Zealand follow as countries with a high number of domestic transactions, but they are in a different league.
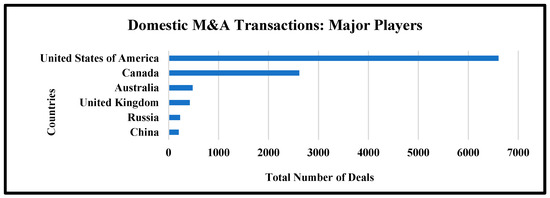
Figure 3.
Countries with a high number of domestic deals, over the period 2000–2018. Source: based on IHS Markit Transaction Analysis, authors’ interpretation.
Most of the domestic deals are upstream (particularly, the major players such as the U.S., Canada, Australia, UK, China, and Russia), see Figure 4, which presents view per sector for major players. The M&A in the U.S., Canada, Australia, and UK are mostly horizontal integrations, particularly between companies active in either upstream or oilfield services and equipment. This points out that the domestic horizontal integrations for those domestic players are either the result of more efficient companies buying less efficient ones or linked to technological changes, e.g., shale oil and gas revolution, exploration and production, horizontal drilling, which requires certain expertise in the field. One may pursue this point further and look for patterns in the deals. In our sample, particularly, horizontal integrations are in the field of unconventional oil and gas activities, production, drilling and wells services. Transactions in Russia and China are driven more by vertical integrations. After years of relative quiet compared to global super majors (e.g., the U.S., Canada), Chinese companies now tend to integrate their supply chain, particularly by acquisitions between companies from different segment of the industry (upstream versus downstream, oilfield services versus upstream), which supports and strength their investments in the domestic petrochemical sector. Similarly, companies in Russia enhance their supply chain by vertical integrations.
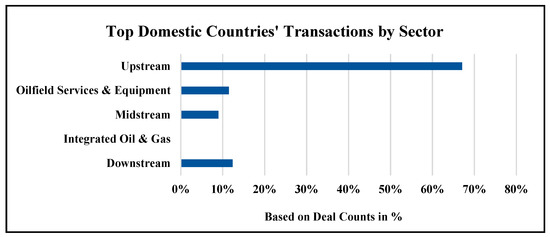
Figure 4.
Domestic deal counts by sectors in top domestic countries (major players). Source: based on IHS Markit Transaction Analysis, authors’ interpretation.
The increase in the U.S. is due to shale oil and gas investments after the development of hydraulic fracture and horizontal drilling techniques and is supported by sector-specific developments and regulations, International Tax Review [30]. After oil and gas companies discover and invest in unconventional oil and gas, the companies, which have not yet entered this new business, started to invest expecting that the asset prices will rise, Hsu et al. [5]. After the discovery and the development of the fields, initial production signals the volume of reserves. This encourages and triggers the M&A investments. First mover companies start to sell their assets, know-how and operational expertise, Hsu et al. [5]. Moreover, existing private property rights and an ideology supportive of private ownership increase pressure on politicians to adopt regulations that encourage drilling. As a result, the U.S. experienced a rapid increase in shale production, Murtazashvili [31].
The U.S. has been the epicenter of M&A investments during recent decades (and over more than a century in drilling) and remains a major player in the oil and gas industry. US firms completed the highest number of domestic deals not only for unconventional, but also for conventional, oil and gas. Moreover, the U.S. has the additional advantages of advanced oil and gas engineering technologies, of ranking among the world’s largest producers along Saudi Arabia and Russia and of a high domestic oil and gas demand [1].
Similarly, there is an increasing trend for acquisitions between small and mid-size operators and large upstream companies in Australia and Canada [20]. In Canada, most transactions are for big natural gas projects. Furthermore, Canadian oil and gas companies, particularly the major oil sand producers, acquire companies holding assets, but suffer from low stock market valuation. At the same time, domestic transactions in oilfield services and equipment increased in Canada [20]. Domestic transactions in Australia are driven both by conventional and unconventional resources. Particularly, investments in coal-bed methane exploration and production, tight oil, shale oil and gas and shallow water are increasing.
China’s domestic transactions can be explained by the concern of the government to increase domestic energy security. This boosts investments in exploration and production and refining activities not only internationally, but also nationally [3]. In addition, China wants to reduce its coal consumption and carbon emissions, which require replacing coal with natural gas or renewable energy. Particularly, China invested in refining, retail, distribution, pipeline projects and increased investment in natural gas and LNG.
In the UK, most of the domestic transactions are driven by shallow water drilling investment in the North Sea, primarily M&A investments in natural gas exploration and production. Mostly, large upstream companies acquired assets/equipment for shallow water drilling from firms with high expertise and operational skills. Russia’s domestic transactions are driven by investment in conventional oil and gas. Companies such as Novotek, Lukoil, Gazprom and Rosneft acquired mostly upstream assets, reserves and producing fields from other small domestic players.
6.2. Cross-Border M&A: Geographical Patterns
Our sample contains 166 targets and 94 acquirer countries between 2000 and 2018 (countries such as Falkland Islands, Faroe Islands, East Timor, Republic of Georgia, and Sahrawi Arab Democratic Republic are excluded due to lack of available data over the period of 2000 to 2018. Moreover, one must also account for the differences on dispersion of the deals for some countries due to country-size, lack of information or access to data). Those deals accounted for 6504 cross-border transactions and the average deal value of USD 352 MM. Figure 5 shows the allocation of the deals in terms of sectors. The cross-border upstream deals are higher than the others based on deal counts.
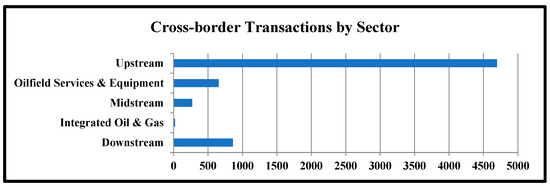
Figure 5.
Cross-border transactions by sectors/segments over the period 2000–2018. Source: based on IHS Markit Transaction Analysis, authors’ interpretation.
The U.S. had 1056 cross-border oil and gas transactions over this period, leading to the average transaction value of USD 312 MM. Figure 6 shows the top target countries of the U.S. based on total number of transactions. Canada is the top target and is the fifth largest for natural gas and sixth largest for crude oil producer with huge proven reserves [3]. Its oil sands and oil and gas reserves can provide secure energy supply and this is with a stable political environment, an advanced technology, and skilled operators (according to Canadian Association of Petroleum Producers (2019), oil sands are a mixture of sand, water, and bitumen (oil that is too heavy or thick to flow on its own). The oil sands are found in three regions within the provinces of Alberta and Saskatchewan. Oil sands are recovered using two main methods: drilling (in situ) and mining. The method used depends on how deep the reserves are deposited). The U.S. oil and gas companies invest in oil and gas assets, mainly in Alberta and Saskatchewan Basins (Alberta has most of the oil and gas reserves and all the oil sands, IHS Markit [20]). Reducing the cost of production is one motivation to invest in Canada. Of course, proximity (not only geographically and here even linguistically) is helpful for any M&A investment, Reddy and Xie [1].
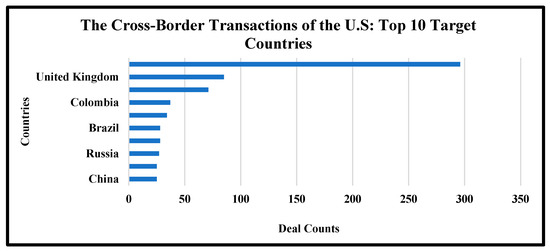
Figure 6.
The U.S. cross-border transactions by target countries over the period 2000–2018. Source: based on IHS Markit Transaction Analysis, authors’ interpretation.
Moreover, the U.S. oil and gas companies make deals at the corporate level (transaction volumes are above USD 10 billion) with companies from Canada and United Kingdom and acquire the entire business of companies in the oilfield services and equipment sector. A high number of M&A flows to UK, Australia and Norway and also to Brazil, Russia, India, China, and South Africa (BRICS), which offer similar investor friendly environments, rich natural resources, a developed oil and gas industry and relatively cheaper assets compared to other developed countries.
Historically, the U.S. companies were not present in China’s oil and gas industry. However, in recent years and following the shale revolution of the U.S. and its lifted oil and gas export ban, companies entered the Chinese market [20]. Another focus of the U.S. oil and gas companies is on Latin American countries such as Argentina and Colombia because their governments support oil and gas transactions with US companies.
Most of the cross-border transactions across different sectors deal with assets (80% of the total deal counts). It highlights opportunistic behavior and attempts to improve long-term relationships with other shareholders by acquiring assets to gain control. This supports Finklestein’s view [32] that M&A is one of the options that a firm uses to reduce its environmental dependencies and uncertainties. Gaining control of assets by acquisitions reduces the unforeseen events and provides flexibility to the owner on decision making.
However, there are mega deals in corporate transactions (e.g., corporate transactions, the total average volume of the deals are USD 620 MM), particularly concerning the U.S. and Canada who hosted a large number of such transactions among the top target countries. Those corporate deals can be explained by the aims of minimizing production costs, increasing market shares and to gain other competitive advantages (e.g., horizontal integrations that increase the value of the company, Reddy and Xie [1], rather than seeking natural resources or capabilities.
The top 20 target countries (see Figure 7) include 8 countries of the Organization for Economic Co-operation and Development (OECD) (https://www.oecd.org/about/), including some of the major players in the oil and gas industry (e.g., the U.S., Canada, United Kingdom, Australia, Norway, Netherland, Italy and New Zealand), three of the BRIC countries (Brazil, Russia and China), one OPEC (Nigeria) member and one former OPEC member (Indonesia), one Caspian region country (Kazakhstan), and developing countries such as Colombia, Argentina, Egypt, Peru, Tunisia and Papua New Guinea.
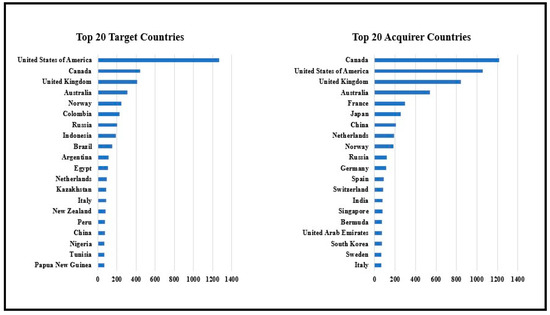
Figure 7.
Top 20 target and acquirer countries based on total deal counts over the period 2000–2018. Source: based on IHS Markit Transaction Analysis, authors’ interpretation.
The top 20 acquirer countries consist of 14 OECD countries (e.g., the U.S., Canada, the UK, Australia, Norway, France, Japan and others as listed), the above three BRIC countries (Russia, India and China), one OPEC member (United Arab Emirates), and less expected countries such as Singapore and Bermuda are also in the list of top acquirers.
Similar to the domestic transactions, the U.S., Canada, Australia, and United Kingdom are also the most active countries in cross-border M&A transactions either as acquirer or target country. Canada has the highest number of transactions as an acquirer and the U.S. has become the top target country and hosts the highest number of M&A transactions.
The case of the U.S. and Canada is special. Canadian and the U.S. firms run the M&A market globally and cultural and geographical closeness adds another trigger. “Distance has been shown in the previous literature as a proxy for the international capital market failures, due to asymmetric information” Coval and Portes [33,34]. Although this seems to explain the situation between U.S. and Canada, the overall picture does not confirm this view.
The most stunning observation is the mismatch between target countries and the availability of the resources, i.e., proven reserves of crude oil and natural gas, and low costs of extraction. More precisely, the countries with truly large reserves and low extraction costs are not among the top target countries. This highlights that political and institutional constraints beat pure economic opportunities in oil and gas M&A transactions and contradicts the theory stressing resource dependence attributes [1]. Our view is supported by the studies of (e.g., [14,15,35]), which found that certain factors that proxy the institutional environment could have a negative impact on the M&A transactions. The reason is that resources are of course a condition sine qua non, but politics and regulation seem to be even more important, which could be the reason why U.S. oil and gas firms do not invest in certain regions and countries.
The top 10 countries in terms of oil and gas reserves are listed in Figure 8, which are followed by countries such as the U.S., Kazakhstan, China, Qatar, Brazil, Algeria, Mexico, Angola, Ecuador and Azerbaijan with rich oil reserves (million in barrels) and Turkmenistan, Ukraine, Indonesia, Mozambique, Uzbekistan or Malaysia, with its rich natural gas reserves (trillion cubic feet), which are in the 10–20 top countries with rich oil and gas reserves. However, most of those countries do not attract a larger number of M&A transactions compared to their reserves, which should be, ceteris paribus, an indication of a high return on investments.
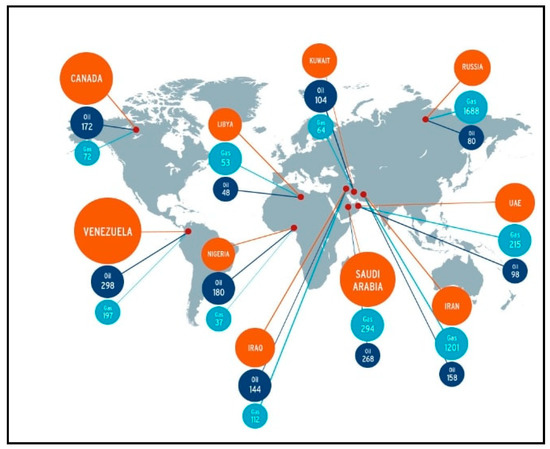
Figure 8.
Oil and gas reserves by countries, using figures from 2015 (oil reserves in billion barrels, gas reserves in trillion cubic feet). Source: U.S. Energy Information Administration (EIA) Statistics, 2019 (www.eia.gov).
The only way to interpret the observed pattern is that institutions, property rights and politics matter much more than resources, potential reserves, and prima facie economic opportunities in a target country. The U.S., UK, Canada, the UK, Norway, Netherlands, Italy, New Zealand and Australia as developed countries have stable politics, advanced technologies, strong property rights and international companies with know-how in the oil and gas industry, which renders them an attractive target in spite of high extraction costs (according to Property Right Alliance [36], The International Property Right Index (IPRI) scores the underlining institutions of a strong property rights regime: the legal and political environment, physical property rights, and intellectual property rights. It is the world’s only index entirely dedicated to the measurement of intellectual and physical property rights. The IPRI has a range of 1 to 10. The higher the index score, the better the property rights regime of the country (https://www.internationalpropertyrightsindex.org)). However, unlike in the U.S. and in a few other countries, companies or individuals cannot extract or sell any natural/mineral commodity in most countries without obtaining rights or licenses from the government. Therefore, a comparison based on property rights and ownership cannot yield a general conclusion (Omorogbe and Oniemola [37]). Countries with large reserves score low in terms of property rights. For instance, according to the Property Rights Alliance, most of those countries have a score below six (1 to 10, where 10 indicates the best property rights), which indicates that countries lack institutions such as legal and political environment, control of corruption, rule of law, judicial independence, protection of physical property rights and similar. Furthermore, the natural resources are in most of the cases controlled by the governments and national oil companies.
The flows between the top acquirer and top target countries show a similar and unexpected outcome. The neoclassical theory implies that capital should flow from capital rich to capital poor countries, Alfaro et al. [38]. However, Lucas [39] explains that factors such as production (i.e., economies of scale), government policies, and institutions may create different outcomes so that institutional quality shapes the capital flows, consequently, impacting investments such as mergers and acquisitions and foreign direct investments. In this context, institutions affect economic performance and influence investment decisions of companies. The pattern of cross-border M&A flows supports Lucas’s paradox because there is no significant capital flow in the oil and gas transactions from rich to poor countries as would be expected.
Canada and the U.S. conclude more than 50% of their M&A transactions between each other. Oil and gas companies from the UK announce most of their M&A transactions in the U.S., Canada, Russia, Norway, and Australia. Australia also invests mostly in other developed countries such as the U.S. and New Zealand. The investments from the top European acquirers (such as France, Netherland, Norway, Germany, Spain, Switzerland, Sweden, and Italy) are mostly in the U.S., Canada, and the UK, with some going to Russia.
Similar to European acquirers, Japan as another top acquirer also has a high amount of transactions in developed countries such as the U.S., UK, Canada and Australia covering more than 50% of the total capital flows of Japan in cross-border oil and gas transactions. On the other hand, China, Russia, India, and Singapore, also among the top acquirer countries, diversified their M&A transactions by investing both in developed countries and emerging and developing countries [1]. Particularly, Russia and Brazil, with their rich natural resources, focused on other developing and developed countries, looking for comparative advantages rather than additional resources.
Colombia, Russia, Indonesia, Brazil, Argentina, Egypt, Kazakhstan receive a noticeable amount of transactions compared to other target countries. Colombia, for instance, mostly receive transactions in the upstream sector (more than 90% of its total transactions). Canada, the U.S. and the UK acquire mostly conventional oil and gas assets in Colombia. European oil and gas companies from France (e.g., Total S.A, Perenco S.A.) and Spain (e.g., Repsol S.A) acquire upstream assets in Colombia. Additionally, Peru and Chile acquire Colombian upstream assets. Colombia became an interesting opportunity for investors in the oil and gas industry over the last few decades, but its neighbor with the world’s largest oil reserves did not, Venezuela, due to its political regime.
Brazil and Argentina are other countries in Latin America that receive most of their investments also from the U.S., Canada, and the UK. Moreover, China acquire oil and gas companies both in Brazil and Argentina. Brazil attracts investments from European countries such as Norway, Netherland, and France. Most of them are vertical integrations, between European integrated oil and gas companies (e.g., Statoil ASA, Total S.A, Vitol Group, Royal Dutch Shell), that invest in the upstream and downstream business in Brazil. Brazil has not been highly active in the M&A market in recent years despite its rich natural resources. Factors such as high capital and labor costs, taxation and problems with its infrastructure deter larger cross-border inflows. Likewise, Argentina’s ongoing economic problems have had a negative impact on foreign investors.
The cross-border investments in Indonesia, most of them from Australia, the UK, Canada and the U.S. but also from neighboring regions (Singapore, China, Japan, South Korea, Thailand and Malaysia), show the increasing importance of South East Asia in the oil and gas industry and the place of Indonesia as a former OPEC country with its rich natural resources.
The cross-border M&A inflows into Russia and China can be explained by their similar economic and institutional opportunities as BRICS and their rich natural resources, [1]. In general, BRIC countries offer comparable conditions for business and government support to foreign investors. Russia, for instance, holds the world’s largest natural gas reserves and significant oil reserves. European oil and gas integrated oil and gas companies invest in oil and gas assets in Russia (including some of the mega deals in cross-border M&A market in recent years).
The M&A in China are more diversified in terms of deals by sectors such as upstream and downstream transactions. International investors have also acquired midstream assets, e.g., pipeline projects in China. Most of the investments come from U.S. oil and gas companies, particularly after the U.S. shale oil and gas revolution. The reason is that China holds unconventional oil and gas production reserves but lacks the expertise for production. Moreover, as China became itself active in M&As in the oil and gas industry over recent years, it has also opened up to foreign investors, because they could bring expertise and technological advancements to the oil and gas sector. Australia, Singapore, the UK, and Netherlands are the other countries that conclude M&A transactions in China.
Although Russia and China are among the top target countries, one must still account that state-ownership can cause lower performance due to lower incentives, stronger organizational power, non-maximizing behavior, the risk of political interventions (which BP learned the hard way twice in Russia), which consequently impact and lower the benefit of M&A strategy, [40].
A few surprising observations are: although Peru and Papua New Guinea have rather little oil and natural gas resources, they became top targets for M&A transactions. Particularly, Peru’s resources are not comparable to Mexico, Brazil, and Venezuela, but Peru has a growing economy and stable politics since the 1990s, E&Y [41]. Canadian oil and gas companies and financial investors have acquired oilfield equipment and services and upstream assets in Peru over the last few decades. Add to those the transactions from Europe, mostly from the UK and Spain and from the same region, Colombia, Uruguay, and Chile. Similarly, Papua New Guinea has not been producing many basins, but active fields for explorations. Australia as a nearby developed country with oil and gas expertise was one of the first acquirers followed by Canada and the U.S. In recent years, with the increasing attempts to increase LNG production, the country has also received transactions from other countries such as France (e.g., Total S.A), Indonesia and Japan [20].
The obvious, puzzling observation is the lack of Middle East and OPEC member countries in our sample, although they control most of the world’s oil reserves (more than two thirds) and the areas of cheap extraction. The reasons are that their governments do not offer foreign investor opportunities and lack reliable political, economic, and legal institutions. Therefore, we find only few transactions in Ecuador, Qatar, Libya, Angola, Algeria, and other member countries.
Most of the transactions are horizontal integrations rather than vertical integrations. Vertical integrations are more concentrated by the top listed European oil and gas companies, which want to increase and balance future oil and gas supplies and to create a hedge against unexpected events (e.g., oil price volatility). In an uncertain environment, the transaction costs of writing and enforcing contracts that specify all obligations under all contingencies are prohibitively costly, Barrare-Rey [42]. In such a context, vertical integrations are preferred by oil and gas companies.
The flows of cross-border M&A transactions differ between acquirer and target countries. This suggests that M&As are not primarily driven by resource opportunities, but by other considerations such as geopolitics, seeking strategic assets, increasing overall efficiency, and even more likely, institutional environments and uncertainties, which play a strong role. Moreover, sectoral challenges, changes and innovations and economic development play an important role in M&A transactions. For instance, meeting the increasing domestic energy demand of China and India requires the acceptance of more risk than in developed countries, and therefore there seems to be a genuine concerned about political risks when choosing a target country.
6.3. Cross-Border M&A: Geopolitical and Economic Events
M&A is one of the strategies for inorganic growth. On the one hand, the motivation and driving facts depend on the elements such as natural resources, capabilities, politics, institutions, and regulations. On the other hand, it depends on financial markets, capital market liquidity, commodity prices and the volatility of oil price, Hsu et al. and Schimizu et al. [5,6]. Particularly, oil price volatility has a strong impact on the value of oil and gas M&A transactions. The volatility of the oil market spills over to other commodity and financial markets, Kang et al. [43]; Bos et al. [2]. Waves in M&A activity are related to this price volatility. For instance, an increase in the oil price will increase the value of the reserves. Therefore, one would expect a positive correlation between the oil price and the value and volume of oil and gas M&A [5]. Figure 9 shows the development of cross-border M&A transactions over the years and the oil price. A positive relation can be observed between the numbers of M&A transactions and the oil price.
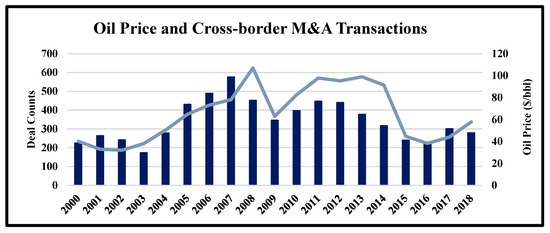
Figure 9.
Relationship between oil price (annual average oil price, West Texas Intermediate (WTI, $/bbl.) (adjusted oil price based on inflation) and M&A transactions. Source: based on macro trends, 2019, authors’ interpretation.
One expects a similar relation with respect to natural gas price and M&A. Figure 10 shows the natural gas prices and the development of M&A transactions (based on deal counts) and it shows a less strong correlation to deal counts compared to the oil price (see Table 4 for the correlation matrix). However, both have a positive correlation with the number of M&A deals. On the other hand, it requires further investigation and empirical evidence.
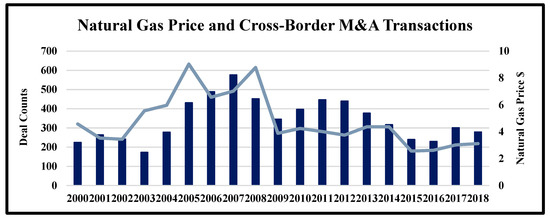
Figure 10.
Relationship between natural gas prices (Henry Hub, $/Btu) and M&A transactions. Source: based on macro trends, 2019, authors’ interpretation.
Table 4.
The correlation matrix (correlation matrix shows the relationship between oil and natural gas prices (based on adjusted inflation prices of annual average WTI, $/bbl. and Henry Hub, $/Btu.) and cross-border M&A deal counts over the period 2000–2018). Source: based on IHS Markit Transaction Analysis, illustrated by authors.
Figure 11 shows the cross-border M&A transactions in terms of number of deals and their average deal value over a period of 2000 to 2018 and it indicates crucial events. One can expect similar patterns between M&A transactions and such events. M&A transactions decreased between 2007 and 2008 parallel to the global financial crisis. Other events such as the U.S. shale increase, and OPEC production cuts also seems to have an impact on the M&A transactions in later years.
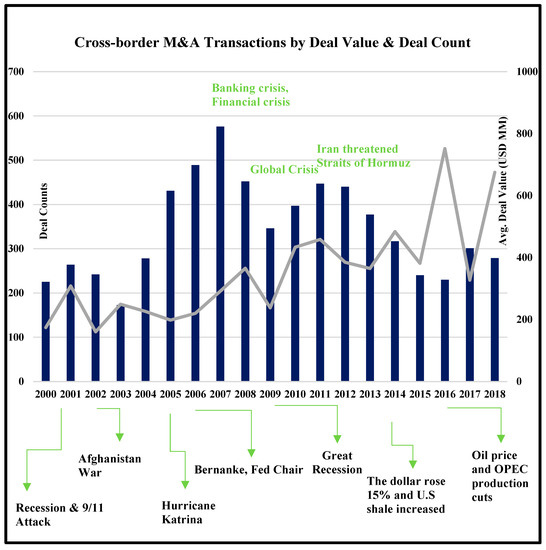
Figure 11.
Geopolitical and economic events over the period 2000–2018. Source: based on IHS Markit Transaction Analysis, BP (British Petroleum Company) Statistics Report, authors’ interpretation.
7. Discussion and Conclusions
While there is extensive research on M&A in general, research on M&A in the oil and gas industry is scarce. However, this is crucial given the specific characteristics of the oil and gas industry. This study has analyzed the oil and gas M&A transactions over the last decades, following the call of Kang and Johansson [11] and Reddy and Xie [1] for sector-specific research of cross-border M&A investments and extending the works of Ng and Donker [10], Hsu et al. [5] and Reddy and Xie [1]. It investigates the motives of cross-border M&A transactions in the oil and gas industry from several perspectives (economic and political), exposes possible drivers of and analyzes patterns of recent oil and gas M&A transactions.
The major finding, based on our large and unique data set, is that instead of standard economic reasons, industry-specific, political, and institutional considerations are more likely to drive M&A transactions. The increased number of transactions between developed countries and the lack of flows to developing countries rich in natural resources show that an acquirer focuses on political, institutional risks and other uncertainties rather than accounting profits when choosing a target. This is highlighted by the many transactions between countries such as Canada, the U.S., the UK and Australia. Additionally, we make note of the increasing power of the U.S. companies in the oil and gas M&A market due to recent innovations and changes, such as increased production, shale oil and gas, and other technological improvements in production. We also show that countries with extensive know-how of the oil and gas industry and resources (e.g., Russia, China, the U.S., the UK and Canada) have focused on increasing their domestic transactions in recent years.
Given the economic and political importance of international M&A activities, our analysis has important implications for policymakers and practitioners. M&A activity in upstream oil and gas depends of course on the availability of resources but much more on less tangible characteristics of a host country, such as the economic and political institutions. Therefore, policymakers can affect the flow of M&A substantially by changing regulatory and fiscal frameworks. Moreover, M&A flows and resource mobilization both in international and domestic levels can impact the future project economics, reduce the risk in higher risk environment and change patterns of asset allocation in the oil and gas industry. However, to change the most important political and legal institutions of a country will be difficult for most policymakers.
Our survey can be the basis for future research. A major implication of our survey is that usual economic indicators for mergers will provide presumably little explanatory power given the institutional and political constraints. Therefore, an analysis of the drivers of M&A investments in the oil and gas industry, in particular upstream, requires an empirical analysis that must go far beyond the collection of the usual (mostly economic) data. It will be interesting to uncover the drivers of M&A transactions in terms of value and volume based on previous literature by adding potential sector-specific factors as we pointed out in this paper. For instance, it is essential to increase the awareness of the risk and uncertainties for investors for many dimensions, not least those caused by climate change mitigation policies (the current COVID-19 pandemic is a classical risk (because pandemics are a recurrent phenomenon as Bill Gates warned a few years ago) while climate change mitigation policies and political events such as reforms and revolutions have a high degree of uncertainty). Since many firms reshape their business strategies according to their expectations of the future oil and gas markets, changing regulation and energy policies will also stimulate M&A activity in the future. One may use certain event studies, how political and institutional changes affected M&A activity, which is also crucial to understand whether the changes in Saudi Arabia’s policy have economic effects.
Author Contributions
This work has been done by both authors. Conceptualization, Ş.Ö.; methodology, Ş.Ö.; validation, Ş.Ö. and F.W.; formal analysis, Ş.Ö.; investigation, Ş.Ö. and F.W.; resources, Ş.Ö.; writing—original draft preparation, Ş.Ö.; writing—review and editing, F.W. and Ş.Ö.; supervision, F.W.; project administration, Ş.Ö. All authors have read and agreed to the published version of the manuscript.
Funding
This research received from Open Access Funding by the University of Vienna.
Acknowledgments
We gratefully acknowledge the collaboration of IHS Markit, Connect represented by Dillon Watts, John Cannon and Manon Carbiener for providing access to the database and their support for the project. Without their help to provide access to the M&A database, this work could not have been completed. OMV are represented by Arno Dettlinger, Johann Roithinger, and their team from Upstream Business Development and we thank them for their support. We thank Raffael Speitmann, WU Vienna, Research Associate, for his critical comments on a previous version of the paper. However, the design of the study, the analyses, the interpretation of data, the writing of the manuscript and any errors remain in the sole responsibility of the authors.
Conflicts of Interest
The authors declare no conflict of interest.
Appendix A

Figure A1.
Domestic M&A transactions by deal level based on deal counts (Figure A1 shows that asset M&A in domestic transactions are more dominant than corporate transactions over the period 2000–2018. It trends the motivation of resource-based acquisitions, acquisition of tangible assets, replacement reserves by oil and gas companies in domestic borders (see Figure A3 for cross-border transactions by deal level)). Source: based on IHS Markit Transaction Analysis, authors’ interpretation.

Figure A2.
Domestic M&A transactions by integration level based on deal counts (Figure A2 represents the distribution of the deal counts based on integration type. It shows that horizontal M&A transactions are higher than the vertical integrations based on deal counts, which trends the increasing acquisitions between oil and gas companies that operate in the same segment of the industry. It signals the firms that are motivated to increase synergies, cost effectiveness, and expand the market control over domestic borders by engaging with acquisition strategy). Source: based on IHS Markit Transaction Analysis, authors’ interpretation.

Figure A3.
Cross-border M&A transactions by deal level based on deal counts. Source: based on IHS Markit Transaction Analysis, authors’ interpretation.

Figure A4.
Cross-border M&A transactions by integration level based on deal counts (Figure A4 shows the trends based on integration type for cross-border oil and gas M&A transactions over the period 2000–2018. Different than the domestic transactions, patterns for horizontal and vertical integrations have similarities. However, the horizontal integrations are still dominant. One of the motivations for cross-border M&A in the oil and gas industry is linked to boundaries of resources. By involving into cross-border transactions via vertical integration, companies might gain certain market intelligence and financial and operational gains). Source: based on IHS Markit Transaction Analysis, authors’ interpretation.
References
- Reddy, K.; Xie, E. Cross-border mergers and acquisitions by oil and gas multinational enterprises: Geography-based view of energy strategy. Renew. Sustain. Energy Rev. 2017, 72, 961–980. [Google Scholar] [CrossRef]
- Bos, M.; Demirer, R.; Gupta, R.; Tiwari, A. Oil returns and volatility: The role of mergers and acquisitions. J. Energy Econ. 2018, 71, 62–69. [Google Scholar] [CrossRef]
- BP. BP Statistical Review of World Energy 2019. 2019. Available online: https://www.bp.com/content/dam/bp/business-sites/en/global/corporate/pdfs/energy-economics/statistical-review/bp-stats-review-2019-full-report.pdf (accessed on 30 March 2019).
- ITC. International Trade Center. 2018. Available online: http://www.intracen.org/ (accessed on 31 December 2019).
- Hsu, K.; Wright, M.; Zhu, Z. What motivates merger and acquisition activities in the upstream oil and gas sectors in the U.S.? J. Energy Econ. 2017, 65, 240–250. [Google Scholar] [CrossRef]
- Shimizu, K.; Hitt, M.; Vaidyanath, D.; Pisano, V. Theoretical foundations of cross-border mergers and acquisitions: A review of current research and recommendations for future. J. Int. Manag. 2004, 10, 307–353. [Google Scholar] [CrossRef]
- Kaiser, M.; Pulsipher, A.G. A review of the oil and gas sector in Kazakhstan. J. Energy Policy 2007, 35, 1300–1314. [Google Scholar] [CrossRef]
- Abdullayeva, N. Value creation through mergers and acquisitions in energy sector. J. Econ. Sci. Theory Pract. 2015, 72, 61–94. [Google Scholar]
- Elheddad, M. What determines FDI inflow to MENA countries? Empirical study on Gulf countries: Sectoral level analysis. Res. Int. Bus. Financ. 2018, 44, 332–339. [Google Scholar] [CrossRef]
- Ng, A.; Donker, H. Purchasing reserves and commodity market timing as takeover motivates in the oil and gas industry. J. Energy Econ. 2013, 37, 167–181. [Google Scholar] [CrossRef]
- Kang, J.; Johansson, S. Cross Border Mergers and Acquisitions: Their role in Industrial Globalization. OECD Science, Technology and Industry Working Papers. 2000. Available online: https://doi.org/10.1787/18151965 (accessed on 20 September 2020).
- Lafontaine, F.; Slade, M. Vertical Integration and Firm boundaries: The Evidence. J. Econ. Lit. 2007, 45, 629–685. [Google Scholar] [CrossRef]
- Kissin, W.; Herrera, J. International Mergers and Acquisitions. J. Bus. Strategy 1990, 11, 51–55. [Google Scholar] [CrossRef]
- Volpin, S.; Rossi, P. Cross-country determinants of mergers and acquisitions. J. Financ. Econ. 2003, 2003, 277–304. [Google Scholar] [CrossRef]
- Martynova, M.; Renneboog, L. Spillovers of corporate governance standards in cross-border mergers and acquisitions. J. Corp. Financ. 2008, 14, 200–223. [Google Scholar] [CrossRef]
- Xie, E.; Reddy, K.S.; Jie, L. Country specific determinants of cross-border mergers and acquisitions: A comprehensive review and future research directions. J. World Bus. 2017, 52, 127–183. [Google Scholar] [CrossRef]
- Berntsen, M.; Boe, K.; Jordal, T.; Molnar, P. Determinants of oil and gas investments on the Norwegian Continental Shelf. J. Energy 2018, 148, 904–914. [Google Scholar] [CrossRef]
- Mohn, K.; Misund, B. Investment and uncertainty in the international oil and gas industry. J. Energy Econ. 2009, 30, 240–248. [Google Scholar] [CrossRef]
- Dowling, M.; Vanwalleghem, D. Gulf Cooperation Council cross-border M&A: Institutional determinants of target nation selection. Int. Bus. Financ. 2018, 46, 471–489. [Google Scholar] [CrossRef]
- IHS. IHS Markit Connect. 2019. Available online: https://connect.ihs.com/home (accessed on 20 December 2019).
- Schumpeter, J.A. The Theory of Economic Development: An Inquiry into Profits, Capital, Credit, Interest, and the Business Cycle. University of Illinois at Urbana-Champaign’s Academy for Entrepreneurial Leadership Historical Research Reference in Entrepreneurship. 1934. Available online: https://ssrn.com/abstract=1496199 (accessed on 20 September 2020).
- Coase, R. The nature of the firm. Economica 1937, 4, 386–405. [Google Scholar] [CrossRef]
- Williamson, O. Transaction Cost Economics: How It Works; Where It is Headed. Economist 1998, 146, 23–58. [Google Scholar] [CrossRef]
- Hart, S.L. A natural-resources based view of the firm. Acad. Manag. Rev. 1995, 4, 986–1014. [Google Scholar] [CrossRef]
- Adelman, M.A. Mineral Depletion, with Special Reference to Petroleum. Rev. Econ. Stat. 1990, 72, 1–10. [Google Scholar] [CrossRef]
- Caiazza, R.; Carbonara, G. Mergers and Acquisitions: Causes and Effects. J. Am. Acad. Bus. Camb. 2009, 14, 188–194. Available online: http://www.scribd.com/doc/14358472/Cause-and-Effect-of-Mergers-Acquisitions (accessed on 20 September 2020).
- Natural Resource Governance Institute. 2019. Available online: https://resourcegovernance.org/ (accessed on 31 December 2019).
- Beer, S.; Loeprick, J. Profit shifting: Drivers of transfer (mis)pricing and the potential of countermeasures. Int. Tax Public Financ. 2015, 22, 426–451. [Google Scholar] [CrossRef]
- Thomson Reuters. Thomsons Reuters Eikon. 2018. Available online: https://www.thomsonreuters.com/en/login.html (accessed on 20 August 2018).
- ITR. International Tax Review [Internet]. 2019. Available online: https://www.internationaltaxreview.com/ (accessed on 31 December 2019).
- Murtazashvili, L. Institutions and the shale boom. J. Inst. Econ. 2017, 13, 189–210. [Google Scholar] [CrossRef]
- Finkelstein, F.; Haleblian, J. Understanding acquisition performance: The role of transfer effects. Organ. Sci. 2002, 13, 36–47. [Google Scholar] [CrossRef]
- Coval, J.; Moskowitz, T. Home Bias at Home: Local Equity Preferences in Domestic Portfolios. J. Financ. 1999, 54, 2045–2073. [Google Scholar] [CrossRef]
- Portes, R.; Rey, H. The determinants of cross-border equity flows. J. Int. Econ. 2002, 65, 269–296. [Google Scholar] [CrossRef]
- Manzon, G.; Sharp, D.; Travlos, N.G. An empirical study of the consequences of U.S. tax rules for international acquisitions by U.S. firms. J. Financ. 1994, 49, 1893–1904. [Google Scholar] [CrossRef]
- PRA. Property Rights Alliance. 2019. Available online: https://www.propertyrightsalliance.org/ (accessed on 31 December 2019).
- Omorogbe, Y.; Oniemola, P. Property Rights in Oil and Gas under Domanial Regimes. In Property and the Law in Energy and Natural Resources; Oxford University Press: Oxford, UK, 2010. [Google Scholar] [CrossRef]
- Alfaro, L.; Kalemli-Ozcan, S.; Volosovych, V. Why doesn’t Capital flow from Rich to Poor Countries? Empir. Investig. 2008, 90, 347–368. [Google Scholar] [CrossRef]
- Lucas, R. Why doesn’t Capital flow from Rich to Poor Countries. Am. Econ. Rev. 1990, 80, 92–96. [Google Scholar]
- Megginson, W.; Netter, J. From state to market: A survey of empirical studies on privatization. J. Econ. Lit. 2001, 39, 321–389. [Google Scholar] [CrossRef]
- E&Y. EY Transaction Advisory Services. 2019. Available online: https://assets.ey.com (accessed on 18 June 2020).
- Barrera-Rey, F. The Effects of Vertical Integration on Oil Company Performance. 1995. Available online: https://www.oxfordenergy.org/publications/the-effects-of-vertical-integration-on-oil-company-performance/ (accessed on 20 September 2020).
- Kang, S.; Mclver, R.; Yoon, S. Modeling time-varying correlations in volatility between BRICS and commodity markets. Emerg. Mark. Financ. Trade 2016, 52, 1698–1723. [Google Scholar] [CrossRef]
Publisher’s Note: MDPI stays neutral with regard to jurisdictional claims in published maps and institutional affiliations. |
© 2020 by the authors. Licensee MDPI, Basel, Switzerland. This article is an open access article distributed under the terms and conditions of the Creative Commons Attribution (CC BY) license (http://creativecommons.org/licenses/by/4.0/).